costs and profitability analysis for bell pepper...
TRANSCRIPT
0 Costs and Profitability Analysis for Bell Pepper Production (Processing), Ventura County, 2012-13
COSTS AND PROFITABILITY ANALYSIS FOR BELL PEPPER PRODUCTION IN THE
OXNARD PLAIN, VENTURA COUNTY, 2012-13 Bell Pepper Production for Processing
Etaferahu Takele, Area Farm Advisor, Agricultural Economics/Farm Management, University of California Cooperative Extension (UCCE) Southern California
Oleg Daugovish, Farm Advisor, Vegetable Crops and Strawberries, UCCE Ventura County Mao Vue, Staff Research Associate, UCCE Southern California

1 Costs and Profitability Analysis Bell Pepper Production (Processing), Ventura County, 2012-13
UNIVERSITY OF CALIFORNIA COOPERATIVE EXTENSION COSTS AND PROFITABILITY ANALYSIS
FOR BELL PEPPER PRODUCTION OXNARD PLAIN, VENTURA COUNTY
Bell Pepper Production for Processing
Based on data collected in 2012/2013
TABLE OF CONTENTS ABSTRACT 1 INTRODUCTION 1 PRODUCTION PRACTICES 1
Land Preparation 1 Stand Establishment 1 - 2 Fertilization 2 Irrigation System and Applications 2 - 3 Pest Management 3 Weed Management 3 Food Safety Program 3 - 4 Conditional Waiver Program 4
HARVESTING, MARKETING, & DISPOSAL OF CROP RESIDUES 5 INTEREST ON OPERATING CAPITAL 5 LABOR 5 EQUIPMENT OPERATING COSTS 5 CASH OVERHEAD COSTS 5 - 6 NON-CASH OVERHEAD COSTS 6 SUMMARY OF PRODUCTION COSTS 6 - 7 PROFITABILITY ANALYSIS 7 REFERENCE 8 TABLES 9 - 15 The authors wish to express their appreciation to those cooperators who provided data and review in the development of this study. To simplify information, trade names of some products have been used in this report. No endorsement of name product is intended, nor did criticism imply of similar products that are not mentioned. Funding for this project was provided in part by the University of California Thelma Hansen Research and Education Fund.

1 Costs and Profitability Analysis for Bell Pepper Production (Processing), Ventura County, 2012-13
ABSTRACT Ventura County has 12.90% of bell pepper production in 2011 and ranks third in California. Production costs and profitability analysis has been the fundamental tool for growers and investors to do investment analyses and make decisions, conducting business transactions, and develop risk management strategies. In this study, we provided up to date benchmark costs and profitability indicators for evaluating the viability and sustainability of producing bell pepper for processing. This study is based on assumptions of bell pepper production practices including fees for regulatory requirements in the county. Data regarding production practices, inputs and prices were collected from cooperating growers, the University of California Cooperative Extension (UCCE) farm advisors, agricultural institutions, and supply and equipment dealers. While this study makes every effort to model bell pepper production based on real world practices, it cannot fully represent financial, agronomic, and market risks, which affect the profitability and economic viability of all producers. We suggest that growers use this model as a guide to estimate costs and evaluate their profitability.
INTRODUCTION Bell Pepper is a top value commodity in Ventura County and in California. In 2011, Ventura County had approximately 2,630 acres, or 12.90% of California’s total bell pepper acreage with crop value of $41.7 million. In addition, bell pepper harvested for processing accounted for approximately 30% of total bell pepper value in California (California Pepper Commission, 2012). The growing period for bell pepper depends on time of transplanting. We based this study on one crop in the Oxnard Plain, Ventura County with approximate growing period from land preparation to harvesting being 6 months. We based the study on a 50-acre bell pepper operation for processing on a 500-acre farm with 1.5 cropping (750 acres farmed per year). This study serves as a guideline for production practices and costs of production and profitability to be used by growers, prospective growers, agriculture lenders, educators and all who are involved or have interest with bell pepper production for processing in Ventura County.
PRODUCTION PRACTICES The discussions in these sections include production practice: inputs, rates, operational frequency, and methods of operation. Input costs, contract fees and service expenses are based on 2012/2013 prices. We present this study on a per acre basis for one crop taking six months from land preparation to harvest. Land Preparation. Land preparation and the type of tillage system used vary between fields and management preferences. In this study, we used traditional tillage which is a typical practice used for vegetable crop production in Ventura County. Traditional tillage incorporates most crop residues and leaves less than 30 percent of the surface covered by residues and uses an average of 15 to 18 land preparation operations (Mitchell, et al., 2009). The sequence and frequency of land preparation operations will vary among growers. In this study, we assumed four discing, two subsoiling, three leveling, and then broadcast fertilizer and chisel plowing once before beds are listed and shaped. Herbicide is sprayed after bed up. Depending on speed and width of implements (disc, subsoiler, roller, landplane, fertilizer spreader, chisel, lister, bed shaper, and boom-sprayer) used for land preparation; equipment field time will vary among growers. Based on the equipment complement we developed from our growers’ interview, we estimate average tillage field time takes approximately 2.23 hours per acre per crop. Stand Establishment. Growers develop transplanting schedule in order to let crops mature at different times for harvest. In this study, we estimated costs based on one acre transplanted once in April to be harvested in August. The commonly grown bell pepper varieties in Ventura County are Bottom up, Moody, Baron, and Excalibur. All varieties have similar cultural, harvesting, and marketing

2 Costs and Profitability Analysis for Bell Pepper Production (Processing), Ventura County, 2012-13
requirements. Transplanting rates vary depending on spacing. In this study, we used an approximate rate of 24,200 transplants per acre on 40” beds with two rows of transplants 12” part, and transplants 12-16” apart within rows. Custom hand transplanting costs about $300 per acre, plants cost about $0.024 each based on bulk purchase price in 2013. Growers also pay the seed costs for the transplant which is about $625 per acre per crop. Fertilization. Bell pepper fertilization in the Oxnard Plain includes approximately 200 pounds of nitrogen (N) per acre for processing. Fertilizer is applied to provide N at about 45 pounds at pre-plant and 155 pounds post-plant. An application of 280 pounds per acre of ammonium phosphate 16-20-0 (45 lbs. of N) is broadcasted once during land preparation. Depending on the speed and width of implement used, field time may vary among growers. Based on the equipment complement in this study, the tractor and fertilizer spreader takes about 20 minutes per acre per crop to broadcast ammonium phosphate. A few days after transplanting, potassium thiosulfate (KTS) at 5 gallons per acre is applied through the irrigation system. The N application is done weekly throughout the growing period beginning two or three days following the KTS to mature the bell peppers for harvest. The N sources include urea ammonium nitrate (UAN32%) at 2.825 gallons (10 lbs. of N) per application per acre is applied through the irrigation system 6 times after transplanting for a total of 16.95 gallons (60 lbs. of N) per acre. Next, calcium ammonium nitrate (CAN17%) at 4.65 gallons (10 lbs. of N) per application per acre is applied through the irrigation system 10 times for a total of 44.19 gallons (95 lbs. of N). Before harvesting, KTS at 10 gallons per acre is applied to help mature bell pepper for harvest. Fertilizer prices may vary between regions and supply companies. In this study, fertilizer prices are based on bulk purchases from local suppliers in Ventura County. Ammonium phosphate 16-20-0 costs about $0.49 per pound, UAN32% costs about $4.50 per gallon, CAN17% costs about $3.80 per gallon, and KTS costs about $4.23 per gallon. Irrigation System. Bell pepper irrigation in Ventura County uses the drip system. The cost of developed wells and permanent irrigation system are part of the land rental. However we assumed that growers purchase drip tapes. The drip tapes cost $320 per acre based on one line on 40” bed centers and can be used for approximately 2 crops. We allocated $160 per acre for one bell pepper crop produced for processing. Drip tapes are installed right after land preparation. We assumed that a single line of drip tape is used per bed and is placed between two rows of plants. Drip tapes are anchored by a farm worker at the beginning of each row, followed by the drip layer implement installing the drip tapes on the surface, and then the worker cut the drip tapes at the end of the rows in order to connect the drip tapes to the water supply line. Machine and manual labor for anchoring, installing, cutting, and connecting the drip tapes are estimated to take about 25-30 minutes per acre (Zhu, Butts, Lam & Blankenship, 2004). In bell pepper production, the drip tapes are removed after harvest. Drip tapes are removed by disconnecting the couplers from the water supply line and then the lifter with winder implement coils the drip tapes onto the spools. Machine and manual labor hours to disconnect, lift and coil drip tapes, and secure and replace-filled spools are estimated at about 30-35 minutes per acre (Zhu, Butts, Lam & Blankenship, 2004). Irrigation Applications. Water cost for irrigation varies in Ventura County and depends on whether district or well water is used. During our data collection, we were told that growers may use well and district water. However, we did not get sufficient information on the number of wells available for use or the depth of the well for pumping calculation. Therefore, we used the price of district water at $170 per acre-foot ($14.17 per acre-inch) to estimate water costs. Water extraction fees from the district and state were also factored into the costs of water.

3 Costs and Profitability Analysis for Bell Pepper Production (Processing), Ventura County, 2012-13
Based on interview data, irrigations are done 18 times for a total of 1.5 acre-feet of water for one crop of bell peppers for processing. Weekly irrigation of 1 acre-inch of water is applied throughout the growing period to mature bell peppers for harvest. Labor hours to switch the water on and off, inspections, and maintenance is estimated to take about 30 minutes per irrigation for a total of 9 hours per acre per crop. Pest Management. There is a wide variety of pests that can affect bell pepper production. Major insect pests include flea beetles (Epitrix and Phyllotreta spp.), cut worms (Agrotis and Peridroma spp.), and wireworms (Limonius spp.) during the early season. Aphid (Myzus persicae), beet armyworm (Spodoptera exigua), tomato fruit worm (Heliothis zea), pepper weevil (Anthonomus eugenii), psyllid (Paratrioza cockerelli), whitefly (Trialeurodes vaporariorum), and leafminer (Liriomyza spp.) can also cause serious damage during the season. Major diseases include phytophthora root rot (P. capsici), bacterial spot (Xanthomonas campestris), and powdery mildew (Leveillula taurica). Major viruses include cucumber mosaic virus (CMV), pepper mottle virus (PeMV), tobacco mosaic virus (TMV), and alfalfa mosaic virus (AMV). In addition, root knot nematodes (Meloidogyne incognita and M. javanica) can also be a serious issue. A contract pest control advisor (PCA) monitors and scouts the fields throughout the crop season for insect pests, diseases, viruses, beneficial insects, and agronomic problems to determine if control measures are necessary. The PCA consultation fee for bell pepper crop may vary by location; however, we used an average of $44 per acre per crop in this study based on interview data from growers and PCAs. Pesticides applications may vary depending on types of insect pests and diseases infestation and recommendations from the PCA. Pesticide applications can be a mixed spray of multiple materials or an individual material. Pesticide materials are rotated after each application to slow and prevent resistance development. Depending on the production season and infestation level in the field, the PCA may recommend anywhere from three to ten pesticide applications per acre per crop. Some of the materials used in the mixture would be Quintec (Quinoxyfen), Movento (Spirotramat), and Coragen (Chlorantraniliprole) to control powdery mildew and insect pests. In this study, the first pesticide application consist of 2 materials mixed together and is done 4 weeks after transplanting; the second application consist of 3 materials mixed together and is done 3 weeks after the first; the third application consist of 1 material and is done 3 weeks after the second; the fourth application consist of 1 material and is done 3 weeks after the third; and the fifth application consist of 2 materials mixed together and is done 3 weeks after the fourth. If necessary and depending on infestation level, more applications may be applied afterwards. We used custom pesticide treatment which cost approximately $90 for 3 materials mixed application, $65 for 2 materials mixed application, and $45 for 1 material application in Ventura County. Written recommendations are required for commercially applied pesticides by licensed pest control advisors. Pest control materials and labor rates mentioned in this study are listed on the UCIPM website at http://www.ipm.ucdavis.edu/PMG/selectnewpest.peppers.html. For information on pesticide use permits, contact your County Agricultural Commissioner’s Office. Weed Management. Growers in Ventura County use selective herbicides to control a wide range of grass and broadleaf weeds. Hand weeding is also done during the growing season. In this study, herbicide is sprayed once after land preparation. One-pint ($25.37 per pint) of Goaltender (Oxyfluorfen) herbicide is sprayed (using tractor and sprayer) and takes about 10 minutes per acre. Goaltender costs about $203 per gallon. Custom hand weeding costs about $80 per application and is done about 3 times (May, June, and July) per acre throughout the growing period. Food Safety Program. Many growers of vegetable crops like bell peppers produced for processing incorporate and implement a food safety program. According to the United States Department of

4 Costs and Profitability Analysis for Bell Pepper Production (Processing), Ventura County, 2012-13
Agriculture – Agriculture Marketing Service (USDA-AMS), Good Agriculture Practice (GAP) guidelines were developed to educate and help growers reduce food safety hazards on farm operations for minimizing microbial contamination during the growing and harvesting seasons (2011). In this study, we assumed growers participate in annual GAP audit and certification. Growers also conduct two (one test for farm, one test for water reservoir) microbial water tests per month (total of 12 water tests per acre from land preparation to harvest for one bell pepper crop) as part of their Food Safety program. There are many GAP certification programs in California. Each farm operation will be different; therefore growers should decide on the GAP certification program that best fit their needs. The cost of most third party GAP audit and certification programs are not public information. However, the United Fresh Produce Association pre-farm-gate matrix provided average fees for GAP certification. From the matrix, we chose to use in this study the fees charged by Primus Lab for GAP certification. Two types of audits are done for GAP certification through Primus Lab: farm and harvest crew audits. The farm audit costs about $550 per farm per year ($0.55 per acre for 6 months based on 500-acre farm). Two harvest crew audits costs about $390 per crop season ($0.78 per acre). Microbial water test costs about $34 per 250-milliliter sample. Two water samples are collected per month per farm operation. Therefore for the 6-month bell pepper crop, the total costs of microbial water test will be $408 for the entire farm ($0.82 per acre for 6 months). Conditional Waiver Program. The Federal Clean Water Act (CWA) and the Porter-Cologne Water Quality Control Act, authorize regulators (Regional Water Quality Control Boards) to control discharges into surface water and ground water. Historically, the regional water quality control boards waived the waste discharge requirements for irrigated farmlands. However, the 1999 Senate Bill 390 banned the waiver and set the waiver expiration date to 2003. The regional boards had to come up with an alternate method to regulate discharges from irrigated farmlands. According to the Farm Bureau of Ventura County, the Los Angeles regional board, which overseas Ventura County, adopted its first conditional waiver program to regulate discharges from irrigated farmlands in November 2005 and was renewed in October 2010. The conditional waiver program requires dischargers to submit Notice of Intent (NOI) to comply with the program, annual site monitoring reports, assessment and mitigation plans, and fulfillment of a minimum of eight credit hours education for each group member and or individual non-member. Ventura County Agricultural Irrigated Land Group (VCAILG) was formed in March 2006 and approved in December 2006 to be a group discharger in order to comply with the conditional waiver program set by the Los Angeles regional board. VCAILG membership is voluntary. However, non-members must be in compliance with the conditional waiver program individually and follow the same requirements. The program is administered by the Ventura County Farm Bureau. The Farm Bureau provides staff support, maintain records, and oversee consultants, and handles correspondences between members and the Los Angeles regional board. The program cost varies by year, watershed, and depends on the scope of work performed. Generally, the program cost covers monitoring, reporting, mitigation, state board fees and the farm Bureau administrative fee. There are four watersheds in Ventura County: Ventura River, Santa Clara River, Calleguas Creek, and Oxnard Plain watersheds. Based on interview data, the majority of the bell pepper production falls within the Calleguas Creek watershed. The average cost for this watershed was $23 per acre per year in 2012 (Farm Bureau). Therefore, we used $11.50 per acre (for 6 months) to reflect cost for one crop in this study.

5 Costs and Profitability Analysis for Bell Pepper Production (Processing), Ventura County, 2012-13
HARVESTING, MARKETING, and DISPOSAL OF CROP RESIDUES Bell pepper is hand-harvested and hauled to the processing plants by contract harvesters. In this study in the staggering schedule, we assumed transplanting an acre to take place once therefore harvesting will also be done once. We based harvesting costs on tons per acre. Based on interview data, harvesting costs is estimated at $43 per ton. Yield and Price. Based on interview data, the average bell pepper yield for processing is about 30 tons per acre per crop and we estimated gross returns at $280 per ton. California Pepper Commission Assessment. The California Department of Food and Agriculture (CDFA) established an assessment rate of $0.35 per ton to be levied on all growers and remitted to first handler. Therefore, we used an assessment fee of $0.35 per ton. Disposal of Crop Residues. After harvesting, the crop is mowed (tractor and mower) and then the drip tapes are retrieved and stored for next use. After the drip tapes are removed, the field is disc twice to turn the soil. In this study, labor hour for disposal of crop residues (excluding drip removal manual and machine labor) takes approximately 0.55 hour per acre. INTEREST ON OPERATING CAPITAL. Interest on operating capital is calculated at an annual operating loan (short-term) rate of 5.75% provided by the Production Credit Association. The interest on operating capital reflects borrowing costs and or opportunity costs for money used in the operation for producing bell peppers for processing. An opportunity cost is the return foregone by choosing to produce bell peppers for processing instead of using the money on other alternative investment options. LABOR. Labor wages are based on interview data, includes owner and hired services. The wage rates used for this study including benefits are $15.30 per hour (28% for benefits) for machine operators and $11.98 per hour (28% for benefits) for non-machine and irrigation labor. EQUIPMENT OPERATING COSTS. Equipment operating cash costs for fuel, lubrication, and repairs are calculated using formulas and coefficients developed by the American Society of Agricultural Engineers (ASAE). Repair costs are based on purchase price, annual hours use, total hours of life, and repair coefficients formulated by the ASAE. Fuel and lubrication costs are also determined by ASAE equations based on machinery horsepower (maximum PTOHP) and the type of fuel used. We used average fuel prices of $3.84 per gallon for diesel and $4.08 per gallon for gasoline, obtained from the U.S. Energy Information Administration.
CASH OVERHEAD COSTS Land Rent. Land rental for row crop vary by region and depends on the availability of well water and permanent irrigation systems. The landowner maintains the well and permanent irrigation system. Land rent for row crops in Ventura County costs about $2,800 per acre per year. We used $1,400 per acre for 6 months to reflect rental for one bell pepper crop. Office Expense. Expenses in this category include office supplies, telephone services (mobile and landline), office machines, bookkeeping, accounting, legal fees, and so on. Based on interview data, office expenses average about $500 per acre per year; covering all crops produced on the farm. Therefore, we used $250 per acre for 6 months to reflect the cost for one bell pepper crop.
6 Costs and Profitability Analysis for Bell Pepper Production (Processing), Ventura County, 2012-13
Sanitation Facility. Sanitation facilities are required during transplanting, hand weeding, and harvesting for field workers. These operations are done by contractors who provide their own sanitation facilities therefore growers do not incur the costs. Liability and Property Insurance. Liability insurance (to cover accidents on the entire farm) for a farm of the size specified in this study is about $1,188 per year. Therefore, the cost to cover one crop (50-acre operation) is $59.40 ($1.19 per acre for 6 months). In addition, property insurance is calculated at $8.17 per $1,000 valuation. Property Taxes. Counties charge a base property tax rate of 1 percent on the assessed value of the property, including equipment, buildings, and improvements. Special assessment districts in some counties charge additional taxes on property. In this study, we calculated property taxes at the county base tax rate of 1 percent of the property value. Investment Repairs. Repair costs are the annual maintenance costs for investments in non-cash overhead. The repairs are calculated as a percentage of the new cost distributed over the investment life. Annual repairs in this study are calculated as 2% of the new cost.
NON-CASH OVERHEAD COSTS Farm Building. We assumed that a steel farm building about 2,600 square-feet is used for this size farm. The value is estimated based on current market price per square-foot. Tools. The farm shop includes various kinds of tools necessary for quick repair of farm machinery. The value of tools is estimated based on used and new prices. Fuel Tank. We assumed a farm this size will own at least one fuel tank, sizing 550 gallons. Ownership Cost of Equipment and Farm Investments. We used the capital recovery method to calculate ownership costs of farm equipment and investments. This method allows growers to calculate an annual amount of money to charge the enterprise so that the value of assets will be recovered within a specific period at the designated interest rate. The interest we used to calculate ownership cost is 4.75%, which is California’s long-term rate of return on agricultural production assets from current income. We valued the equipment complement at 60% of new prices to reflect the mix of old and new equipment complement.
SUMMARY OF PRODUCTION COSTS Production costs given our assumptions of farm size, production practices and 2012/2013 prices are presented in tables 1 and 2 by type of activity and by type of inputs, respectively. Our estimate of production costs for bell peppers produced for processing is $6,650 per acre. Figure 1 shows the breakdown costs. It includes 50% ($3,293) accounted for by cultural practices (consisting of land preparation, transplanting, irrigation, fertilization, pest and weed control, equipment, and conditional waiver and food safety programs); 20% ($1,301) by harvesting (picking, hauling, selling, and California Pepper Commission assessment); 1% ($76) by interest on operating capital; 27% ($1,824) by cash overhead (land rent, office expenses, drip tapes, insurances, and taxes, and investment repairs); 1% ($100) by non-cash overhead (capital recovery of building, tools, fuel tank, and equipment); and 1% ($56) by disposal of crop residues (mowing, drip tapes removal, and discing crop residues).

7 Costs and Profitability Analysis for Bell Pepper Production (Processing), Ventura County, 2012-13
Figure 1. Proportion of Production Costs for Bell Pepper Production for Processing in Ventura County, 2012-2013
PROFITABILITY ANALYSIS We analyzed profitability using break-even costs and economic margins. A break-even cost is the cost of production per unit; that is the total cost of production per acre divided by the yield per acre. Break-even costs allow growers to compare expected market prices with the unit cost of production. Gross margin (or returns above cash costs) is what growers often refer to as profit if there is no debt on the farming operation. It approximates the return to management and investment. If you deduct depreciation, it also approximates taxable income. Gross margin is calculated as gross returns (price times yield) minus cash costs of production and overhead. Economic profit (or returns above total cost, including management) is a very useful measure of how attractive the enterprise is for potential investors and entrants into the business. Economic profit can be positive or zero. A zero economic profit should not be alarming if all costs, including the owners labor and management costs, are included (and assumed paid) in the production cost. In this study, owner’s labor is included but we did not include management charges, so the return after all costs are deducted reflects returns to management. Returns to management are calculated as gross returns minus cash and non-cash costs of production. Given the assumptions upon which we based this study, the break-even price for the average yield of 30 tons per acre is estimated at about $218 per ton to cover all cash costs and $222 per ton to cover total costs. On the other hand, the break-even yield for the average price of $280 per ton is about 23.39 tons per acre for cash costs and 23.74 tons per acre for total costs. Break-even prices are calculated as the cost of production divided by yield per acre and break-even yields are calculated as the production cost divided by price per ton. Crop yield and prices received by growers, however, may vary depending on location which could influence production practices and costs. We have provided a range analysis of price and yield variations on profitability (Table 4) so that each grower can find the figures that best match his or her specific situation. The range analyses include break-even prices at various yields as well as gross margin and returns to management at various yield and price combinations. The gross margin and returns to management ranges are analyzed at increments of $10 per ton for prices and 2 tons per acre for yield.

8 Costs and Profitability Analysis for Bell Pepper Production (Processing), Ventura County, 2012-13
REFERENCE American Society of Agricultural Engineers. (2003). American Society of Agricultural Engineers Standard Yearbook. St. Joseph, MI: ASAE. Boelje, M. D., & Eidman, V. R. (1984). Farm Management. New York: John Wiley and Sons. California's Office of USDA's NASS, (2011). California National Agriculture Statistics Service. Publications. Retrieved from website: http://www.nass.usda.gov/Statistics_by_State/California/Publications/ California Pepper Commission. (2013). California Pepper Commission. Retrieved from http://www.calpeppers.com/ Farm Bureau. (2013). Farm Bureau of Ventura County, Water Issues. Retrieved from http://www.farmbureauvc.com/water_quality.html Hartz, T., Cantwell, M., Lestrange, M., Smith, R., Aguiar, J., & Daugovish, O. (2008). Bell Pepper Production in California. 7217, Retrieved from http://anrcatalog.ucdavis.edu/pdf/7217.pdf Krist, J. (2012) Farm Bureau of Ventura County, the Independent Voice of Agiculture, Vol. XLIV, No. 7. Retrieved from: http://www.farmbureauvc.com/pdf_forms/newsletters/FB_News_July12.pdf Mitchell, J. P., Pettygrove, G. S., Upadhyaya, S., Shrestha, A., Fry, R., Roy, R., Hogan, P., Vargas, R., & Hembree, K. (2009). Classification of Conversation Tillage Practices in California Irrigated Row Crop Systems. Retrieved from http://anrcatalog.ucdavis.edu/pdf/8364.pdf Takele, E. (1999). Bell Pepper Production: Sample Costs and Profitability Analysis. 8026, Retrieved from http://coststudies.ucdavis.edu/files/8026.pdf United Fresh Produce Association. (2011). Pre-Farm Gate Matrix - United Fresh Produce Association. Retrieved from http://www.unitedfresh.org/matrix2011/prefarmgate.html University of California Statewide IPM Project. (2009). Pepper, UC IPM Pest Management Guidelines. University of California, Davis, CA, Retrieved from http://www.ipm.ucdavis.edu/PMG/selectnewpest.peppers.html. United States Department of Agriculture, Agriculture Marketing Service (2011). Good Agricultural Practices and Good Handling Practices Audit Verification Program, User’s Guide. Retrieved from http://www.ams.usda.gov/AMSv1.0/getfile?dDocName=stelprdc5097151 U.S. Energy Information Administration, (2012). Weekly Retail Gasoline and Diesel Prices. Retrieved from website: http://www.eia.gov/dnav/pet/pet_pri_gnd_dcus_nus_m.htm Ventura County Agricultural Commissioner. (2007-2012). Ventura County Agricultural Commissioner Crop Reports. Retrieved from http://portal.countyofventura.org/portal/page/portal/AgComm/resources/cropreports Zhu, H., Butts, C. L., Lam, M. C., & Blankenship, P. D. (2004). An Implement to Install and Retrieve Surface Drip Irrigation Laterals. Applied Engineering in Agriculture, 20(1), 17-23. Retrieved from http://naldc.nal.usda.gov/download/10034/PDF

9 Costs and Profitability Analysis for Bell Pepper Production (Processing), Ventura County, 2012-13
Operation
Time Labor Lube Material Custom/ Total Your
Operation (Hrs/A) Cost Fuel & Repairs Cost Rent Cost Cost
Land Prep:
Disc (4x) 0.41 7.54 33.32 10.94 0 0 51.8
Subsoil (2x) 0.65 11.88 52.52 16.96 0 0 81.36
Land Level (3x) 0.36 6.68 29.54 9.97 0 0 46.20
Broadcast Fertilizer 0.34 6.18 27.32 7.99 137.2 0 178.69
Chisel Plow 0.12 2.23 9.85 3.12 0 0 15.2
List Beds 0.08 1.41 6.25 1.82 0 0 9.48
Shape Beds 0.15 2.83 12.5 3.9 0 0 19.23
Herbicide Treatment 0.12 2.26 10.01 2.93 25.37 0 40.57
TOTAL Land Prep COSTS 2.23 41 181 58 163 0 443
Transplant:
Drip Irrigation Setup (Machine) 0.17 3.18 2.7 1.18 0 0 7.06
Drip Irrigation Setup (Labor) 0.25 3 0 0 0 0 3
Transplanting 0 0 0 0 1,205.80 300 1,505.80
TOTAL Transplant COSTS 0.42 6 3 1 1,206 300 1,516
Growing:
Fertilization - UAN32% (6x) 0 0 0 0 76.28 0 76.28
Fertilization - CAN17% (10x) 0 0 0 0 167.92 0 167.92
Fertilization - KTS (2x) 0 0 0 0 63.45 0 63.45
Pest Control Advisor 0 0 0 0 0 44 44.00
Pesticide Management (5x) 0 0 0 0 0 310 310.00
Hand Weeding (3x) 0 0 0 0 0 240 240.00
Irrigation & System Inspection (18x) 9 107.82 0 0 255.06 0 362.88
Conditional Waiver Program 0 0 0 0 0 11.5 11.50
Food Safety Program 0 0 0 0 0 1.33 1.33
Microbial Water Test 0 0 0 0 0 0.82 0.82
Truck Use 2 36.72 12.24 7.77 0 0 56.73
TOTAL Growing COSTS 11 145 12 8 563 608 1,335
Harvest and Marketing:
Pick, Haul, Sell, 0 0 0 0 0 1290 1,290
California Pepper Commission Assessment 0 0 0 0 0 10.5 10.50
TOTAL Harvest and Marketing COSTS 0 0 0 0 0 1,301 1,301
Disposal of Crop Residues:
Mow Plant 0.34 6.31 5.35 3.13 0 0 14.79
Drip Irrigation Removal (Machine) 0.29 5.42 4.59 2.33 0 0 12.33
Drip Irrigation Removal (Labor) 0.25 3 0 0 0 0 3.00
Disc (2x) 0.21 3.77 16.66 5.47 0 0 25.90
TOTAL Disposal of Crop Residues COSTS 1.09 19 27 11 0 0 56
Interest on Operating Capital @ 5.75% 75.90
TOTAL OPERATING COSTS/ACRE 14.74 210 223 78 1,931 2,208 4,726
CASH OVERHEAD:
Land Rent 1,400
Office Expenses 250
Liability Insurance 1.19
Drip Tapes 160
Property Taxes 6.16
Property Insurance 5.03
Investment Repairs 1.74
TOTAL CASH OVERHEAD COSTS/ACRE 1,824
TOTAL CASH COSTS/ACRE 6,550
NON-CASH OVERHEAD:
Acre Capital Recovery
Building 62.4 5.62 5.62
Tools 21.33 1.92 1.92
Fuel Tank 550 gallons 3.33 0.30 0.30
Equipment 932.59 91.99 91.99
TOTAL NON-CASH OVERHEAD COSTS 1,020 100 100
TOTAL COSTS/ACRE 6,650
Cash and Labor Costs per Acre
UC COOPERATIVE EXTENSION
Per producing Annual Cost
Table 1. Costs per Acre to Produce Bell Pepper for Processing in Ventura County, 2012/2013

10 Costs and Profitability Analysis for Bell Pepper Production (Processing), Ventura County, 2012-13
Quantity/ Price or Value or
Acre Unit Cost/Unit Cost/Acre
GROSS RETURNS
Bell Pepper - Processing 30 ton $280 $8,400
TOTAL GROSS RETURNS 30 ton $8,400
OPERATING COSTS
Custom: 908
Transplanting 1 acre 300 300
Custom Hand Weeding 3 acre 80 240
2 Material - Pesticide App. 2 acre 65 130
3 Material - Pesticide App. 1 acre 90 90
1 Material - Pesticide App. 2 acre 45 90
Conditional Waiver Program 1 acre 11.50 11.50
Food Safety - Farm Audit 1 acre 0.55 0.55
Food Safety - Harvest Audits 1 acre 0.78 0.78
Microbial Water Test 1 acre 0.82 0.82
Pest Control Advisor 1 acre 44 44
Fertilizer: 445
16-20-0 280 lb 0.49 137.2
UAN32% 16.95 gal 4.50 76.275
CAN17% 44.19 gal 3.80 167.922
KTS 15 gal 4.23 63.45
Water: 255
District Water 18 ac-in 14.17 255.06
Harvest: 1,301
Pick, Haul, Sell 30 ton 43 1,290
California Pepper Commission
Assessment 30 ton 0.35 10.50
Planting Material: 1,206
Plant 24200 plant 0.024 580.8
Seed 1 acre 625 625
Herbicide: 25
Goaltender 0.125 gal 203 25.37
Labor: 210
Equipment Operator Labor 6.3 hrs 15.3 96.42
Irrigation Labor 9.5 hrs 11.98 113.81
Machinery: 300
Fuel-Gas 3 gal 4.08 12.24
Fuel-Diesel 54.85 gal 3.84 210.61
Lube 33.43
Machinery Repair 44.08
Interest on Operating Capital (5.75% ) 75.90
TOTAL OPERATING COSTS/ACRE 4,726
TOTAL OPERATING COSTS/TON 158
NET RETURNS ABOVE OPERATING COSTS 3,674
CASH OVERHEAD COSTS
Land Rent 1,400
Office Expenses 250
Liability Insurance 1.19
Drip Tapes 160
Property Taxes 6.16
Property Insurance 5.03
Investment Repairs 1.74
TOTAL CASH OVERHEAD COSTS/ACRE 1,824
TOTAL CASH OVERHEAD COSTS/TON 61
TOTAL CASH COSTS/ACRE 6,550
TOTAL CASH COSTS/TON 218
NET RETURNS ABOVE CASH COSTS 1,850
NON-CASH OVERHEAD COSTS (Capital Recovery)
Building 5.615
Tools 1.919
Fuel Tank 550 gallons 0.3
Equipment 91.99
TOTAL NON-CASH OVERHEAD COSTS/ACRE 100
TOTAL NON-CASH OVERHEAD COSTS/TON 3
TOTAL COST/ACRE 6,650
TOTAL COST/ TON 222
NET RETURNS ABOVE TOTAL COST 1,750
UC COOPERATIVE EXTENSION
Table 2. Costs and Returns per Acre to Produce Bell Pepper for
Processing in Ventura County, 2012/2013

11 Costs and Profitability Analysis for Bell Pepper Production (Processing), Ventura County, 2012-13
Beginning 03-12 MAR APR MAY JUN JUL AUG TOTAL
Ending 08-12 12 12 12 12 12 12
Land Prep:
Disc (4x) 51.8 51.8
Subsoil (2x) 81.36 81.36
Land Level (3x) 46.20 46.20
Broadcast Fertilizer 178.69 178.69
Chisel Plow 15.2 15.2
List Beds 9.48 9.48
Shape Beds 19.23 19.23
Herbicide Treatment 40.57 40.57
TOTAL Land Prep COSTS 443 443
Transplant:
Drip Irrigation Setup (Machine) 7.06 7.06
Drip Irrigation Setup (Labor) 3 3
Transplanting 1,505.80 1,505.80
TOTAL Transplant COSTS 0 1,516 0 0 0 0 1,516
Growing:
Fertilization - UAN32% (6x) 25.43 50.85 76.28
Fertilization - CAN17% (10x) 88.39 79.53 167.92
Fertilization - KTS (2x) 21.15 42.3 63.45
Pest Control Advisor 44 44
Pesticide Management (5x) 65 90 45 110 310
Hand Weeding (3x) 80 80 80 240
Irrigation & System Inspection (18x) 40.32 100.8 80.64 80.64 60.48 362.88
Conditional Waiver Program 11.5 11.5
Food Safety Program 0.55 0.78 1.33
Microbial Water Test 0.14 0.14 0.14 0.14 0.14 0.14 0.82
Truck Use 9.46 9.46 9.46 9.46 9.46 9.46 56.73
TOTAL Growing COSTS 10 218 331 304 360 113 1,335
Harvest and Marketing:
Pick, Haul, Sell 1290 1290
California Pepper Commission 10.50 10.50
TOTAL Harvest and Marketing COSTS 0 0 0 0 0 1,301 1,301
Disposal of Crop Residues:
Mow Plant 14.79 14.79
Drip Irrigation Removal (Machine) 12.33 12.33
Drip Irrigation Removal (Labor) 3.00 3.00
Disc (2x) 25.90 25.90
TOTAL Disposal of Crop Residues COSTS 0 0 0 0 0 56.02 56
Interest on Operating Capital (5.75% ) 7.38 28.29 5.41 4.96 5.87 23.99 75.90
TOTAL OPERATING COSTS/ACRE 460 1,762 337 309 366 1,494 4,726
CASH OVERHEAD
Land Rent 233.33 233.33 233.33 233.33 233.33 233.33 1,400
Office Expenses 41.67 41.67 41.67 41.67 41.67 41.67 250
Liability Insurance 1.19 1.19
Drip Tapes 160 160
Property Taxes 6.16 6.16
Property Insurance 5.03 5.03
Investment Repairs 0.29 0.29 0.29 0.29 0.29 0.29 1.74
TOTAL CASH OVERHEAD COSTS 275 435 275 275 288 275 1,824
TOTAL CASH COSTS/ACRE 735 2,197 612 584 653 1,769 6,550
UC COOPERATIVE EXTENSION
Table 3. Monthly Cash Costs per Acre to Produce Bell Pepper for Processing in Ventura County, 2012/2013

12 Costs and Profitability Analysis for Bell Pepper Production (Processing), Ventura County, 2012-13
24 26 28 30 32 34 36
OPERATING COSTS:
Land Prep 443 443 443 443 443 443 443
Transplant 1,516 1,516 1,516 1,516 1,516 1,516 1,516
Growing 1,335 1,335 1,335 1,335 1,335 1,335 1,335
Harvest 1,040 1,127 1,214 1,300.5 1,387 1,474 1,561
Disposal of Crop Residues 56 56 56 56 56 56 56
Interest on operating capital @ 5.75% 71.65 73.07 74.48 75.90 77.32 78.73 80.15
TOTAL OPERATING COSTS/ACRE 4,461 4,549 4,638 4,726 4,814 4,902 4,990
Total Operating Costs/ton 186 175 166 158 150 144 139
CASH OVERHEAD COSTS/ACRE 1,824 1,824 1,824 1,824 1,824 1,824 1,824
TOTAL CASH COSTS/ACRE 6,285 6,374 6,462 6,550 6,638 6,726 6,814
Total Cash Costs/ton 262 245 231 218 207 198 189
NON-CASH OVERHEAD COSTS/ACRE 100 100 100 100 100 100 100
TOTAL COSTS/ACRE 6,385 6,473 6,562 6,650 6,738 6,826 6,914
Total Costs/ton 266 249 234 222 211 201 192
PRICE($/ton)
Process 24 26 28 30 32 34 36
$250 1,539 1,951 2,362 2,774 3,186 3,598 4,010
$260 1,779 2,211 2,642 3,074 3,506 3,938 4,370
$270 2,019 2,471 2,922 3,374 3,826 4,278 4,730
$280 2,259 2,731 3,202 3,674 4,146 4,618 5,090
$290 2,499 2,991 3,482 3,974 4,466 4,958 5,450
$300 2,739 3,251 3,762 4,274 4,786 5,298 5,810
$310 2,979 3,511 4,042 4,574 5,106 5,638 6,170
PRICE($/ton)
Process 24 26 28 30 32 34 36
$250 -285 126 538 950 1,362 1,774 2,186
$260 -45 386 818 1,250 1,682 2,114 2,546
$270 195 646 1,098 1,550 2,002 2,454 2,906
$280 435 906 1,378 1,850 2,322 2,794 3,266
$290 675 1,166 1,658 2,150 2,642 3,134 3,626
$300 915 1,426 1,938 2,450 2,962 3,474 3,986
$310 1,155 1,686 2,218 2,750 3,282 3,814 4,346
PRICE($/ton)
Process 24 26 28 30 32 34 36
$250 -385 27 438 850 1,262 1,674 2,086
$260 -145 287 718 1,150 1,582 2,014 2,446
$270 95 547 998 1,450 1,902 2,354 2,806
$280 335 807 1,278 1,750 2,222 2,694 3,166
$290 575 1,067 1,558 2,050 2,542 3,034 3,526
$300 815 1,327 1,838 2,350 2,862 3,374 3,886
$310 1,055 1,587 2,118 2,650 3,182 3,714 4,246
YIELD(tons/acre)
RETURNS PER ACRE ABOVE TOTAL COSTS AT VARIOUS YIELDS AND PRICE COMBINATION
UC COOPERATIVE EXTENSION
Table 4. Range Analysis: Income and Costs Analyses to Produce Bell Pepper for Processing in Ventura County, 2012/2013
RETURNS PER ACRE ABOVE OPERATING COSTS AT VARIOUS YIELDS AND PRICE COMBINATION
RETURNS PER ACRE ABOVE OPERATING AND CASH COSTS AT VARIOUS YIELDS AND PRICE COMBINATION
YIELD(tons/acre)
YIELD(tons/acre)
YIELD (tons/acre)

13 Costs and Profitability Analysis for Bell Pepper Production (Processing), Ventura County, 2012-13
Yrs Salvage Capital
Description Price Life Value Recovery Insurance Taxes Total
350 HP Tractor #1 207300 13 47,682 19,002 1,042 1,275 21,319
350 HP Tractor #2 207300 19 28,912 15,835 965 1,181 17,981
90 HP Tractor 49,500 17 8,157 3,986 236 288 4,510
Disc #1 19,950 8 4,504 2,580 100 122 2,802
Disc #2 19,950 8 4,504 2,580 100 122 2,802
Subsoiler #1 12,500 8 2,822 1,616 63 77 1,756
Subsoiler #2 12,500 8 2,822 1,616 63 77 1,756
Land plane 22,000 11 3,443 2,368 104 127 2,600
Fertilizer spreader 3,100 4 1,141 603 17 21 642
Chisel plow 13,500 22 551 988 57 70 1,115
Lister 8,300 20 433 639 36 44 718
Bed Shaper 9,500 16 807 826 42 52 920
Herbicide Sprayer 4,600 15 442 415 21 25 461
Mower 4,000 7 1,021 559 21 25 604
Drip Layer 2,000 14 217 188 9 11 208
Drip Lifter & Winder 5,445 8 1,229 704 27 33 765
Truck: pickup #1 24,500 5 10,980 3,623 145 177 3,945
Truck: pickup #2 24,500 5 10,980 3,623 145 177 3,945
Truck: pickup #3 24,500 5 10,980 3,623 145 177 3,945
Truck: pickup #4 24,500 5 10,980 3,623 145 177 3,945
TOTAL 699,445 152,608 68,996 3,481 4,260 76,737
60% of new cost* 419,667 91,565 41,397 2,088 2,556 46,042
*Used to reflect a mix of new and used equipment
Yrs Salvage Capital
Description Price Life Value Recovery Insurance Taxes Repairs Total
INVESTMENT
Building 46,800 15 4,680 4,211.95 210.3 257.4 936 5,615.65
Tools 16,000 15 1,600 1,439.98 71.9 88 320 1,919.88
Fuel Tank 550 gallons 2,500 15 250 225 11.23 13.75 50 299.98
TOTAL INVESTMENT 65,300 6,530 5,877 293 359 1,306 7,836
Units/ Price/ Total
Description Farm Unit Unit Cost
Land Rent 50 acre 1400 70,000
Office Expenses 50 acre 250 12,500
Liability Insurance 50 acre 1.19 59
Drip Tapes 50 acre 160 8,000
ANNUAL BUSINESS OVERHEAD COSTS FOR 1 BELL PEPPER CROP FOR PROCESSING
Annual Investment Costs
UC COOPERATIVE EXTENSION
Table 5. Farm Investment for Producing Bell Pepper for Processing: Values and Annual Costs based on 750-Farmed Acres in Ventura
County, 2012/2013
Annual Investment Costs

14 Costs and Profitability Analysis for Bell Pepper Production (Processing), Ventura County, 2012-13
Table 6. Hourly Costs for Equipment used in Bell Pepper for Processing in Ventura County, 2012/2013
Process Total
Hours
Annual
Hours Capital Lube & Total Total
Description Used Used Recovery Insurance Taxes Repairs Fuel Oper. Costs/Hr.
350 HP Tractor #1 80 1200 15.84 0.87 1.06 19.8 73.77 93.57 111.33
350 HP Tractor #2 54 810 19.55 1.19 1.46 19.25 73.77 93.02 115.22
90 HP Tractor 45 675 5.91 0.35 0.43 5.58 14.14 19.72 26.41
Disc #1 15 225 11.47 0.44 0.54 5.16 0 5.16 17.61
Disc #2 15 225 11.47 0.44 0.54 5.16 0 5.16 17.61
Subsoiler #1 16 240 6.73 0.26 0.32 4.72 0 4.72 12.03
Subsoiler #2 16 240 6.73 0.26 0.32 4.72 0 4.72 12.03
Land plane 18 270 8.77 0.38 0.47 5.6 0 5.6 15.23
Fertilizer spreader 17 255 2.37 0.07 0.08 1.94 0 1.94 4.46
Chisel plow 6 90 10.97 0.64 0.78 4.54 0 4.54 16.93
Lister 4 60 8.71 0.57 0.7 3.1 0 3.1 13.09
Bed Shaper 8 120 6.88 0.35 0.43 4.15 0 4.15 11.82
Herbicide Sprayer 6 90 4.61 0.23 0.28 1.97 0 1.97 7.09
Mower 17 255 2.19 0.08 0.1 2.98 0 2.98 5.35
Drip Layer 9 135 1.39 0.07 0.08 0.68 0 0.68 2.22
Drip Lifter & Winder 15 225 3.13 0.12 0.15 1.75 0 1.75 5.14
Truck: pickup #1 25 375 9.66 0.39 0.47 3.89 6.12 10.01 20.53
Truck: pickup #2 25 375 9.66 0.39 0.47 3.89 6.12 10.01 20.53
Truck: pickup #3 25 375 9.66 0.39 0.47 3.89 6.12 10.01 20.53
Truck: pickup #4 25 375 9.66 0.39 0.47 3.89 6.12 10.01 20.53
UC COOPERATIVE EXTENSION
Cash Overhead Operating
COSTS PER HOUR
15 Costs and Profitability Analysis for Bell Pepper Production (Processing), Ventura County, 2012-13
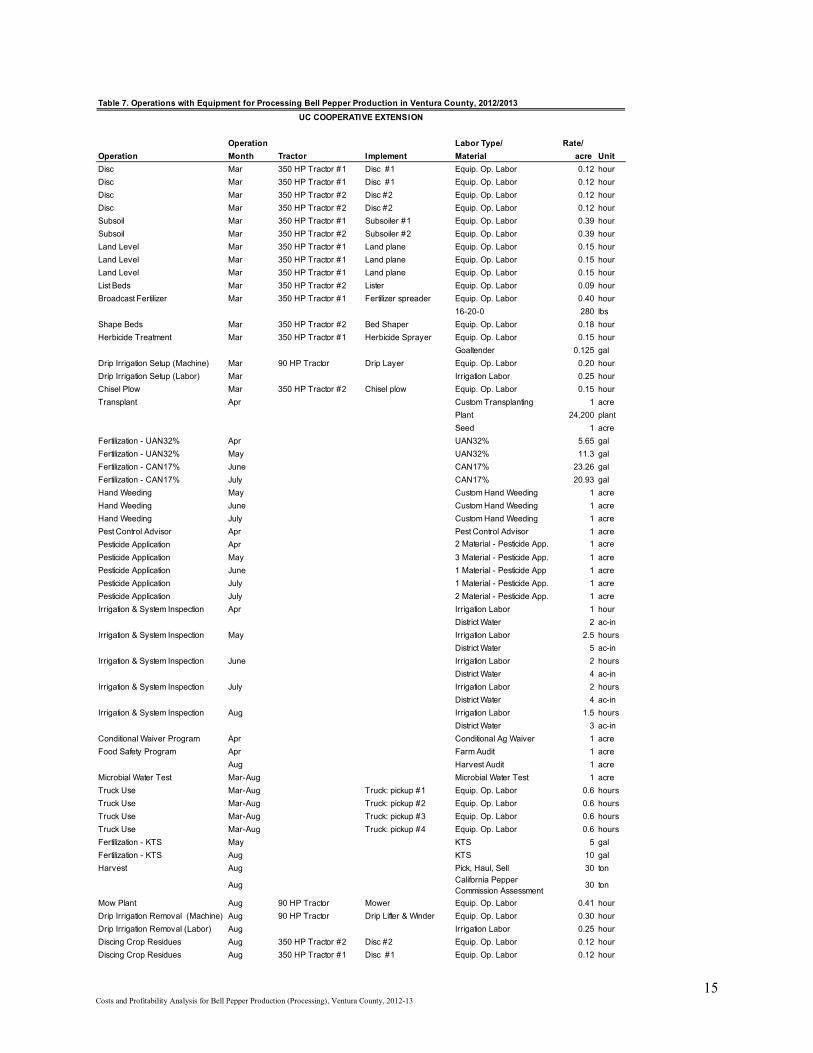
Table 7. Operations with Equipment for Processing Bell Pepper Production in Ventura County, 2012/2013
Operation Labor Type/ Rate/
Operation Month Tractor Implement Material acre Unit
Disc Mar 350 HP Tractor #1 Disc #1 Equip. Op. Labor 0.12 hour
Disc Mar 350 HP Tractor #1 Disc #1 Equip. Op. Labor 0.12 hour
Disc Mar 350 HP Tractor #2 Disc #2 Equip. Op. Labor 0.12 hour
Disc Mar 350 HP Tractor #2 Disc #2 Equip. Op. Labor 0.12 hour
Subsoil Mar 350 HP Tractor #1 Subsoiler #1 Equip. Op. Labor 0.39 hour
Subsoil Mar 350 HP Tractor #2 Subsoiler #2 Equip. Op. Labor 0.39 hour
Land Level Mar 350 HP Tractor #1 Land plane Equip. Op. Labor 0.15 hour
Land Level Mar 350 HP Tractor #1 Land plane Equip. Op. Labor 0.15 hour
Land Level Mar 350 HP Tractor #1 Land plane Equip. Op. Labor 0.15 hour
List Beds Mar 350 HP Tractor #2 Lister Equip. Op. Labor 0.09 hour
Broadcast Fertilizer Mar 350 HP Tractor #1 Fertilizer spreader Equip. Op. Labor 0.40 hour
16-20-0 280 lbs
Shape Beds Mar 350 HP Tractor #2 Bed Shaper Equip. Op. Labor 0.18 hour
Herbicide Treatment Mar 350 HP Tractor #1 Herbicide Sprayer Equip. Op. Labor 0.15 hour
Goaltender 0.125 gal
Drip Irrigation Setup (Machine) Mar 90 HP Tractor Drip Layer Equip. Op. Labor 0.20 hour
Drip Irrigation Setup (Labor) Mar Irrigation Labor 0.25 hour
Chisel Plow Mar 350 HP Tractor #2 Chisel plow Equip. Op. Labor 0.15 hour
Transplant Apr Custom Transplanting 1 acre
Plant 24,200 plant
Seed 1 acre
Fertilization - UAN32% Apr UAN32% 5.65 gal
Fertilization - UAN32% May UAN32% 11.3 gal
Fertilization - CAN17% June CAN17% 23.26 gal
Fertilization - CAN17% July CAN17% 20.93 gal
Hand Weeding May Custom Hand Weeding 1 acre
Hand Weeding June Custom Hand Weeding 1 acre
Hand Weeding July Custom Hand Weeding 1 acre
Pest Control Advisor Apr Pest Control Advisor 1 acre
Pesticide Application Apr 2 Material - Pesticide App. 1 acre
Pesticide Application May 3 Material - Pesticide App. 1 acre
Pesticide Application June 1 Material - Pesticide App 1 acre
Pesticide Application July 1 Material - Pesticide App. 1 acre
Pesticide Application July 2 Material - Pesticide App. 1 acre
Irrigation & System Inspection Apr Irrigation Labor 1 hour
District Water 2 ac-in
Irrigation & System Inspection May Irrigation Labor 2.5 hours
District Water 5 ac-in
Irrigation & System Inspection June Irrigation Labor 2 hours
District Water 4 ac-in
Irrigation & System Inspection July Irrigation Labor 2 hours
District Water 4 ac-in
Irrigation & System Inspection Aug Irrigation Labor 1.5 hours
District Water 3 ac-in
Conditional Waiver Program Apr Conditional Ag Waiver 1 acre
Food Safety Program Apr Farm Audit 1 acre
Aug Harvest Audit 1 acre
Microbial Water Test Mar-Aug Microbial Water Test 1 acre
Truck Use Mar-Aug Truck: pickup #1 Equip. Op. Labor 0.6 hours
Truck Use Mar-Aug Truck: pickup #2 Equip. Op. Labor 0.6 hours
Truck Use Mar-Aug Truck: pickup #3 Equip. Op. Labor 0.6 hours
Truck Use Mar-Aug Truck: pickup #4 Equip. Op. Labor 0.6 hours
Fertilization - KTS May KTS 5 gal
Fertilization - KTS Aug KTS 10 gal
Harvest Aug Pick, Haul, Sell 30 ton
Aug California Pepper
Commission Assessment30 ton
Mow Plant Aug 90 HP Tractor Mower Equip. Op. Labor 0.41 hour
Drip Irrigation Removal (Machine) Aug 90 HP Tractor Drip Lifter & Winder Equip. Op. Labor 0.30 hour
Drip Irrigation Removal (Labor) Aug Irrigation Labor 0.25 hour
Discing Crop Residues Aug 350 HP Tractor #2 Disc #2 Equip. Op. Labor 0.12 hour
Discing Crop Residues Aug 350 HP Tractor #1 Disc #1 Equip. Op. Labor 0.12 hour
UC COOPERATIVE EXTENSION

16 Costs and Profitability Analysis for Bell Pepper Production (Processing), Ventura County, 2012-13
Etaferahu Takele
Area Farm Advisor, Agricultural Economics UCCE - Southern Region 21150 Box Springs Road
Moreno Valley, CA 92557-8718 Phone: (951) 683-6491 x 221
Fax: (951) 788-2615 E-mail: [email protected]
Oleg Daugovish Farm Advisor, Vegetable Crops and Strawberries
UCCE –Ventura County 669 County Square Drive, #100
Ventura, CA 93003-5401 Phone: (805) 645-1454 Fax: (805) 645-1474
E-mail: [email protected]
Published: Dec 31, 2013
The University of California prohibits discrimination against or harassment of any person employed by or seeking employment with the University on the basis of race, color, national origin, religion, sex, physical or mental disability, medical condition (cancer related or genetic
characteristics), ancestry, marital status, age, sexual orientation, citizenship, or status as a covered veteran (special disabled veteran, Vietnam-era veteran, or any other veteran who served on active duty during a war or in a campaign or expedition for which a campaign badge has been authorized). University Policy is intended to be consistent with the provisions of applicable State and Federal laws. Inquiries regarding the
University’s nondiscrimination policies may be directed to the Affirmative Action/Staff Personnel Services Director, University of California, Agriculture and Natural Resources, 1111 Franklin Street, 6th Floor, Oakland, CA 94607-5200, (510) 987-0096.