cost improvement curves learning amortization and yield - covert
TRANSCRIPT

8/8/2019 Cost Improvement Curves Learning Amortization and Yield - Covert
http://slidepdf.com/reader/full/cost-improvement-curves-learning-amortization-and-yield-covert 1/26
8/8/2019 Cost Improvement Curves Learning Amortization and Yield - Covert
http://slidepdf.com/reader/full/cost-improvement-curves-learning-amortization-and-yield-covert 2/26
Cost Drivers Learning Event, 2nd November 2005
16 September 2005 2
Agenda Introduction
Cost Improvement Factors The Plant Model
Nonrecurring and recurring costs
Nonrecurring cost improvement Recurring cost improvement
Example hardware cost improvement model
Summary
Acronym List
References

8/8/2019 Cost Improvement Curves Learning Amortization and Yield - Covert
http://slidepdf.com/reader/full/cost-improvement-curves-learning-amortization-and-yield-covert 3/26
Cost Drivers Learning Event, 2nd November 2005
16 September 2005 3
Introduction This presentation is intended for an audience with an
intermediate understanding of cost analysis methods
We will discuss the phenomenon of “costimprovement”, which is loosely defined as theobserved reduction of cost of successive units or projects
0
50
100
150
200
250
300
350
400
0 10 20 30
Unit Number
R e c u r r i n g
C o s t , $

8/8/2019 Cost Improvement Curves Learning Amortization and Yield - Covert
http://slidepdf.com/reader/full/cost-improvement-curves-learning-amortization-and-yield-covert 4/26
Cost Drivers Learning Event, 2nd November 2005
16 September 2005 4
Cost Improvement Factors and Learning Cost Improvement is the observed reduction of costs between
successive units or projects
Factors affecting cost improvement: Nonrecurring and recurring accounting standards affect measurement
Reuse of existing designs, materials, equipment, effort, or products
Learning or gained experience in value added effort
Skill Mix changes
Process shortcuts that eliminate effort or expenses
Yield improvements that reduce cost
Production Rate increases allowing for amortization of pooled costsand greater efficiency
Technological advances allowing greater yield and efficiency Inflation which measures the time variable cost of a “basket of goods”
*True “learning” is a subset of cost improvement, so cost
improvement is more than learning

8/8/2019 Cost Improvement Curves Learning Amortization and Yield - Covert
http://slidepdf.com/reader/full/cost-improvement-curves-learning-amortization-and-yield-covert 5/26
Cost Drivers Learning Event, 2nd November 2005
16 September 2005 5
The Plant Model Can use a plant economic model to show the effects
of different factors on cost improvements [Ref. 1, p. 183]
Skills Labor Rates
Engineering 1 2 3 4 5
Manufacturing
Quality and Reliability
Labor Hours $Tooling Fee
Testing Labor Overhead G&A
Labor Other + Overhead
Travel and Other Direct Costs $ $ Price
Material Prices Total Cost
Material Measures A B C D E Material
+ OverheadPounds G&A
Yards Fee
Material quantities $Gallons
Linear Feet Material Overhead

8/8/2019 Cost Improvement Curves Learning Amortization and Yield - Covert
http://slidepdf.com/reader/full/cost-improvement-curves-learning-amortization-and-yield-covert 6/26
Cost Drivers Learning Event, 2nd November 2005
16 September 2005 6
The Plant Model The plant economic model contains the three classic
Elements of Cost: Labor, Materials and Expenses
These costs can be Project related or Pooled (period costs)
Direct or Allocable (overhead and fringe)
Nonrecurring or Recurring costsMaterials (M) Labor (L) Expenses (E) Total = M+L+E
Direct 105,000.00 2,500,000.00 80,000.00 2,685,000.00
Burden 26,250.00 3,000,000.00 64,000.00 3,090,250.00
Total 131,250.00 5,500,000.00 144,000.00 5,775,250.00
Administration 10,000.00 125,000.00 6,250.00 141,250.00 Distribution 5,000.00 25,000.00 1,250.00 31,250.00
Corporate Transfer 125.00 250,000.00 12,500.00 262,625.00
Marketing 30,000.00 200,000.00 10,000.00 240,000.00
Research 50,000.00 275,000.00 13,750.00 338,750.00
Development 20,000.00 125,000.00 6,250.00 151,250.00
Finance 20,000.00 195,000.00 9,750.00 224,750.00
Total 135,125.00 1,195,000.00 59,750.00 1,389,875.00
Total 266,375.00 6,695,000.00 203,750.00 7,165,125.00
Pooled Costs
(Period)
Project Costs
TOTAL
COSTS

8/8/2019 Cost Improvement Curves Learning Amortization and Yield - Covert
http://slidepdf.com/reader/full/cost-improvement-curves-learning-amortization-and-yield-covert 7/26

8/8/2019 Cost Improvement Curves Learning Amortization and Yield - Covert
http://slidepdf.com/reader/full/cost-improvement-curves-learning-amortization-and-yield-covert 8/26
Cost Drivers Learning Event, 2nd November 2005
16 September 2005 8
Nonrecurring and Recurring Costs Nonrecurring (NR) and recurring (REC) cost definitions
Nonrecurring costs - unique costs of effort, material and expenses
tied to a production run rather than a particular unit Recurring costs – costs of repeated effort, material and expenses
repeated for each subsequent unit
Hard to segregate NR and REC in small or single unit
production What was recurring work if we only build one unit?
What was the theoretical first unit cost (T1)?
What if we build a prototype unit and make it the first productionunit?
What was the fist prototype unit cost (P1) and T1 cost?
What will the theoretical second unit cost (T2) be?

8/8/2019 Cost Improvement Curves Learning Amortization and Yield - Covert
http://slidepdf.com/reader/full/cost-improvement-curves-learning-amortization-and-yield-covert 9/26
Cost Drivers Learning Event, 2nd November 2005
16 September 2005 9
NR/T1 Factors for Space Programs NR/T1 is the ratio of NR costs to T1 costs
Analysis of NR/T1 Ratios of 100 programs from theNAFCOM database* provide the following results:
TYPE
RocketEngine
EarthOrbiting
LaunchVehicle Manned Planetary
NUMBER 4 61 10 8 17
MIN 27.65 0.00 2.61 1.29 2.38MAX 202.24 7.59 39.78 11.56 18.35MEDIAN 128.83 2.02 16.00 3.48 6.18MEAN 121.89 2.35 16.93 4.44 6.52
min ML mean (average) max
ML = most likely= 3 * mean - (min + max)
* NASA / Air Force Cost Model (NAFCOM) Includes subsystem hardware, systems engineering, program management,integration, assembly and test, ground test equipment, launch and orbital operations support

8/8/2019 Cost Improvement Curves Learning Amortization and Yield - Covert
http://slidepdf.com/reader/full/cost-improvement-curves-learning-amortization-and-yield-covert 10/26
Cost Drivers Learning Event, 2nd November 2005
16 September 2005 10
New Design and Reuse* The amount of new design on a program and reuse
from previous programs is a key factor in determiningNR/T1 Reuse = 1 – New Design
Assumes all have some prototype development
Almost never have 0% redesign or 100% redesign
Use table to estimate NR/T1 cost ratio from % new design% NewDesign Description NR/T1
0.0 Off the Shelf 0.1
0.1 0.20.2 0.30.3 0.50.4 0.80.5 1.30.6 1.70.7 2.10.8 2.50.9 2.81.0 3.0New Design
Tech Maturity
Min Mods
Moderate Mods
Major Mods
NR/T1 vs. % New Design
0.0
0.5
1.0
1.5
2.0
2.5
3.0
3.5
0.0 0.2 0.4 0.6 0.8 1.0
% New Design
N R / T 1
* For earth orbiting spacecraft

8/8/2019 Cost Improvement Curves Learning Amortization and Yield - Covert
http://slidepdf.com/reader/full/cost-improvement-curves-learning-amortization-and-yield-covert 11/26
Cost Drivers Learning Event, 2nd November 2005
16 September 2005 11
Modeling NR Costs Using Reuse Use our plant economic model to build-up the T1
costs
Use T1 costs and reuse (or percent new design) todetermine NR costs
Look at effect of reuse on NR cost
How does this affect total cost improvement? Total acquisition costs = NR+ REC costs
Not really interesting until we look at other costimprovement factors like learning and amortization
8/8/2019 Cost Improvement Curves Learning Amortization and Yield - Covert
http://slidepdf.com/reader/full/cost-improvement-curves-learning-amortization-and-yield-covert 12/26
Cost Drivers Learning Event, 2nd November 2005
16 September 2005 12
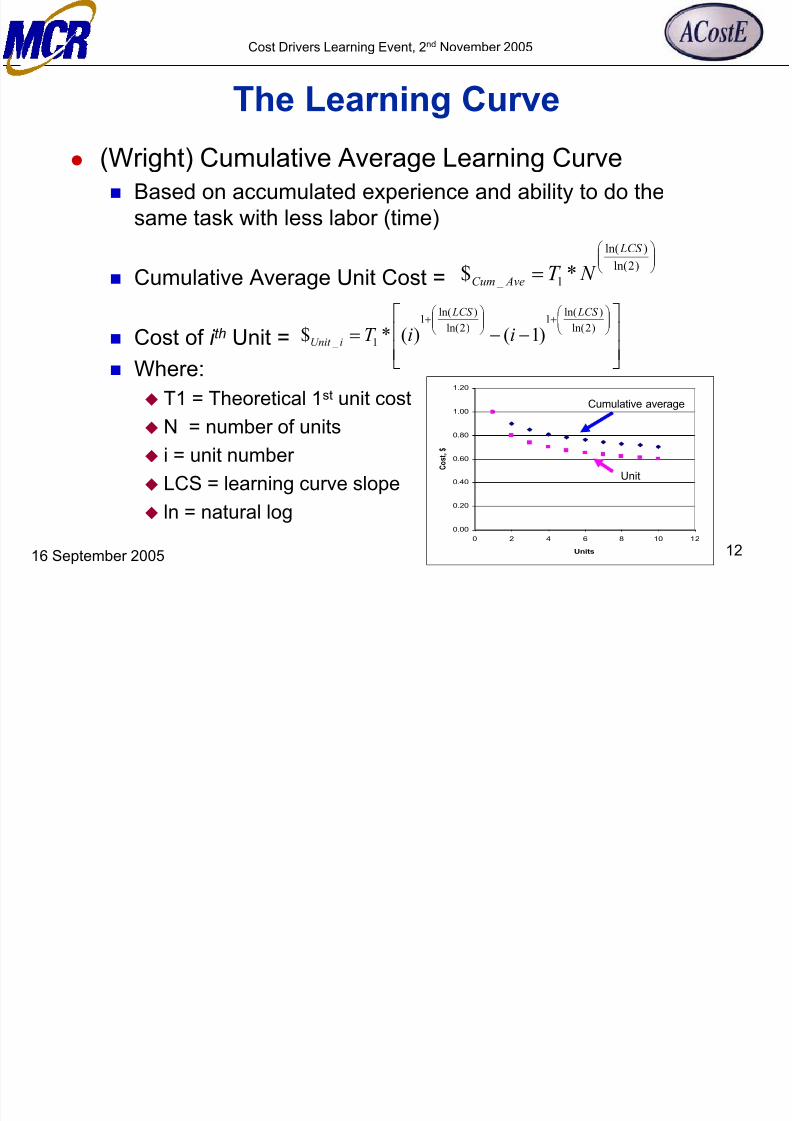
The Learning Curve (Wright) Cumulative Average Learning Curve
Based on accumulated experience and ability to do thesame task with less labor (time)
Cumulative Average Unit Cost =
Cost of i th Unit =
Where:
T1 = Theoretical 1st unit cost
N = number of units
i = unit number
LCS = learning curve slope
ln = natural log
= )2ln(
)ln(
1 _ *$
LCS
AveCum N T
−−=
+
+
)2ln()ln(1
)2ln()ln(1
1 _ )1()(*$ LCS LCS
iUnit iiT
0.00
0.20
0.40
0.60
0.80
1.00
1.20
0 2 4 6 8 10 12
Units
C o s t ,
$
Cumulative average
Unit

8/8/2019 Cost Improvement Curves Learning Amortization and Yield - Covert
http://slidepdf.com/reader/full/cost-improvement-curves-learning-amortization-and-yield-covert 13/26
Cost Drivers Learning Event, 2nd November 2005
16 September 2005 13
Observations on Learning Can be measured in hours and dollars (Euros and Pounds are
OK as well!)
This implies that it covers the same work content Accounting standards need to include NR and REC cost definitions
True learning should be independent of other factors such as: Reuse of existing designs, materials, equipment, effort, or products
Skill Mix changes Process shortcuts that eliminate effort or expenses
Yield improvements that reduce cost
Production Rate increases allowing for amortization of pooled
costs and greater efficiency Technological advances allowing greater yield and efficiency
Inflation which measures the time variable cost of a “basket of goods”

8/8/2019 Cost Improvement Curves Learning Amortization and Yield - Covert
http://slidepdf.com/reader/full/cost-improvement-curves-learning-amortization-and-yield-covert 14/26
Cost Drivers Learning Event, 2nd November 2005
16 September 2005 14
0.0
0.2
0.4
0.6
0.8
1.0
1.2
0 2 4 6 8 10 12
Units
C o s t , $
Unit Cost
The Production Rate Curve Production Rate Curve
Division of labor and overheads with number (N) of units
produced over a period of time Strongly influenced by amortization of period and fixed costs
Unit cost =
“Bath tub” shape due to added capital equipment and labor whenproduction capacity is exceeded
N
iable fixed
Unit
var $$$
+=
Max capacity
Increase
fixed costs

8/8/2019 Cost Improvement Curves Learning Amortization and Yield - Covert
http://slidepdf.com/reader/full/cost-improvement-curves-learning-amortization-and-yield-covert 15/26
Cost Drivers Learning Event, 2nd November 2005
16 September 2005 15
Yield "Yield" is the fraction of units that meet specifications
Unit cost =
Process Screening
Fail = Does Not MeetSpecifications
Pass = MeetsSpecifications
N UnitsStarted
yield N
iable fixed
unit *
$$
$
var +
=
MeetsSpecifications
Does Not MeetSpecifications
0.0
0.2
0.4
0.6
0.8
1.0
1.2
0.0 0.2 0.4 0.6 0.8 1.0
Yield
U n i t C o s t ,
$
Unit Cost

8/8/2019 Cost Improvement Curves Learning Amortization and Yield - Covert
http://slidepdf.com/reader/full/cost-improvement-curves-learning-amortization-and-yield-covert 16/26
Cost Drivers Learning Event, 2nd November 2005
16 September 2005 16
Sensitivity Analysis What affects cost improvement the most?
Reuse?
Amortization (production rate)? Yield?
Depends on the scenario (looked at 5 scenarios)
Small quantity satellite production Medium quantity satellite production
Large quantity satellite production
Electronic box production
Integrated circuit production
Use plant model with uniform distributions of quantity,reuse, amortization and yield to show sensitivity

8/8/2019 Cost Improvement Curves Learning Amortization and Yield - Covert
http://slidepdf.com/reader/full/cost-improvement-curves-learning-amortization-and-yield-covert 17/26
Cost Drivers Learning Event, 2nd November 2005
16 September 2005 17
The Plant Model Equations Start with parameters we wish to vary: Total number of projects over which non-pooled costs will be amortized
Learning curve slope (LCS)
Yield parameters (start quantity, yield, final quantity)
Percent reuse for nonrecurring costs Pooled rate factor (factor for adjusting pooled / period costs)
Determine Direct costs T1 costs are constants
T1(labor) = 100, T1(material) = 20, T1(expenses) = 12
NR costs = f(T1, Reuse) from reuse table Recurring Costs from learning curve
Total direct costs = NR + Rec costs
Add indirect costs to direct costs using these factors
Materials (5%), Labor (150%), Expenses (70%) Add period costs (constants adjusted by pooled rate factor)
MIN MAX BASE
1 2 Total Projects 1
0.999 1 LCS 1800 1200 FinalQuantity 1000
Start Quantity 2000
0.2 0.7 Yield 0.50.2 0.8 Reuse 0.8
1 3 Pooled Rate Factor 2

8/8/2019 Cost Improvement Curves Learning Amortization and Yield - Covert
http://slidepdf.com/reader/full/cost-improvement-curves-learning-amortization-and-yield-covert 18/26
Cost Drivers Learning Event, 2nd November 2005
16 September 2005 18
Small Quantity Satellite Production Most sensitive to new design
MIN MAX BASE
1 2 Total Projects 1
0.9 1 LCS 11 3 FinalQuantity 2
Start Quantity 2
0.99 1 Yield 10.2 0.7 Reuse 0.5
250 400 Pooled Rate Factor 300

8/8/2019 Cost Improvement Curves Learning Amortization and Yield - Covert
http://slidepdf.com/reader/full/cost-improvement-curves-learning-amortization-and-yield-covert 19/26
Cost Drivers Learning Event, 2nd November 2005
16 September 2005 19
Medium Quantity Satellite Production Most sensitive to:
New Design
Learning curve slope
MIN MAX BASE
1 2 Total Projects 1
0.9 1 LCS 14 10 FinalQuantity 5
Start Quantity 5
0.99 1 Yield 10.2 0.7 Reuse 0.5
250 400 Pooled Rate Factor 300

8/8/2019 Cost Improvement Curves Learning Amortization and Yield - Covert
http://slidepdf.com/reader/full/cost-improvement-curves-learning-amortization-and-yield-covert 20/26
Cost Drivers Learning Event, 2nd November 2005
16 September 2005 20
Large Quantity Satellite Production Most sensitive to:
Learning curve slope
MIN MAX BASE
1 2 Total Projects 1
0.98 1 LCS 120 40 FinalQuantity 30
Start Quantity 30
0.99 1 Yield 10.2 0.7 Reuse 0.5
250 400 Pooled Rate Factor 300

8/8/2019 Cost Improvement Curves Learning Amortization and Yield - Covert
http://slidepdf.com/reader/full/cost-improvement-curves-learning-amortization-and-yield-covert 21/26
Cost Drivers Learning Event, 2nd November 2005
16 September 2005 21
Electronic Box Production Most sensitive to:
Period costs (amortization)
MIN MAX BASE
1 2 Total Projects 1
0.98 1 LCS 120 80 FinalQuantity 50
Start Quantity 63
0.5 0.8 Yield 0.80.2 0.8 Reuse 0.810 30 Pooled Rate Factor 20

8/8/2019 Cost Improvement Curves Learning Amortization and Yield - Covert
http://slidepdf.com/reader/full/cost-improvement-curves-learning-amortization-and-yield-covert 22/26
Cost Drivers Learning Event, 2nd November 2005
16 September 2005 22
Integrated Circuit Production Most sensitive to yield
MIN MAX BASE
1 2 Total Projects 1
0.999 1 LCS 1800 1200 FinalQuantity 1000
Start Quantity 2000
0.2 0.7 Yield 0.50.2 0.8 Reuse 0.8
1 3 Pooled Rate Factor 2

8/8/2019 Cost Improvement Curves Learning Amortization and Yield - Covert
http://slidepdf.com/reader/full/cost-improvement-curves-learning-amortization-and-yield-covert 23/26
Cost Drivers Learning Event, 2nd November 2005
16 September 2005 23
Results of Scenarios Model results tell us what we probably already know
In small quantity production, reuse is the most important costimprovement factor
In large quantity, labor intensive production, learning is the mostimportant factor
In large quantity electronic box production, production rate is themost important factor
In very large quantity, automated processes, yield is the most
important factor
Scenario Quantities Primary Cost Improvement Factor:
Small quantity satellite production 1-3 Reuse (New design)
Medium quantity satellite production 4-10 Reuse & Learing curve slopeLarge quantity satellite production 20-40 Learning curve slope
Electronic box production 20-80 Amortization (production rate)
Integrated circuit production 800-1200 Yield

8/8/2019 Cost Improvement Curves Learning Amortization and Yield - Covert
http://slidepdf.com/reader/full/cost-improvement-curves-learning-amortization-and-yield-covert 24/26
Cost Drivers Learning Event, 2nd November 2005
16 September 2005 24
Summary Many factors affect cost improvement
Cost improvement can be obtained betweensubsequent programs or subsequent production units
Use plant model to show sensitivities of these factors
We chose reuse, learning, amortization (productionrate) and yield
Effects are scenario dependent
Depends on quantity of production and production volumes Also depends on amount of process automation and external
factors such as plant amortization

8/8/2019 Cost Improvement Curves Learning Amortization and Yield - Covert
http://slidepdf.com/reader/full/cost-improvement-curves-learning-amortization-and-yield-covert 25/26
Cost Drivers Learning Event, 2nd November 2005
16 September 2005 25
Acronym List NR = Nonrecurring cost
T1 = Theoretical first unit recurring cost
T2 = Theoretical second unit [recurring] cost
P1 = Theoretical first prototype unit cost
REC = Recurring cost
LCS = Learning curve slope
ML = Most likely
NR/T1 = Ratio of NR to T1 costs
N = number of units
i = unit number
ln = natural log

8/8/2019 Cost Improvement Curves Learning Amortization and Yield - Covert
http://slidepdf.com/reader/full/cost-improvement-curves-learning-amortization-and-yield-covert 26/26
Cost Drivers Learning Event, 2nd November 2005
16 September 2005 26
References1. Stewart, R. and Wyskida, R., “Cost Estimator’s Reference Manual”, 1997, John Wiley and
Sons, New York.
2. “Pricing Handbook: Cost Accounting Standards”, Federal Aviation Administration,
http://fast.faa.gov/archive/v1198/pguide/98-30C14.htm