cost-effective phosphorus removal from … phosphorus removal from secondary wastewater effluent...
TRANSCRIPT

Technical Report No.36
Cost-Effective Phosphorus Removal from Secondary through Mineral Adsorption Prepared by Larry D. Goehring, Sr., Tammo S. Steenhuis, Andrea Brooks, Melissa N. Rosenwald, Jennifer Chen, Cornell University and Victor J. Putnam, Essex County Planning Department for Lake Champlain Basin Program December 1999
PUBLICATION SERIES THIS PROGRAM IS SPONSORED BY U.S.E.P.A. AND THE STATES OF NEW YORK AND VERMONT.

Cost-Effective Phosphorus Removal from Secondary Wastewater Effluent through Mineral Adsorption
Final Report Prepared for the Town of Willsboro
Essex County, New York
as per Project No.: LC-DP94-NYRFP-D-0070-058
prepared by:
Larry D. Geohring, Sr. Extension Associate, Cornell University Tammo S. Steenhuis, Professor, Cornell University
Andrea S. Brooks, Graduate Student, Cornell University Melissa N. Rosenwald, Graduate Student, Cornell University
Jennifer Chen, Graduate Student, Cornell University and
Victor J. Putman, Associate Planner, Essex County Planning Department
December 1999

Acknowledgments
The authors would like to thank all those involved with the Lake Champlain Basin Program and the U.S. Environmental Protection Agency for providing the opportunity and funding for the WWTP pilot facility work described herein. This work was funded as per Project No. LC-DP94-NYRFP-D-0070-058. We are extremely grateful to the Town of Willsboro and particularly Teresa R. Sayward, Town Supervisor, for her early inspiration and leadership in getting this project underway. The Town of Willsboro’s willingness to coordinate and participate in this work was instrumental in conducting this effort. A note of thanks is also due to several individuals with the Town of Willsboro’s Department of Public Works. In particular, Robert J. Murphy, the Willsboro Wastewater Treatment Plant (WWTP) operator; Gilbert Belzile, operator of the Water Department; and Peter Jacques, Town Highway Supervisor. These individuals provided significant and timely support in the construction and monitoring of the pilot plant wollastonite adsorption basins, and were always helpful whenever the need arose. A great deal of appreciation is also due to NYCO Minerals, Inc., and in particular John Moroney, CEO, and Mark J. Buckley, Plant Engineer. NYCO’s financial and in-kind contributions were extremely important in matching and extending the grant support. The financial contribution expedited the efforts of Cornell University graduate students to perform the necessary background work and laboratory studies to move this project forward. The generous provision of all the wollastonite and garnet materials for both the laboratory work and the WWTP pilot facility were essential to this work. This report was funded and prepared under the authority of the Lake Champlain Special Designation Act of 1990, P.L. 101-596, through the U.S. Environmental Protection Agency (EPA grant #EPA X 001840-01). Publication of this report does not signify that the contents necessarily reflect the views of the states of New York and Vermont, the Lake Champlain Basin Program, or the U.S. Environmental Protection Agency.
Table of Contents Executive Summary 1 Introduction 2 Background on P Removal Processes from Wastewater 3 Standard P Removal through Primary and Secondary Treatment 3 Biological P Removal Processes 3 Chemical P Removal Processes 4 Other P Removal Processes 4 Removal of P with Wetlands 4 Wollastonite Mineral Sorption of Phosphorus 6 Background and Initial Laboratory Analysis 6 Additional Laboratory Analysis—Determining a Residence Time 11 Construction and Monitoring of the WWTP Pilot Facility 16 Construction Aspects 16 Monitoring Aspects 18 Pilot Facility Operation and Maintenance Aspects 19 Monitoring Results of the WWTP Pilot Wollastonite Basins 19 Monitoring Results of 1996 19 Discharge rates 19 Phosphorus concentrations and percent removal 22 Biological oxygen demand 25 Nitrate-nitrogen concentrations 25 Monitoring Results of 1997 25 Discharge rates 25 Phosphorus concentrations and percent removal 32 Biological oxygen demand 34 Variability of Monitoring Results 35 Other Site Characterization Work 40 Discussion and Implications for Using Wollastonite in a Constructed Wetland 41 Physical Design Aspects 41 Economic Aspects 45 Summary of Results 47 Conclusions and Recommendations for Further Study 51 References 51
List of Tables
Table 1. Particle Size Analysis of Wollastonite Substrates ............................................................ 7
Table 2. Physical Properties of Wollastonite and Garnet Materials ............................................... 8
Table 3. Cost Estimates on Phosphorus Removal for Conventional Wastewater Treatment Systems ................................................................................................................................. 46
Table 4. Cost Estimates on Phosphorus Removal Using a Subsurface-Flow Constructed Wetland with a Wollastonite Substrate ............................................................................................... 48
List of Figures Figure 1. P removal in the column of coarse wollastonite as affected by distance along the
column, solution pH, and a 12-hr. retention time ................................................................... 9
Figure 2. P removal in the column of fine wollastonite as affected by distance along the column, solution pH, and a 12-hr. retention time ................................................................................. 9
Figure 3. Schematic of vertical upflow......................................................................................... 11
Figure 4. Long-term response in the laboratory columns with wollastonite on SP removal........ 12
Figure 5. Comparison of residence time and percent removal of soluble phosphorus................. 14
Figure 6. Schematic of the pilot wollastonite adsorption contact basins and appurtenances ....... 17
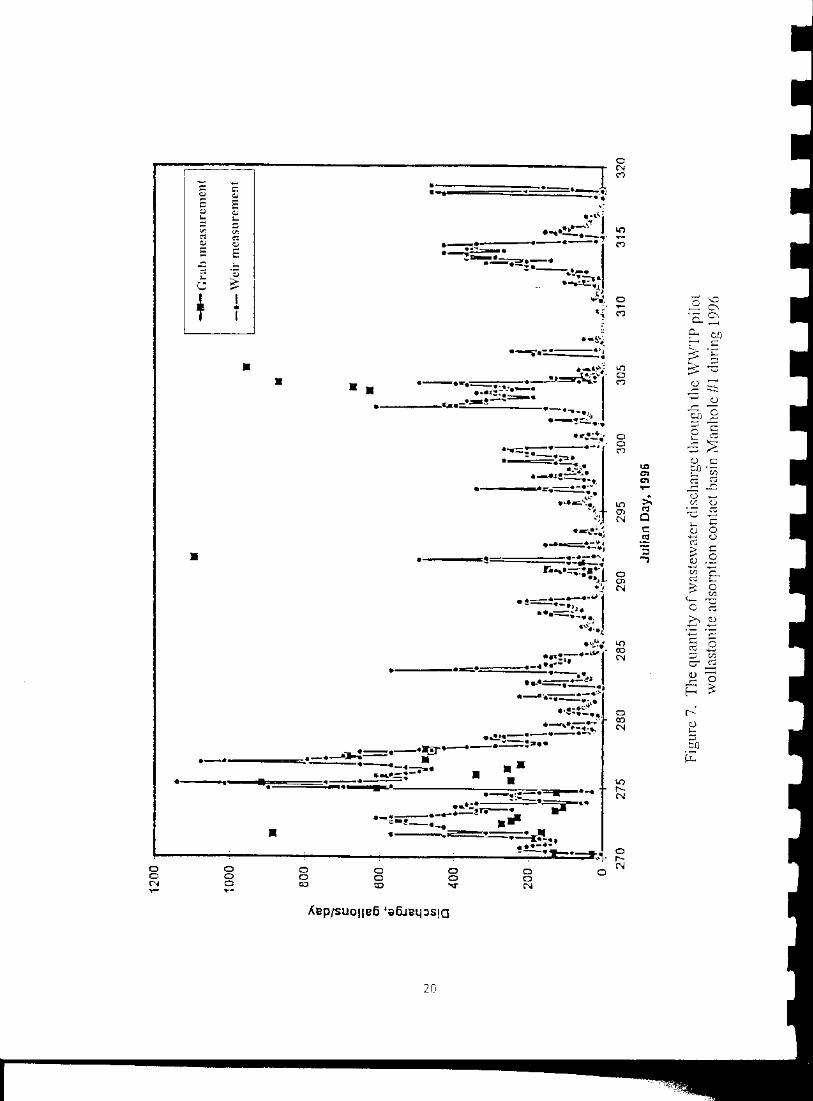
Figure 7. The quantity of wastewater discharge through the WWTP pilot wollastonite adsorption contact basin Manhole #1 during 1996................................................................................. 20
Figure 8. The quantity of wastewater discharge through the WWTP pilot wollastonite adsorption contact basin Manhole #2 during 1996................................................................................. 21
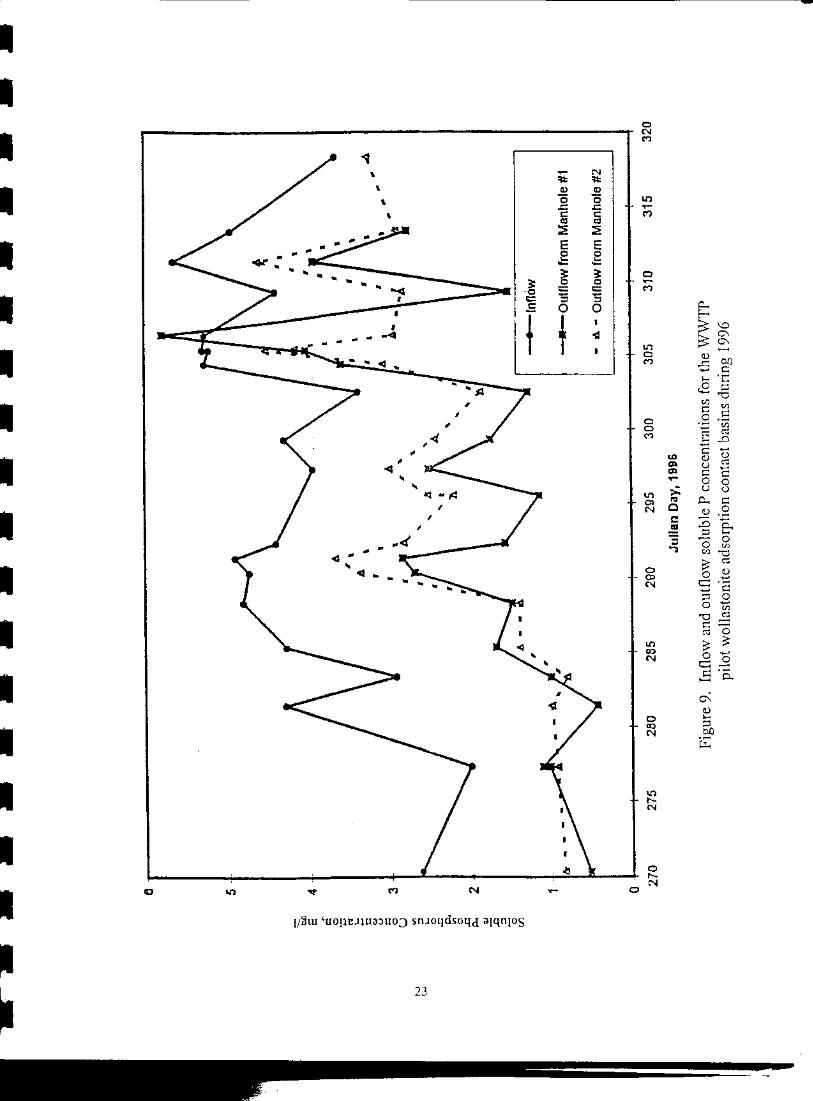
Figure 9. Inflow and outflow soluble P concentrations for the WWTP pilot wollastonite adsorption contact basins during 1996.................................................................................. 23
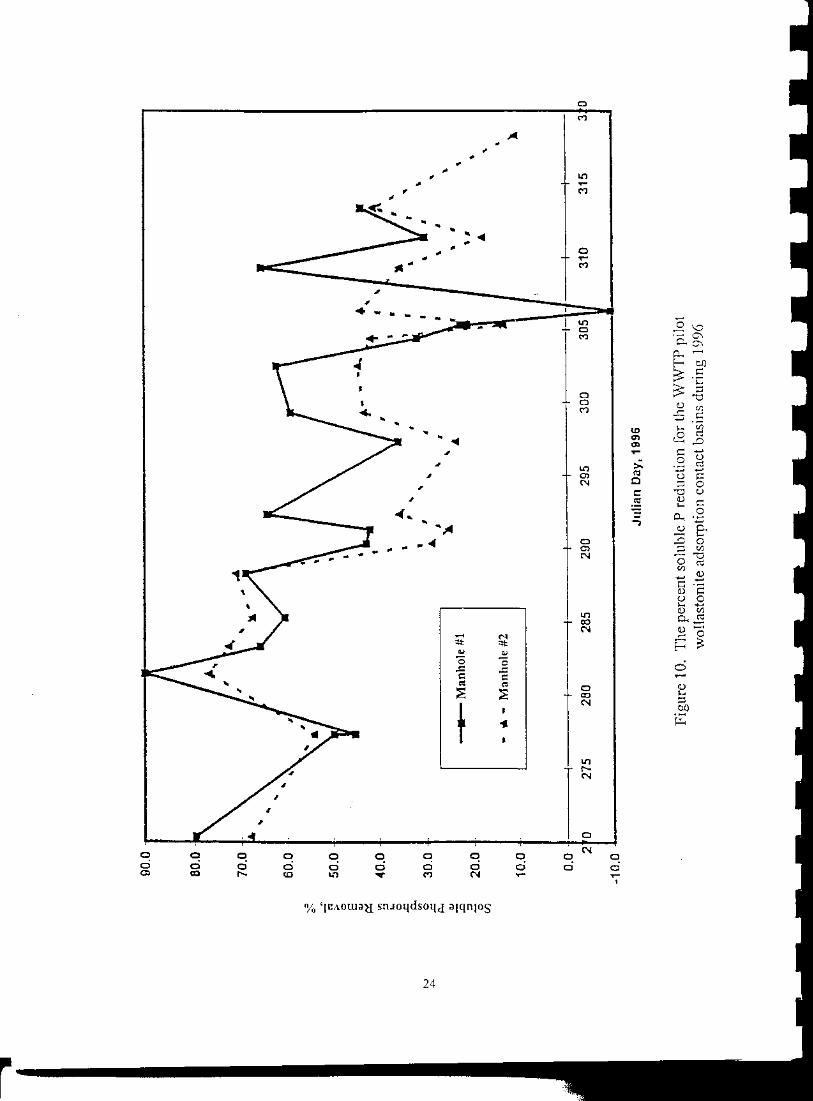
Figure 10. The percent soluble P reduction for the WWTP pilot wollastonite adsorption contact basins during 1996 ................................................................................................................ 24
Figure 11. Inflow and outflow total P concentrations for the WWTP pilot wollastonite adsorption contact basins during 1996.................................................................................................... 26
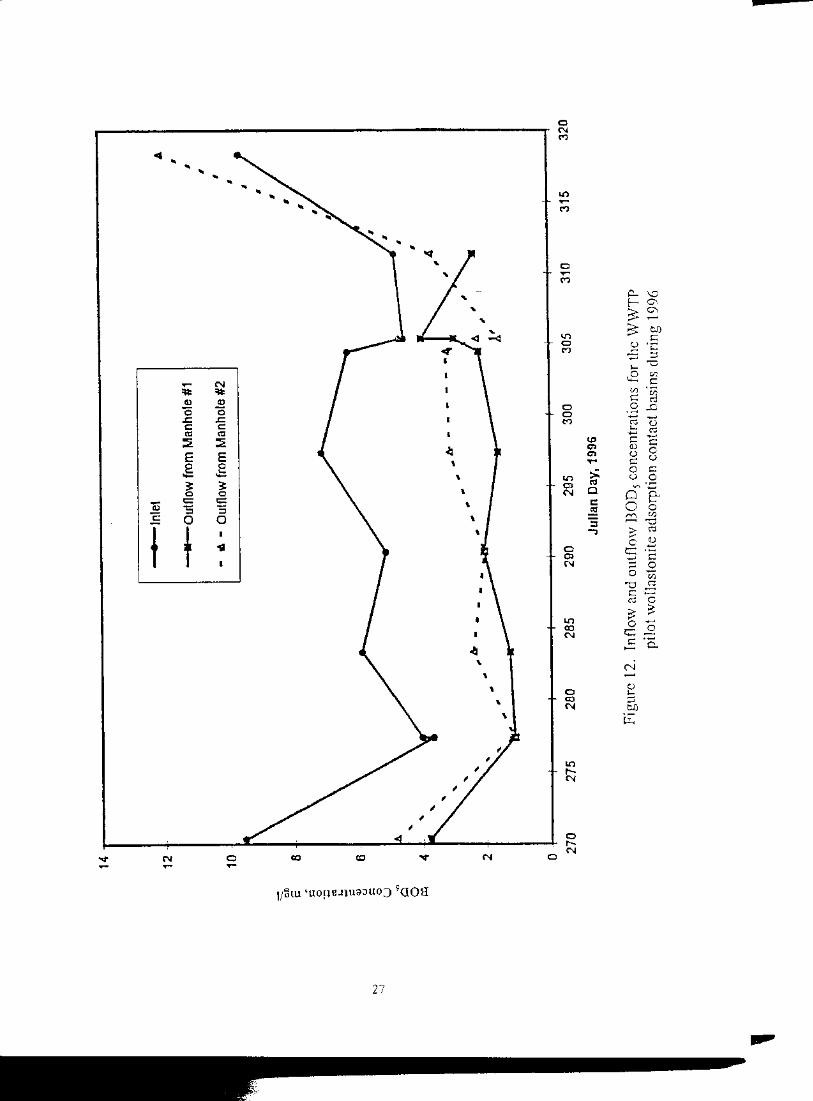
Figure 12. Inflow and outflow BOD5 concentrations for the WWTP pilot wollastonite adsorption contact basins during 1996.................................................................................................... 27

Figure 13. The percent BOD5 removal for the WWTP pilot wollastonite adsorption contact basins during 1996 ................................................................................................................ 28
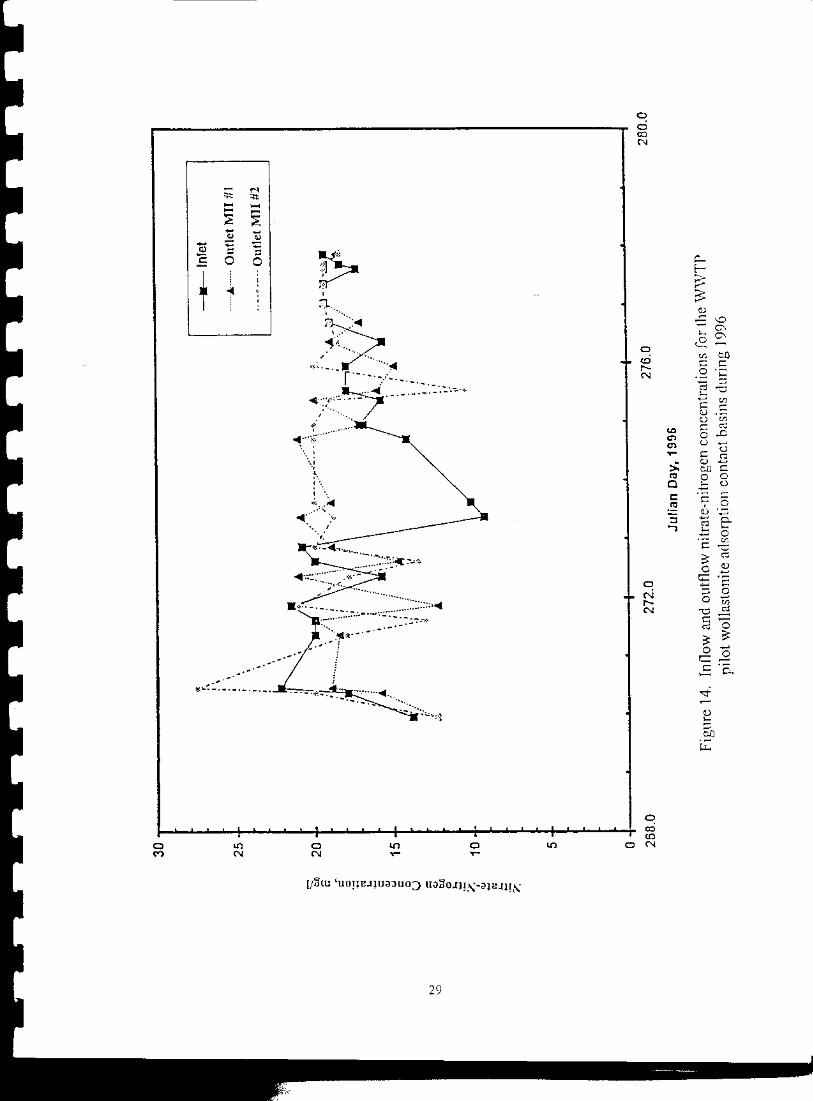
Figure 14. Inflow and outflow nitrate-nitrogen concentrations for the WWTP pilot wollastonite adsorption contact basins during 1996.................................................................................. 29
Figure 15. The quantity of wastewater discharge through the WWTP pilot wollastonite adsorption contact basin Manhole #1 during 1997............................................................... 30
Figure 16. The quantity of wastewater discharge through the WWTP pilot wollastonite adsorption contact basin Manhole #2 during 1997............................................................... 31
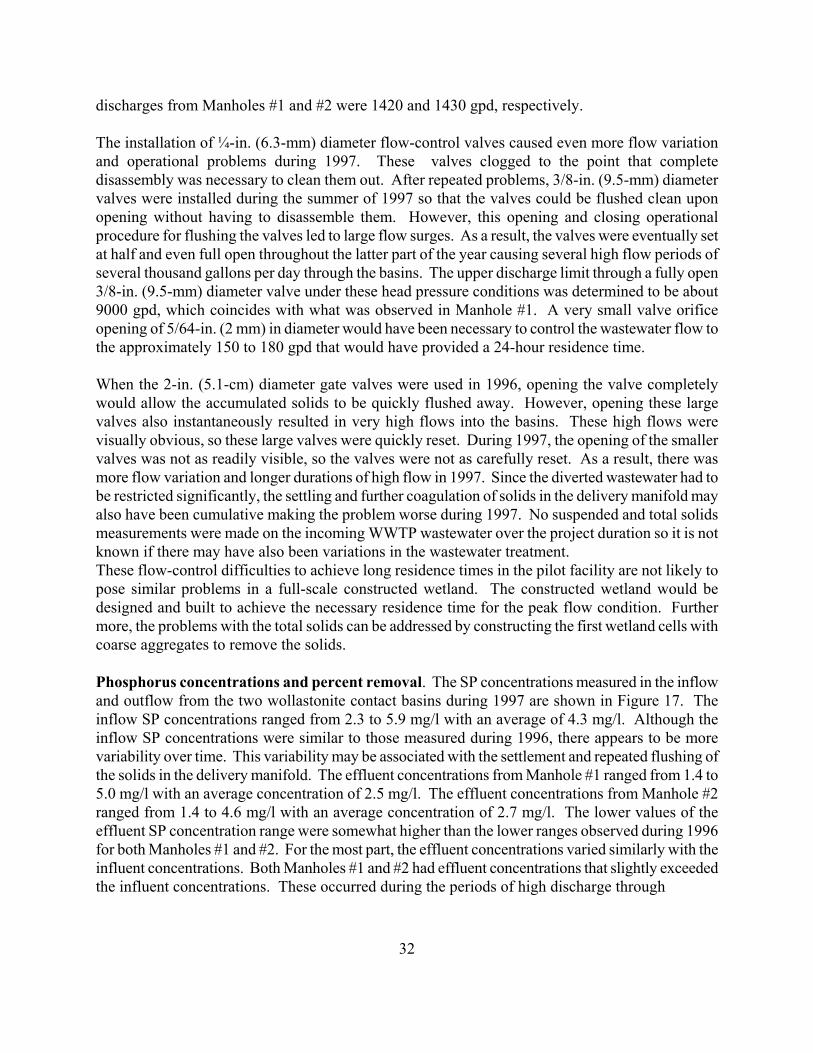
Figure 17. Inflow and outflow soluble P concentrations for the WWTP pilot wollastonite adsorption contact basins during 1997.................................................................................. 33
Figure 18. The percent soluble P reduction for the WWTP pilot wollastonite adsorption contact basins during 1997 ................................................................................................................ 35
Figure 19. Inflow and outflow total P concentrations for the WWTP pilot wollastonite adsorption contact basins during 1997.................................................................................................... 36
Figure 20. Inflow and outflow BOD5 concentrations for the WWTP pilot wollastonite adsorption contact basins during 1997.................................................................................................... 37
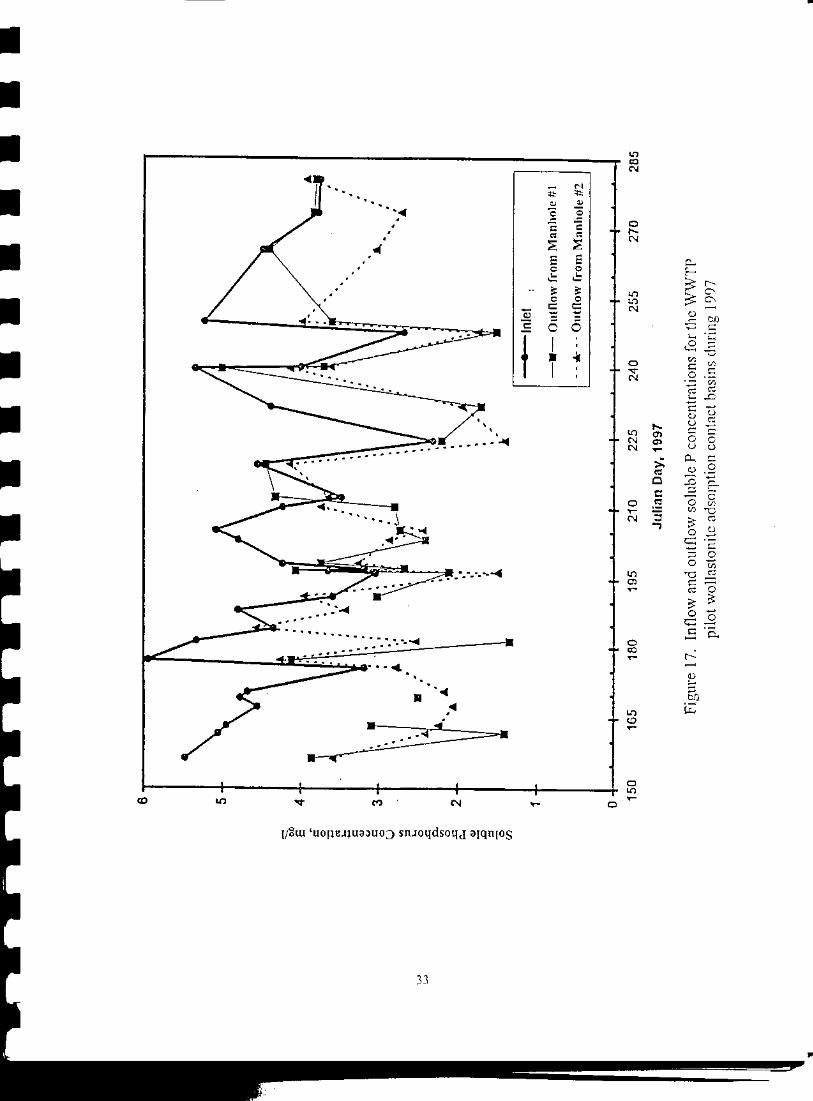
Figure 21. The percent BOD5 removal for the WWTP pilot wollastonite adsorption contact basins during 1997 ................................................................................................................ 38
Figure 22. Detailed topographic map of the WWTP site.............................................................. 42
Figure 23. The percent SP removal as a function of the hydraulic residence time for all data collected from the WWTP pilot wollastonite adsorption contact basins during 1996 and 1997....................................................................................................................................... 43
Figure 24. A subsurface-flow constructed wetland cell with a wollastonite tailings substrate.... 44

1
Executive Summary
Loadings of phosphorus (P) in wastewater discharges are detrimental to surface water quality. The addition of P to surface waters leads to increased production of algae and rooted plant biomass and reduced water clarity. While natural and constructed wetland systems have been used for secondary treatment of municipal wastewater, they have not proven effective at reducing the soluble phosphorus (SP) from wastewater discharges. Recent research, however, has indicated that a constructed subsurface-flow wetland using a substrate efficient at adsorbing P could successfully reduce SP. Laboratory experiments with wollastonite, a calcium metasilicate mineral, demonstrated that SP concentrations averaging 6 mg/l in secondary treated wastewater could be reduced to less than 0.8 mg/l provided the hydraulic residence time (the contact time of the wastewater with the wollastonite) is more than 43 hours. A pilot facility similar in design to the laboratory experiments was constructed near the Willsboro Wastewater Treatment Plant (WWTP) in Essex County, New York, to test the ability of wollastonite to remove SP. The facility operated for about 175 days during 1996 and 1997. Average SP removals of 45% and 25% were observed during 1996 and 1997, respectively, with a removal of 90% observed for a brief period during 1996. The Willsboro pilot facility was designed to treat only a small percentage of the WWTP discharge. As a result, it was difficult to control the hydraulic residence time so crucial to SP removal. The control valves that were used to regulate the gravity flow of wastewater into the pilot basins often clogged from the solids in the secondary treated wastewater. Opening the valves far enough to reduce the clogging resulted in reduced residence time. This hydraulic overloading caused the wastewater to find the easiest flow path, bypassing most of the wollastonite media. The variability in the particle size of the wollastonite tailings compounded this problem by allowing the wastewater to easily flow through the coarser particles where the SP adsorption process is least likely to occur. These problems led to higher than desirable SP concentrations in the discharge. The collected data suggests that 90% SP removal could be achieved in the pilot facility if the hydraulic residence time exceeds 62 hours. The pilot facility also removed an average of 45% of BOD5 (five-day biological oxygen demand) in the wastewater, indicating an additional benefit of the subsurface-flow wetland system. Laboratory and pilot facility results indicate that a subsurface-flow constructed wetland with a surface area of approximately 1.4 acres and a wollastonite depth of 2.5 feet should be adequate to remove 90% of the incoming SP from the WWTP. Since a constructed wetland at this site could use gravity flow, operation and maintenance costs should be reasonable.

2
Introduction
Lake Champlain is one of the largest freshwater lakes in the United States with 435 square miles of surface water and 587 miles of shoreline in New York, Vermont, and Canada. Over the last several decades the lake has undergone accelerated eutrophication, the process in which algal blooms develop, sink, and decompose, consuming the dissolved oxygen content of the water. This results in the death of aquatic life and a reduced aesthetic value for the lake. Total phosphorus (TP) concentrations in excess of 0.03 to 0.05 mg/l have been associated with these algal blooms, and several shallower areas of the lake have summer TP concentrations in this range (Lake Champlain Basin Program [LCBP], 1994). Although P enters the lake through atmospheric deposition and runoff processes, excessive P loading from man-made sources is commonly linked to the increasing eutrophication of lakes and streams. Nonpoint sources are estimated to account for about 71% of the total P loading to Lake Champlain with point sources contributing the remaining 29% (Vermont Department of Environmental Conservation and New York State Department of Environmental Conservation, 1994). The primary point source of P in the watershed is municipal wastewater treatment plants. On November 5, 1990, the Lake Champlain Special Designation Act (P.L. 101-596) established the LCBP to address the most critical lake water quality problems. Since P was defined as the limiting nutrient in Lake Champlain, the management of P levels in the lake and the quantities of P delivered to the lake was deemed to be of critical importance. One of the LCBP (1994) report recommendations was to reduce the P loads from the lake’s tributaries. The predominantly forested Boquet River tributary was estimated to contribute a relatively small P loading compared to other lake tributaries. However, an estimated 30% of the P load in the Boquet River was deemed to be the result of urban (cultural nonpoint) sources, one of the highest percentages of P load attributed to urban sources of all the lake’s tributaries. (More details regarding Lake Champlain and P loading can be found in the LCBP [1994] report). One of the likely urban sources of P (and other contaminants) in the Boquet River was the failure of existing individual subsurface sewage disposal systems adjacent to the Boquet River within the small, unsewered hamlet of Willsboro, NY. Recognizing the need to construct a centralized sewage treatment plant, the Town of Willsboro formed a Sewer District for the hamlet, which is one mile upstream from Lake Champlain. In 1994 and 1995, Willsboro installed a sewage collection and treatment plant system. The Willsboro Wastewater Treatment Plant (WWTP) is designed to treat 125,000 gallons per day (gpd) using primary settling tanks and a rotating biological contactor. The estimated design P concentration entering the WWTP is 8 mg/l for a P loading of approximately 4 lbs. per day. After primary and secondary wastewater treatment processes, the plant discharge carries measured P concentrations ranging from 2 to 6.5 mg/l TP of which approximately 85% is SP. This secondary treated wastewater effluent is currently being discharged directly into the Boquet River. No P concentration or loading limits are specified in the discharge permit under current New York regulatory policy.
3
Future requirements to further reduce P discharges to the lake will likely result in regulations mandating that P discharges from municipal wastewater treatment plants in the watershed not exceed concentrations of 0.8 mg/l. Unfortunately, the installation and maintenance costs of existing conventional chemical or biological P removal processes to achieve these low P concentrations is disproportionately expensive for low-volume treatment plants. Planners for the Town of Willsboro did not install the conventional chemical P removal features into their existing plant because they could not afford to install, operate, and maintain it. In addition to the initial capital costs of chemical mixing chamber tanks, chemical feeders, and re-circulation pumps and piping, the conventional chemical treatment process involves the continual and costly addition of a chemical precipitant such as alum or lime. These chemical precipitants bind the P with the wastewater sludge, which adds to the volume of sludge that must then be handled and disposed of, further increasing the operating costs. The upgrade of the St. Albans, Vermont, wastewater treatment plant to chemically remove P cost $2.3 million in 1987, which was about the same as the total initial cost of the entire WWTP and sewage collection system. As a result, the Town of Willsboro is seeking an alternative, low-cost wastewater treatment technology to reduce the P discharge levels from its new wastewater treatment plant. Because of the proximity of the WWTP to the Boquet River, the Town of Willsboro is interested in pursuing the use of a constructed wetland as a low-cost, alternative method to reduce P concentrations and to provide tertiary wastewater treatment. This final report of the pilot project effort, funded through the LCBP and other matching sources, will discuss the results obtained in using wollastonite mineral adsorption as an alternative method for P removal, and the potential for using wollastonite as a specialized substrate in a constructed wetland.
Background on P Removal Processes from Wastewater Standard P Removal through Primary and Secondary Treatment The achievable limit of P removal from municipal wastewater by primary sedimentation and conventional biological secondary treatment processes such as those used in the WWTP is about 2 mg P/l. This removal occurs as a result of the incorporation of soluble forms of P into the particulate or suspended solids forms, and then the removal of these suspended solids as sludge. Since most raw (incoming) municipal wastewaters range from 3 to 12 mg TP/l, the discharge will then range from 1 to 10 mg TP/l as a result of these treatment processes. Given that the WWTP effluent ranged from 3.2 to 6.8 mg TP/l, Willsboro’s raw sewage was likely around 5 to 9 mg TP/l and in the range of the estimated design P concentration value. In order to achieve lower P concentrations (or more than the removal of 2 mg/l) in the wastewater discharge from the treatment plant, additional biological and/or chemical processes and filtration are necessary. Biological P Removal Processes Some proven biological P removal processes are (1) Phostrip, (2) Modified Bardenpho, (3) A/O (anaerobic/oxic stages), (4) UCT (University of Capetown), (5) SBR (sequencing batch reactor), and (6) operationally modified activated sludge. The first three processes are commercially available

4
standardized designs. None of these biological processes can reduce P concentrations to 0.5 mg/l in the final effluent without being combined with a chemical precipitation process and/or filtration. The biological P removal processes have only been developed recently and are not suited to all municipal wastewater streams. These processes are complex in that they use specialized bacteria in suspended growth-activated sludge systems to capture and remove the soluble P from wastewater in a variety of process reactions. The basic process uses Acinetobacter bacteria, which are capable of converting and storing excess P within their cells, given the right growth conditions. Acinetobacter microorganisms prefer low fatty acids, especially acetate, as a growth substrate. Once their growth is complete, the bacteria are captured and removed with the sludge. (For greater detail on these processes see U.S. Environmental Protection Agency [1987] or Sedlak [1991].) Chemical P Removal Processes The chemical P removal processes are (1) metal salt addition and (2) lime addition. In order to achieve P removal down to 0.5 mg/l, a chemical process must be combined with filtration, or a biological process must be combined with a chemical process and filtration of the secondary clarifier effluent. The conventional chemical process of metal salt addition uses metal salts of aluminum or iron. The most commonly used metal salt is ordinary alum, which is a hydrated crystal of potassium-aluminum sulfate, KAl(SO4)2•12H2O(s). Alum is generally added upstream of either the primary or secondary clarifiers. Here the aluminum ion dissociates and forms a precipitate with the soluble phosphate ion, PO4
3- , in the form of Alx(OH)y(PO4)3(s), and settles out with the sludge. Other commonly used
metal salts are ferric chloride, FeCl3, and ferrous sulfate, Fe(SO4)2. The chemical process addition of lime, CaO, or slaked lime, Ca(OH)2, to the primary or secondary clarifiers also precipitates the phosphate ion and forms various calcium phosphates such as β-tricalcium phosphate, β-Ca3(PO4)2(s), and hydroxyapatite. Lime addition to wastewater is seldom practiced anymore because of the high chemical usage and the substantial amount of additional sludge produced in the process. Other P Removal Processes Two other techniques for removing P from municipal wastewater are the fluid bed pellet reactor and magnetic separation. According to van Starkenburg et al. (1993), the construction, operation, and maintenance costs for the fluid bed pellet reactor are more than twice those for the chemical precipitation and biological P removal methods. The cost of implementing the magnetic separation technique is somewhat less than that of the fluid bed pellet reactor and about twice the cost of chemical precipitation and biological P removal methods. As a result, these methods are not likely to be feasible options for P removal in the WWTP. Removal of P with Wetlands Constructed (and natural) wetlands have been used to provide additional treatment to municipal wastewater. Constructed wetlands, both surface and subsurface-flow types, have shown promise as

5
an inexpensive and efficient alternative in small to medium-sized communities for reducing BOD and suspended solids from secondary wastewater. The removal of P in a wetland system, however, has typically had mixed success, particularly over the long term. The decline in P removal is often attributed to a decrease in the adsorptive capacity of the wetland substrate. The general properties of wetlands that make them conducive to treatment of wastewater include high plant productivity; filtration; large adsorptive surfaces on both substrates and plant root masses; and diverse, active microbial populations. The organic sources of P are more significantly or quickly reduced or retained in wetlands by filtration and sedimentation processes. The inorganic, soluble sources of P are more difficult to remove, as removal is more dependent on adsorption and nutrient uptake processes that are a function of the overall chemical and biological solution equilibriums within the wetland system. Municipal wastewater discharges typically contain P primarily in the inorganic form because the organic forms have already been removed with the sludge in the primary and secondary treatment processes. An average wetland removal efficiency of the inorganic, soluble ortho-P form is reported to be about 37% (Kadlec and Knight, 1996). Phosphorus exists in many interchangeable chemical forms in soil, water, and plant/animal organism environments. As such, phosphorus cycling and removal in a wetland is a complex process involving biological, chemical, and physical sorption. The initial removal of P is due primarily to microbial uptake. This microbial pool, however, can quickly (within hours) become saturated. Much of the annual removal of P by plant uptake and growth is also temporary with some 35 to 75% of the P being released and returned to the wetland upon the death of the plants. Harvesting and removal of plant biomass from the wetland usually represents a very small percentage (less than 5%) of the P removed from the annual total P loading. A large amount of P can be removed gradually and stored in the rooted emergent vegetation and bottom litter as peat accretion, depending on the characteristics of the wetland. Thus, the long-term storage (removal) of P depends on this peat accretion and the geochemical adsorption to aluminum (Al), iron (Fe), and calcium (Ca) minerals present in the wetland soil system or substrate material. The adsorption process is more likely to be of significance over the long term, particularly in a subsurface-flow constructed wetland. Adsorption by the substrate is often cited in the research literature as being the primary means of P retention in a constructed wetland system. Similar to the chemical P removal processes used in wastewater treatment plants, the availability of Al, Fe, and Ca ions in the wetland substrate induces adsorption and precipitation of P into insoluble compounds. The types of compounds and the rate that they are produced depends on the pH and redox potential of the aqueous solution within the substrate. At pH less than 5, Al and Fe hydrous oxides adsorb P. At pH greater than 7, Ca is the dominant adsorber. Low redox potential promotes solubilization of P, but low redox potential also transforms Al and Fe into amorphous forms that have a higher P sorption capacity (Patrick and Khalid, 1974). The long-term effectiveness of a constructed wetland to remove P appears to be largely dependent on the physiochemical adsorption processes controlled by the type of substrate available. Once all the geochemical adsorption sites are saturated with P, P removal will again revert to more biochemical processes and be seasonal in
6
nature. However, when the substrate becomes P saturated in a constructed wetland, the substrate can be replaced or the plants can be harvested as a maintenance measure. Subsurface-flow constructed wetlands can use a variety of substrate materials. Two common wetland types are the rock-reed filter and the Root Zone Method (RZM). The rock-reed filter uses rock/gravel substrates planted with reeds (for example, Phragmites australis). The RZM consists of a shallow sand-based substrate where plant roots are encouraged to grow and proliferate throughout the entire depth. These types of constructed wetlands are more common in European countries. Light expanded clay aggregates (LECA) have been used with some success as a specialized substrate in the RZM for the removal of P. LECA is a manufactured clay-based material that is expensive and not readily available locally. Although natural clay soils contain Ca, Fe, and Al, these soils are generally inadequate as a substrate for a subsurface-flow constructed wetland because the soil pores clog with the suspended materials from the wastewater. The hydraulic conductivity of clay soils is too low for large wastewater flows. In general, the research of P removal with constructed wetlands is minimal, and the long-term results and cost-effectiveness remain uncertain.
Wollastonite Mineral Sorption of Phosphorus Background and Initial Laboratory Analysis To address the Town of Willsboro’s concern for an inexpensive method to remove P from wastewater, investigations were initiated to determine the viability of using constructed wetlands. Since the success of P removal in constructed wetlands depends largely on the substrate material, the search for a readily available, suitable, and low-cost substrate began. Four locally available potential wetland substrate materials were initially identified and evaluated: garnet (ferrous metasilicate), wollastonite tailings (calcium metasilicate mixed with ferrous metasilicate), iron ore tailings, and paper mill waste. Except for garnet, these materials are waste products of other industrial processes. The garnet and wollastonite tailings are produced by NYCO Minerals, Inc., a minerals processing plant located in Willsboro. The iron ore tailings came from the Barton Hill mine in the Adirondacks. The paper mill waste came from a former paper mill disposal lagoon in Willsboro, which is also the proposed site for the constructed wetlands. Other potential substrate materials (identified from the research literature) that were evaluated included coal fly ash and sand amended with oxidized iron or aluminum oxide. Numerous experiments to determine P adsorption isotherms for these different potential substrate materials were performed at Cornell University. In mechanical agitation tests, wollastonite was determined to be the best adsorbent of P. Wollastonite adsorbed 2 mg of P per gram of material from solutions containing a P equilibrium concentration of 1 mg/l. A 99.7% reduction in P concentration was achieved using wollastonite from effluent solutions initially containing P concentrations as high as 1000 mg/l. Garnet adsorbed 0.13 mg of P per gram of garnet at the 1 mg/l equilibrium concentration. At P concentrations expected in the wastewater effluent, the iron tailings
7
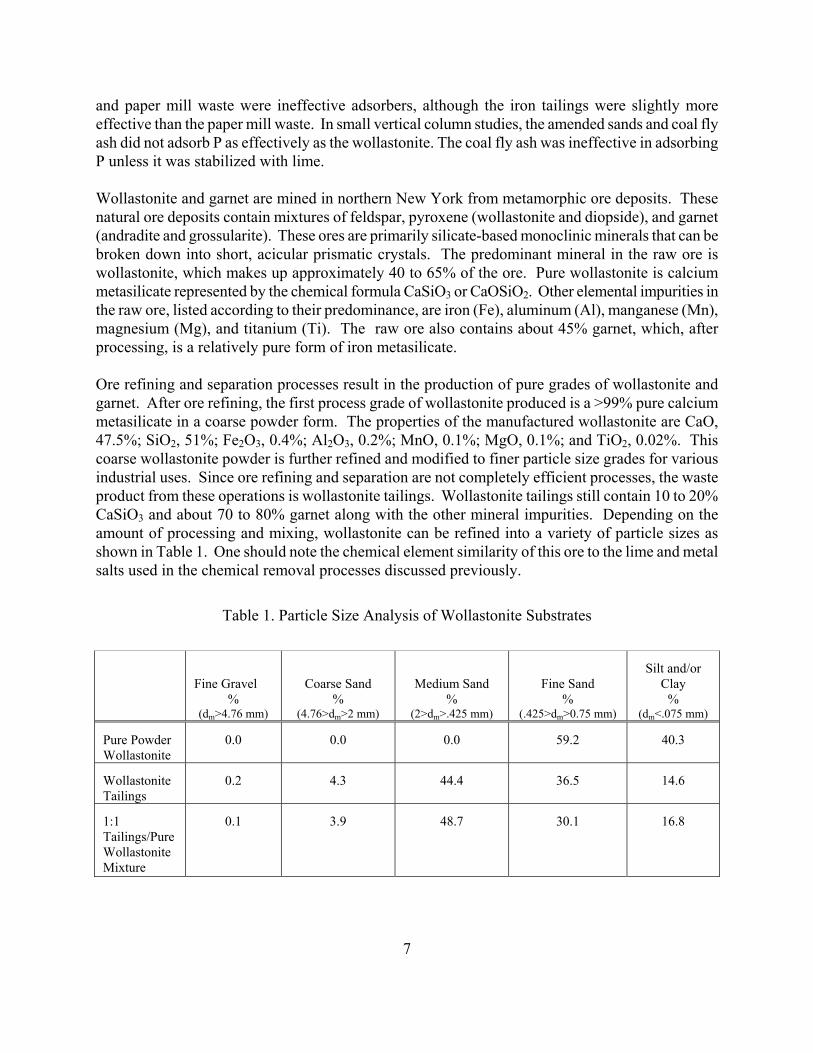
and paper mill waste were ineffective adsorbers, although the iron tailings were slightly more effective than the paper mill waste. In small vertical column studies, the amended sands and coal fly ash did not adsorb P as effectively as the wollastonite. The coal fly ash was ineffective in adsorbing P unless it was stabilized with lime. Wollastonite and garnet are mined in northern New York from metamorphic ore deposits. These natural ore deposits contain mixtures of feldspar, pyroxene (wollastonite and diopside), and garnet (andradite and grossularite). These ores are primarily silicate-based monoclinic minerals that can be broken down into short, acicular prismatic crystals. The predominant mineral in the raw ore is wollastonite, which makes up approximately 40 to 65% of the ore. Pure wollastonite is calcium metasilicate represented by the chemical formula CaSiO3 or CaOSiO2. Other elemental impurities in the raw ore, listed according to their predominance, are iron (Fe), aluminum (Al), manganese (Mn), magnesium (Mg), and titanium (Ti). The raw ore also contains about 45% garnet, which, after processing, is a relatively pure form of iron metasilicate. Ore refining and separation processes result in the production of pure grades of wollastonite and garnet. After ore refining, the first process grade of wollastonite produced is a >99% pure calcium metasilicate in a coarse powder form. The properties of the manufactured wollastonite are CaO, 47.5%; SiO2, 51%; Fe2O3, 0.4%; Al2O3, 0.2%; MnO, 0.1%; MgO, 0.1%; and TiO2, 0.02%. This coarse wollastonite powder is further refined and modified to finer particle size grades for various industrial uses. Since ore refining and separation are not completely efficient processes, the waste product from these operations is wollastonite tailings. Wollastonite tailings still contain 10 to 20% CaSiO3 and about 70 to 80% garnet along with the other mineral impurities. Depending on the amount of processing and mixing, wollastonite can be refined into a variety of particle sizes as shown in Table 1. One should note the chemical element similarity of this ore to the lime and metal salts used in the chemical removal processes discussed previously.
Table 1. Particle Size Analysis of Wollastonite Substrates
Fine Gravel %
(dm>4.76 mm)
Coarse Sand %
(4.76>dm>2 mm)
Medium Sand %
(2>dm>.425 mm)
Fine Sand %
(.425>dm>0.75 mm)
Silt and/or
Clay %
(dm<.075 mm) Pure Powder Wollastonite
0.0
0.0
0.0
59.2
40.3
Wollastonite Tailings
0.2
4.3
44.4
36.5
14.6
1:1 Tailings/Pure Wollastonite Mixture
0.1
3.9
48.7
30.1
16.8

8
Since the rate of P sorption is affected by the grain size of a material and the pH of the solution, some of the laboratory work focused on these aspects. If the grain size had to be quite small to achieve significant P adsorption, the material would not be hydraulically suitable as a wetland substrate. Likewise, the pH most conducive to P adsorption would have to be in the range of the wastewater effluent. Initially, wollastonite ore and tailings were sieved into two different grain sizes, categorized as coarse and fine. All the coarse grained material ranged in size from 0.425 to 2.0 mm in diameter, having been passed through a standard United States #10 sieve but retained on a #40 sieve. All the fine grained material passed through the #40 sieve so all particles and aggregates were less than 0.425 mm in diameter. In later column studies, the tailings were mixed with the pure manufactured powder. Some of the physical properties of these materials are shown in Table 2.
Table 2. Physical Properties of Wollastonite and Garnet Materials
Substrate
Porosity %
Bulk Density g/cc
Saturated Hydraulic
Conductivity (m/day)
Wollastonite Tailings (bulk form)
0.33 to 0.41
2.10
7 to 19
Garnet
—
2.28
276
Coarse Wollastonite
0.46
1.84
— Fine Wollastonite (Sieved)
0.36
2.25
—
Pure Powder Wollastonite
0.47 to 0.63
—
5 to 7.3
1:1 Wollastonite Tailing Powder
0.5
—
1.7 to 6.3
The effect of the wollastonite grain size and the wastewater pH on the percent P removal is shown in Figures 1 and 2. Figure 1 indicates that the coarse wollastonite material was able to remove up to 38% of the incoming P after the neutral pH wastewater flowed across the 100-cm distance of the column. The results of P removal with the coarse wollastonite are inconsistent with respect to both the pH and the column length. These results are believed to be caused by the extreme spatial distribution of available adsorption sites in the coarse wollastonite. The coarse wollastonite contains variable amounts of Ca, Fe, and Al within the individual ore aggregates. The wollastonite ore aggregate sizes also vary spatially throughout the columns, partially as a result of separation during the filling of the columns.


10
The results of P removal using the fine wollastonite material, shown in Figure 2, are more consistent. The finer grain size, with more total surface area and adsorption reaction sites, increased the removal of P up to 90%. The highest P removal occurred at pH 7 at the end of the 100-cm-length column. The available Ca, Fe, and Al bonding sites seem to be more uniformly distributed in the columns when the aggregates are broken down. The data in Figure 2 suggest that the effect of the wastewater pH on P removal is minimal since phosphorus can bind with either the Ca, Fe, or Al present in the wollastonite. The lowest percent P removal at pH 6.0 coincides with the transition point at which various calcium phosphates become more soluble, even though the iron and aluminum phosphates are attaining their lowest solubilities (see Sedlak, 1991). For a summary of the details of the students’ laboratory experiments, see Brooks (1997), Geohring et al. (1995), and Rozenwald (1997). Sorption is a nonspecific term used to describe the removal of a compound by a substrate matrix. Sorption can include both adsorption and precipitation. Sorption of P by soils is typically a multi-step process, proceeding initially with a rapid reaction which diminishes quickly to a much slower reaction. It is reasonable to assume that the same multi-step process will occur with wollastonite. It is believed that the initial high removal of P is due to the direct adsorption on the outer surfaces of the substrate particles and to the formation of insoluble precipitates. The ensuing slower removal is either by precipitation or adsorption within the interstitial porosity. In order to maximize the removal of P, the contact time of the wastewater with the wollastonite must be long enough for both the rapid and slow reactions to occur. A better understanding of the exact P sorption process to the wollastonite would help determine whether or not wollastonite will work efficiently over the long term as a passive adsorption bed or whether it will require some form of mechanical agitation. The nature of the phosphate ion, which allows for either ion exchange or ligand exchange at most substrate and bio-organism surfaces, lends itself quite readily to adsorption. Hydroxyapatite, Ca5(PO4)3(OH)(s), is a common calcium phosphate compound that is stable under typical natural water conditions. The expected equilibrium concentration of phosphate in vertical flow columns (or a constructed wetland), based on solubility calculations of this compound, is shown below: Ca5(PO4)3(OH)(s)→5Ca2+ + 3PO4
3- + OH- ; Kso = 10-55.9
[Ca2+]5 [PO43-]3 [OH-] = 10-55.9
where Kso is the solubility constant. Typical pH values measured in the laboratory column effluents were close to 8.5 and the [Ca2+] measured in solutions that were shaken with wollastonite averaged 2.2 × 10⁻⁴ M (9 mg/L). Substituting these values into the equation above yields the following solution:
(2.2 × 10⁻⁴)5 [PO43-]3 (10-5.5) = 10-55.9
[PO43-] = 1.9 × 10⁻¹¹ M
or

11
5.9 × 10⁻⁴ g/l as phosphorus Based on this calculation, precipitation is possible in solutions with concentrations of phosphate greater than 0.59 mg/l, which is a low concentration for secondary treated wastewater. Additional Laboratory Analysis—Determining a Residence Time The sorption process is not an instantaneous reaction. Research indicates that a lengthy residence time (the contact time of P in the wastewater and the wollastonite) facilitates high or more complete P removal. In order to maximize P removal, a hydraulic residence time of two or more days appears necessary. Soluble phosphorus removal from secondary wastewater by wollastonite was measured in the laboratory using vertical upflow columns with hydraulic residence times varying from 15 to 180 hours. The vertical upflow columns were constructed with 15-cm-diameter polyvinyl chloride (PVC) tubes cut to 1.5-m lengths with sampling ports located 10 cm from the top of each column. The columns were capped at the base with a circular piece of PVC with a port in the center that served as the influent connection. Figure 3 shows the general layout of a filled vertical upflow column.
Figure 3. Schematic of vertical upflow

13
QhrT φπ 2
=
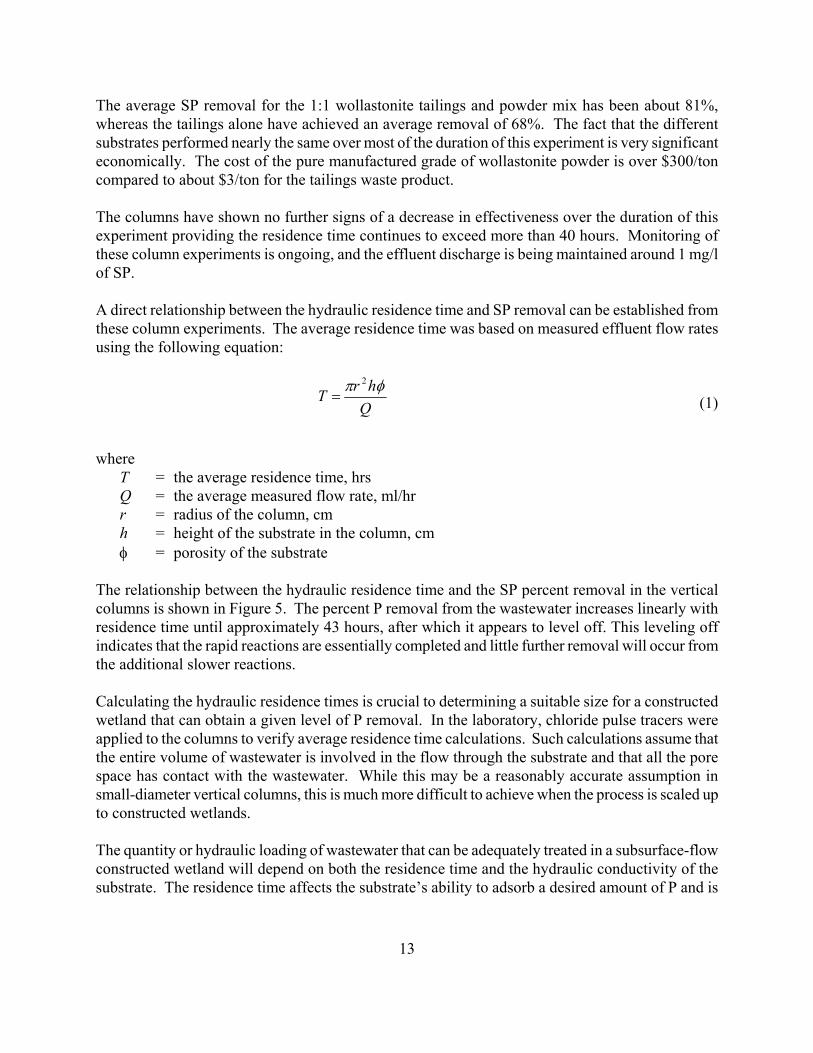
The average SP removal for the 1:1 wollastonite tailings and powder mix has been about 81%, whereas the tailings alone have achieved an average removal of 68%. The fact that the different substrates performed nearly the same over most of the duration of this experiment is very significant economically. The cost of the pure manufactured grade of wollastonite powder is over $300/ton compared to about $3/ton for the tailings waste product. The columns have shown no further signs of a decrease in effectiveness over the duration of this experiment providing the residence time continues to exceed more than 40 hours. Monitoring of these column experiments is ongoing, and the effluent discharge is being maintained around 1 mg/l of SP. A direct relationship between the hydraulic residence time and SP removal can be established from these column experiments. The average residence time was based on measured effluent flow rates using the following equation:
(1)
where
T = the average residence time, hrs Q = the average measured flow rate, ml/hr r = radius of the column, cm h = height of the substrate in the column, cm φ = porosity of the substrate
The relationship between the hydraulic residence time and the SP percent removal in the vertical columns is shown in Figure 5. The percent P removal from the wastewater increases linearly with residence time until approximately 43 hours, after which it appears to level off. This leveling off indicates that the rapid reactions are essentially completed and little further removal will occur from the additional slower reactions. Calculating the hydraulic residence times is crucial to determining a suitable size for a constructed wetland that can obtain a given level of P removal. In the laboratory, chloride pulse tracers were applied to the columns to verify average residence time calculations. Such calculations assume that the entire volume of wastewater is involved in the flow through the substrate and that all the pore space has contact with the wastewater. While this may be a reasonably accurate assumption in small-diameter vertical columns, this is much more difficult to achieve when the process is scaled up to constructed wetlands. The quantity or hydraulic loading of wastewater that can be adequately treated in a subsurface-flow constructed wetland will depend on both the residence time and the hydraulic conductivity of the substrate. The residence time affects the substrate’s ability to adsorb a desired amount of P and is


15
used to determine the overall size or volume of the constructed wetland and the necessity for flow-controls. The hydraulic conductivity determines the rate or amount of water that can flow through the substrate per unit of time and is used to determine an appropriate flow direction and configuration of the subsurface-flow wetland. The average flow velocity of the wastewater through the substrate will be limited by either the residence time or the hydraulic conductivity. If the hydraulic conductivity of the substrate limits the wastewater flow through the substrate, the wastewater will quickly surface in a full-scale constructed wetland and will not come into contact with all the substrate. In the laboratory study, the residence time average flow velocity, and not the hydraulic conductivity of the wollastonite tailings or the 1:1 tailings powder mixture, was the limiting factor. Consequently, P removal by the wollastonite substrate should be possible with a properly designed subsurface-flow constructed wetland. One must question what eventually happens to the substrate when it becomes P saturated and is no longer effective in adsorption and precipitation of P. Will there be desorption of P? How long will this take? What does one do with the P-saturated wollastonite? Predictive calculations using the adsorption isotherm data (2 mg P/g wollastonite) and the anticipated P loading from the WWTP (4 lbs. or 1.81 kg of P/day) indicate that about 0.91 kg (2.0 lbs.) of wollastonite would be used each day. The volume (and weight) of wollastonite required to achieve an adequate hydraulic residence time will far exceed this sorption amount. This suggests that, theoretically, the wollastonite should last a very long time. However, the answers to all these questions have not yet been fully determined. What will one do with the wollastonite when it stops adsorbing P? It is of interest to note that the principal natural form of P in the environment exists as phosphate rock with the chemical form Ca3(PO4)2. Elemental P is made from phosphate rock by reducing it with coke in the presence of sand and heating it. The chemical equation takes the form:
Ca3(PO4)2(s) + 3SiO2(s) + 5C(s) → 3CaSiO3 + 5CO(g) + P2(g) This reaction carried out at high temperature produces a gaseous form of P which is separated from the carbon monoxide and condensed to a solid by running the product gases through water (Sienko and Plane, 1966). A by-product of this reaction is wollastonite. The solid elemental P is used to produce pentoxide, P2O5, the basic ingredient of P fertilizer. Since heat must be added to force the chemical reaction from the left-hand side of the equation to the right-hand side, the natural, and more stable, chemical reaction process is in the reverse direction (right to left). The gaseous form of P is highly unstable under natural conditions. However, whether the reverse reaction remains true with soluble phosphate combined with wollastonite cannot be directly implicated. The chemistry of mixing wastewater and wollastonite is complex, but it appears that the P that is removed from the wastewater and bound to the wollastonite substrate can be later recycled and land applied. Although the P adsorption capacity of soils is finite, after 88 years of rapid infiltration of wastewater into a sandy soil at Calumet, Michigan, concentrations of P leaching to groundwater are stable at around 0.1 to 0.4 mg/l (Tchobanoglous and Burton, 1991).
16
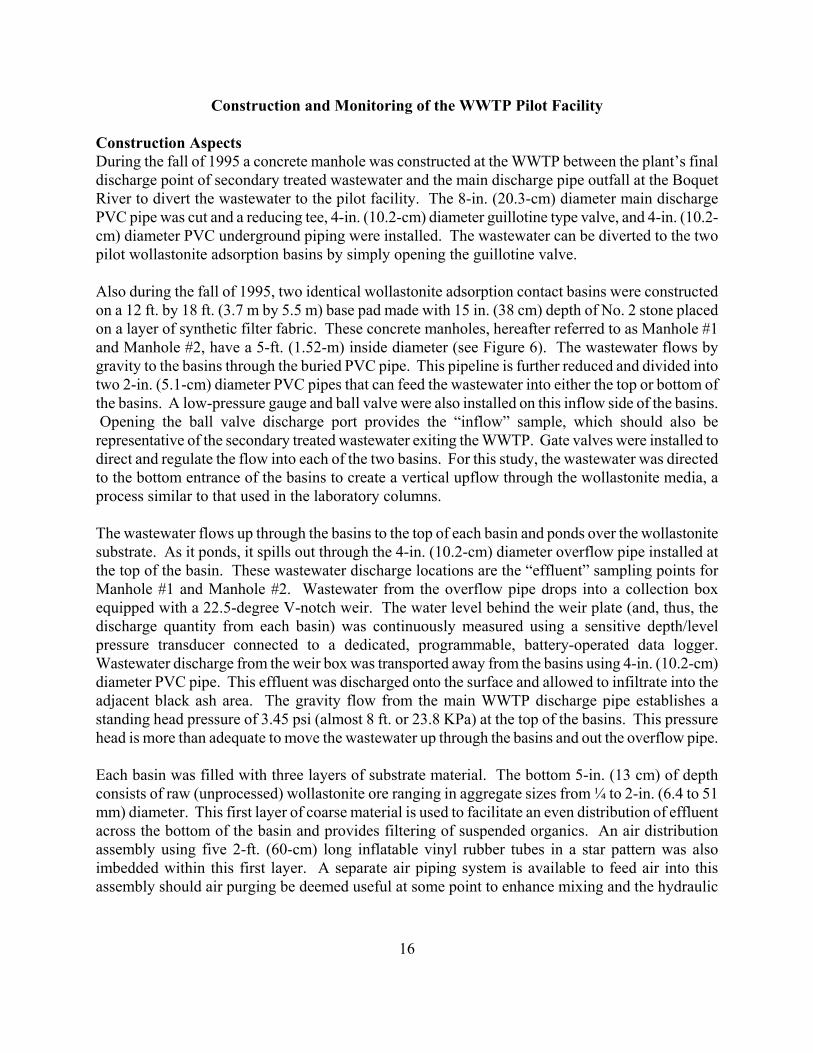
Construction and Monitoring of the WWTP Pilot Facility Construction Aspects During the fall of 1995 a concrete manhole was constructed at the WWTP between the plant’s final discharge point of secondary treated wastewater and the main discharge pipe outfall at the Boquet River to divert the wastewater to the pilot facility. The 8-in. (20.3-cm) diameter main discharge PVC pipe was cut and a reducing tee, 4-in. (10.2-cm) diameter guillotine type valve, and 4-in. (10.2-cm) diameter PVC underground piping were installed. The wastewater can be diverted to the two pilot wollastonite adsorption basins by simply opening the guillotine valve. Also during the fall of 1995, two identical wollastonite adsorption contact basins were constructed on a 12 ft. by 18 ft. (3.7 m by 5.5 m) base pad made with 15 in. (38 cm) depth of No. 2 stone placed on a layer of synthetic filter fabric. These concrete manholes, hereafter referred to as Manhole #1 and Manhole #2, have a 5-ft. (1.52-m) inside diameter (see Figure 6). The wastewater flows by gravity to the basins through the buried PVC pipe. This pipeline is further reduced and divided into two 2-in. (5.1-cm) diameter PVC pipes that can feed the wastewater into either the top or bottom of the basins. A low-pressure gauge and ball valve were also installed on this inflow side of the basins. Opening the ball valve discharge port provides the “inflow” sample, which should also be representative of the secondary treated wastewater exiting the WWTP. Gate valves were installed to direct and regulate the flow into each of the two basins. For this study, the wastewater was directed to the bottom entrance of the basins to create a vertical upflow through the wollastonite media, a process similar to that used in the laboratory columns. The wastewater flows up through the basins to the top of each basin and ponds over the wollastonite substrate. As it ponds, it spills out through the 4-in. (10.2-cm) diameter overflow pipe installed at the top of the basin. These wastewater discharge locations are the “effluent” sampling points for Manhole #1 and Manhole #2. Wastewater from the overflow pipe drops into a collection box equipped with a 22.5-degree V-notch weir. The water level behind the weir plate (and, thus, the discharge quantity from each basin) was continuously measured using a sensitive depth/level pressure transducer connected to a dedicated, programmable, battery-operated data logger. Wastewater discharge from the weir box was transported away from the basins using 4-in. (10.2-cm) diameter PVC pipe. This effluent was discharged onto the surface and allowed to infiltrate into the adjacent black ash area. The gravity flow from the main WWTP discharge pipe establishes a standing head pressure of 3.45 psi (almost 8 ft. or 23.8 KPa) at the top of the basins. This pressure head is more than adequate to move the wastewater up through the basins and out the overflow pipe. Each basin was filled with three layers of substrate material. The bottom 5-in. (13 cm) of depth consists of raw (unprocessed) wollastonite ore ranging in aggregate sizes from ¼ to 2-in. (6.4 to 51 mm) diameter. This first layer of coarse material is used to facilitate an even distribution of effluent across the bottom of the basin and provides filtering of suspended organics. An air distribution assembly using five 2-ft. (60-cm) long inflatable vinyl rubber tubes in a star pattern was also imbedded within this first layer. A separate air piping system is available to feed air into this assembly should air purging be deemed useful at some point to enhance mixing and the hydraulic


18
conductivity of the media. However, no air purging was done during these initial evaluations. The second layer of substrate consists of a 3-in. (7.6-cm) depth of garnet that was separated from the wollastonite during processing of the ore. The garnet is a uniformly graded material about 1/8 in. (3.2 mm) in diameter and provides another layer for substrate gradation. The third and final layer consists of a 36-in. (91.4-cm) depth of wollastonite tailings, the primary adsorption medium. Another 225 lbs. (102 kg) of pure processed wollastonite powder (equivalent to about a 2-in. [5-cm] depth in dry bulk) was mixed into the top 12-in. (30.5 cm) of wollastonite tailings. Since the wollastonite powder has a much finer texture than the tailings (see Table 1), the total depth of the third layer was still about 36-in. (91.4 cm) after mixing. When the first wastewater flow was diverted to fill the basins, the substrate material settled several inches. This was also observed in the laboratory columns where the amount of settling increased as more pure powder wollastonite (which settled the most) was mixed with the tailings (which settled the least). With the tailings, this settling decreased the porosity an average of 3%. Most of the settling in the pilot basins is believed to have occurred as the garnet and wollastonite tailings material filled the larger void spaces of the ore aggregates, and as the pure wollastonite settled within the tailings. No synthetic geotextile fabrics were used to try to eliminate this settling and assure particle separation. Instead, additional tailings were added to fill the basin to the original level of the overflow pipe. Monitoring Aspects Wastewater was diverted to the wollastonite adsorption contact basins, and flow measurement and sampling began on September 26, 1996 (Julian Day 270). Wastewater was continuously diverted to the basins up to November 13, 1996 (Julian Day 318) during the first year of operation. Since the pilot basins were not constructed to a winterized condition, the wastewater diversion was shut down due to freezing conditions on November 13. At this time, the diversion piping and lower drain ports on the basins were opened to allow them to drain. Inflow and effluent water samples were manually collected from the same location via a grab sample method at a rate of three times per week and sometimes more frequently. A Cornell University employee or the Town of Willsboro treatment plant operator collected all the samples. Samples were generally collected at the same time in the early morning. All water samples for P analysis were collected in new, high-density polyethylene 125-ml wide-mouth bottles manufactured to strict DOT-2E specifications. Additional water samples were also collected in new 500-ml bottles for BOD5 analysis at the rate of one per week. The collection procedure was to rinse the sample bottle twice with the wastewater being collected prior to filling and tightly capping it. The date, time, sample location, and time it took to fill each bottle were recorded on a label and attached to each sample bottle. Usually two samples were collected from each location during each sampling event. All BOD5 samples, and one of every three P samples, were immediately refrigerated to 4°C and transported on ice in portable coolers to the Boquet River Association Environmental Laboratory (BRASS - NYS Certification 111407) for SP, TP, and BOD5 analysis on the same day. Since the BRASS lab only accepted samples one day per week, the remaining samples were frozen for later analysis. Usually within 2 to 3 weeks, these frozen samples were transported in iced coolers and analyzed at Cornell University for SP, TP, and nitrate-nitrogen (NO3-N).

19
The BRASS laboratory reports sample quality control for various criteria as: 1) SP calibration curve R2 = 0.9999, 2) TP calibration curve R2 = 0.9998, 3) SP filter blank = 0.00 mg/l, 4) range SP lab sample split = 0.03 mg/l, and 5) range TP lab sample split = 0.01 mg/l. At the Cornell laboratory, the SP calibration curve R2 = 0.9998 over the range of 0 to 10 mg/l SP when a filter with a 400-nm wavelength was used. Spectrophotometer calibrations were performed using 350-, 400-, 450-, and the recommended 880-nm wavelengths to determine the most linear calibration. The range in a SP lab sample split was 0.05 mg/l. Each pair of one influent and two effluent grab samples (from Manhole #1 and Manhole #2) were collected at the same time. Because of the varying residence time in the basins, the treated effluent samples are not necessarily representative of the same volume of water sampled at the inflow. However, for lack of a better way to present the following sample concentration data results, the data are presented on a real-time scale. As a result, the calculations of percent removal for each parameter are based on the sample concentration results from samples taken at the same time. Since the wastewater inflow concentrations of P and BOD5 can be highly variable in a short time span, and because of the variable hydraulic residence times through the basins, this variability carries through in much of the data presented herein. Pilot Facility Operation and Maintenance Aspects During the spring of 1997, the wollastonite adsorption basins were repaired and re-plumbed with different flow-control valves. Some of the plastic gate valves had developed cracks. Smaller diameter ball valves were installed in an attempt to improve the control of uniform, low flow rates to better regulate the hydraulic residence time. It was also anticipated that the smaller valves would increase the flow velocity through the valve and reduce the likelihood of clogging by the total solids. Since electricity was not available at the site and the intent was to demonstrate that this system could function via gravity flow, pumps were not considered as a viable way to provide more uniform flow-control through the pilot facility. The wollastonite substrate material settled several more inches during the course of operation during 1996. Thus, in the spring of 1997, additional wollastonite tailings and pure wollastonite powder were again added to bring the media to the same level as the discharge port. Once this maintenance was performed, wastewater from the WWTP was diverted into the basins starting on June 4, 1997 (Julian Day 155), and flow measurement and sampling commenced similar to that described for 1996. The operation of the pilot facility continued until October 7, 1997 (Julian Day 280), at which time the basins were shut down and drained.
Monitoring Results of the WWTP Pilot Wollastonite Basins Monitoring Results of 1996 Discharge rates
The wastewater diversion discharges through Manholes #1 and #2 over the approximately 50 days of operation during 1996 are presented in Figures 7 and 8, respectively. The discharge varied from 0 to a high of 1150 gpd in Manhole #1, and from 0 to 1500 gpd in Manhole #2. Since the experimental objective was for the flow-control valve settings to remain unchanged, the variability in the discharge is largely the result of the total solids in the wastewater blocking the


22
valve orifices. During some time periods the flow stopped completely and the valve had to be opened to flush out the debris. Depending on who was sampling and opening the valve, it was not always reset in the same manner. The apparent discrepancy between the weir and grab sample flow measurements is due to inherent error in the transducer measurements, and the weir measurement representing an average flow value over a two-hour period compared to the grab measurement. The average weir-measured discharge was 155 and 260 gpd for Manhole #1 and Manhole #2, respectively. The experimental objective during basin operation in 1996 was to set the flow-control valves to achieve around 150 to 180 gpd to allow for a 24-hour residence time in the basins. It should be noted that the amount of residence time to achieve significant removal of P was not yet known at the outset of this project. The discharge from Manhole #1 was generally less than that of Manhole #2 (note the discharge scale of the graphs). The difficulty in achieving a uniform flow through the basins was the basis for changing the flow-control valves during the spring of 1997. Phosphorus concentrations and percent removal. The SP concentrations measured in the inflow and outflow from the two wollastonite contact basins during 1996 are shown in Figure 9. The inflow SP concentration ranged from 2.0 to 5.7 mg/l with an average of 4.2 mg/l. The SP concentrations in the effluent from Manhole #1 was more variable than that from Manhole #2, ranging from 0.4 to 5.8 mg/l with an average of 2.2 mg/l. The effluent from Manhole #2 ranged from 0.8 to 4.6 mg/l with an average concentration of 2.5 mg/l. The SP concentration in the effluents of Manholes #1 and #2 were generally similar and less than the influent concentration except during one sampling event when the effluent from Manhole #1 exceeded the value of the influent. This exception occurred simultaneously with a high discharge through Manhole #1. The higher average effluent SP concentration from Manhole #2 coincides with the higher average discharge through that manhole and the associated reduction in residence time. The calculated inflow versus outflow percent SP removal through the basins during 1996 is shown in Figure 10. These percentages ranged from -10% at one point to a high of 90% removal at another, with both extremes occurring in Manhole #1. The -10% SP removal coincided with the high discharge of about 900 gpd through Manhole #1 at that time. The average SP removal was 49% and 42% for Manholes #1 and #2, respectively. The percent SP removal gradually declined over this measurement period with a rapid decline occurring in Manhole #2 after the first 20 days of operation. The rapid decline in Manhole #2 coincides with the high discharge (approximately 1500 gpd) through Manhole #2 at that time. The higher average discharge and lower residence time through Manhole #2 is likely the reason for the lower average percent SP removal for Manhole #2. The variability in the percent SP removal for both basins can be correlated to the variability in the discharge through the basins. When the flow increased, the percent SP removal decreased. When the flow was reduced again, the percent SP removal increased. These results indicate the importance of maintaining a uniform flow through the wollastonite while simultaneously achieving an adequate residence time. The operational procedure to deal with the clogging flow-control valves was to suddenly open them wide in an attempt to flush them. This caused hydraulic overload and preferential flow of the wastewater through the wollastonite, and added to the variability in the results.
25
Total P concentrations in the inflow and outflow through the basins during 1996 is shown in Figure 11. Inflow TP concentrations ranged from 3.9 to 6.2 mg/l and averaged 5.1 mg/l. For Manhole #1 the range of TP concentrations in the outflow was from 1.1 to 6.5 mg/l with an average of 3.0 mg/l. Manhole #2 outflow TP concentrations ranged from 1.0 to 5.3 mg/l with an average of 3.4 mg/l. The percentage of TP removal with the wollastonite basins averaged 40% and 33% for Manholes #1 and #2, respectively. Both the TP concentrations and the percent TP removal followed similar trends as those for the SP. The variations in effluent concentrations of TP and the percent removal of TP can also be correlated to the discharge variations.
Biological oxygen demand. The five-day biological oxygen demand (BOD5) concentrations measured in the inflow and outflow from the two wollastonite contact basins during 1996 are shown in Figure 12. Inflow BOD5 averaged 6.0 mg/l and ranged from 3.7 to 9.6 mg/l. The average outflow BOD5 concentrations were 2.3 mg/l and 3.4 mg/l for Manholes #1 and #2, respectively. The range of outflow BOD5 concentrations from 1.1 to around 4 mg/l were similar for the two basins except for the last sample from Manhole #2, which was taken on a day of freezing weather. No sample could be collected from Manhole #1 for that day because the outflow was already frozen. The percent BOD5 removal for Manholes #1 and #2 are shown in Figure 13. Average BOD5 removal percentages were 59% and 48% for Manholes #1 and #2, respectively. The percent BOD5 removal was relatively constant for both basins until the period around Julian Day 305. At this time the high discharge through Manhole #1 likely resulted in the rapid drop in the percent BOD5 removal. A subsequent reduction in the flow in Manhole #1 saw a recovery in the percent BOD5 removal in Manhole #1. The rapid decline in the percent BOD5 removal in Manhole #2 is likely the result of the flow increasing in Manhole #2 toward the end of the measurement period, and perhaps also due to the freezing weather conditions. Nitrate-nitrogen concentrations. The NO3-N concentrations measured in the inflow and outflow from the two wollastonite contact basins during a brief, nine-day measurement period during 1996 are shown in Figure 14. Inflow NO3-N concentrations ranged from 9 to 22 mg/l and averaged 17 mg/l. Outflow NO3-N concentrations ranged from 12 to 21 mg/l and from 10 to 28 mg/l for Manholes #1 and #2, respectively, with both manholes averaging 17 mg/l. These wollastonite adsorption basins apparently had little effect on the gain or removal of any NO3-N. It should be noted that these upflow basins are primarily operating in anaerobic conditions and there was no vegetation planted in them to take up any NO3-N. Thus, a minimum amount of nitrification of the ammonia-nitrogen is expected. The small surface area of the basins would also not promote any significant denitrification. Since volunteer vegetation had begun to grow in the basins toward the end of the season, the opportunity to use vegetation to facilitate N removal appears possible, particularly in a full-scale constructed wetland system. However, because removal of NO3-N was not the focus of this study, these measurements were not continued. Monitoring Results of 1997 Discharge rates. Wastewater diversion discharges through Manholes #1 and #2 over 125 days of operation during 1997 are shown in Figures 15 and 16, respectively. The discharge varied from 0 to 8400 gpd in Manhole #1 and from 0 to 5800 gpd for Manhole #2. The average weir-measured


32
discharges from Manholes #1 and #2 were 1420 and 1430 gpd, respectively. The installation of ¼-in. (6.3-mm) diameter flow-control valves caused even more flow variation and operational problems during 1997. These valves clogged to the point that complete disassembly was necessary to clean them out. After repeated problems, 3/8-in. (9.5-mm) diameter valves were installed during the summer of 1997 so that the valves could be flushed clean upon opening without having to disassemble them. However, this opening and closing operational procedure for flushing the valves led to large flow surges. As a result, the valves were eventually set at half and even full open throughout the latter part of the year causing several high flow periods of several thousand gallons per day through the basins. The upper discharge limit through a fully open 3/8-in. (9.5-mm) diameter valve under these head pressure conditions was determined to be about 9000 gpd, which coincides with what was observed in Manhole #1. A very small valve orifice opening of 5/64-in. (2 mm) in diameter would have been necessary to control the wastewater flow to the approximately 150 to 180 gpd that would have provided a 24-hour residence time. When the 2-in. (5.1-cm) diameter gate valves were used in 1996, opening the valve completely would allow the accumulated solids to be quickly flushed away. However, opening these large valves also instantaneously resulted in very high flows into the basins. These high flows were visually obvious, so these large valves were quickly reset. During 1997, the opening of the smaller valves was not as readily visible, so the valves were not as carefully reset. As a result, there was more flow variation and longer durations of high flow in 1997. Since the diverted wastewater had to be restricted significantly, the settling and further coagulation of solids in the delivery manifold may also have been cumulative making the problem worse during 1997. No suspended and total solids measurements were made on the incoming WWTP wastewater over the project duration so it is not known if there may have also been variations in the wastewater treatment. These flow-control difficulties to achieve long residence times in the pilot facility are not likely to pose similar problems in a full-scale constructed wetland. The constructed wetland would be designed and built to achieve the necessary residence time for the peak flow condition. Further more, the problems with the total solids can be addressed by constructing the first wetland cells with coarse aggregates to remove the solids. Phosphorus concentrations and percent removal. The SP concentrations measured in the inflow and outflow from the two wollastonite contact basins during 1997 are shown in Figure 17. The inflow SP concentrations ranged from 2.3 to 5.9 mg/l with an average of 4.3 mg/l. Although the inflow SP concentrations were similar to those measured during 1996, there appears to be more variability over time. This variability may be associated with the settlement and repeated flushing of the solids in the delivery manifold. The effluent concentrations from Manhole #1 ranged from 1.4 to 5.0 mg/l with an average concentration of 2.5 mg/l. The effluent concentrations from Manhole #2 ranged from 1.4 to 4.6 mg/l with an average concentration of 2.7 mg/l. The lower values of the effluent SP concentration range were somewhat higher than the lower ranges observed during 1996 for both Manholes #1 and #2. For the most part, the effluent concentrations varied similarly with the influent concentrations. Both Manholes #1 and #2 had effluent concentrations that slightly exceeded the influent concentrations. These occurred during the periods of high discharge through

34
the manholes. Manhole #1 had a slightly lower average SP concentration than Manhole #2, which also coincides with the lower discharge. The calculated inflow versus outflow percent SP removal through the basins during 1997 is shown in Figure 18. These SP removal percentages ranged from -24% to 75% removal, with both extremes occurring in Manhole #1. The average SP removal was 25% and 28% for Manholes #1 and #2, respectively. The slightly lower percent removal in Manhole #1 coincides with the lower average discharge through Manhole #1. The percent SP removal shows considerable variation that is likely the result of the problem in achieving uniform flow through the wollastonite basins. The varying pattern of the percent SP removal was somewhat similar with both basins, which seems to indicate that the percent SP removal is related to both the inflow concentration and the discharge through the basins. As mentioned previously, this variation is also due to the method of the calculation when using inflow and effluent sample concentrations from the same time. The extreme flow variation exasperates this variability. Total P concentrations in the inflow and outflow through the basins during 1997 is shown in Figure 19. Total P concentrations in the inflow ranged from 3.2 to 6.8 mg/l and averaged about 5.0 mg/l. The TP concentrations in the effluent from Manhole #1 ranged from 2.0 to 6.3 mg/l with an average concentration of 3.0 mg/l. Manhole #2 outflow TP concentrations ranged from 1.8 to 7.2 mg/l with an average concentration of 3.6 mg/l. The percent TP removal averaged 20% and 17% for Manholes #1 and #2, respectively. The response of TP concentrations and the percent TP removal show similar trends as those for the SP and appear to be correlated to the corresponding variations in discharge through the basins. Biological oxygen demand. The BOD5 concentrations in the inflow and outflow from the two wollastonite contact basins during 1997 are shown in Figure 20. Inflow BOD5 averaged 6.3 mg/l and ranged from 3.4 to 18.5 mg/l. The BOD5 concentration from the outflow of Manhole #1 ranged from 1.3 to 4.6 mg/l. Outflow from Manhole #2 had BOD5 concentrations ranging from 1.6 to 6.0 mg/l. The average outflow BOD5 concentrations were 2.8 mg/l and 4.0 mg/l for Manholes #1 and #2, respectively. The single high BOD5 concentration measurement of 18.5 mg/l in the inflow was likely attributable to the clogging problem. When the valve for Manhole #1 was blocked, the solids remained in the influent line just upstream of the inflow sampling port. Once this blockage was cleared, the subsequent samples were in the typical range measured during 1996 and the rest of 1997. The effluent sample concentrations that exceeded the inflow concentrations occurred when the discharge was high. The percent BOD5 removal for the basins during 1997 is shown in Figure 21. The percent BOD5 removal for Manhole #1 ranged from -27 to 90%. The range of BOD5 removal for Manhole #2 was from -46 to 85%. The average BOD5 removal was 43% and 20% for Manholes #1 and #2, respectively. The wide range in the percent BOD5 removal is believed to be due to the clogging of the valves, the discharge variations, and the method of calculating the percent removals.


39
Variability of Monitoring Results
The results for the two pilot wollastonite adsorption basins were much more variable during 1997 than during 1996. The variation in wastewater discharge through the basins during 1997 was much more extreme, leading to considerable variation in both the real and calculated average hydraulic residence time. The variable flow rate greatly affects the method and degree of wastewater contact with the wollastonite media. A high wastewater flow rate will cause the wastewater to move selectively through the most permeable areas of the wollastonite. This means that the wastewater will only come into contact with some of the surface area of the wollastonite particles. As a result, the amount of wollastonite surface area available for sorption reactions is considerably reduced and there will be quicker P saturation of these available sorption sites. Furthermore, the more rapid flow through the more permeable wollastonite zones reduces the available contact time for the sorption reactions. Since the SP sorption process depends on both the extent of the wastewater to wollastonite contact and the available time for that contact, variations in wastewater flow will also lead to variations in the SP removal process. Numerous variables, both within the pilot basins and within the experimental method itself, can affect the observed results and subsequent calculations. An inherent source of variability lies within the wollastonite tailings material. The raw ore has spatially variable Ca, Fe, and Al sites, which are not necessarily altered during ore processing. The particle size and the elemental variability in the waste tailings are affected by variations in mineral processing, handling, and disposal. This occurs due to temporal changes in the process line and as different wastes from the different manufacturing processes are mixed and discarded. It is not known whether a more uniform waste tailings product could be produced or what it may cost. Precautions to reduce this variability were taken during the filling of the manholes to achieve similar depths of materials and to select waste tailings that appeared uniform. Since wollastonite is white and garnet is red, the visual appearance provides a subjective measure of the different quantities of each in the tailings. Inherent variability also exists in the WWTP secondary treated wastewater discharge stream, including both the discharge quantity and various parameter concentrations. The complete range in this variability was not characterized or quantified to any degree of certainty with three sampling events per week and analysis limited to a few parameters. The incoming lines to the pilot adsorption basins may have caused some variability also. The clogging of one valve was believed to have led to more organic solids in an inflow sample taken farther downstream. The plumbing to Manhole #2 consisted of additional pipe length that results in decreased pressure, which may have led to some further biochemical transformations. In order to reduce sampling costs, only one sample was taken of the influent, which was assumed to be representative of both manholes. This assumption may not have been valid and was not examined. Although numerous precautions were taken to assure a high-quality and controlled sampling and analytical procedures, there is likely to be some variability in these results. The multi-year project duration and the use of fresh and frozen samples may have led to some of the variability in the analytical results. The degree to which selective sorption of other wastewater constituents to the wollastonite may have led to desorption of P was not evaluated. A much more extensive
40
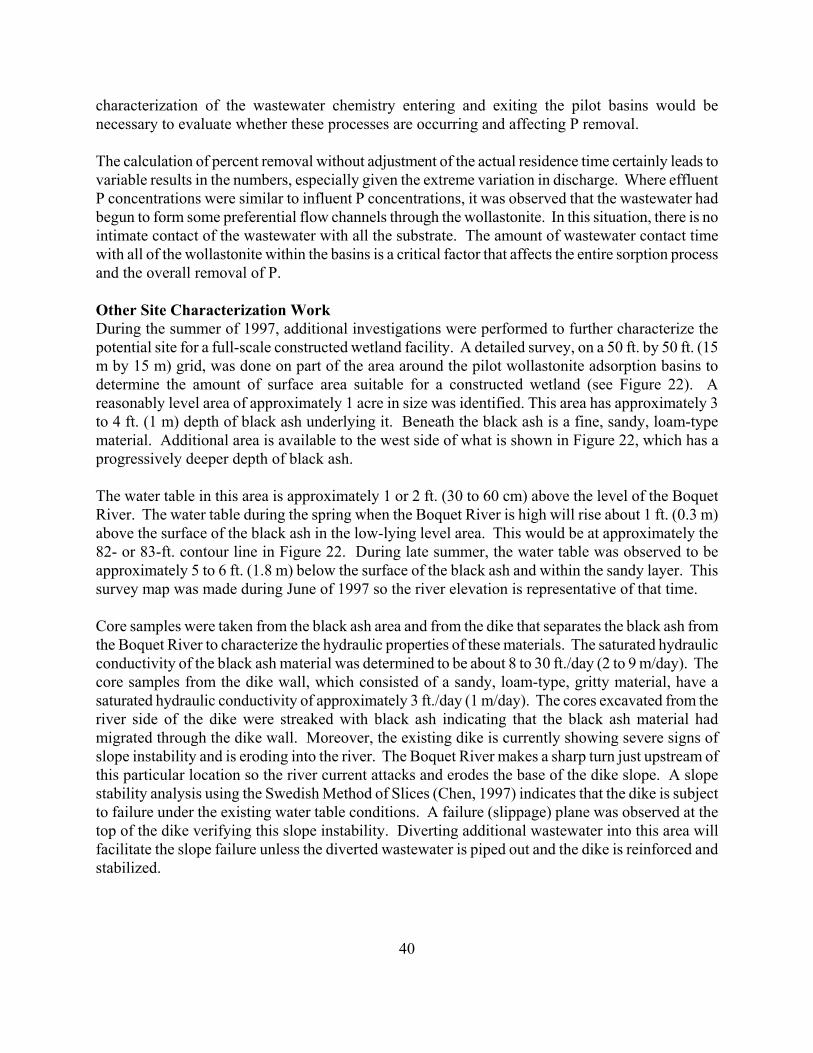
characterization of the wastewater chemistry entering and exiting the pilot basins would be necessary to evaluate whether these processes are occurring and affecting P removal. The calculation of percent removal without adjustment of the actual residence time certainly leads to variable results in the numbers, especially given the extreme variation in discharge. Where effluent P concentrations were similar to influent P concentrations, it was observed that the wastewater had begun to form some preferential flow channels through the wollastonite. In this situation, there is no intimate contact of the wastewater with all the substrate. The amount of wastewater contact time with all of the wollastonite within the basins is a critical factor that affects the entire sorption process and the overall removal of P. Other Site Characterization Work During the summer of 1997, additional investigations were performed to further characterize the potential site for a full-scale constructed wetland facility. A detailed survey, on a 50 ft. by 50 ft. (15 m by 15 m) grid, was done on part of the area around the pilot wollastonite adsorption basins to determine the amount of surface area suitable for a constructed wetland (see Figure 22). A reasonably level area of approximately 1 acre in size was identified. This area has approximately 3 to 4 ft. (1 m) depth of black ash underlying it. Beneath the black ash is a fine, sandy, loam-type material. Additional area is available to the west side of what is shown in Figure 22, which has a progressively deeper depth of black ash. The water table in this area is approximately 1 or 2 ft. (30 to 60 cm) above the level of the Boquet River. The water table during the spring when the Boquet River is high will rise about 1 ft. (0.3 m) above the surface of the black ash in the low-lying level area. This would be at approximately the 82- or 83-ft. contour line in Figure 22. During late summer, the water table was observed to be approximately 5 to 6 ft. (1.8 m) below the surface of the black ash and within the sandy layer. This survey map was made during June of 1997 so the river elevation is representative of that time. Core samples were taken from the black ash area and from the dike that separates the black ash from the Boquet River to characterize the hydraulic properties of these materials. The saturated hydraulic conductivity of the black ash material was determined to be about 8 to 30 ft./day (2 to 9 m/day). The core samples from the dike wall, which consisted of a sandy, loam-type, gritty material, have a saturated hydraulic conductivity of approximately 3 ft./day (1 m/day). The cores excavated from the river side of the dike were streaked with black ash indicating that the black ash material had migrated through the dike wall. Moreover, the existing dike is currently showing severe signs of slope instability and is eroding into the river. The Boquet River makes a sharp turn just upstream of this particular location so the river current attacks and erodes the base of the dike slope. A slope stability analysis using the Swedish Method of Slices (Chen, 1997) indicates that the dike is subject to failure under the existing water table conditions. A failure (slippage) plane was observed at the top of the dike verifying this slope instability. Diverting additional wastewater into this area will facilitate the slope failure unless the diverted wastewater is piped out and the dike is reinforced and stabilized.
41
Discussion and Implications for Using Wollastonite in a Constructed Wetland Physical Design Aspects The wollastonite tailings’ porosity (from Table 2), the dimensional parameters of the pilot adsorption Equation 1 to calculate average hydraulic residence times. These data were combined with the calculated percent SP removal producing 171 sampling points as plotted in Figure 23. A simple linear regression of this data, shown as the straight line in Figure 23, results in the following equation:
Percent SP removal = 0.96 × Hydraulic Residence Time, hrs. + 30.5
The correlation coefficient for this linear regression is R2 = 0.2. Due to the variability in the data this is not a strong correlation, and the correlation could likely be improved significantly using a stepwise linear regression similar to that shown in Figure 5. Nevertheless, this simple linear regression equation indicates that a 90% SP removal should be occurring in the pilot wollastonite adsorption basins when the hydraulic residence time is about 62 hours. Given the high discharges that frequently occurred through the manholes, this length of residence time was rarely achieved. In order to achieve this residence time, the discharge through the basins would have to average about 70 gpd. The overall average percent SP removal for these combined data was 45% with a standard deviation of 28%. The overall average hydraulic residence time was 16 hours which indicates that the initial experimental objective of 24 hours of residence time was not achieved. The weighted mean of residence time was 19 hours with a standard deviation of 13 hours. Although the variability of this data is considerable, comparisons can be made with the laboratory results where the data indicates a residence time of 43 hours to achieve 90% SP removal (see Figure 5). A more uniform wastewater flow was achieved in the smaller laboratory columns so the P adsorption process with the wollastonite should be more efficient. These results provide a basis for sizing the subsurface-flow constructed wetland. Using a value of 62 hours or more (which should provide an adequate residence time to achieve a 90% percent SP removal), the volume of a constructed wetland can be determined. A rearrangement of Equation 1 is used for this procedure by substituting the design wastewater flow from the WWTP, the porosity of the wollastonite tailings, and the desired hydraulic residence time. Assuming a WWTP peak design flow or maximum hydraulic loading of 125,000 gpd, a porosity of 0.33, and a 72-hour retention time (a 15% safety factor assuming that further scale-up would continue to reduce the efficiency), the volume of wollastonite required will be approximately 152,000 cubic ft. (5,630 yd.3 or 4,300 m3). Given an assumed depth of 2.5 ft. (0.75 m) for a subsurface-flow constructed wetland, the surface area of the constructed wetland should be about 60,800 ft.2 or 1.4 acres (5,650 m2) for the peak design flow. When less than the peak flow occurs, this volume or assumed area would allow for an even greater residence time and perhaps compensate for other process inefficiencies. A proposed subsurface-flow constructed wetland cell using wollastonite tailings is shown in Figure 24 (adapted from Dusel and Pawlewski [1997]). This horizontal flow process configuration is
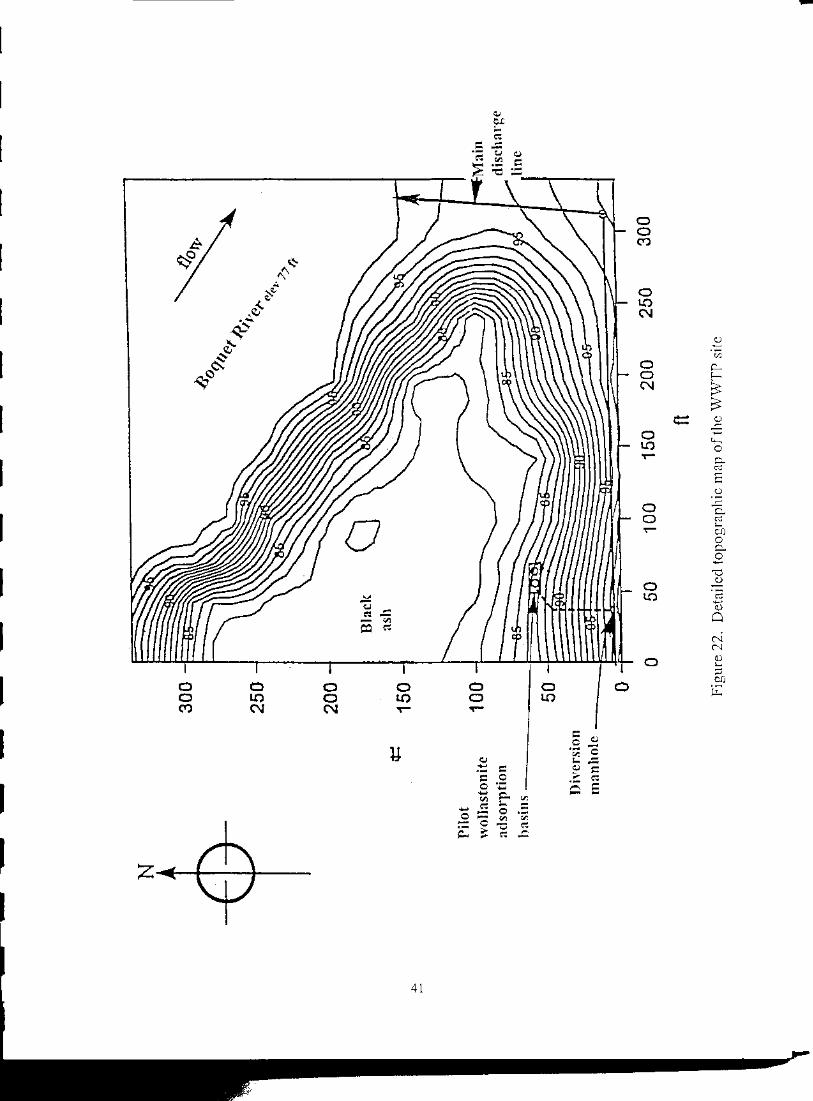


45
somewhat similar to that of the upflow pilot wollastonite adsorption basins providing the wastewater inflow is properly distributed beneath the expanded surface area. Since a more horizontal flow configuration leads to less efficient distribution of the wastewater effluent throughout the entire substrate, the effect of scaling up horizontally needs more research. The most pronounced affects of a horizontal scale-up is the possibility of rapid surfacing of the wastewater and the creation of “dead” flow zones in the cell corners. This causes less efficient contact of the wastewater with all the substrate and more rapid flow through the middle portion of the wetland cell. A better mechanism for distributing the effluent into the cell, rather than just at the upstream end as shown in Figure 24, may be required. For example, it may be better to distribute the effluent across the top and allow it to trickle down through the wollastonite, collecting it in a bottom drainage system. Another method of distribution would be to extend the incoming lines farther into or completely across the bottom of the wetland cell. Since a full-scale wetland cell constructed with wollastonite media has not been constructed and observed, the exact impact of this unequal flow distribution on the actual residence time and percent P removal is unknown. Another factor that still needs to be examined is the potential effect of flow blockage at the inlet area by the total solids, and whether the inlet gravel or coarse wollastonite ore distribution area prior to the wollastonite portion of the substrate is adequate. It may be better to design a separate wetland cell with a coarse material that could act as a pre-filter for the incoming solids. This pre-filter wetland cell could be designed for easy access and maintenance without having to disturb the wollastonite wetland cell. An analysis of the total solids in the WWTP effluent should be done to assess the need for filtration. Methods of achieving this filtration most economically should also be reviewed. The BOD5 loading rate from the WWTP, estimated at about 1.3 lbs./day (using the measured peak BOD5 concentration of 18 mg/l at the peak design flow of 125,000 gpd), should be low enough so as not to have any deleterious effects on the constructed wetland cells. Furthermore, given the existing water table position and the fact that the saturated hydraulic conductivity of the adjacent black ash and dike is similar to that of the wollastonite tailings, some form of impermeable liner should be used to force the wastewater flow vertically through the wollastonite. Economic Aspects Conventional costs for P removal at other New York State locations and the P removal results obtained from these investigations were used to predict the costs of removing P using either the conventional or subsurface-flow constructed wetland methods at Willsboro. The cost of a conventional P removal process, which is based on chemical addition, for Willsboro was estimated using figures from other small wastewater treatment plants in New York (see Table 3). The capital cost for removing P using the conventional ferric chloride chemical addition method at Willsboro is estimated at $52,800. This cost would include the installation of a chemical injection and mixing tank (which would need to be large enough for perhaps 20 minutes of contact time) and the additional pipe and pumps required to bring the wastewater effluent from the rotating biological contactor to the mixing chamber and to deliver it back to the final settling tank. Although a chemical P-removal system was discussed in Willsboro’s Final Facility Plan prepared by J. S. MacNeil, consulting engineers, no information could be found as to their projected costs for this specific

46
Table 3. Cost Estimates on Phosphorus Removal for Conventional Wastewater Treatment Systems
Process
Avg. Flow 1,000 gpd
Chemical Amount
Chemicals $/year
O&M $/year
Sludge Handling
Capital
Trumansburg, NY
Ferrous sulfate 250 9,490 gal/yr $0.18/gal
$1708.20 $20,000
*A $0.028/gal
20,000 gal/month $6,720
$83,900 (EPA/017)
*B Ithaca, NY
Ferrous sulfate 7,000 76,500 lb P in
15,000 lb P out rmvd 62,000 lb P
$0.47/lb P removed
$29,913
$29,000 *C
975 dry tons/yr $232/dry ton
(chemical and tipping) $226,200/yr
$248,500 (EPA/017)
Cayuga Heights, NY Ferrous sulfate
1,500 72,000 gallons/yr $0.18/gal $12,960
$60,000 *A
1,248 wet tons/yr $178,600 (EPA/017)
Lansing, NY Alum/sulfate
22 5,200 lb/yr $3/lb $15,600
$20,000 *A
16,000 gal/yr $350/2,500 gal
$2,240
$52,800 (EPA/017)
Willsboro, NY Estimated cost to
remove P using ferric chloride
25 9,125 gal/yr $0.20/gal $1,825
$23,000 *A
1.15 m3 dry/yr (now) 10% additional
1.26 m3 total (future)
$52,800 (EPA/017)
*A – Includes sludge handling *B – All EPA/017 references are priced for inflow P concentration of 3-8 ppm to 1 ppm and do not include additional sludge handling, including treatment and disposal; accounting for inflation of 4.5% per year from 1987 when the EPA manual was published; @ 8% interest, 20 years. *C – Does not include sludge handling
47
process. The annual chemical costs of ferric chloride were estimated to be about $1,825 for Willsboro. The operating and maintenance costs were estimated to be about $23,000 annually. The MacNeil report indicated that the sludge removal and disposal would cost about $7,300 annually with the overall annual costs totaling about $58,000. Based on the pilot facility observations, a subsurface-flow constructed wetland for Willsboro was estimated to require 0.5 and 1.4 acres for the current average wastewater flow of 25,000 gpd and the peak design flow of 125,000 gpd, respectively. The assumptions used for this design were based on the 3 to 6 mg/l SP wastewater inflow concentrations that would be treated to 0.8 mg/l after a 72-hour retention time. The economic analysis assumes a substrate of wollastonite tailings only or the 1:1 ratio of tailings and pure grade manufactured wollastonite. Also, similar adsorption efficiencies as those determined throughout these investigations were assumed for the wollastonite. Table 4 summarizes the costs for the two different substrates, the average and peak design flows, and for different projected replacement periods of the substrate. The table indicates that the capital construction cost of a constructed wetland using wollastonite tailings as the substrate with the peak design discharge and a 20-year adsorption life, would be around $52,000. This is comparable to the capital cost of the chemical addition hardware. Since no additional chemicals or pumps are required, however, the primary advantage of the constructed wetland is the low annual operation and maintenance cost of around $3,500. From the experience with the pilot wollastonite adsorption basins, the primary maintenance is to check and assure that the flow continues in a reasonably uniform manner. There were no other extraneous chemical or utility expenses. Some factors not addressed in these cost projections would be the cost of an impermeable liner and additional wastewater pre-filtering and flow distribution hardware, as well as other site development costs, particularly the stabilization of the dike. Nevertheless, these projections indicate that a constructed wetland with wollastonite as the adsorption substrate media may be a cost-effective option for removing P in this small-scale wastewater treatment facility. When pure wollastonite is used with the tailings in a 1:1 ratio, the capital cost increases dramatically. However, this substrate form would likely also have a much longer adsorption life. Since current studies have not been of sufficient duration to evaluate and determine the adsorption life of either form, it is difficult to estimate what the advantage of the more expensive pure wollastonite form would be. At this time, the small gain in percent SP removal with the 1:1 wollastonite mix substrate does not appear to justify its use, based on the differential in the initial material costs.
Summary of Results Wollastonite, a calcium metasilicate mineral, has been determined to be an effective adsorbent of soluble phosphorus. The concentration of SP in wastewater can be significantly reduced when the wastewater flows through a wollastonite material. Vertical upflow columns containing wollastonite were constructed in the laboratory and in a pilot-scale facility to evaluate the important parameters to achieving significant removal of SP. Municipal wastewater containing 2 to 10 mg/l of SP was circulated through these columns and the effluent concentrations of SP were measured. In the
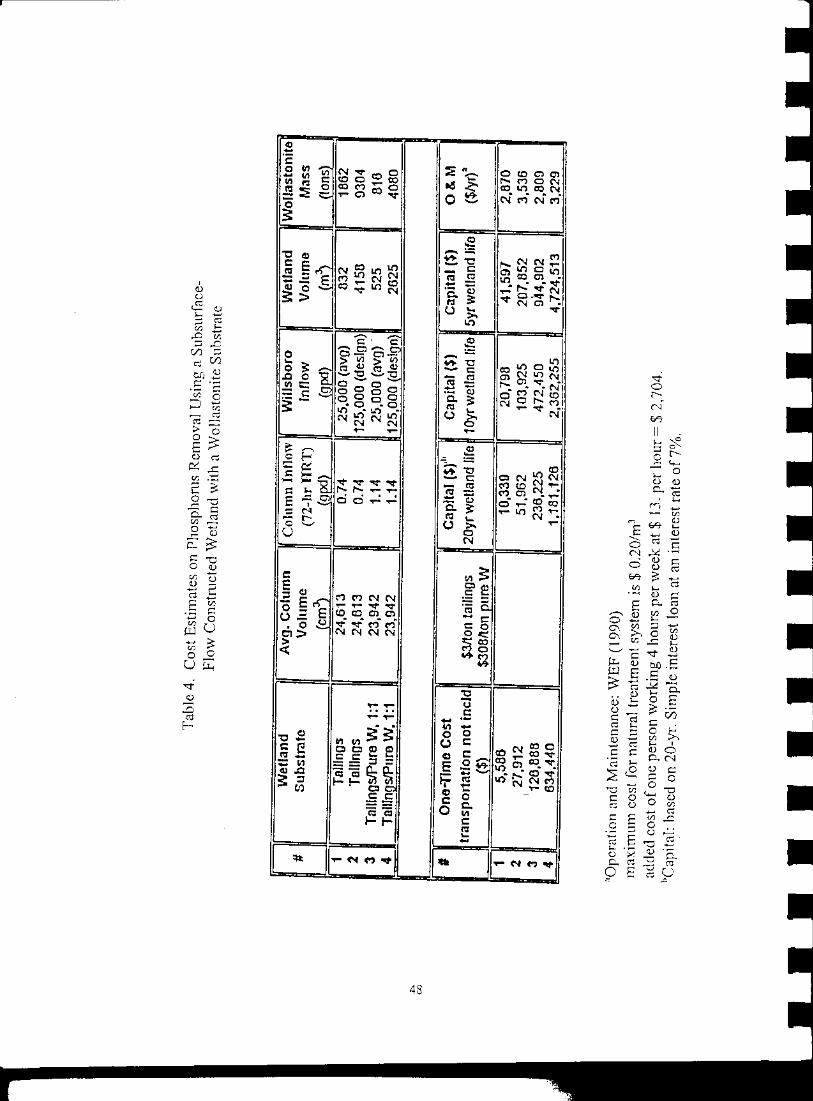

49
laboratory, the percent SP removal averaged 68% and 81% for wollastonite tailings and the 1:1 ratio mix of wollastonite tailings and the pure manufactured grade of wollastonite, respectively. In the WWTP pilot-scale facility constructed with wollastonite tailings, an average of 45% SP and BOD5 removal was achieved over a 175-day operating period during 1996 and 1997. As much as 90% of 0.5 mg/l of SP. The inability to consistently achieve a higher percent SP removal at the WWTP pilot facility is attributed primarily to the lack of control of the hydraulic residence time. The small scale of the pilot facility and the long hydraulic residence time necessitated the use of small-diameter valves, which clogged from the organic solids in the wastewater. The alleviation of this clogging by opening the valves further resulted in hydraulic overloading and short residence times. The range of data collected from the pilot facility indicates that a retention time of at least 63 hours will be necessary to achieve a 90% reduction of SP.
The laboratory and pilot facility studies revealed that the hydraulic residence time of the wastewater within the wollastonite material largely determines the percent SP that can be removed. In the smaller-diameter columns in the laboratory, an estimated 43-hour retention time achieved a 90% removal. In the larger-diameter column pilot-scale facility, an estimated 62-hour retention time was determined to be needed to remove 90% of the SP. Wastewater effluent concentrations of SP could be brought down to levels below 0.8 mg/l in both cases. Total P and BOD5 were also simultaneously removed from the municipal wastewater passing through the pilot-scale wollastonite columns. Average percent removals of about 30% TP and 45% BOD5 were achieved. The primary difficulty with the pilot-scale basins, and which largely explains the lower percent removal values, was controlling the hydraulic loading to a low enough and uniform rate to achieve the adequate residence time. Wollastonite is extracted from metamorphic rock mined from the Adirondack Mountains in northern New York. About 40 to 65% of the ore mass is wollastonite. As the ore is processed and manufactured, many particle size grades and purities can be produced. Of particular interest is the wollastonite tailings which are the waste product of the mining and ore processing operation. Wollastonite tailings still contain 10 to 20% calcium metasilicates with the balance being primarily iron and aluminum metasilicates. Calcium, iron, and aluminum salts are the primary materials used to remove P from municipal wastewaters using a process of chemical precipitation. Some physical properties of wollastonite were determined. Wollastonite tailings have hydraulic properties similar to a fine to medium sand. The combination of Ca, Fe, and Al remaining in the tailings induce adsorption and precipitation of SP over a broad pH range. Particle size gradations and the calcium purity can be manufactured for use in removing SP. However, there was little advantage found during these investigations for using the more expensive processed grades of wollastonite over the inexpensive tailings waste product. Willsboro, New York, happens to be the center of wollastonite mining operations in North America. It is also a small community situated on the Boquet River near one of the largest freshwater inland lakes in the country, Lake Champlain. Since portions of Lake Champlain are becoming eutrophic, there is considerable concern for upgrading local municipal wastewater treatment plants with respect

50
to their ability to remove P. Willsboro has recently constructed a new wastewater treatment plant facility to treat water to secondary wastewater standards. However, the added cost of installing additional treatment processes to further remove P are economically restrictive for this and many other small communities. Thus, this project focused on using the locally available and inexpensive wollastonite tailings waste product as a potential substrate for a subsurface-flow constructed wetland. The findings to date have been mainly oriented to confirm that wollastonite tailings can indeed be used to remove P, and to establish some of the design parameters for achieving this in a subsurface-flow constructed wetland. The objective to provide additional P removal from any diverted wastewater will depend on the ability to control the wastewater so that it can come into contact with all of the wollastonite substrate prior to discharge into the river. A 72-hour hydraulic residence time to achieve a 90% removal of SP was used to predict the subsurface-flow constructed wetland size requirement for the peak design discharge of the WWTP. A total surface area of 1.4 acres with a wollastonite depth of 2.5 feet appears to be adequate to treat the 125,000 gpd peak discharge. This surface/depth requirement is preferably achieved using multiple wetland cells. Precautions will be necessary to filter suspended organics from the wastewater stream prior to entry into a subsurface-flow wetland cell constructed with wollastonite. It will also be essential to construct the wetland cell to achieve a uniform distribution of the wastewater so that it will come into contact with all of the wollastonite material. Site conditions at the WWTP were also investigated and some limitations were encountered. The primary limitation is the failing dike of an old retention basin that was constructed along the Boquet River to contain black ash from a now defunct wood processing plant. Before any additional wastewater is diverted into the planned location of the wetland site, this dike should be stabilized. This work would probably best be done simultaneously with the design and construction of the wetland cells. Depending on the final site design, the hydraulic conductivity of the soils and the water table position within this area also suggest that some containment will be necessary either within the wetland cells or within the diked area. A preliminary economic analysis of conventional P removal processes and a constructed wetland indicates that the initial capital expenditures would be similar for both methods, approximately $53,000. The annual operation and maintenance costs for the conventional P removal process, however, are projected to be about 6.5 times greater than those for the constructed wetland. The accuracy of the predicted operation and maintenance costs for the conventional P removal process may be somewhat questionable since it is difficult to assess the additional costs and labor for the maintenance and sludge removal as a result of adding this single process. The predicted capital costs of the constructed wetland using wollastonite may also be conservative, as the costs to address specific site conditions were not included. Besides P removal, the constructed wetland would also provide other tertiary wastewater treatment such as additional BOD5 removal and the economic value of this additional treatment was not considered. While a constructed wetland may seem more economical than conventional P removal processes, more information is needed for a final, definitive comparison.

51
Conclusions and Recommendations for Further Study
Given an adequate hydraulic residence time, a significant amount of SP can be removed from wastewater by passing the wastewater through a substrate of wollastonite. These studies indicate that using wollastonite as a substrate to remove SP in a subsurface-flow constructed wetland may be technically and economically feasible. However, the research to date has not addressed all the potential concerns regarding this method. Additional laboratory and full-scale constructed wetland facility investigations would be beneficial to better understand the processes and to developing a standardized design procedure. These investigations would be essential before this methodology could be broadly recommended as an effective and low-cost phosphorus removal technology. Recommendations for further study and investigation include the following: 1. Determining the design life of the wollastonite tailings regarding their effectiveness to continue
to adsorb P. 2. Determining effect of changing variables (i.e., temperature, pH, other wastewater constituents,
and flow variation) on this process. 3. Constructing full-scale wetland cells and monitoring the P removal process efficiency and
hydraulic effects. Important issues include the effects of various geometric configurations, various wastewater distribution and collection arrangements, and watertable and flow-control mechanisms.
4. Determining the degree to which suspended solids need to be removed from the wastewater prior to introduction into the wollastonite media to minimize clogging of the pore space, and an appropriate process for removing these suspended solids.
5. Determining the process effectiveness and operational constraints for year-round operation in a cold climate
6. Conducting a more thorough economic analysis of the cost-effectiveness of the methodology, particularly as the distance from the source of the wollastonite tailings increases
References
Brooks, A.S. 1997. Phosphorus removal by wollastonite: A constructed wetland substrate. Master’s thesis, Department of Agricultural and Biological Engineering, Cornell University, Ithaca, NY. Chen, J. 1997. Personal communication and analysis notes. Graduate student, Cornell University. Dusel, C.H., Jr., and C.W. Pawlewski. 1997. Constructed wetlands offer flexibility. Land and Water 41(6):27. Geohring, L.D., T.S. Steenhuis, N. Corrigan, M. Ries, M. Cohen, K. Cabral, R. Stas, R. De, and J.H. Peverly. 1995. Specialized substrates for phosphorus removal with constructed wetlands. In: Campbell, K.L. (Ed.), Versatility of Wetlands in the Agricultural Landscape. ASAE Publication 70IP0995, American Society of Agricultural Engineers, St. Joseph, MI. pp. 607–617.
52
Greenberg, A.E., L.S. Clescerf, and A.D. Eaton (Eds.). 1992. Standard Methods for the Examination of Water and Wastewater (18th edition). Water Environment Federation, American Water Works Association, and American Public Health Association. Kadlec, R.H. and R.L. Knight. 1996. Treatment Wetlands. Lewis Publishers, Boca Raton, FL. Lake Champlain Basin Program (LCBP). 1994. Opportunities for action—The draft pollution prevention, control & restoration plan for Lake Champlain. LCBP, 54 W. Shore Rd., Grand Isle, VT 05458. Patrick, W.H., Jr., and R.A. Khalid. 1974. Phosphate release and sorption by soils and sediments: Effect of aerobic and anaerobic conditions. Science 186:53. Rozenwald, M.N. 1997. Hydraulic properties of wollastonite: A wetland substrate for phosphorus Removal. Master’s thesis, Department of Agricultural and Biological Engineering, Cornell University, Ithaca, NY. Sedlak, R.I. (Ed.). 1991. Phosphorus and Nitrogen Removal from Municipal Wastewater: Principles and Practice (2nd edition). The Soap and Detergent Association, Lewis Publishers, Boca Raton, FL. Sienko, M.J. and R.A. Plane. 1966. Chemistry (3rd edition). McGraw-Hill, Inc. New York, NY. p.525. Tchobanoglous, G. and F.L. Burton (Eds.). 1991. Wastewater Engineering—Treatment, Disposal and Reuse (3rd edition). McGraw-Hill, Inc., New York, NY. U.S. Environmental Protection Agency (U.S. EPA). 1987. Phosphorus removal: Design manual. EPA/625/1-87/001. U.S. EPA, Center for Environmental Research Information, Cincinnati, OH. van Starkenburg, W., J.H. Rensink, and G.B.J. Rijs. 1993. Biological P-removal: State of the art in the Netherlands. Water Science Technology 27(5/6):317–328. Vermont Department of Environmental Conservation and New York State Department of Environmental Conservation. 1994. Lake Champlain diagnostic-feasibility study. Final Report Draft 7/1/94. A phosphorus budget, model, and load reduction strategy for Lake Champlain. Waterbury, VT and Albany, NY. 129 pp. Water Environment Federation (WEF). 1990. Natural systems for wastewater treatment, MOP FD-16, WEF, Alexandria, VA. p.27.