biological phosphorus removal technology - wwoa phosphorus...•biological phosphorus removal is a...
TRANSCRIPT
Biological Phosphorus
Removal Technology
Presented by: Eugene Laschinger, P.E.
Overview
• What is phosphorus and why do we care?
• How can you remove phosphorus?
• Biological phosphorus removal
• Biological phosphorus removal facilities
▫ Tomah, WI
▫ Dane-Iowa, WI
▫ Cross Plains, WI
▫ Reedsburg, WI
▫ Rhinelander, WI
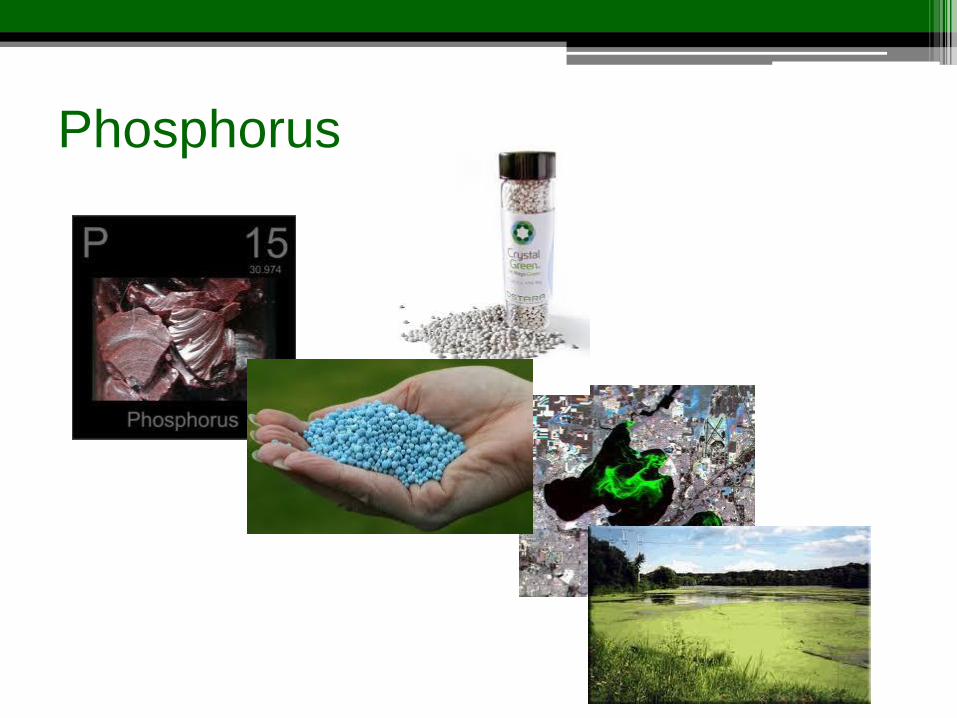
Phosphorus

Phosphorus Regulation
• Technology based effluent limits ▫ Typical = 1.0 mg/L
▫ Alternative phosphorus limits (APL) Biological – maximum 2.0 mg/L
Economics - variance
• Water quality based effluent limits ▫ Based upon target concentration in receiving water
▫ Total Maximum Daily Load (TMDL)
▫ Can be as low as 0.100 - 0.075 mg/L for streams and 0.040 – 0.015 mg/L for lakes
Chemical Phosphorus Removal
• Coagulant ▫ Alum ▫ Ferric Chloride ▫ Ferric Sulfate ▫ Poly aluminum chloride (PAC)
• Advantages ▫ Simple ▫ Lower capital cost (sometimes)
• Disadvantages ▫ Sludge production ▫ Operational costs ▫ Chemical handling ▫ Consumes alkalinity
Biological Phosphorus Removal (BPR)
• Create an environment to select for organisms that will store phosphorus
• Requirements ▫ Readily biodegradable BOD in the form of volatile fatty
acids ▫ Phosphorus ▫ Cycling between anaerobic and aerobic environments
• Advantages ▫ Low operational costs ▫ Improved treatment performance
• Disadvantages ▫ Capital cost ▫ More complicated treatment
BPR Microbiology
• Phosphorus accumulating organisms (PAOs)
▫ Store excess phosphorus inside cells
▫ Release phosphorus for energy in anaerobic environment
▫ Take in phosphorus in aerobic environment
• Identifying PAOs and biological phosphorus removal
▫ Anaerobic batch testing
▫ Staining techniques
▫ DAPI
▫ Florescence In-Situ Hybridization (FISH)
▫ DNA sequencing
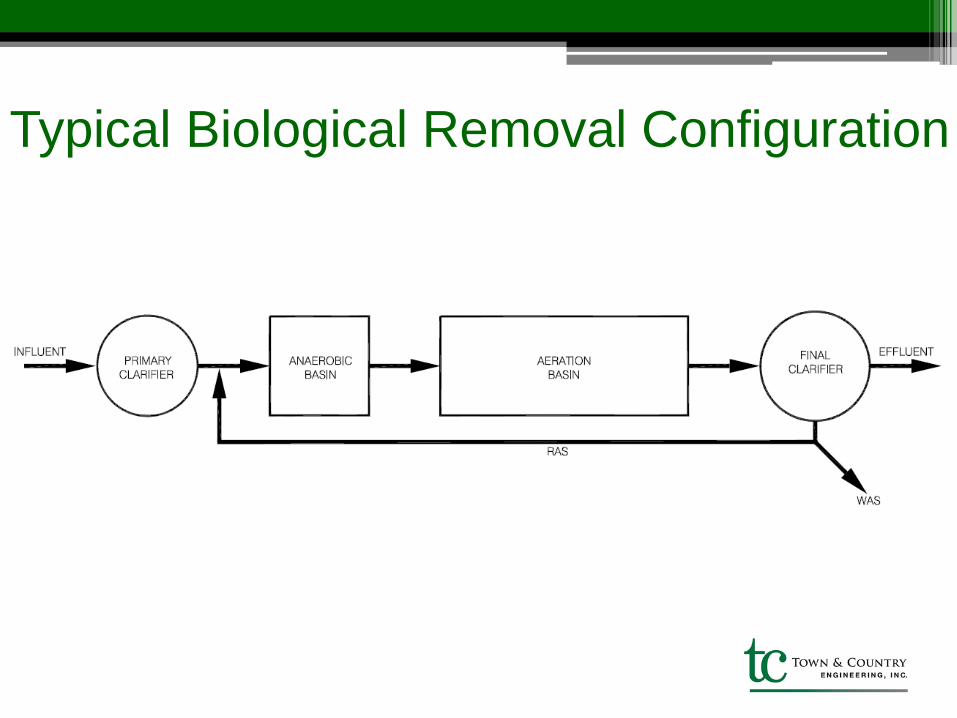
Typical Biological Removal Configuration
Influent Considerations
• BOD and phosphorus required for biological
phosphorus removal to work
• BOD should be in readily biodegradable form
• Nitrate inhibits biological phosphorus removal
▫ High influent ammonia will be converted to nitrate if
nitrification occurs
• Frequency and quantity of inflow and infiltration
(I&I)
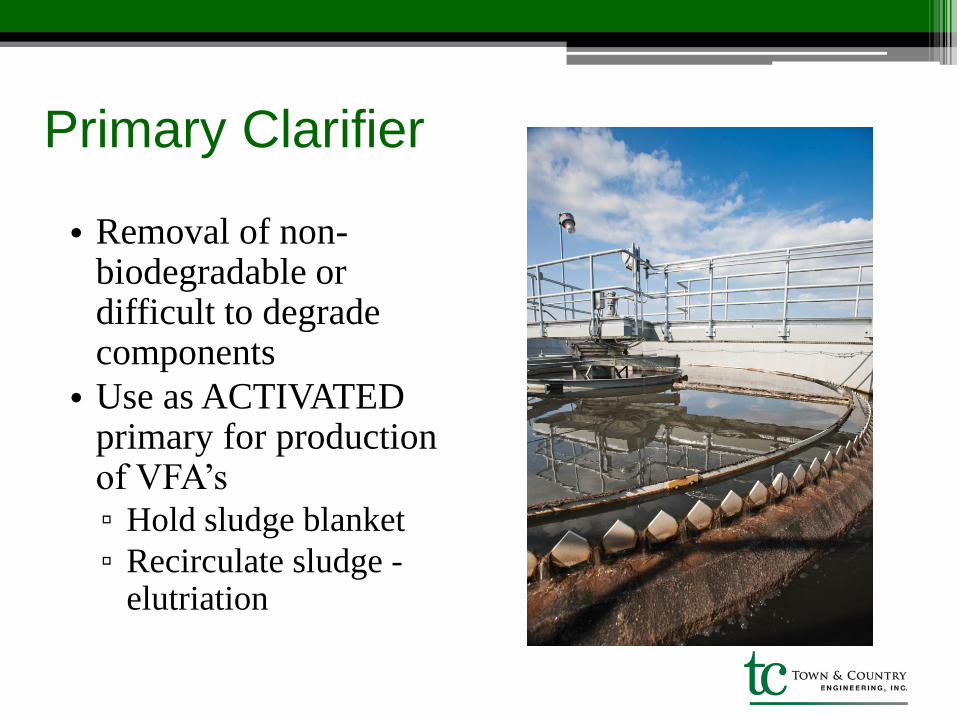
Primary Clarifier
• Removal of non-biodegradable or difficult to degrade components
• Use as ACTIVATED primary for production of VFA’s ▫ Hold sludge blanket
▫ Recirculate sludge - elutriation
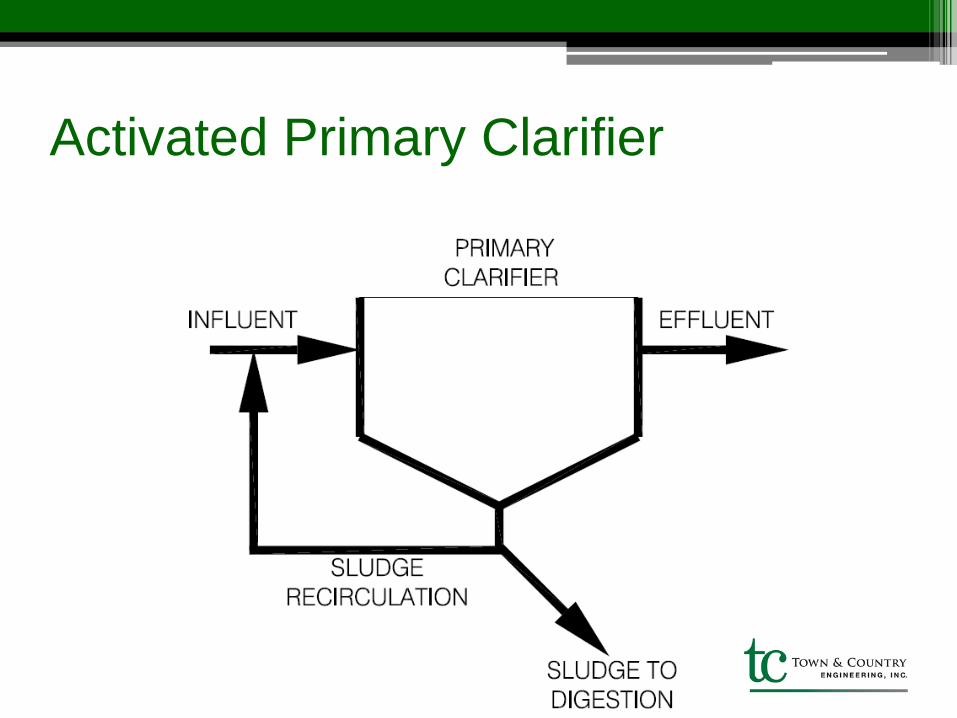
Activated Primary Clarifier
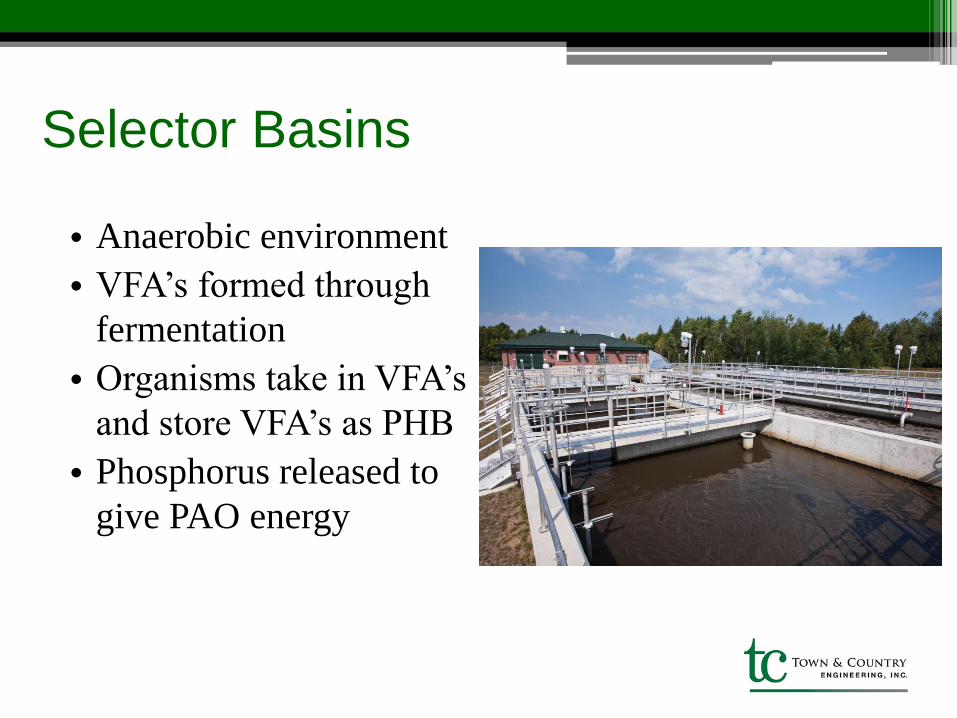
Selector Basins
• Anaerobic environment
• VFA’s formed through
fermentation
• Organisms take in VFA’s
and store VFA’s as PHB
• Phosphorus released to
give PAO energy
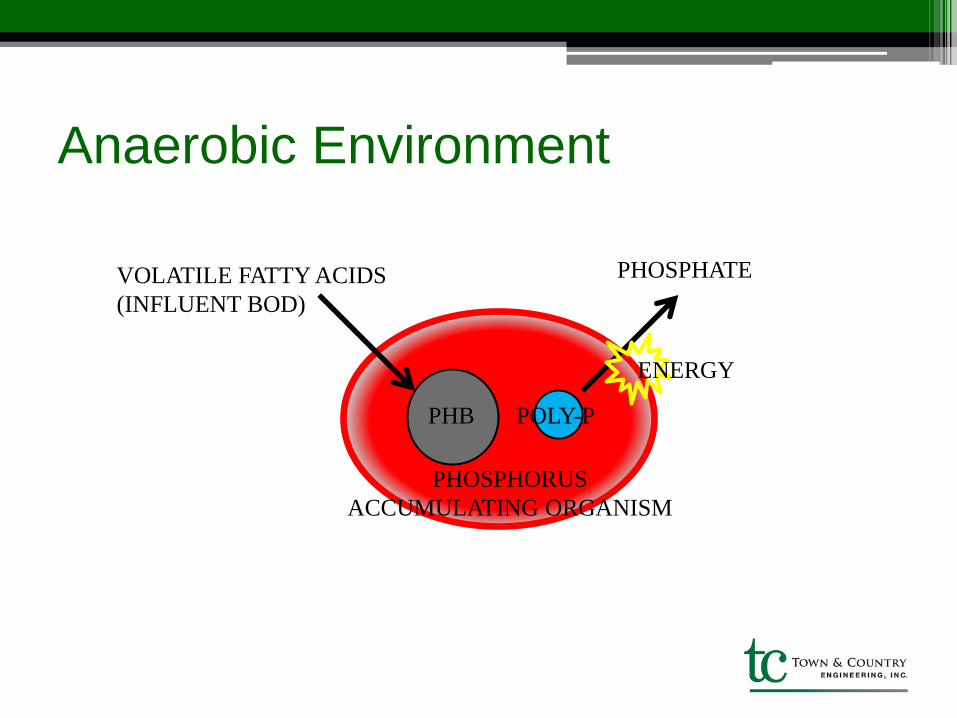
Anaerobic Environment
VOLATILE FATTY ACIDS
(INFLUENT BOD)
PHOSPHATE
PHOSPHORUS
ACCUMULATING ORGANISM
PHB POLY-P
ENERGY
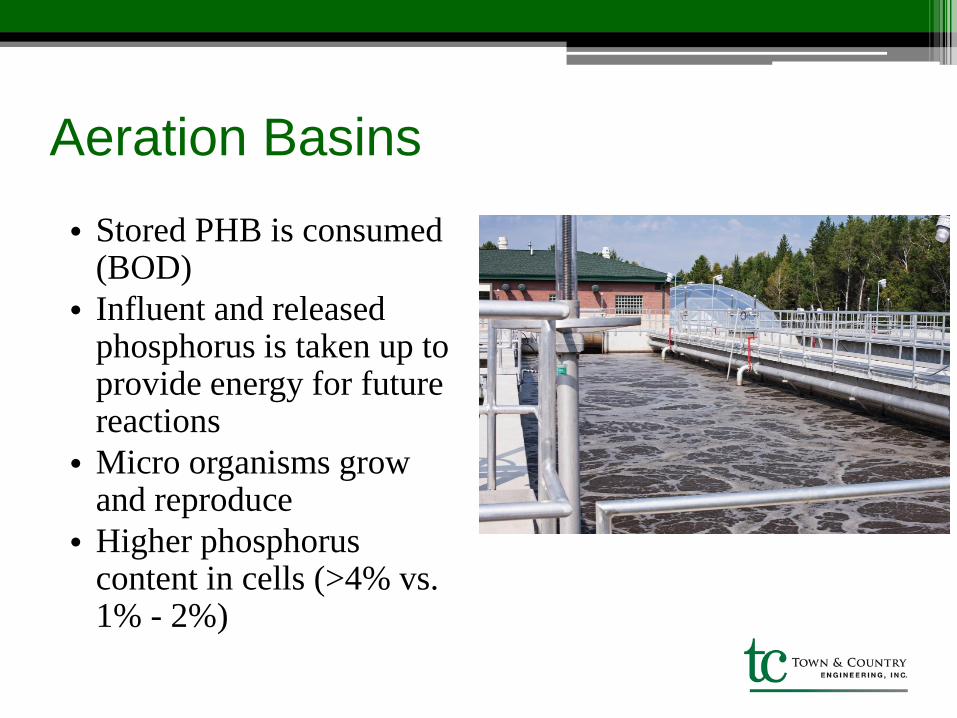
Aeration Basins
• Stored PHB is consumed (BOD)
• Influent and released phosphorus is taken up to provide energy for future reactions
• Micro organisms grow and reproduce
• Higher phosphorus content in cells (>4% vs. 1% - 2%)
PHB
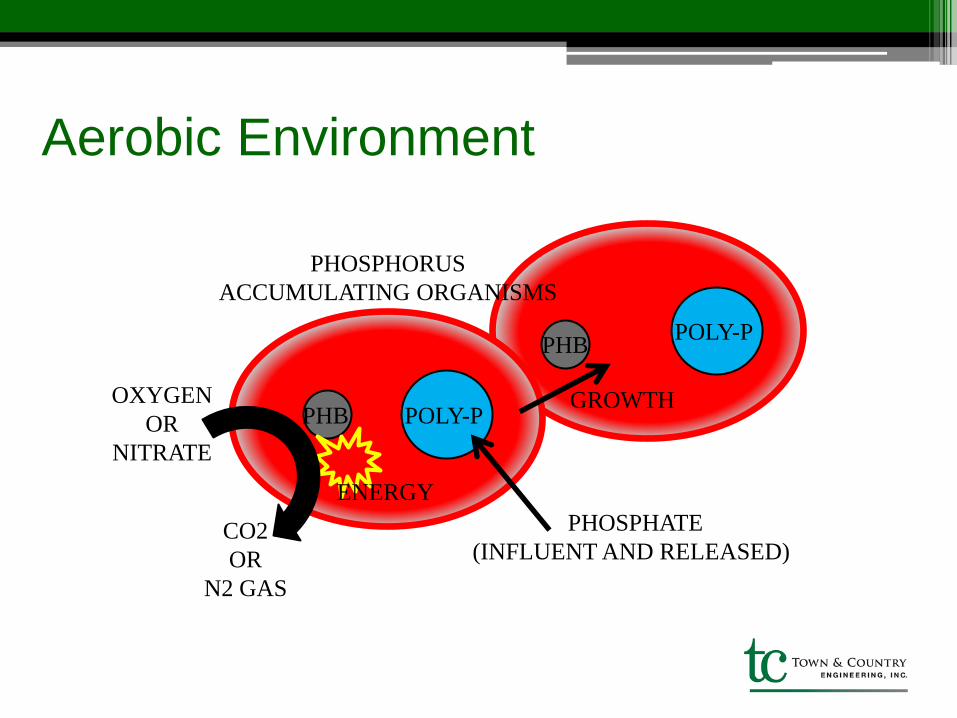
Aerobic Environment
OXYGEN
OR
NITRATE
PHOSPHATE
(INFLUENT AND RELEASED)
PHOSPHORUS
ACCUMULATING ORGANISMS
POLY-P
ENERGY
CO2
OR
N2 GAS
PHB POLY-P
GROWTH
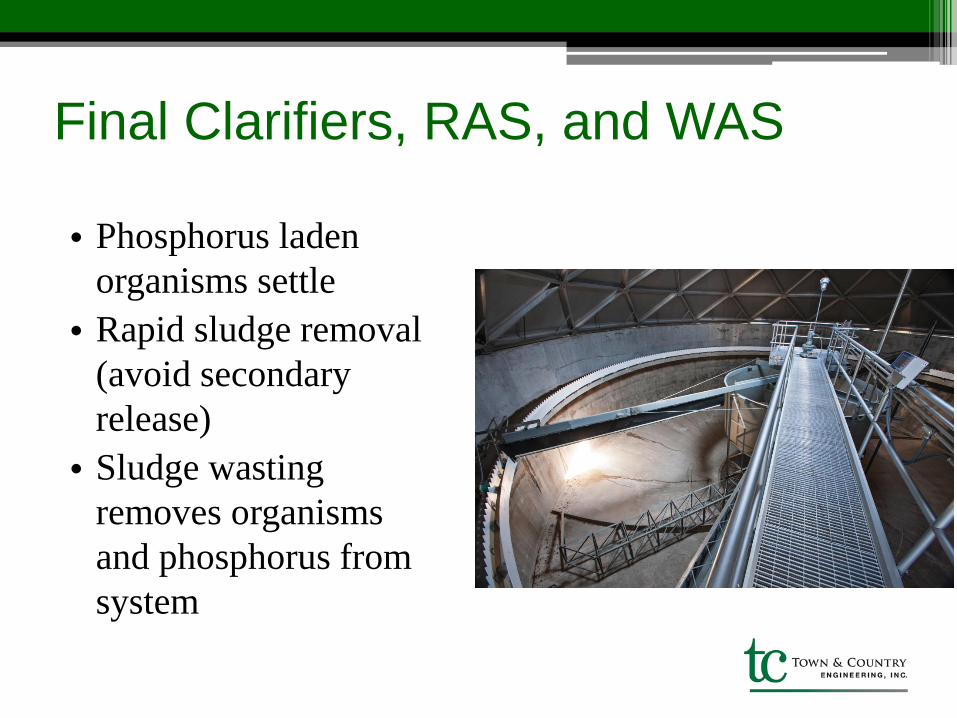
Final Clarifiers, RAS, and WAS
• Phosphorus laden
organisms settle
• Rapid sludge removal
(avoid secondary
release)
• Sludge wasting
removes organisms
and phosphorus from
system
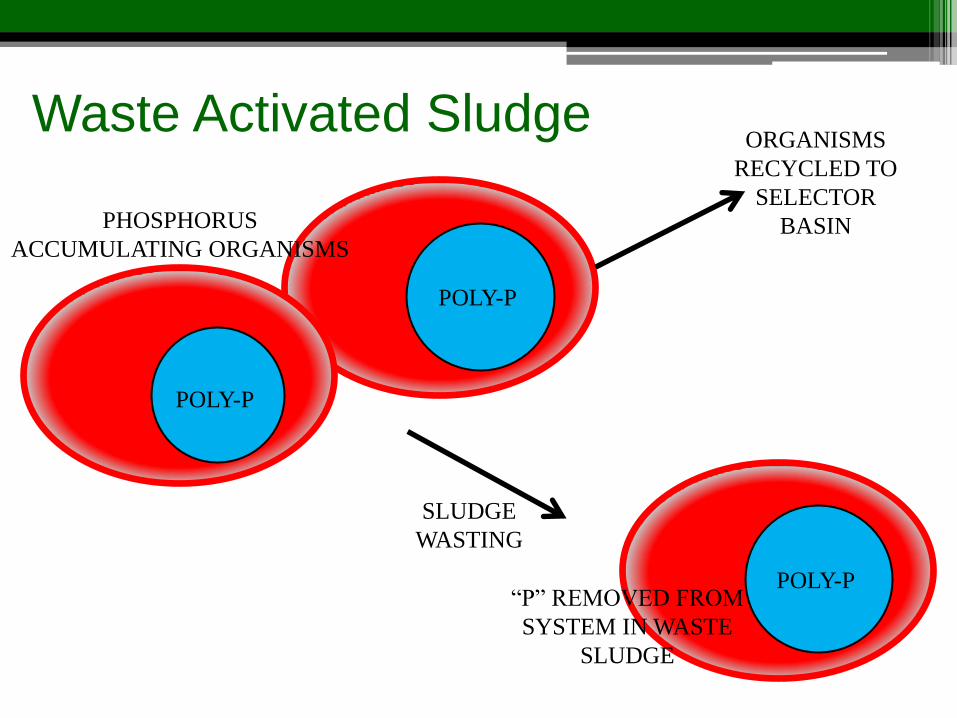
Waste Activated Sludge
PHOSPHORUS
ACCUMULATING ORGANISMS
POLY-P
POLY-P
POLY-P
ORGANISMS
RECYCLED TO
SELECTOR
BASIN
“P” REMOVED FROM
SYSTEM IN WASTE
SLUDGE
SLUDGE
WASTING
Special Considerations for BPR
• Secondary release – selector basins and clarifiers
• Nitrates – RAS
• Recycle streams – especially with anaerobic digestion
• ORP and DO control
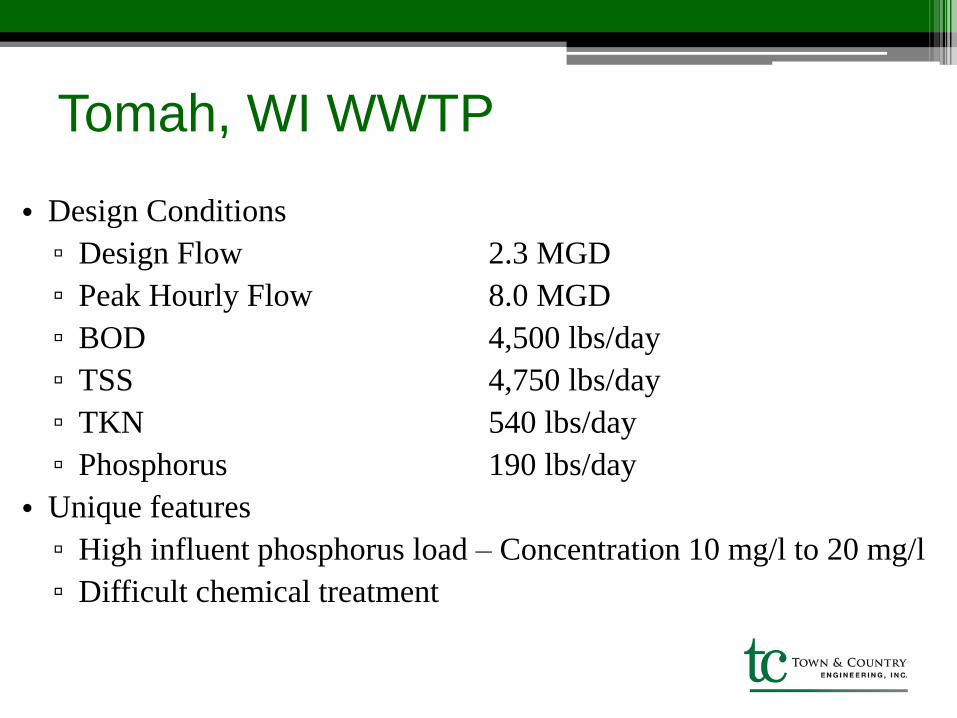
Tomah, WI WWTP
• Design Conditions
▫ Design Flow 2.3 MGD
▫ Peak Hourly Flow 8.0 MGD
▫ BOD 4,500 lbs/day
▫ TSS 4,750 lbs/day
▫ TKN 540 lbs/day
▫ Phosphorus 190 lbs/day
• Unique features
▫ High influent phosphorus load – Concentration 10 mg/l to 20 mg/l
▫ Difficult chemical treatment
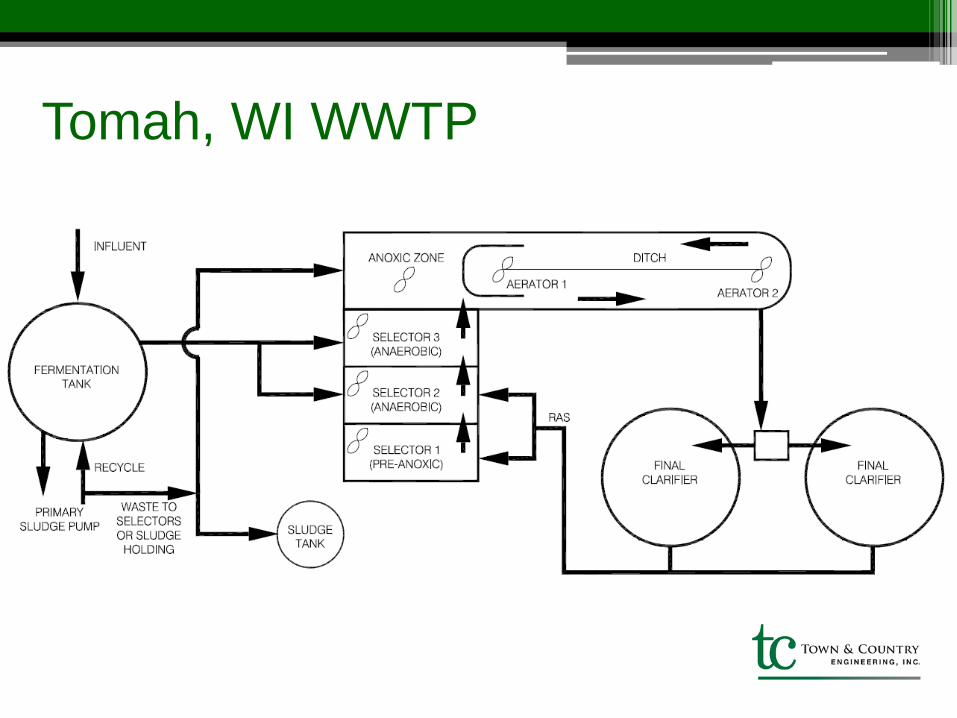
Tomah, WI WWTP

Tomah Start-Up (February – May, 2000)
Fermenter
(Off Line)
Pre-Anoxic
Basin
(Off Line)
Anaerobic
Basin #1
Anaerobic
Basin #2 Oxidation
Ditch
Raw
Wastewater
RAS Flow
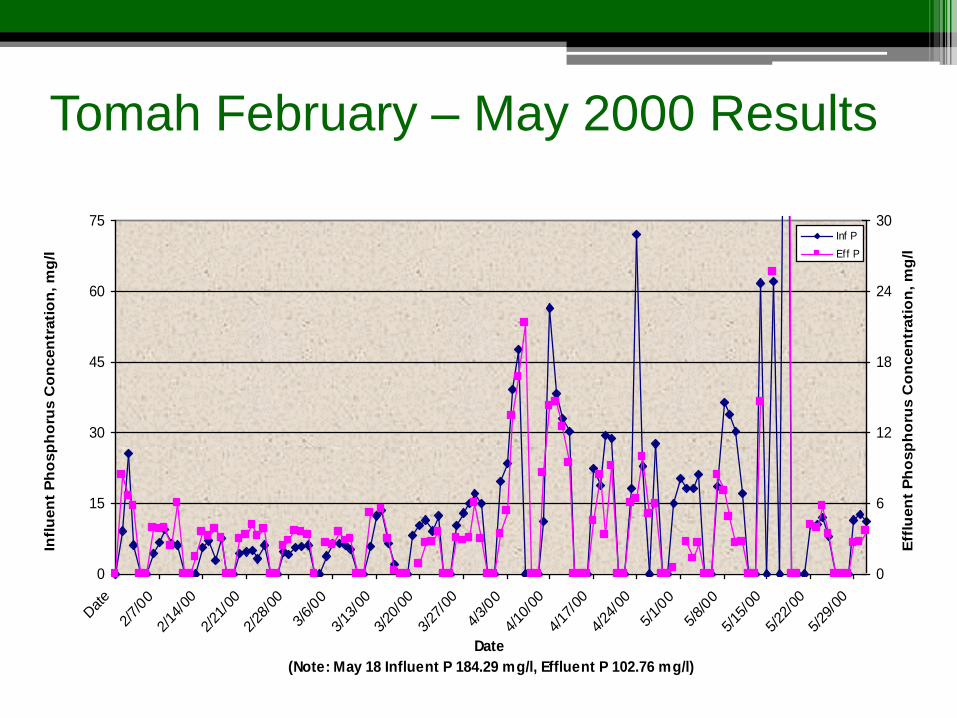
Tomah February – May 2000 Results
0
15
30
45
60
75
Dat
e
2/7/
00
2/14
/00
2/21
/00
2/28
/00
3/6/
00
3/13
/00
3/20
/00
3/27
/00
4/3/
00
4/10
/00
4/17
/00
4/24
/00
5/1/
00
5/8/
00
5/15
/00
5/22
/00
5/29
/00
Date
(Note: May 18 Influent P 184.29 mg/l, Effluent P 102.76 mg/l)
Infl
uen
t P
ho
sp
ho
rus C
on
cen
trati
on
, m
g/l
0
6
12
18
24
30
Eff
luen
t P
ho
sp
ho
rus C
on
cen
trati
on
, m
g/l
Inf P
Eff P
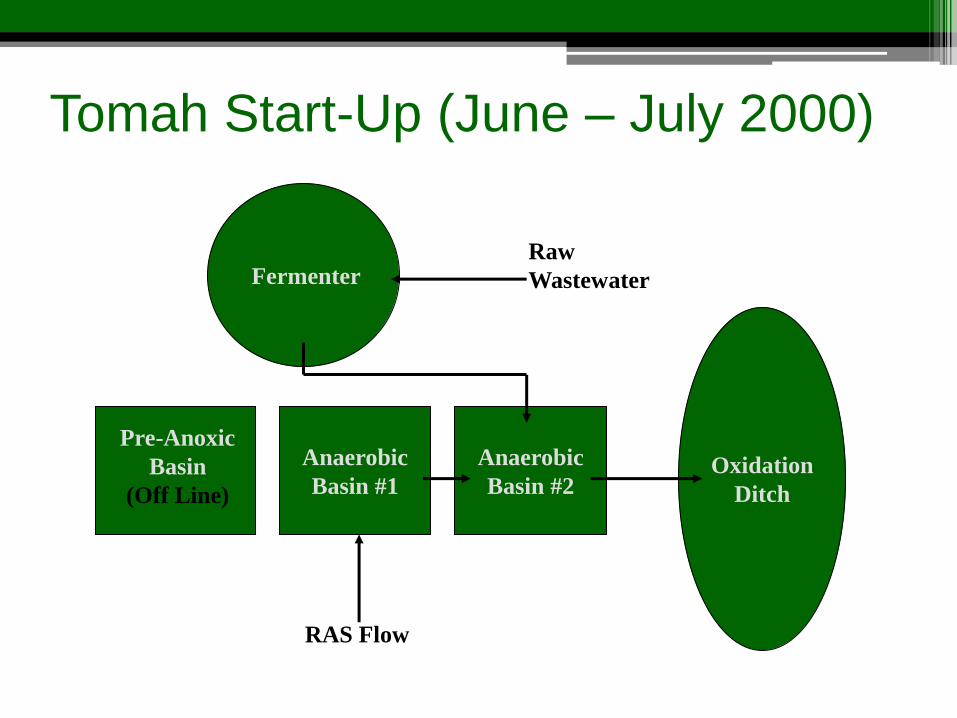
Tomah Start-Up (June – July 2000)
Fermenter
Pre-Anoxic
Basin
(Off Line)
Anaerobic
Basin #1
Anaerobic
Basin #2 Oxidation
Ditch
Raw
Wastewater
RAS Flow
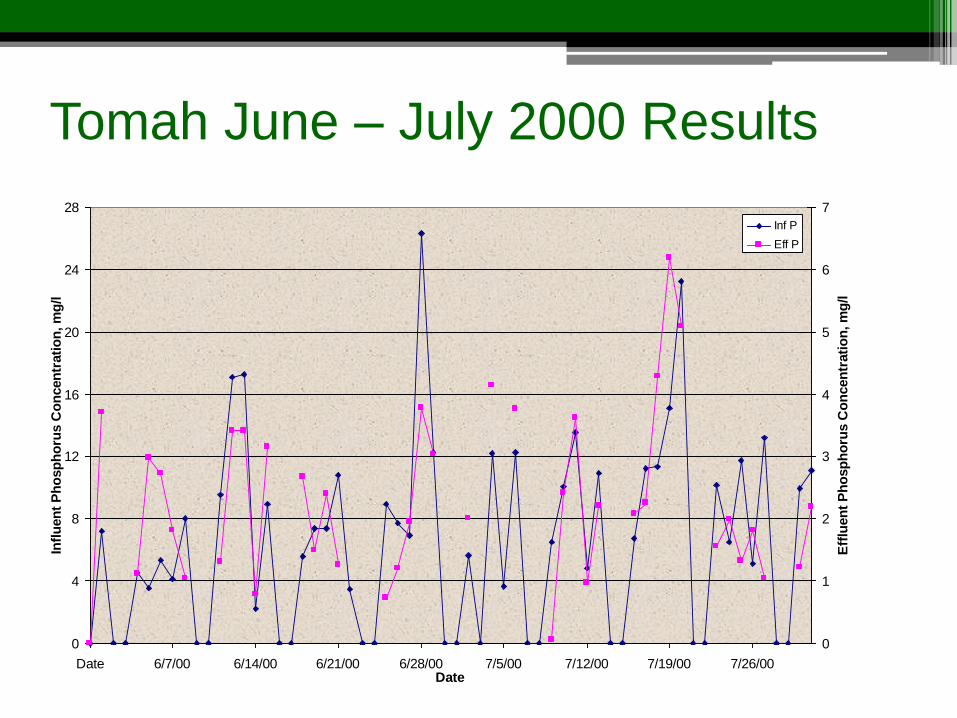
Tomah June – July 2000 Results
0
4
8
12
16
20
24
28
Date 6/7/00 6/14/00 6/21/00 6/28/00 7/5/00 7/12/00 7/19/00 7/26/00Date
Infl
uen
t P
ho
sp
ho
rus C
on
cen
trati
on
, m
g/l
0
1
2
3
4
5
6
7
Eff
luen
t P
ho
sp
ho
rus C
on
cen
trati
on
, m
g/l
Inf P
Eff P
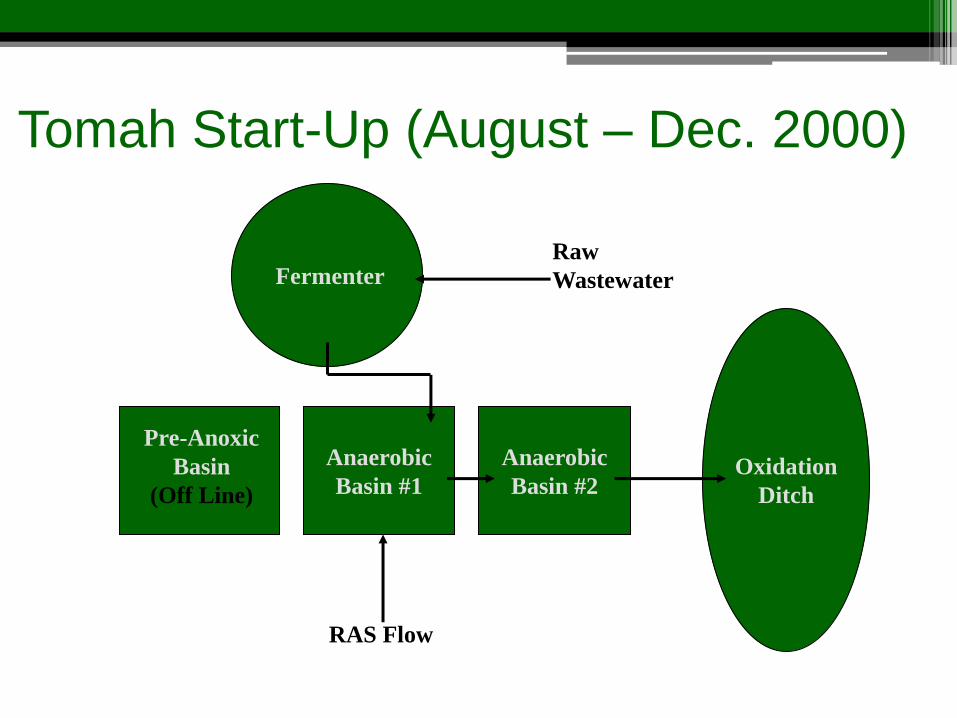
Tomah Start-Up (August – Dec. 2000)
Fermenter
Pre-Anoxic
Basin
(Off Line)
Anaerobic
Basin #1
Anaerobic
Basin #2 Oxidation
Ditch
Raw
Wastewater
RAS Flow
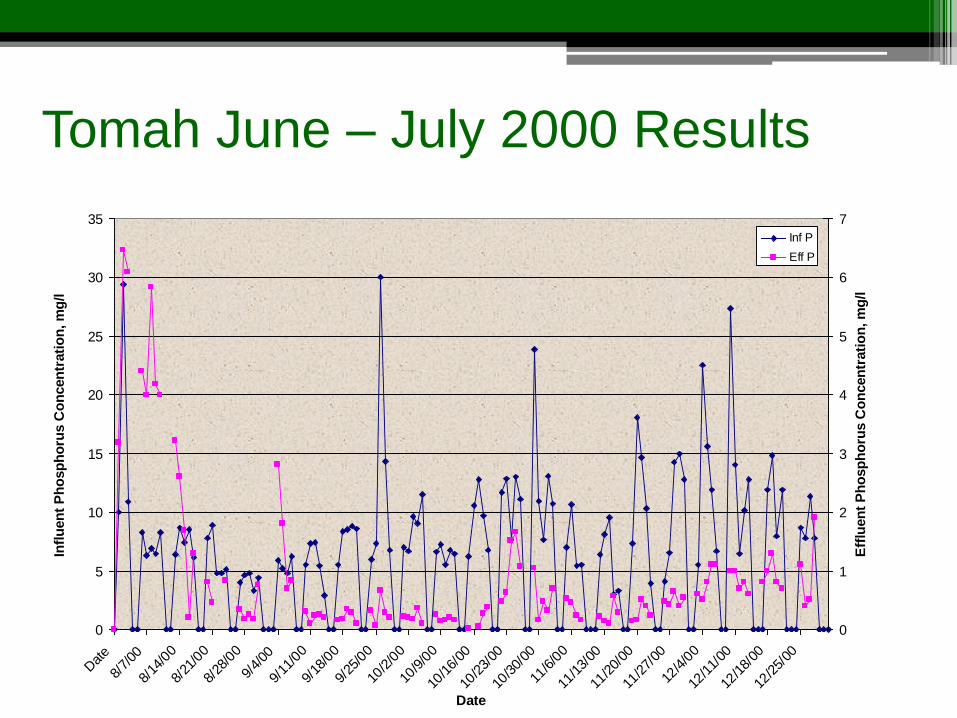
Tomah June – July 2000 Results
0
5
10
15
20
25
30
35
Dat
e
8/7/
00
8/14
/00
8/21
/00
8/28
/00
9/4/
00
9/11
/00
9/18
/00
9/25
/00
10/2
/00
10/9
/00
10/1
6/00
10/2
3/00
10/3
0/00
11/6
/00
11/1
3/00
11/2
0/00
11/2
7/00
12/4
/00
12/1
1/00
12/1
8/00
12/2
5/00
Date
Infl
uen
t P
ho
sp
ho
rus C
on
cen
trati
on
, m
g/l
0
1
2
3
4
5
6
7
Eff
luen
t P
ho
sp
ho
rus C
on
cen
trati
on
, m
g/l
Inf P
Eff P
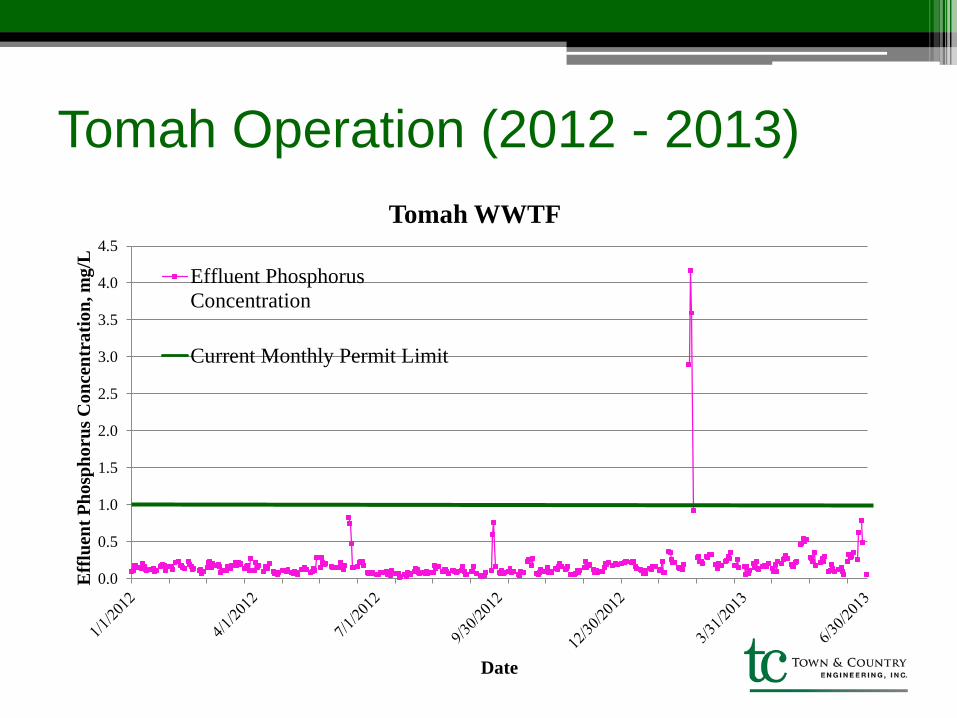
Tomah Operation (2012 - 2013)
0.0
0.5
1.0
1.5
2.0
2.5
3.0
3.5
4.0
4.5
Eff
luen
t P
ho
sph
oru
s C
on
cen
tra
tion
, m
g/L
Date
Tomah WWTF
Effluent Phosphorus
Concentration
Current Monthly Permit Limit
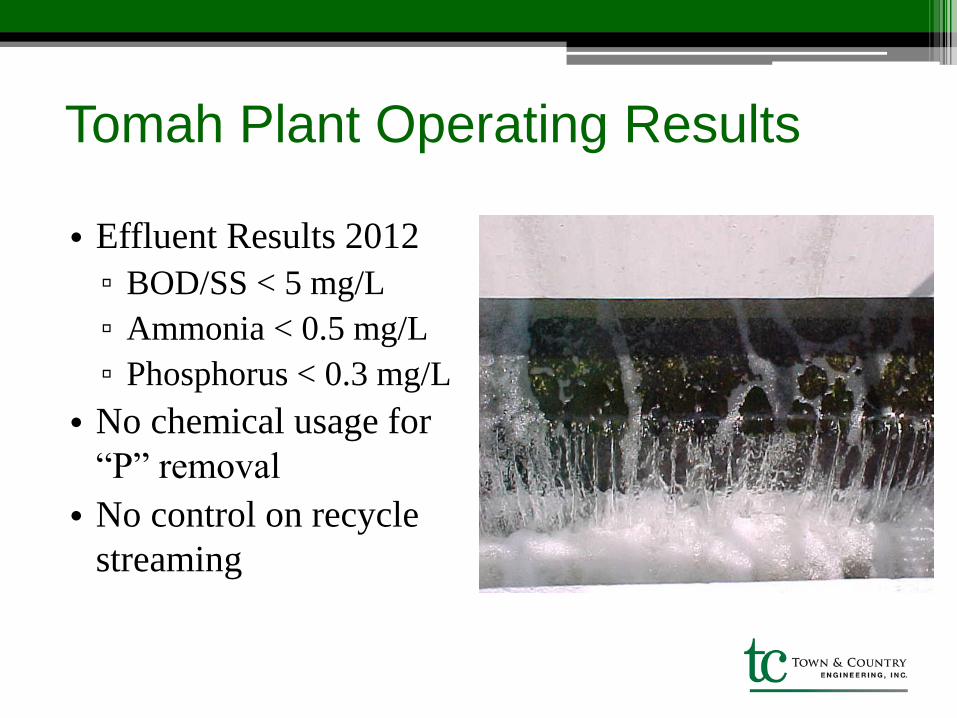
• Effluent Results 2012
▫ BOD/SS < 5 mg/L
▫ Ammonia < 0.5 mg/L
▫ Phosphorus < 0.3 mg/L
• No chemical usage for
“P” removal
• No control on recycle
streaming
Tomah Plant Operating Results
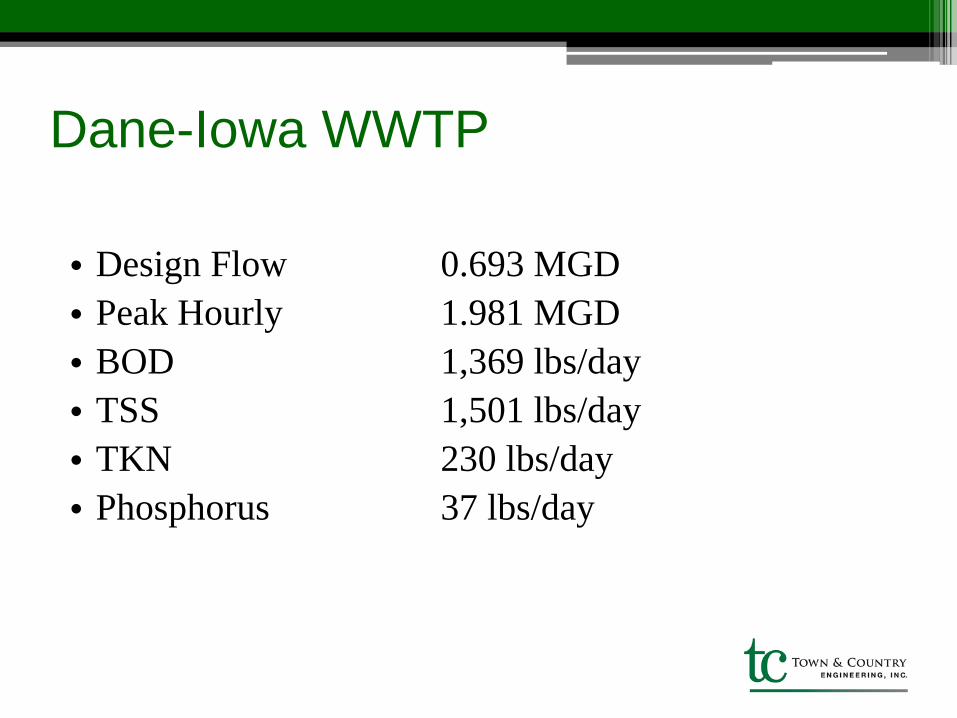
Dane-Iowa WWTP
• Design Flow 0.693 MGD
• Peak Hourly 1.981 MGD
• BOD 1,369 lbs/day
• TSS 1,501 lbs/day
• TKN 230 lbs/day
• Phosphorus 37 lbs/day
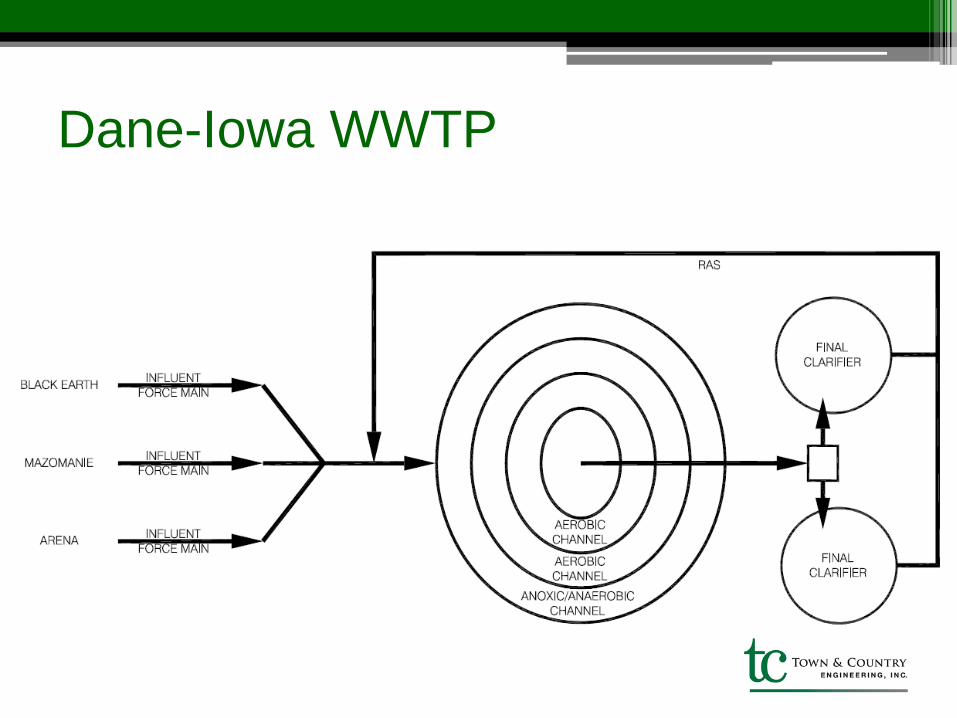
Dane-Iowa WWTP
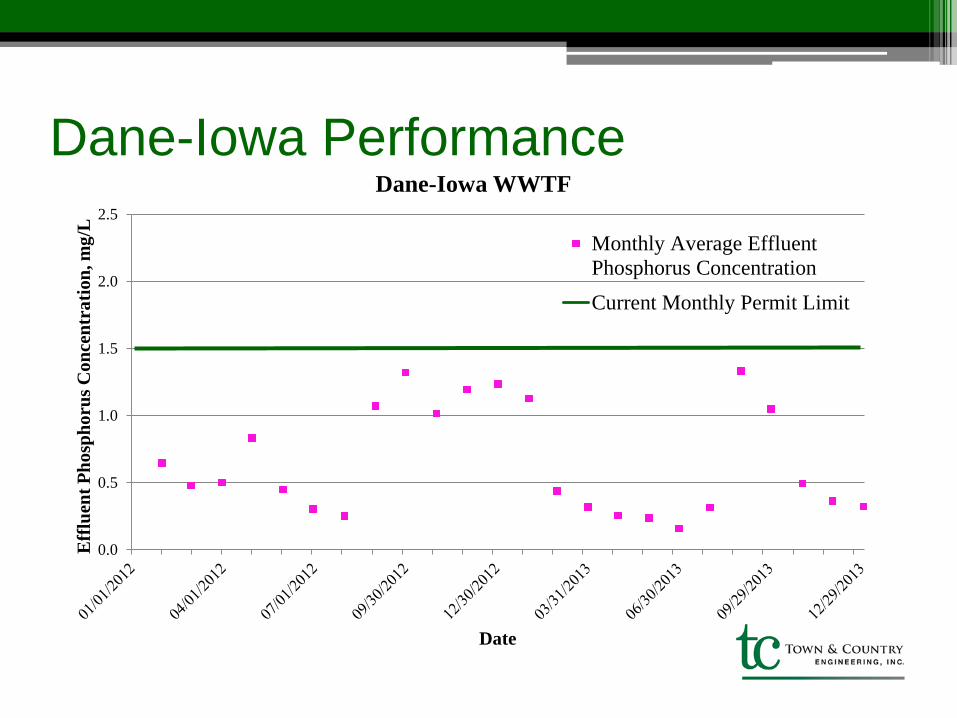
Dane-Iowa Performance
0.0
0.5
1.0
1.5
2.0
2.5
Eff
luen
t P
ho
sph
oru
s C
on
cen
tra
tion
, m
g/L
Date
Dane-Iowa WWTF
Monthly Average Effluent
Phosphorus Concentration
Current Monthly Permit Limit
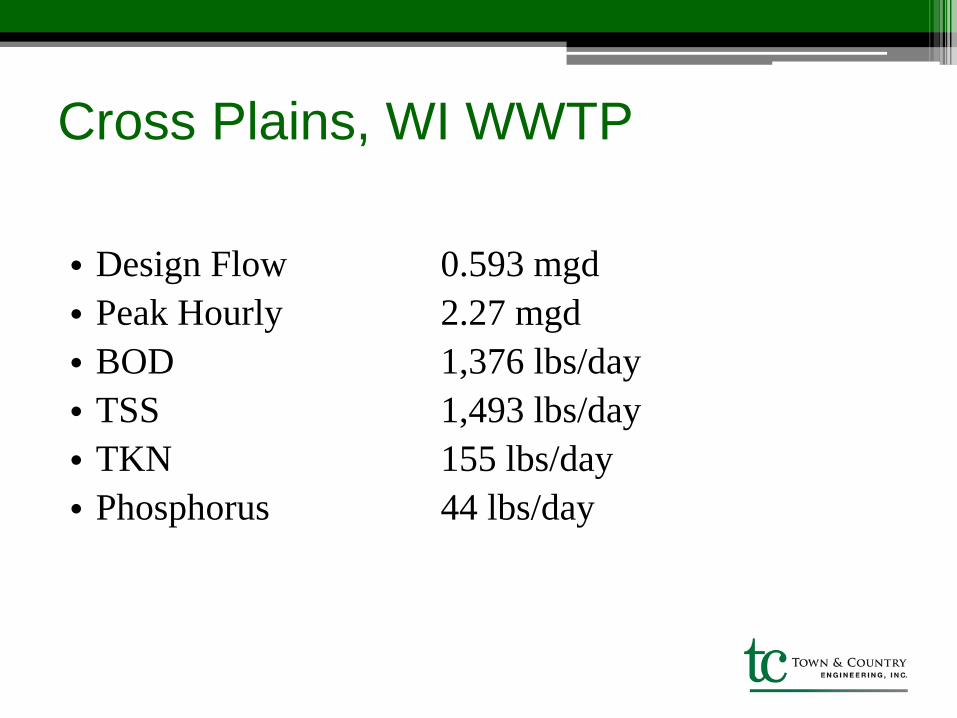
Cross Plains, WI WWTP
• Design Flow 0.593 mgd
• Peak Hourly 2.27 mgd
• BOD 1,376 lbs/day
• TSS 1,493 lbs/day
• TKN 155 lbs/day
• Phosphorus 44 lbs/day
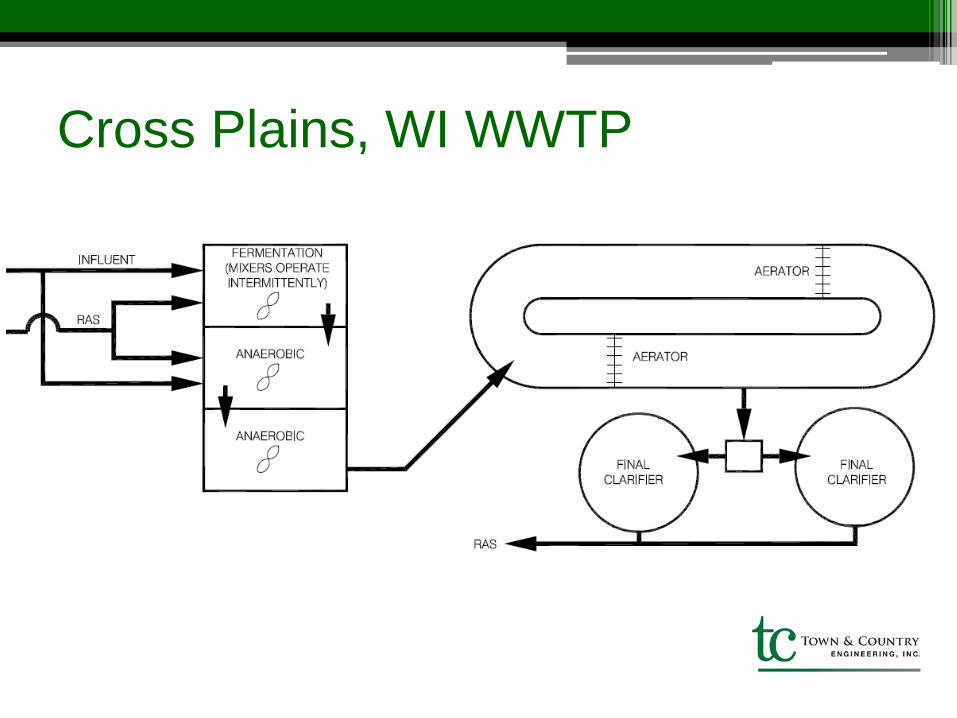
Cross Plains, WI WWTP
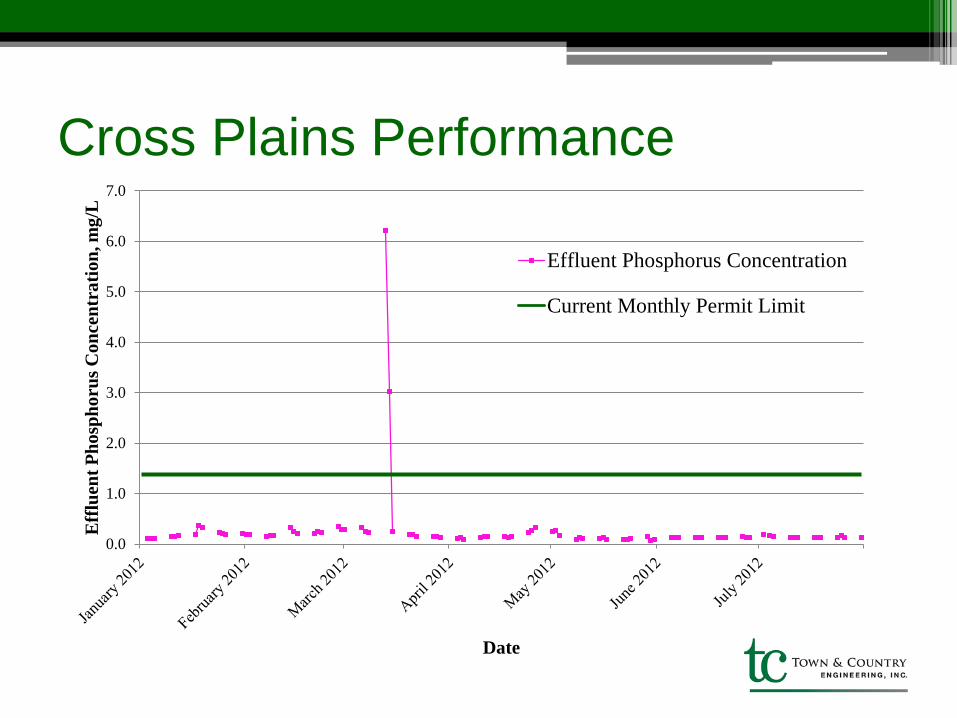
Cross Plains Performance
0.0
1.0
2.0
3.0
4.0
5.0
6.0
7.0
Eff
luen
t P
ho
sph
oru
s C
on
cen
tra
tion
, m
g/L
Date
Effluent Phosphorus Concentration
Current Monthly Permit Limit
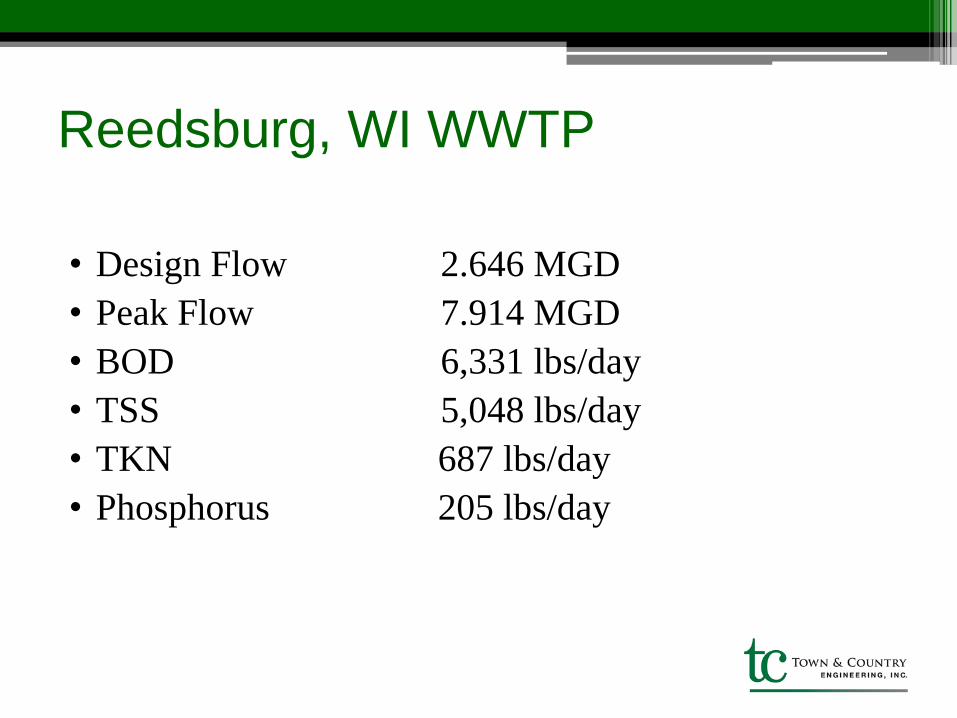
Reedsburg, WI WWTP
• Design Flow 2.646 MGD
• Peak Flow 7.914 MGD
• BOD 6,331 lbs/day
• TSS 5,048 lbs/day
• TKN 687 lbs/day
• Phosphorus 205 lbs/day
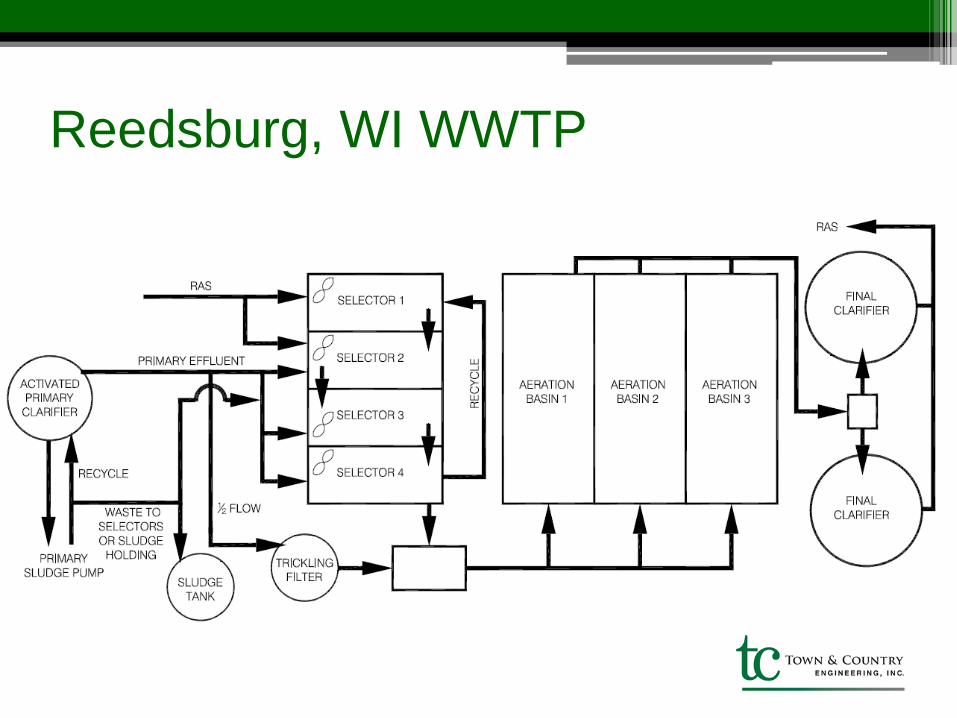
Reedsburg, WI WWTP
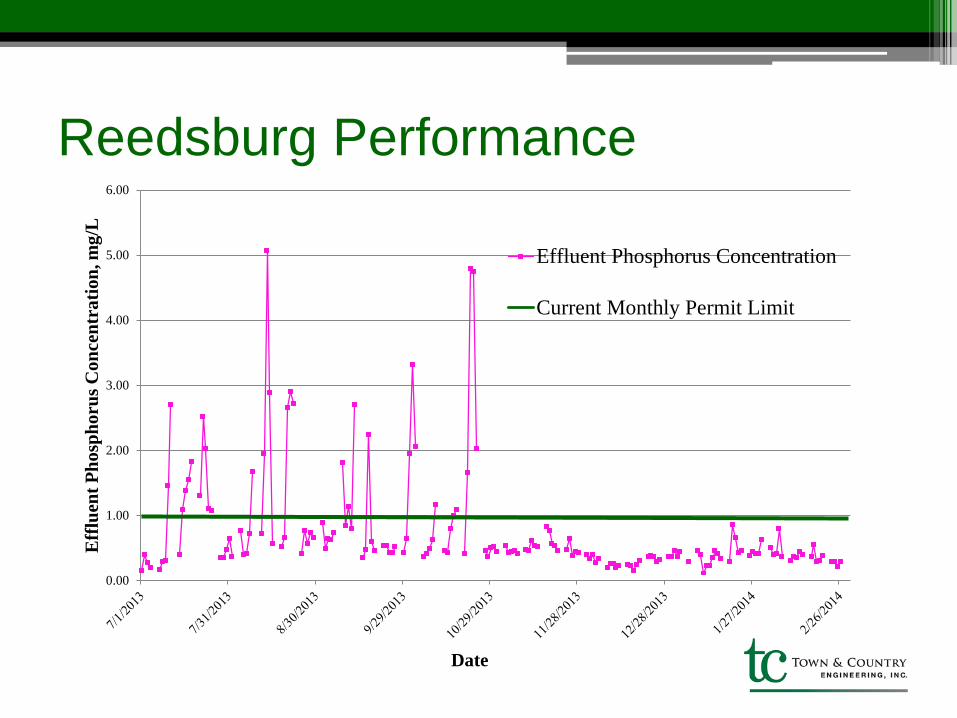
Reedsburg Performance
0.00
1.00
2.00
3.00
4.00
5.00
6.00
Eff
luen
t P
ho
sph
oru
s C
on
cen
tra
tion
, m
g/L
Date
Effluent Phosphorus Concentration
Current Monthly Permit Limit
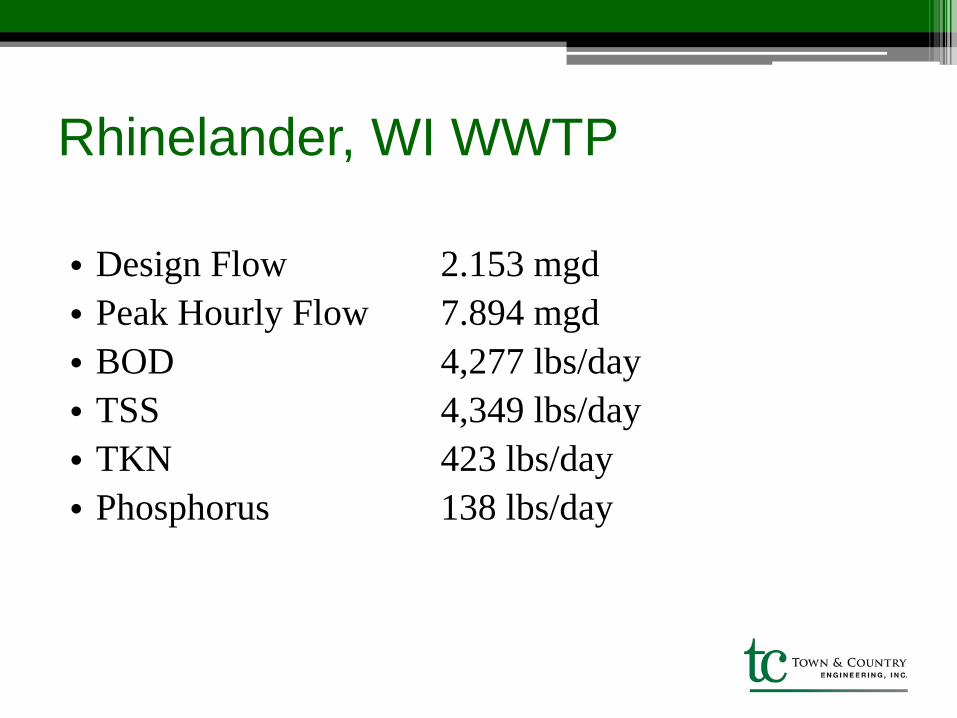
Rhinelander, WI WWTP
• Design Flow 2.153 mgd
• Peak Hourly Flow 7.894 mgd
• BOD 4,277 lbs/day
• TSS 4,349 lbs/day
• TKN 423 lbs/day
• Phosphorus 138 lbs/day
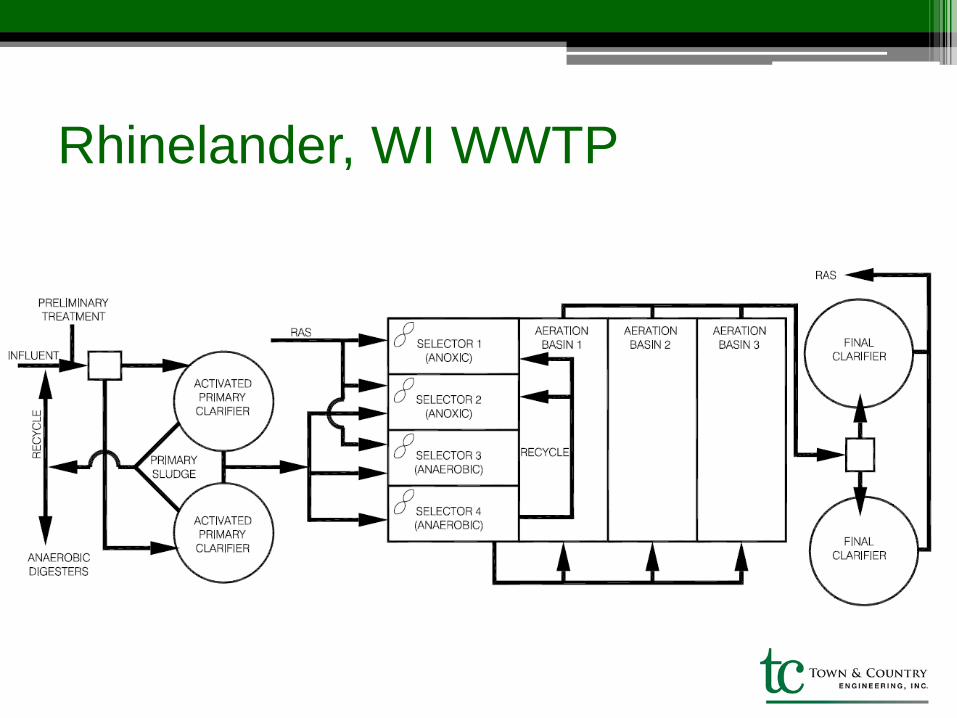
Rhinelander, WI WWTP
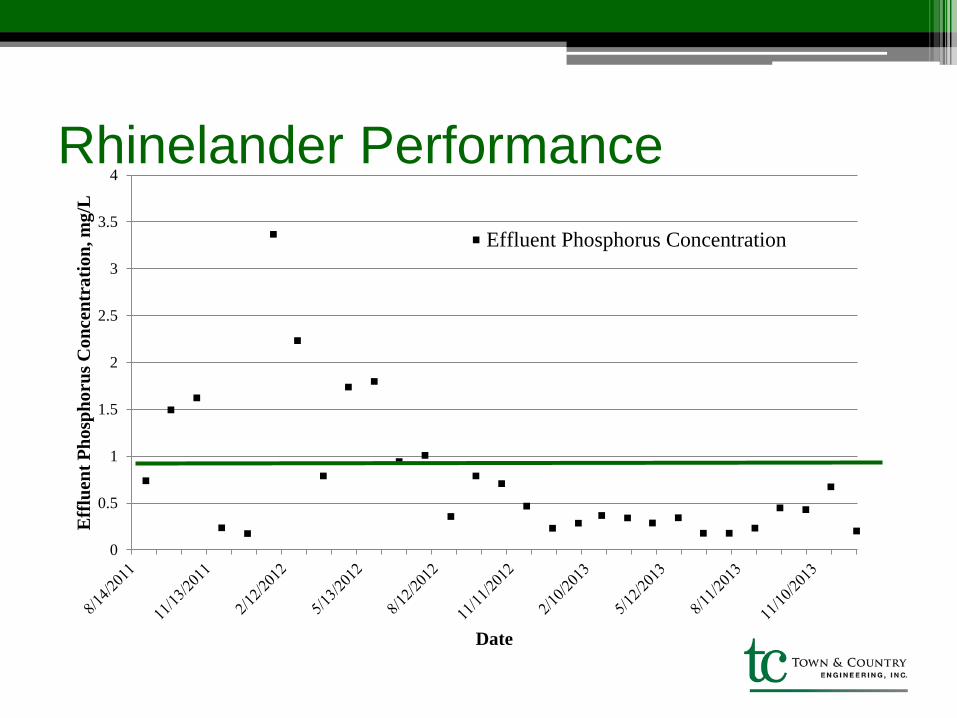
Rhinelander Performance
0
0.5
1
1.5
2
2.5
3
3.5
4
Eff
luen
t P
ho
sph
oru
s C
on
cen
tra
tion
, m
g/L
Date
Effluent Phosphorus Concentration
Rhinelander Challenges
• Anaerobic digester recycle streams
• Carbon – need to feed Bio P and anaerobic digester
• Batching for digester
• More complex controls
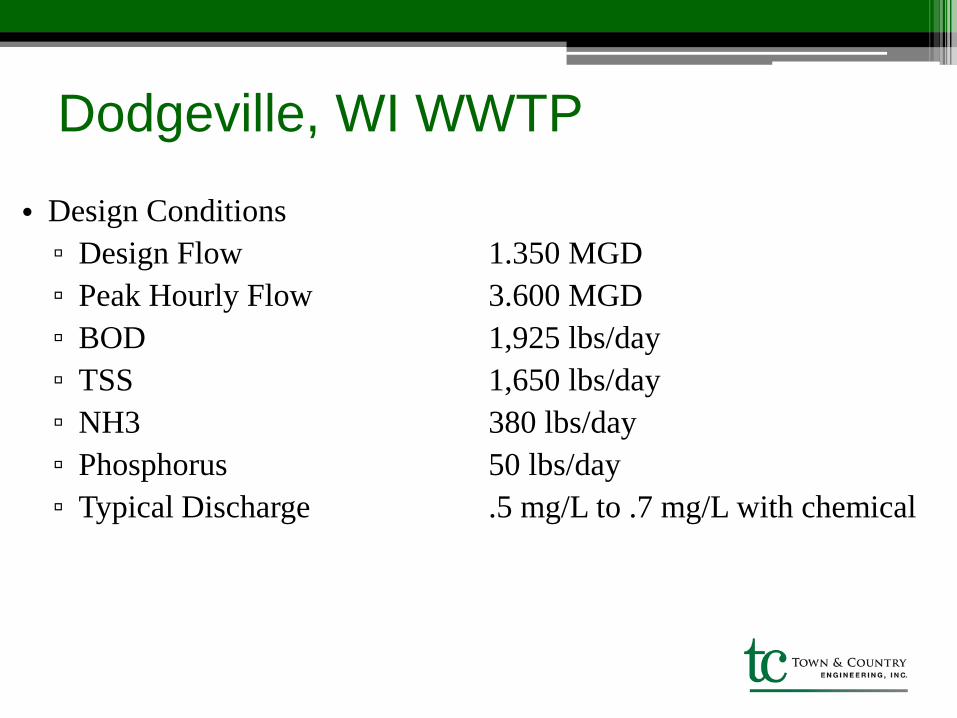
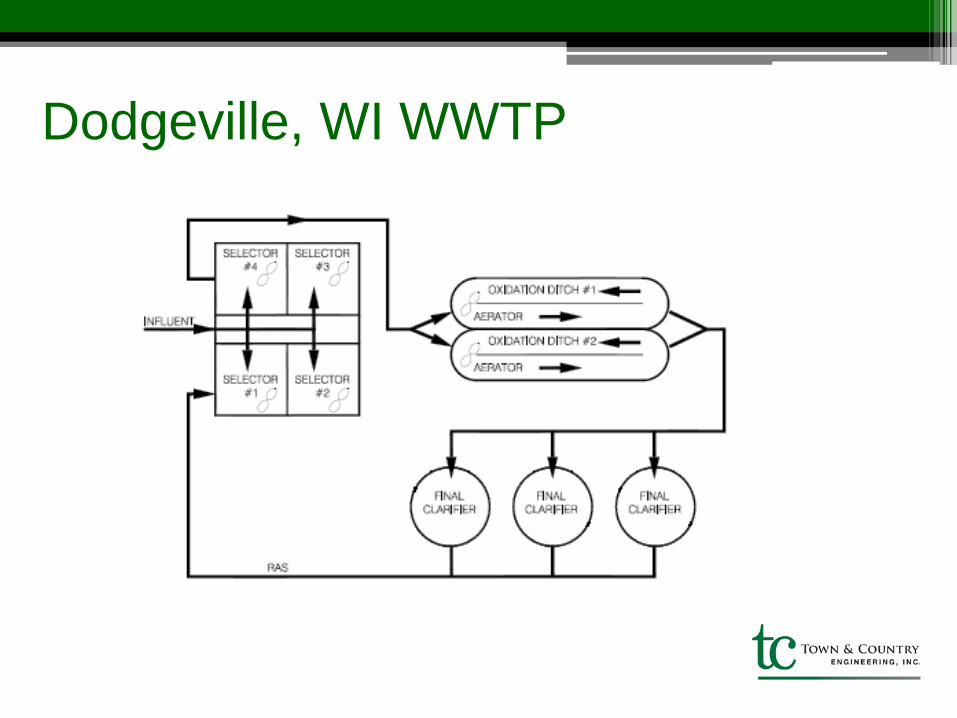
Dodgeville, WI WWTP
• Design Conditions
▫ Design Flow 1.350 MGD
▫ Peak Hourly Flow 3.600 MGD
▫ BOD 1,925 lbs/day
▫ TSS 1,650 lbs/day
▫ NH3 380 lbs/day
▫ Phosphorus 50 lbs/day
▫ Typical Discharge .5 mg/L to .7 mg/L with chemical
Dodgeville, WI WWTP
Dodgeville, WI WWTP
• WWTP Operational Modifications
▫ Revised Process Flow – Influent Flow Diverted to Tank #1
▫ Timers Added to Mixers – Operated 20 Minutes/Hour
• WWTP Improvements
▫ Effluent Improvements
Effluent P reduced to 0.30 PPM annual average
▫ Chemical Addition Reduced
Previous Chemical Addition Seasonally
Reduced Chemical Consumption – Saving >$35,000 per Year
Marshfield, WI WWTP
• Design Conditions
▫ Design Flow 7.91 MGD
▫ Peak Hourly Flow 28.0 MGD
▫ BOD 11,000 lbs/day
▫ TSS 11,100 lbs/day
▫ TKN 1,550 lbs/day
▫ Phosphorus 350 lbs/day
• Unique features
▫ High peak flow
▫ Designed for only chemical phosphorus removal
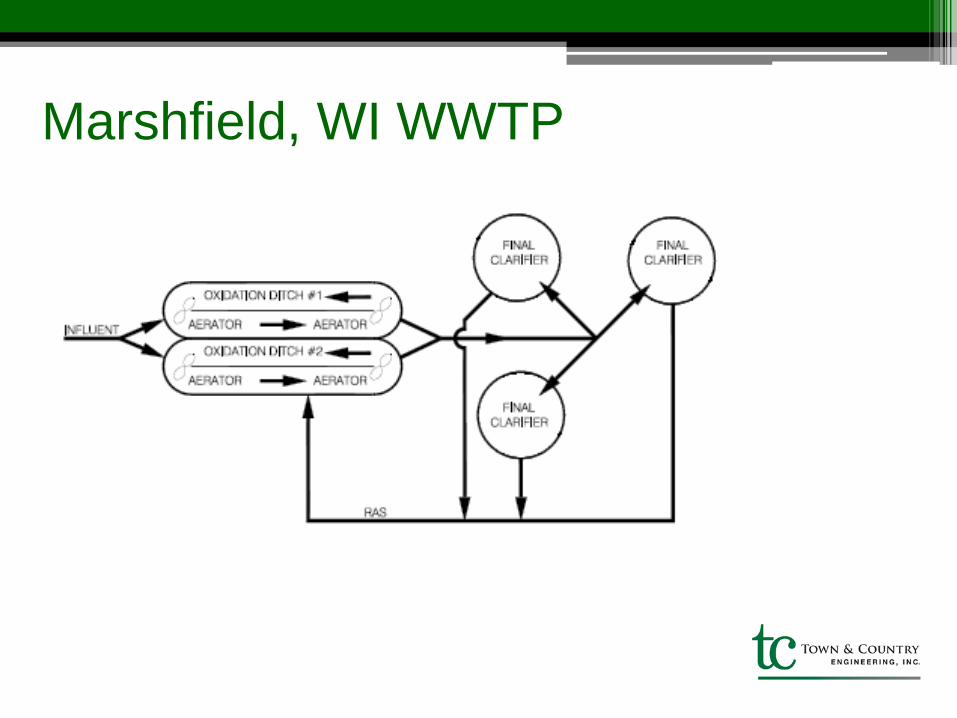
Marshfield, WI WWTP
Marshfield, WI WWTP
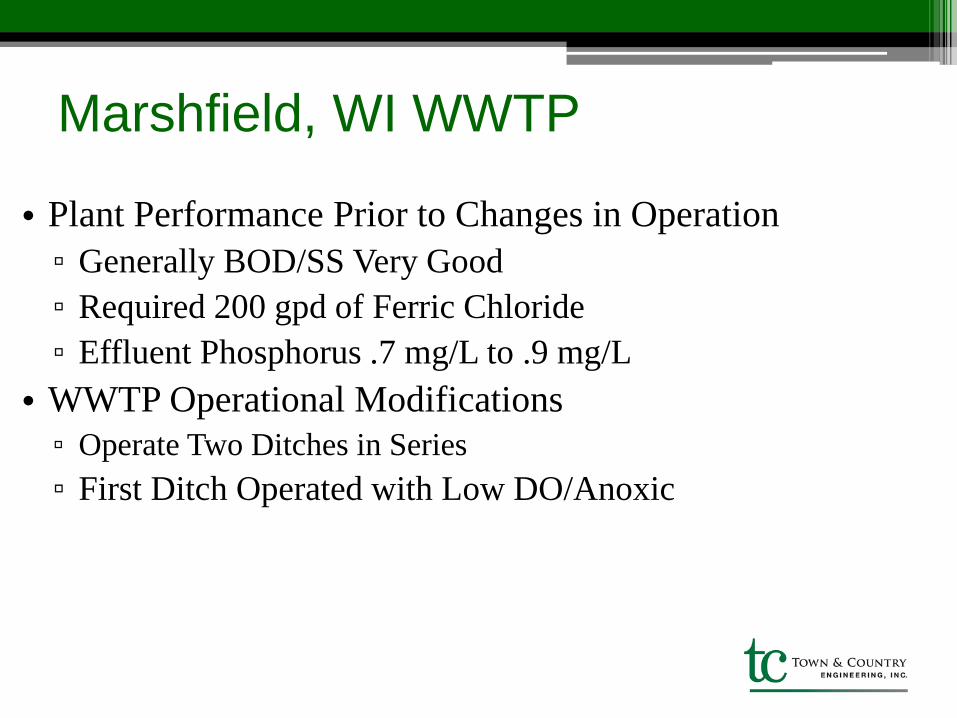
• Plant Performance Prior to Changes in Operation
▫ Generally BOD/SS Very Good
▫ Required 200 gpd of Ferric Chloride
▫ Effluent Phosphorus .7 mg/L to .9 mg/L
• WWTP Operational Modifications
▫ Operate Two Ditches in Series
▫ First Ditch Operated with Low DO/Anoxic
Marshfield, WI WWTP
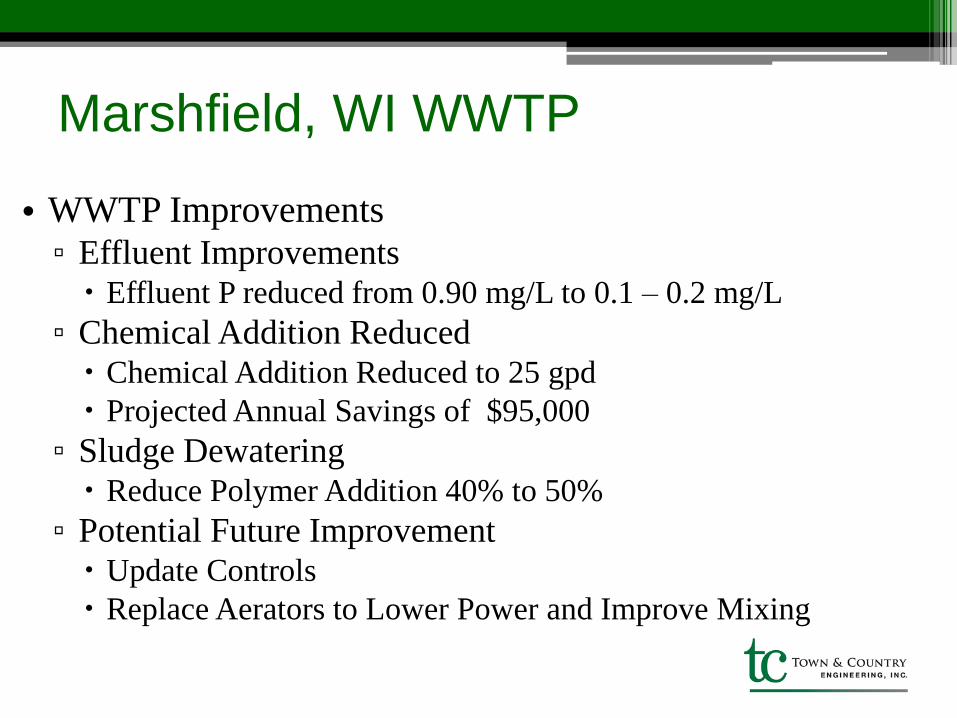
• WWTP Improvements ▫ Effluent Improvements
Effluent P reduced from 0.90 mg/L to 0.1 – 0.2 mg/L
▫ Chemical Addition Reduced Chemical Addition Reduced to 25 gpd
Projected Annual Savings of $95,000
▫ Sludge Dewatering Reduce Polymer Addition 40% to 50%
▫ Potential Future Improvement Update Controls
Replace Aerators to Lower Power and Improve Mixing
Summary
• Biological phosphorus removal is a reliable
alternative for phosphorus removal down 0.2mg/L to
0.5 mg/L or below
• Designs must incorporate flexibility to ensure
systems can be optimized
• Treatment arrangements should be suited for the
specific WWTP
• Process control allows ease of operation
Questions / Comments