cost breakdown and surcharge mapping for sea freight - a ... · pdf filecost breakdown and...
TRANSCRIPT

Lund Institute of Technology Department of Industrial Management and Logistics Engineering Logistics
Cost breakdown and surcharge mapping for sea freight
- A study for Tetra Laval Group
Authors: Johan Blom & Lars Borisson Supervisors: Per Nilsson, Global Procurement – Ocean Freight Tetra Laval Group Transport & Travel Everth Larsson, Professor Dorian Notman, Associate Professor Department of Industrial Management and Logistics Lund Institute of Thecnology

II

III
Preface The authors has during the autumn of 2008 conducted this master thesis report at Tetra Laval Group Transport & Travel with the support of the Department of Engineering Logistics at Lund University. It marks the end of the authors’ time as Mechanical Engineering students, now becoming graduates. It has been a great opportunity to get some real experience in what our engineering future may give and also the possibility to get deeply involved in a specific area of expertise. It has truly been a time of great learning and personal development. We would like to hereby give our best appreciation and regards to the people who stood out in the contribution to the outcome of this report, Per Nilsson, our supervisor and support from Team Sea at Tetra Laval Group Transport & Travel, thank you for this great opportunity and your support in all aspects in the work of completing this report. In addition the rest of team Sea, Hans Jansson and Björn Hellqvist, has contributed with their effort and time to make this report as good as possible. Professors Everth Larsson and Dorian Notman at Lund University, Faculty of Engineering has contributed with their input and view of our work and also questioned our choices when necessary. All interviewed employees at the sea freight carriers who contributed to the work of the models and gave their valuable input in many other aspects; Björn Jedvert at Maersk Line, Fredrik Magaji at MSC, Fredrik Håkansson Säll at Hyundai, Harald Dirzowski at “K” Line, Per Josefsson at Penta Shipping and Magnus Andersson at United Arab Agencies. Pierre Cariou, Professor at World Maritime University, contributed in a great way in many of our decisions and gave us a good insight in the shipping industry and related questions for this report. Magnus Kjellberg and Jenny Persson at Geodis Wilson, who are a part of the ocean freight procurement process of Tetra Laval and who contributed to the decisions made during the process. Finally we would like to thank all employees at Group Transport & Travel for their kind and helpful attitude to us, and furthermore Robert Ingvarsson, (director, GT&T) for giving us this opportunity. We are proud of this accomplishment and hopefully will all involved parts find this work solid and valuable. We are also hopeful that the reader of this report will find it interesting and useful. Lund, December 13th, 2008
Johan Blom Lars Borisson

IV

V
Abstract Title: Cost breakdown and surcharge mapping for sea freight - A study for Tetra Laval Group
Authors: Johan Blom & Lars Borisson Mechanical Engineering Graduates Lund University, Faculty of Engineering Supervisors: Per Nilsson Global Procurement – Ocean Freight Tetra Laval Group Transport & Travel Everth Larsson, Professor Dorian Notman, Associate Professor Department of Industrial Management and Logistics Lund University, Faculty of Engineering Purpose: The sea freight industry has been confronted by a major market change,
meaning that the price and surcharge cooperation within the liner shipping conference agreements in Europe has been abolished. Therefore Tetra Laval Group needs to get a better understanding of the bunker adjustment factor, currency adjustment factor and terminal handling cost, which shipping companies add to their base price, and to take control over the surcharge variations during the year. These surcharges were previously set by the liner conferences. The object of this study was to construct calculation models for the major costs that are considered possible to assess and necessary to be variable in the contracts with the sea freight suppliers. The models are not supposed to be simply theoretical, but shaped to fit Tetra Laval’s way of business.
Method: The study has been based on both statistical data and interviews in order to
get theoretically correct data as well as subjective input from concerned parties. In addition to this content analysis and literature reviews was made to obtain a broad and deep understanding of relevant areas. An analysis of the gathered data was done through logical reasoning and discussion.
Conclusions: One model for Tetra Laval Bunker Adjustment Factor (BAF) surcharge
updates has been constructed and implemented into sea freight contracts for 2009. One model for Tetra Laval Currency Adjustment Factor (CAF) surcharge updates has been constructed and proposed to be used internally during 2009 and adjusted to fit both Tetra Laval and all major sea freight suppliers and then implemented in 2010 years’ sea freight contract. The Terminal Handling Cost (THC) is considered to stay fixed for the whole contract year in the future.

VI
Key words: Bunker adjustment factor, BAF, bunker fuel, bunker fuel consumption, carrier, container, currency adjustment factor, CAF, goods flow, liner shipping conference, sea freight contract, sea freight cost breakdown, shipping, slow steaming, surcharge, Terminal Handling Cost, THC, Tetra Laval, Tetra Pak, Group Transport & Travel.

VII
Table of Contents 1 INTRODUCTION ............................................................................................................................... 1
1.1 BACKGROUND ................................................................................................................................... 1 1.2 PROBLEM DISCUSSION ...................................................................................................................... 2 1.3 OBJECTIVES AND PURPOSE ................................................................................................................ 3 1.4 FOCUS AND DELIMITATIONS.............................................................................................................. 4 1.5 TARGET GROUP ................................................................................................................................. 5 1.6 OUTLINE OF THE STUDY .................................................................................................................... 5 1.7 SUMMARY ......................................................................................................................................... 7 1.8 DEFINITIONS AND ABBREVIATIONS .................................................................................................... 8
2 METHODOLOGY ............................................................................................................................ 10
2.1 SCIENTIFIC APPROACHES ................................................................................................................. 10 2.1.1 Analytical approach .............................................................................................................. 11 2.1.2 System approach ................................................................................................................... 11 2.1.3 Actors approach .................................................................................................................... 12 2.1.4 The scientific approach in this thesis .................................................................................... 12
2.2 CHOICE OF METHODOLOGY ............................................................................................................. 12 2.2.1 Induction, deduction and abduction ...................................................................................... 13 2.2.2 Quantitative and Qualitative methods................................................................................... 13 2.2.3 Primary and secondary information ..................................................................................... 15
2.3 DATA GATHERING ........................................................................................................................... 15 2.3.1 Interviews .............................................................................................................................. 15 2.3.2 Literature review ................................................................................................................... 17 2.3.3 Content analysis .................................................................................................................... 17 2.3.4 Case Study ............................................................................................................................. 17
2.4 METHODS OF ANALYSIS................................................................................................................... 17 2.5 CRITIQUE OF SOURCES ..................................................................................................................... 18
2.5.1 Critique of primary data ....................................................................................................... 18 2.5.2 Critique of secondary data .................................................................................................... 18 2.5.3 Validity and Reliability ......................................................................................................... 19
2.6 SUMMARY ....................................................................................................................................... 21
3 COMPANY PRESENTATIONS ..................................................................................................... 23
3.1 TETRA LAVAL GROUP ..................................................................................................................... 23 3.1.1 History .................................................................................................................................. 23 3.1.2 Way of Business .................................................................................................................... 24
3.2 TETRA PAK ...................................................................................................................................... 24 3.3 DELAVAL ........................................................................................................................................ 25 3.4 SIDEL .............................................................................................................................................. 26 3.5 TETRA LAVAL GROUP TRANSPORT & TRAVEL................................................................................ 26 3.6 SHIPPERS AND PARTNERS ................................................................................................................ 28
3.6.1 Geodis Wilson ....................................................................................................................... 28 3.6.2 Maersk .................................................................................................................................. 28 3.6.3 MSC ...................................................................................................................................... 29 3.6.4 COSCO ................................................................................................................................. 29 3.6.5 “K” Line ............................................................................................................................... 30 3.6.6 Hyundai ................................................................................................................................. 30 3.6.7 UASC .................................................................................................................................... 30
3.7 SUMMARY ....................................................................................................................................... 32
4 THEORETICAL FRAME OF REFERENCE ................................................................................ 33
4.1 SEA FREIGHT ................................................................................................................................... 33 4.1.1 Structures for marine line system .......................................................................................... 33

VIII
4.1.1.1 One link................................................................................................................................................... 34 4.1.1.2 Several links ........................................................................................................................................... 34 4.1.1.3 Several links with a central link ............................................................................................................ 34 4.1.1.4 Loop systems – one-way or two-way ................................................................................................... 34 4.1.1.5 Feeder ...................................................................................................................................................... 34
4.1.2 Sea Terminals – Ports ........................................................................................................... 35 4.1.3 Imbalances and Utilization ................................................................................................... 35 4.1.4 Different types of ship ........................................................................................................... 36 4.1.5 Unit load, Containers ............................................................................................................ 37
4.2 PURCHASING ORGANISATION .......................................................................................................... 39 4.3 SUMMARY ....................................................................................................................................... 41
5 EMPIRICAL STUDY ....................................................................................................................... 42
5.1 THE SHIPPING INDUSTRY ................................................................................................................. 42 5.1.1 Industry growth ..................................................................................................................... 42 5.1.2 Carriers’ market shares ........................................................................................................ 44 5.1.3 Liner shipping conferences ................................................................................................... 45 5.1.4 Regulations and factors affecting the shipping industry ....................................................... 45 5.1.5 Shipping market outlook ....................................................................................................... 48 5.1.6 Shipping industry future development ................................................................................... 49
5.2 SEA FREIGHT GOODS FLOW .............................................................................................................. 50 5.2.1 Tetra Laval’s goods flow ....................................................................................................... 50 5.2.2 World trade goods flow ......................................................................................................... 53 5.2.3 Tetra Laval’s purchase process for sea freight ..................................................................... 56 5.2.4 Outline of sea freight contracts ............................................................................................. 58 5.2.5 Supplier evaluation ............................................................................................................... 60
5.3 COST STRUCTURE, PRICING & SURCHARGES .................................................................................... 60 5.3.1 Tetra Laval’s costs ................................................................................................................ 61 5.3.2 BAF and CAF ........................................................................................................................ 62 5.3.3 THC ....................................................................................................................................... 63 5.3.4 Other fees and surcharges .................................................................................................... 63
5.4 BUNKER ADJUSTMENT FACTOR ....................................................................................................... 64 5.4.1 The oil and bunker industry .................................................................................................. 64
5.4.1.1 Crude oil facts & figures........................................................................................................................ 64 5.4.1.2 Crude oil price – Historical development ............................................................................................. 64 5.4.1.3 Crude oil types........................................................................................................................................ 67 5.4.1.4 Bunker fuel ............................................................................................................................................. 67 5.4.1.5 Bunker fuel grades ................................................................................................................................. 68 5.4.1.6 Bunker fuel used in the sea freight industry ......................................................................................... 69 5.4.1.7 Environmental aspects ........................................................................................................................... 70
5.4.2 Managing bunker consumption levels ................................................................................... 70 5.4.2.1 Vessel speed ........................................................................................................................................... 70 5.4.2.2 Slow steaming ........................................................................................................................................ 73 5.4.2.3 Services routes ........................................................................................................................................ 74 5.4.2.4 Vessel size .............................................................................................................................................. 74
5.4.3 Vessel utilization ................................................................................................................... 77 5.4.4 Time in port ........................................................................................................................... 78 5.4.5 Congestion and carrier owned terminals .............................................................................. 78 5.4.6 Shippers opinion about BAF surcharge and historical levels ............................................... 79 5.4.7 Existing BAF models ............................................................................................................. 80
5.4.7.1 Maersk Line BAF Formula ................................................................................................................... 80 5.4.7.2 APL ......................................................................................................................................................... 81 5.4.7.3 MOL ........................................................................................................................................................ 82 5.4.7.4 UASC ...................................................................................................................................................... 83 5.4.7.5 OOCL ...................................................................................................................................................... 83 5.4.7.6 Other shippers’ BAF formulas .............................................................................................................. 83 Trends ...................................................................................................................................................................... 84
5.4.8 Carriers’ view on BAF models .............................................................................................. 84

IX
5.5 CURRENCY ADJUSTMENT FACTOR ................................................................................................... 85 5.5.1 Currency market ................................................................................................................... 85 5.5.2 Existing CAF models ............................................................................................................. 86
5.5.2.1 Maersk Line CAF formula .................................................................................................................... 86 5.5.2.2 MOL ........................................................................................................................................................ 88 5.5.2.3 UASC ...................................................................................................................................................... 88
5.5.3 Carriers’ view on CAF models ............................................................................................. 89 5.6 THC ................................................................................................................................................ 89 5.7 SUMMARY ....................................................................................................................................... 90
6 ANALYSIS ......................................................................................................................................... 92
6.1 COST STRUCTURE, PRICING & SURCHARGES .................................................................................... 92 6.2 BUNKER ADJUSTMENT FACTOR ...................................................................................................... 93
6.2.1 Cluster dividing ..................................................................................................................... 94 6.2.2 Imbalance Factor .................................................................................................................. 95 6.2.3 Update of trade lane specific parameters ............................................................................. 96 6.2.4 Fuel type................................................................................................................................ 96 6.2.5 Data source for prices ........................................................................................................... 96 6.2.6 Bunker stations ...................................................................................................................... 96 6.2.7 Vessel Size ............................................................................................................................. 97 6.2.8 Vessel Speed .......................................................................................................................... 98 6.2.9 Bunker Consumption ............................................................................................................. 98 6.2.10 Ratio between TEU and FFE ........................................................................................... 99 6.2.11 Transit time .................................................................................................................... 100 6.2.12 Utilization ....................................................................................................................... 101 6.2.13 Time in Port .................................................................................................................... 101 6.2.14 Bunker price comparison ............................................................................................... 101 6.2.15 De Minimis rule .............................................................................................................. 102 6.2.16 Valid Period ................................................................................................................... 103 6.2.17 Calculation period.......................................................................................................... 103 6.2.18 Announcement period ..................................................................................................... 103 6.2.19 Complete BAF model ..................................................................................................... 104 6.2.20 Introduction specific solutions ....................................................................................... 106 6.2.21 Tetra Laval’s BAF model compared to existing BAF models ....................................... 106
6.3 IMPLEMENTATION OF BAF MODEL ................................................................................................ 107 6.4 CURRENCY ADJUSTMENT FACTOR ................................................................................................ 107
6.4.1 Other CAF models .............................................................................................................. 108 6.4.2 CAF model proposition ....................................................................................................... 109 6.4.3 Cluster dividing ................................................................................................................... 109 6.4.4 Data source for exchange rates .......................................................................................... 109 6.4.5 Valid conditions for both BAF and CAF ............................................................................. 110 6.4.6 De Minimis rule .................................................................................................................. 110 6.4.7 Currency Baskets ................................................................................................................ 111 6.4.8 Implementation of CAF model ............................................................................................ 112
6.5 TERMINAL HANDLING COST ......................................................................................................... 113 6.6 RESULTS AND EVALUATION OF THE BAF MODEL IMPLEMENTATION ............................................. 113 6.7 SUMMARY ..................................................................................................................................... 115
7 CONCLUSIONS AND RECOMMENDATIONS ........................................................................ 116
7.1 BUNKER ADJUSTMENT FACTOR .................................................................................................... 116 7.2 CURRENCY ADJUSTMENT FACTOR ................................................................................................ 117 7.3 TERMINAL HANDLING COST ......................................................................................................... 118 7.4 GENERAL CONCLUSIONS AND RECOMMENDATIONS ...................................................................... 118 7.5 SUMMARY ..................................................................................................................................... 119
X
REFERENCES.......................................................................................................................................... 120
WRITTEN SOURCES ................................................................................................................................. 120 Literature ........................................................................................................................................... 120 Articles and reports ........................................................................................................................... 120
VERBAL SOURCES ................................................................................................................................... 122 Academics ......................................................................................................................................... 122 Geodis Wilson ................................................................................................................................... 122 The Carriers ...................................................................................................................................... 122 Team Sea ........................................................................................................................................... 122 Other ................................................................................................................................................. 122
ELECTRONIC SOURCES ............................................................................................................................ 122 Carriers’ webpages ........................................................................................................................... 123
LEGAL TEXT AND STUDIES ...................................................................................................................... 124
APPENDIX ................................................................................................................................................ 125
APPENDIX A – INTERVIEW QUESTIONS FOR CARRIERS ........................................................................... 125 APPENDIX B – TRADE LANE SPECIFIC DATA .......................................................................................... 127 APPENDIX C – LETTER WITH BAF CONDITIONS ...................................................................................... 129

XI
Table of Figures Figure 1 – Illustration of validity and reliability ............................................................... 20
Figure 2 – Tetra Laval Group’s organisation structure ..................................................... 23
Figure 3 – Tetra Laval Group’s number of employees and net sales ................................ 24
Figure 4 – Tetra Pak’s clusters .......................................................................................... 25
Figure 5 – Tetra Pak’s organisation structure ................................................................... 27
Figure 6 – Supply Chain Operation’s organisation structure ............................................ 27
Figure 7 – Tetra Laval’s top 10 sea freight suppliers in 2008, shown as percentage of total costs ................................................................................................................................... 53
Figure 8 – World Trade Imbalances 2007 ........................................................................ 54
Figure 9 – Example of two nominated shipments ............................................................. 57
Figure 10 – Cooperation between GT&T and Geodis Wilson .......................................... 58
Figure 11 – The exchange rate between USD and EURO ................................................ 63
Figure 12 – Nominal versus real prices for crude oil ........................................................ 66
Figure 13 – Plot of crude oil and Rotterdam bunker ........................................................ 68
Figure 14 – Daily bunker consumption for four different vessel sizes at different service speeds. ............................................................................................................................... 71
Figure 15 – Maersk BAF formula ..................................................................................... 81
Figure 16 – APL’s BAF model with calculation for a three months period ..................... 82
Figure 17 – Tetra Laval’s different sea freight clusters .................................................... 95

XII
List of Tables Table 1 – The Arbnor and Bjerke framework ................................................................... 11
Table 2 – Maximum gross weight (KG) of TEU & FFE containers for major sea freight carriers ............................................................................................................................... 38
Table 3 – Evolution of the cellular fleet 1988-2010 ......................................................... 43
Table 4 – Market Share of top 20 sea freight carriers ....................................................... 44
Table 5 – Legal in liner shipping before and after October 18th 2008 ............................. 47
Table 6 – Tetra Laval’s top 10 major trade lanes ............................................................. 51
Table 7 – Tetra Laval’s different commodities transported with sea freight ................... 52
Table 8 – Estimated world container trade by route for 2006 (‘000 TEU) ...................... 55
Table 9 – Cost comparison for different vessel sizes ........................................................ 61
Table 10 – Distribution of paid currencies for total volume in 2008 ................................ 62
Table 11 – Paid add on surcharges for total volumes in 2008 .......................................... 62
Table 12 – Top world oil producers and consumers ......................................................... 67
Table 13 – Vessel bunker fuel consumption ..................................................................... 72
Table 14 – Average speed and age of world fleet ............................................................. 73
Table 15 – World cellular fleet forecast ............................................................................ 75
Table 16 – Average vessel sizes ...................................................................................... 76
Table 17 – Specific vessel sizes ........................................................................................ 77
Table 18 – Correlation between Far East Freight Conference (FEFC) BAF level and IFO 380 bunker average from Rotterdam and Singapore. ....................................................... 80
Table 19 – Maersk Line CAF surcharge ........................................................................... 87
Table 20 – Cost weighting comparison ............................................................................. 88
Table 21 – Total cost and the fraction of BAF and CAF cost for a selection of nominated volume in 2008 .................................................................................................................. 92
Table 22 – The total cost development and BAF & CAF change fractions...................... 93
Table 23 – Monthly average prices and price changes at different ports .......................... 97
Table 24 – Average Vessel speeds .................................................................................... 98
Table 25 – Average Vessel bunker consumption .............................................................. 99
Table 26 – Time in port on Tetra Laval’s major trade lanes ........................................... 101
Table 27 – Example of De Minimis rule impact at 10 % and 20 %................................ 103
Table 28 – Currency basket for Europe region cluster .................................................... 112
Table 29 – Currency basket for Far East cluster region .................................................. 112

XIII

XIV

1
1 Introduction In this chapter the background of the study will be explained. This will be closely linked
with the problem discussion where circumstances affecting the study will be brought to
attention. The object and purpose will be defined as well as the focus and delimitations
clarified. The target group for whom the study is intended will be established. At the end
of the chapter there is a list of definitions and abbreviations relevant to the report.
1.1 Background
Tetra Laval Group consists of the three companies • Tetra Pak • DeLaval • Sidel
Tetra Pak manufactures processing, filling and distribution machines for the liquid food industry and also manufactures the related consumer packaging material. DeLaval provides the agriculture industry with processing machines and other types of equipment that is related to the specific industry. Sidel manufactures machines and packaging material for glass bottles including disposable and returnable bottles, plastic bottles (PET, HDPE and PP) and metal cans. The companies operation is separated from one another but some corporate functions are managed together for synergy effects. An example of this is Tetra Laval Group Transport & Travel (GT&T) which is the purchasing unit for goods transportation and employee travels for the entire group.1 Tetra Laval Group acts on a global market covering about 165 countries with their products. They have 43 packaging material plants and 12 Research & Development units spread around the world. This, together with the fact that globalization leads to new emerging market opportunities and outsourcing of operations to low wage countries makes the supply chain, logistical process and coordination problem very complex but vital for the overall business result.2 The company’s intention is that the complete transportation flow, internal and external, will be managed by GT&T. This is almost fulfilled as they are managing all the transportation flows of Tetra Pak and the majority of DeLaval and Sidel’s. Their work could be divided into procurement, supplier management, supplier negotiations and information providing services for factories and other internal company functions on a worldwide basis.3 This master thesis focuses on procurement of sea freight transportation. This industry is and has been subject to liner shipping conferences were carriers came together to decide on parts of the price setting in an opaque way. The European Community Institution for Competition Law have prohibited the presence of liner shipping conferences as of 18th October 2008 within sea freight to and from Europe, which for Tetra Laval Group stands
1 Tetra Laval internal material 2 Ibid 3 Team Sea

2
for almost two thirds of the total goods flow.4 Experts in the business anticipated that this would lead to new market terms and greater potential for competition among the sea freight carriers and that there is a good chance that changes in market terms affecting Europe in a direct way also would be followed by a beginning of global deregulation.5 Since the new market conditions took effect in the autumn of 2008 it is important that the study was made at this time. Because that allowed Tetra Laval to get better equipped for the future and maybe get an upper hand in an evolving market. In contrast to this positive market outlook for shippers such as Tetra Laval the soaring oil and fuel prices are a large concern today and it will stay a large uncertainty factor even in possible economic recession. This will probably lead to increasing focus on bunker fuel (the type of diesel fuel used aboard ships) surcharges that the carriers use to be able to adjust to price changes.6 Today’s global business environment forces large corporations to deal with costs and incomes in many different currencies and for Tetra Laval acting in about 165 countries this leads to a complex situation with many variables that have to be taken in concern to understand the fluctuations. This situation might have been used by the carriers to enlarge their profit and prosper on currency adjustment surcharges that is hard for the customer to get a clear insight of.7 Another concern for shippers that is an effect of globalization is port and terminal congestion. The main problem is that the infrastructure in ports takes a very long time to expand while the rise in container volumes for the carriers is much faster and steadily growing. The flow also becomes more complex with the increase in vessel size leading to fewer possible ports and more demanding load and unloading procedures.8 The carriers charge a terminal handling surcharge to compensate for these events which is supposed to cover the costs for container handling in port. All these factors add up to the need for a better insight and understanding of the sea freight carrier costs and its influencing facts and therefore this study has been made.9
1.2 Problem Discussion
The problem for GT&T consists of the uncertainty in price development for sea freight and a lack of understanding of the cost structure used by the carriers. These two problems are closely linked together and to avoid the uncertainty that is currently increasing due to the abolition of liner shipping conferences, one has to understand the cost structure for the carriers. If this is done, the support for the core business activities will be enhanced and the daily work will hopefully get facilitated.
4 Tetra Laval internal material 5 Maritime transport regulation ruling 4056/86 6 Tetra Laval internal material 7 Ibid 8 Lloyd’s List (2008): Special Report – Container Shipping Companies 9 Team Sea

3
The deregulation of the European maritime transport industry and the following change in the market conditions will lead to better presumptions for competition among carriers and possibilities for a shift in the balance of strength in the market between buyers and sellers.10 Soaring oil and fuel prices are a major concern for the sea freight industry but also for the transportation industry as a whole. This will be one of the most difficult questions to handle in the future for the world community. All corporations that take this into concern will benefit from it. Both in terms of higher focus on specific cost drivers but also of course the environmental awareness this will bring. 11 The situation for global corporations trading in many countries and currencies brings the need of a better management of currency fluctuations and the risk associated. It is necessary to make business assessments that lead to transparency between buyer and seller and a better understanding of how to handle them. 12 When it comes to the situation with port and terminal congestion the problem is more complex in its own nature and not easy to manage for the shippers. To some extent it has to function in the way it already does, and shippers can only adjust, but the infrastructure problem and related issues can be managed, with better understanding of underlying factors and better historical assessments as a base for forecasts. But unlike other surcharges that more easily can be quantified, the congestion has to be managed with more subjective inputs and in a broader perspective. 13
1.3 Objectives and Purpose
Tetra Laval has one year contracts with their suppliers of sea freight which consist of a fixed base price and surcharges that are varying during the year. These surcharges have prior to October 18th 2008 been set by the liner shipping conferences but because of the deregulation it has become a more open market. The overall objective and purpose of this master thesis was to look at these surcharges with focus on the bunker surcharge and what might be a fair way to handle them. This will be done by constructing surcharge update models for the major costs that are considered necessary to be variable during the contract period. The purpose of the study can be summarised in the fact that Tetra Laval wants to take full control of the one year cost forecast and be able to monitor the major variable costs associated with sea freight and decrease the amount of uncertain variables involved. This will take the form of
• An update model for Bunker Adjustment Factor (BAF) that will be implemented during the negotiations in November 2008 for the following year’s sea freight purchase agreement and monitor the updates along the year. This will be the main
10 Förstainstansrättens dom, 20/9 2003, I de förenade målen T-191/98, T-212/98 – T-214/98 11 Tetra Laval internal material 12 Team Sea 13 Ibid

4
objective of the study and therefore the most discussed subject in this master thesis.
• A Currency Adjustment Factor (CAF) update model will for the coming contract
year be an internal tool to monitor the carrier’s own updates of this surcharge and for the next year’s negotiations (November 2009) a coming full implementation of a CAF model might be possible.
• The Terminal Handling Charge (THC) has been fixed for the full contract year
historically and the purpose is to review if this is a suitable way to handle the surcharge and if it should continue to be fixed with the new market conditions (abolition of liner conferences in Europe).
The ultimate objective is to decrease the amount of surcharges or to have them fixed for the whole contract year. There will probably have to be exceptions when unforeseeable events lead to necessary additional surcharges along the contract year but the objective is to minimize these. The purpose of accepting some of these smaller surcharges is to share some unforeseeable risk with the carriers and keep good relations. On some occasions the master thesis will try to emphasize the theoretically correct aspects of the subject in question while the surcharge models developed might be objective to more subjective aspects more aligned with Tetra Laval’s way of business and therefore streamlined to fit. This means that the analysis will discuss both the theoretical and the subjective views.
1.4 Focus and Delimitations
Due to the time frame and work load for two master thesis students some well considered decisions about focus and delimitations had to be done. The focus of the report will be solely on sea freight. This is because all transportation types have their own characteristics in terms of geographical allocation of the flow, length of the transportation and unique costs and risks etc. This focus is also made because the sea freight industry has undergone a lot of evolving reforms, with the largest factor being that the European Community Institutions for Competition Law that regulates competition within maritime transport has prohibited the presence of liner shipping conferences within the transportation flows to and from Europe. This will lead to new market terms and hopefully tougher competition, it will as already discussed push the rest of the world toward similar deregulation. 14 Another reason is that the purchase of transport at GT&T is divided between teams that take responsibility for a unique transportation mode. Team Sea argues that the largest possibility of the master thesis to have a solid impact on the daily work routines and performance of the purchase process lies within sea freight.
14 Maritime transport regulation ruling 4056/86
5
Focus will be on the surcharges that has the largest impact on GT&T costs. This also implies that focus will be on the surcharges that are most variable over the contract period of one year. The focus is therefore on BAF, CAF and THC surcharges. The BAF surcharge has the largest impact on total costs and is also the one that is most variable over time. Therefore BAF analysis will be the largest focus and the BAF model will be implemented in supplier agreements already this year, followed by a CAF analysis that will be similar to the BAF analysis but slightly less strict. The CAF model will for coming contract year be an internal tool to monitor the carrier’s own updates of this surcharge and for next year a coming full implementation of the CAF model will be possible. The reason for this is that it is considered to be to extensive to implement two large models at one time and the full implementation of the CAF model had to be pushed into the near future. The THC analysis will be much shorter; this is because that the conclusion is that the THC surcharge will be fixed for the full contract year. Within sea freight there also exist some other more or less frequent surcharges e.g. war risk and congestion. These types of surcharges were concerned but turned out to be a small part of the report, because among other things they have a character of force majeure and are much more difficult to have a strict supplier agreement of. A delimitation that had to be made is to make the analysis and models for the surcharges in focus to fit the work process of GT&T and not to make them abstract and as theoretically perfect as possible. The models for surcharge updates along the contract year have to fit into current structure of agreements with suppliers and logistic partners. The purpose with this limitation is to balance between theoretical correctness and material to be useful in the working processes of a large corporation.
1.5 Target group
The main target groups consist of GT&T and other concerned within supplier management at Tetra Laval Group, the sea department at Geodis Wilson (Tetra Laval’s logistics partner) as well as academics that are involved in adjacent areas and students that are studying adjacent areas. Some affected carriers have during the process with the report also expressed interest in the result. Other people that have some basic knowledge in supply chain management and are interested in the topics will hopefully also have benefit from reading this report, for example companies in similar situation as Tetra Laval Group. The authors emphasize that the most important target group, and the absolute focus of the report and conducted work, is Team Sea at GT&T. The target group for the models is exclusively Team Sea at GT&T. The major reason for this is that surcharge update models have to fit the company in question and also the specific division and its business model.
1.6 Outline of the study
This master thesis is structured in the following way. Chapter 1 starts with explaining the background to the study, the objective and purpose along with focus and delimitations. This is followed by a chapter on methodology, describing how, and what type of data
6
have been collected and how it was analysed. This is to provide the reader with an insight when considering the research quality. Chapter 3 is strictly a presentation of the companies for whom the study is made and of the companies interviewed during the study. There is no company data specific for this study such as the GT&T working process in this chapter. All these kinds of data are presented in the empirical study. The theoretical frame of reference aims to give a background of theories that will help the reader to understand the study at hand. The empirical study and the analysis are the two main chapters of the study. To make it easier for the reader to understand how data have been analysed the same structure was used in the two chapters. First there is some general information that the reader has to have understanding of in order to put the rest of the study into the right context and then divided empirical data and analysis of BAF, CAF and THC. In the analysis the specific parameters of the models are discussed and then the complete models are presented which was the purpose of the study. Since the BAF model was implemented into contracts before the end of this study the results and views from carriers are also presented. This is not really a part of the study but might be interesting for the reader to see. The conclusions and recommendations chapter discuss how follow up of the parameters in the models should be made and the author’s views on the market and surcharges for the future.

7
1.7 Summary
Tetra Laval Group consists of three different companies; Tetra Pak, DeLaval and Sidel. The companies are separated from one another but some corporate functions are managed together for synergy effects. GT&T, the purchasing unit of goods transport and employee travels for the entire group is one of these functions. Tetra Laval Group act on a global market which makes this process more complex. This master thesis will concentrate on procurement of sea freight transportation and discuss the major surcharges of sea freight that are varying during the contract period with the focus on BAF, CAF and THC in that order. The European Community institution for Competition law have prohibited the presence of liner shipping conferences as of 18th October 2008 within sea freight to and from Europe, which for Tetra Laval Group stands for almost two thirds of the total goods flow. Experts in the business anticipated that this would lead to new market terms and greater potential for competition among the sea freight carriers. Therefore it was important that this study was done at this time. To avoid the uncertainty that is currently increasing due to this abolition shippers has to understand the cost structure of the carriers. If this is done, the support for the core business activities will enhance and the daily work will hopefully get facilitated. The study will result in the construction of surcharge update models were BAF will be implemented into contracts for 2009 and CAF in 2010. The master thesis will discuss the theoretically correct aspects of the subject in question while the surcharge models developed might be objective to more subjective aspects more aligned with Tetra Laval’s way of business and therefore streamlined to fit, since GT&T is the main target groups for the study.
8
1.8 Definitions and abbreviations
BAF Bunker adjustment factor is a surcharge upon the sea freight base price to compensate for the fluctuations in bunker fuel prices. CAF Currency adjustment factor is a surcharge upon the sea freight base price to compensate for the fluctuations in foreign exchange rates. FFE (Forty Foot Equivalent Unit) One 40 Foot ISO container equals two TEU containers. GT&T GT&T is a simplified abbreviation for Tetra Laval Group Transport and Travel. See chapter 3 for company presentation. Nomination The nomination is the forecasted sea freight container volume for one year that the annual contract with carriers is based on. Liner conference Shipping conferences refers to a group of shipping companies that forms an association to agree on and set freight rates and passenger fares at different shipping routes. There are different shipping conferences for different regions of the world. Shipping conferences, aside from setting rates, adapt a wide number of policies such as allocation of customers, loyalty contracts, open pricing contracts, etc. In many jurisdictions, shipping conferences are exempt from the application of competition laws but this position is being increasingly changed in order to promote greater competition and choice for shippers. Liner Shipping Company Refers to companies that operate the container ships and associated responsibilities Sea carrier See, Liner Shipping Company Sea shipper Refers to the companies that hire the sea carriers for shipping of their goods. Shipment Actual sending of a container on a container vessel.

9
Shipping Alliances Strategic alliances among liner shipping companies started in 1994. It implies that members of an alliance are not involved in price-setting (as this is done within the conferences they belong to) but in the rationalization of capacity through such schemes as vessel, terminal and equipment sharing, joint-scheduling, slot chartering, etc. These types of cooperation will not be affected by the new EC Competition regulation. TEU (Twenty Foot Equivalent Unit) The standard unit for counting containers of various capacities and for describing the capacities of container ships or terminals is called twenty foot equivalent unit (TEU). One 20 Foot ISO container equals one TEU. THC Terminal Handling Cost is a surcharge upon the sea freight base price that is supposed to be a unique amount for every port and its associated costs. Transhipment The term for when containers are repositioned in port from one vessel to another vessel on a specific route. Vessel When referred to, the meaning is always a ship that carries containers.

10
2 Methodology This chapter gives a description of how the research of this thesis has been carried out
and how data has been collected and analyzed. This is to show that the authors possess
knowledge in the field of methodology and that choices that have been made were
thought through.
2.1 Scientific approaches
There are several different points of view when it comes to scientific approaches. If these different approaches were applied to the same problem they would most likely give very different types of answers whereas none have to be incorrect, however it is more or less appropriate to use a certain approach in a given situation. Therefore the researcher has to possess knowledge of different approaches in order to use the most suitable for the prospective study. There are also several different classifications, more or less accepted on the subject. This chapter presents a classification made by Arbnor and Bjerke.15 One of the more traditional scientific philosophies is positivism, which main characteristic is the thesis of authentication. It is based on the assumption that a scientific theorem is only meaningful if it can be verified empirically. The perpetrators of positivism are mainly natural scientist16 and almost all logistic research is conducted within this paradigm. As a consequence there is mainly one kind of logistic research and it is based on the positivistic approach. Arbnor and Bjerke have delineated a methodology framework for creating business knowledge that adapts well for analyzing logistic research. They divided research into three different schools; the analytical approach, the system approach and the actors approach. In comparison to other methodology frameworks Arbnor and Bjerke see the system approach as an approach in line with positivism. These schools provide a solid base for analyzing existing research and a direction for future research within logistics.17 Table 1 show Arbnor and Bjerke’s framework, moving from left to right the research becomes more qualitative and less abstract.
15 Arbnor & Bjerke (1994): Företagsekonomisk metodlära (2nd ed.) 16 Wallén (1993): Vetenskapsteori och forskningmetodik 17 Gammelgaard (2003): Schools in logistics research

11
Table 1 – The Arbnor and Bjerke framework18
2.1.1 Analytical approach
The analytical approach is closely related to the positivistic research19 and states that reality is objective and can be understood by performing research on its parts. The smaller the parts are the easier they are to investigate and the easier it becomes to get a deeper understanding, explain events and find cause-effect-relations. The basic assumption is that the world can be analytically decomposed and that each part can stand alone. The approach seeks general, time and value free independent explanations. The person carrying out the research must be an external observer with no influence on the reality studied and the researcher’s individual characteristics is therefore unimportant.20
2.1.2 System approach
The system approach is based on system theory and in line with a holistic perspective that often is emphasized in logistic research. This is an opposite of the atomistic approach that is used in the analytical approach. This means that the approach takes synergy effects into account and that decomposing reality into smaller elements is pointless since the components must be understood as a system with parts, links, goals and feedback mechanisms.21 The system approach is pragmatic in its nature and focuses on the search for a problem solution that works in practice rather than an absolute truth or universal cause-effect-relationships. According to Gammelgaard22 the researcher should be very close to the research object, in fact even be able to influence the object to do this. This differs from the traditional system theory were the researcher is more of an observer.23
18 Gammelgaard based on Arbnor and Bjerke 19 Gammelgaard (2003): Schools in logistics research?
20 Arbnor & Bjerke (1994): Företagsekonomisk metodlära (2nd ed.)
21 Ibid
22 Gammelgaard (2003): Schools in logistics research?
23 Arbnor & Bjerke (1994): Företagsekonomisk metodlära (2nd ed.)

12
2.1.3 Actors approach
This approach is based on sociological meta-theories and is in many ways in line with hermeneutics, which is about the interpretations of text, symbols, art and people’s behaviour.24 In this approach reality cannot be seen as objective but as a result of various social constructions. The researcher is involved and affects the system and the creation depends on the researcher’s interpretation.25 The actors approach seeks to show that terms such as supply chain management must be understood and implemented differently in different organisations according to their individual context. Knowledge is seen as created through understanding rather than explaining, i.e. the opposite of positivism. Almost all previous research within logistics has been done either in the analytical or systematic approach. But the actors approach is an important supplement.26
2.1.4 The scientific approach in this thesis
This study is conducted within the system approach. This is mainly due to the need for the holistic perspective that so often is important in logistic research. It is also important for the result of the study to work in practice and therefore looking at only the contributing factors and their stand alone cause-effect relations might result in models that are very hard to implement. For this reason it would be impossible to use an analytical approach in this study. The study only examines Tetra Laval’s situation which can be seen as investigating a limited system with set boundaries. This means focus on finding a solution suitable for fitting in with Tetra Laval’s current way of working. Because of this it might be impossible to draw general conclusions from the study since some factors are dependent on the unique relationship between the carrier and the shipper. Just as in most other logistic research the actors approach was not considered suitable since it puts too much consideration to interpretations and qualitative data and not on figures and quantitative data. The researcher can to some extent be seen as inside and able to influence the objects of the study which is in line with Gammelgaard’s view of the position of the researcher.
2.2 Choice of methodology
The choice of an appropriate research methodology is influenced by several different factors. One is the format of the question i.e. “how”, “why”, “what” etc. that each may require different research methods. Other important factors that also need to be taken in consideration are for example the nature of the study, if it is coeval or historical and the researcher’s philosophical stance.27
24 Gammelgaard (2003): Schools in logistics research?
25 Arbnor & Bjerke (1994): Företagsekonomisk metodlära (2nd ed.)
26 Ibid 27 Frankel et al. (2005): The “white space” of logistics research: A look at the role of methods usage

13
It is therefore important for the researcher to know what research methods that are available, and which one that is the most suitable for the research task at hand. It is also important to know what the strengths and weaknesses of the different methods are, so that the consequences of the choice of method can be considered.
2.2.1 Induction, deduction and abduction
There are two main approaches when deciding methods, inductive approach and deductive approach. The inductive approach starts with the gathering of data that then is to be analyzed in an attempt to create a theory. The approach has been subject to extensive criticism for that the created theory will not contain anything that is not already in the empirical data. This approach is however good when exploring new fields of expertise, otherwise it would be difficult to form new theories. In the deductive approach theories are to be verified through empirical research. This of course will give differences and variations in results.28 The function of a theory is to explain the nature of the phenomenon, how it is to be interpreted, the characteristics and how different factors interoperate. In a deductive approach the choice of theory is crucial since it will have a major impact on the outcome. Therefore the researcher has to reflect on what the consequences will be of their choice. In contrast to this is the inductive approach where the data gathering is the crucial part of the study, not said that the theory is unimportant.29 A third kind of logical reasoning is abduction. This method combines the two previous and is used for research where you are not using a strict inductive approach, or a strict deductive one. The aim is to use existing theories for the analysis but at the same time enable the researcher to use the empirical information to find new relationships. 30 In this thesis a deductive approach was mainly used where available information and previous studies on the subject were examined to get a theoretical frame of reference. Some parts of the study, for example the creation of the calculation models can be seen as abductive since the researchers not only analysed existing data but also tried to find new relationships in the empirical information.
2.2.2 Quantitative and Qualitative methods
Methodology ranges from the two extremes, the more objective and scientific quantitative method and the more subjective, interpretive and constructive qualitative method.31 Qualitative research is a method used to identify unfamiliar phenomenon in order to obtain a more profound comprehension about a specific subject or incident. Qualitative
28 Wallén (1993): Vetenskapsteori och forskningmetodik 29 Ibid 30 Ibid 31 Miles & Huberman (1994): Qualitative Data Analysis

14
methods are mostly used to identify values of more dimensions than technical as for example research within the field of social science. 32 Qualitative methods primarily create meanings and explanations for research phenomenon and the data collection is often associated with interviews, observation and participant observation, questionnaires and case studies. Qualitative studies are also often given a lower credibility based on preserved problems with validity.33 One of the major criticisms issued qualitative methodology like interviews is that it never can be 100% objective, you can only perform a certain number of observations hence you are unable to draw general conclusions. Once again the importance of reflection of your choices has to be made. When the study is finished your methods and methodologies have to be well underpinned, with no "loose ends".34 Quantitative research is of a more general nature and all information can be measured and valued numerically. To be able to draw correct and generalised conclusions that are valid for a larger variety of situations it is important that the collection of data is conducted in a structured way. Structured data collection helps to ensure that the studied cases represent an average of all case characteristics.35 Quantitative methods are often used within the field of natural science.36 The main weakness of quantitative research methods is the simple fact that new information found during the data collection cannot be considered and there are no guarantees that the questions asked are the most relevant. 37 There is also a risk when using quantitative methods like surveys that not all participants will understand or be willing to answer the questions in a correct and truthful way.38 However the choice of questions is very crucial for the end result. With the right questions the qualitative methodology is likely to give a "more correct" result. 39 There are an increasing number of researchers that argue that one should attempt to mix both methods to some extent since it provides more perspectives on the studied subject. 40 In this thesis both methods are used which is in line with table 1 and its statements of suitable method when having a system approach to the study. Qualitative methods like interviews are mixed with calculations on actual figures from Tetra Laval’s freight data. By doing this the researchers hope to be able to create models that are based both on actual theoretically figures as well as carriers inputs and views on the subject. By doing
32 Björklund & Paulsson (2003): Seminarieboken: att skriva, presentera och opponera 33 Frankel et al. (2005): The “white space” of logistics research: A look at the role of methods usage 34 Wallén (1993): Vetenskapsteori och forskningmetodik 35 Holme & Solvang (1997): Forskningsmetodik om kvalitativa och kvantitativa metoder (2nd ed.) 36 Björklund & Paulsson (2003): Seminarieboken: att skriva, presentera och opponera 37 Holme & Solvang (1997): Forskningsmetodik om kvalitativa och kvantitativa metoder (2nd ed.) 38 Larsson, Everth, LTH, 2008-10-10 39 Wallén (1993): Vetenskapsteori och forskningmetodik 40 Frankel et al. (2005): The “white space” of logistics research: A look at the role of methods usage

15
this the results will most likely be easier to implement in Tetra Laval’s work process since the models aim to be fair on a theoretical level as well as adjusted for Tetra Laval’s situation and their sea freight supplier relations.
2.2.3 Primary and secondary information
The information gathered can be divided into two categories, primary and secondary data. The primary data is the one that does not exist before the study and is unique for the research. Examples of how primary data is collected are; interviews, questionnaires, and case studies. Secondary data is data that has already been gathered prior to the study, maybe for another purpose. An example of secondary data is literature studies. When using secondary data it is crucial to critically review the source of data in order to confirm validity and reliability. 41
2.3 Data gathering
Gathering data is an important part in the study or research. There are several different ways to gather information and the eight primary methods are surveys or questionnaires, interviews, observations, focus groups, case studies, experiments, literature reviews or content analysis. In this thesis the main sources have been interviews, literature reviews, content analysis and case studies.42 Wallén have the opinion that the gatherer of data need to have a certain understanding of his field. Certainly this is important but there is a risk involved, the scientist's knowledge can compromise the result due to preconceptions. To prevent this risk careful reflection need to be undertaken by the persons involved. The source of information needs to be reviewed thoroughly. The information needs to be put in its context and you have to have an understanding of why and how it was formed. There are other issues to discuss when gathering/reviewing data for example, is it accurate and up to date, is it accessible to everyone and are there different independent sources.43 The lack of adequate training and knowledge of the methods involved in the research as well as lack of clear connection between the research strategy and appropriate data collection method can lead to situations in which the researcher asking the wrong questions or lack the ability to link the research data with its original conceptual propositions. 44
2.3.1 Interviews
Interviews can cover a wide range of formats but are generally designed as a personal meeting between the interviewer and the respondent. The type of interview range from completely structured to unstructured with semi-structured in between. The completely structured interview can be seen as a verbal survey with fixed questions. On the other end of the scale is the unstructured interview which is a much looser and more flexible kind of interview that can be seen as a deeper and more personal interview. The 41 Wallén (1993): Vetenskapsteori och forskningmetodik 42 Frankel et al. (2005): The “white space” of logistics research: A look at the role of methods usage 43 Wallén (1993): Vetenskapsteori och forskningmetodik 44 Frankel et al. (2005): The “white space” of logistics research: A look at the role of methods usage
16
semi-structured interview has a clear agenda for the interview but there is room for attendant questions and discussion. In general one can say that the looser the interview the less comparable the gathered information becomes.45 Delimitations that are justified when doing interviews for the study are to focus on the six largest suppliers of sea freight service for Tetra Laval Group. Together they stand for about 75 % of the total sea freight purchase value in 2008 and this will give the proper balance between reliability in the report and amount of data and time that has to be dedicated.46 The intention of the interviews was to get input about carriers view on the new market conditions that are coming and how this will affect prices, surcharges and competition conditions. There were also discussion about specific costs and how they are handled by carriers and how they manage their fleet and other business specific topics. The complete questionnaire can be seen in appendix A. The implication of the commodity characteristic of the sea freight service means that it probably do not exists that many different ways of doing business in. The focus is therefore on cost management and economies of scale for example.47 This characteristic also means that interviews with six different carriers will cover a sufficient amount of possible different opinions for certain. The six interviewed carriers can be seen in chapter
3 – Company Presentation. When choosing which carriers to interview the primary criteria was how they handle their surcharges when communicating with customers. This is a major concern for the carriers because they want a good balance between customer friendliness and possible cost recovery and that affect how they represent their price structure. The carriers that were chosen have some variations in how they present their surcharges to customers. The extremes are carriers that show exactly how they calculate their surcharges and all included parameters, when they will vary and high geographically specificity and the other who just present the exact amounts of surcharge with low geographically specificity. Between these extremes you have the rest of the carriers. The report covers the extremes and also some carriers in between. Altogether this will give a good reliability. The interview objects also covers corporations from many different parts of the world. The interviews were conducted in a semi-structured format with the same questions for all the carriers. This choice gave a good comparability among the different interviews and patterns in opinions were observed, increasing the reliability. In the empirical chapter opinions from the interviews are presented. This text will be integrated with other empirical references but referred to as The Carriers, meaning that the opinions are from one or many interviewed carrier employees.
45 Frankel et al. (2005): The “white space” of logistics research: A look at the role of methods usage
46 Tetra Laval internal material
47 The Carriers
17
2.3.2 Literature review
Literature reviews involve an in-depth analysis and summary of previously collected data e.g. secondary data. The purpose is to find a research gap that needs to be addressed for future studies. The review of relevant literature also helps the researcher with getting a meaningful map of existing connections between different areas of literature. 48 For this study literature in the fields of logistics, shipping and oil industry was reviewed in order to get a good background of the prospective study.
2.3.3 Content analysis
The content analysis of documents, websites, archival records etc. can provide a broad coverage of data over an extended time period. The data sources can include published and unpublished documents, company reports, memos, letters, reports, email messages, faxes, newspaper articles, web-pages etc. Typical problems associated with this kind of information gathering include difficulties involving retrieving data and the inherent researcher bias in source selection and reporting.49
2.3.4 Case Study
A case study is an empirical inquiry that investigates a contemporary phenomenon within its real life context. It is an ideal method for getting a holistic an in-depth perspective. There are three different forms of case studies; exploratory, explanatory and descriptive.50 A case study is a precise and accurate study of a specific study put in context. A case for a study can be a school, a community, an organization, a family or a company. A case study allows the research to further explore an object in a specific context.51 The strength of the case study approach lies in its ability to uncover subtle distinctions and provide a richness of understanding and multiple perspectives that experienced researchers are able to obtain.52
2.4 Methods of analysis
When the empirical data has been collected it needs to be analysed and preferably also visualized. There are usually big differences between analysing qualitative and quantitative data. It is a general assumption that methods for analysing qualitative data is more time-consuming than methods for analysing quantitative data and that it also gives a less reliable result. This is of course not always the case. The best researches often combine both qualitative and quantitative data, but then the mix should be modified according to the principal’s demand and the validity of the data.53 The main method used when analysing data in this thesis was through logical reasoning and discussions where advantages and disadvantages were compared and discussed in order 48 Frankel et al. (2005): The “white space” of logistics research: A look at the role of methods usage 49 Ibid 50 Ibid 51 Bryman (2004): Social Research Methods 52 Frankel et al. (2005): The “white space” of logistics research: A look at the role of methods usage 53 Andersen (1998): Den uppenbara verkligheten

18
to try to fulfill the purpose of the report. The reason for this was that the qualitative data collected during the interviews were considered important for whether or not the results would be possible to implement in reality. The problem with logical reasoning, more than with other analysis methods, is that the quality of the outcome of the analysis depends on the analyst. No established analysing tools such as Porter’s five forces or SWOT were used in this thesis. This is because no tools were found that was considered to be in line with the objectives or helpful to the study.
2.5 Critique of sources
For the results of a study to become valid and reliable it is important for the researchers to be aware of how they view different sources and chose between them in a critical way. It is also important that they do their best to increase the validity and reliability of the sources that might be questionable.
2.5.1 Critique of primary data
When gathering empirical data for the study, agencies were interviewed. Therefore no personnel with any key responsibility for surcharges within respective carrier company were interviewed. This gives a varying validity in their responses that is hard to measure. The answers from the interviews have been verified by writing all the interview material down and then sent back to the interview objects that have corrected and added data and then approved it. After reminding twice two out of six did not validate the answers. Although the risk of lower validity of the opinions in a strict theoretical view may exist, the importance of the interviews are still high because it will be these employees that will be counterpart in the negotiations and therefore their opinion is still important. When contacting the interviewed persons a cover letter stating who the authors were, what they studied and that they were Tetra Laval representatives was attached. This most likely made the persons in question act with more compliance since Tetra Laval is an important costumer. All interviewed persons except for Professor Pierre Cariou at WMU are part of the shipping industry either as carrier or shipper representatives and therefore have somewhat of an own agenda. This has to be taken into consideration when analysing their answers on questions concerning subjective areas like competition between carriers and market development. On questions concerning hard fact and numbers on the other hand the researchers see no problem with getting the answers from an interview instead of a printed source. Professor Pierre Cariou answers on some subjects can therefore be seen as the most reliable source of primary data.
2.5.2 Critique of secondary data
The biggest problem with secondary data lays in its nature of it being gathered for purposes other than this study in particular and therefore it is not always adjusted to fit the study in the best way. The problem becomes most evident when data has to be adjusted to Tetra Laval and their conditions which very few of the secondary sources have taken into consideration.

19
There are different companies and agencies that collect and sell a lot of information and data that might be helpful for the study. The problem is that they charge to high amount for what was considered reasonable for this thesis. Therefore the researchers sometimes had to settle for a smaller set of data that they were able to obtain for free.
2.5.3 Validity and Reliability
Validity and reliability are important factors when performing a study. The definition of validity is that the measuring instrument should not generate systematic errors. Reliability aim to secure that the measuring instrument should not generate any random errors. Since the use of different measuring instruments within different research fields these aspects are more or less achievable. For example natural science measurements are often performed with a tool, giving a direct result. While in psychology one may use an interview as instrument. With this method it is harder to achieve validity and reliability since the answers are always interpreted by a person that is more or less objective. In both cases it is important to have a well documented plan describing the methods and prerequisites for the study in order to achieve validity and reliability. 54 "Validity: to what extent you measure what you are supposed to.”
55
With validity you try to ensure that no systematical errors occur. There are two types of validation; theoretical and empirical. Theoretical validity is defined as that what is being measured is well defined and delimitated. The relation between parameters within theories and what is measured should be clarified. Empirical validity is connected to how well you can forecast the results before the study is made.56
"Reliability: To what extent you get the same result with repeated trials"57
Reliability concerns the measurement instrument and how precise the result is. Reliability can be judged by conformity of the results with repeated trials.58 Reliability and validity is further illustrated in figure 1. The picture to the left lacks in both validity and reliability, the one in the middle has good reliability but poor validity, the one to the right has both good validity and good reliability.
54 Wallén (1993): Vetenskapsteori och forskningmetodik 55 Björklund & Paulsson (2003): Seminarieboken: att skriva, presentera och opponera 56 Wallén (1993): Vetenskapsteori och forskningmetodik 57 Björklund & Paulsson (2003): Seminarieboken: att skriva, presentera och opponera 58 Wallén (1993): Vetenskapsteori och forskningmetodik

20
Figure 1 – Illustration of validity and reliability59
This report does not aim to be simply theoretical, but shaped to fit Tetra Laval’s way of business. Because of the purpose to make models that are as easy and fair as possible to implement into both contracts and the work process, sometimes subjective views have to be taken into consideration. This means that Tetra Laval’s and also the sea freight suppliers’ organisation and work processes have to be taken into consideration when constructing the model and work routines. This increases the reliability that all parties will adapt the model and feel comfortable with it. The reliability in the report was increased with the focus on using as many sources as possible and that they also should have a high trustworthiness and acceptance in their respective are of expertise. This was along the process with this report considered as very important to get acceptance of the models. When assessing all the collected data and parameters that had such high reliability as possible the result will be that the validity increases also because of the amount of different sources for all data and parameters. Because of the close cooperation with the members of Team Sea at GT&T the models internal acceptance from Tetra Laval will be good. Every major step and decision about the models was discussed and clearance was given by the involved parties that are supposed to use it in the future.
59 Lindroth (2001): Reflection on Process-based Supply Chain Modeling and Analysis

21
2.6 Summary
There are several different views on the field of methodology and in order to get valid and reliable results it is important for the researcher to know which research methods are available, and which is the most suitable for the research task at hand. In this way the researcher can make thought through choices most suitable for the prospective study. Arbnor and Bjerke have delineated a methodology framework for creating business knowledge that adapts well for analyzing logistic research. They divided research into three different schools; the analytical approach, the system approach and the actors approach. This study is done within the system approach because it is in line with the holistic perspective that often is emphasized in logistic research. This means that the approach takes synergy effects into account and focuses on the search for a problem solution that works in practice rather than an absolute truth or universal cause-effect-relationships. This was necessary since the result should be suitable for fitting in with Tetra Laval’s current way of working. In this thesis a deductive approach was mainly used where available information and previous studies on the subject were examined to get a theoretical frame of reference. Some parts of the study, for example the creation of the calculation models can be seen as abductive since the researchers not only analysed existing data but also tried to find new relationships in the empirical information. There are an increasing number of researchers that argue that one should attempt to mix both the more objective and scientific quantitative method with the more subjective, interpretive and constructive qualitative style. That was done in this master thesis in order to be able to create models that are based both on actual theoretically figures as well as carrier’s inputs and views on the subject. By doing this the results will more likely be easier to implement in Tetra Laval’s work since the models aim to be fair on a theoretical level as well as adjusted for Tetra Laval’s situation and their sea freight supplier base. The main sources have been interviews, literature reviews and content analysis. Six carriers that together stand for about 75 % of the total sea freight purchase value in 2008 were interviewed in a semi-structured format with the same questions for all the carriers. This was to consolidate the empirical data in practice. The main method used when analysing data in this thesis was mainly through logical reasoning and discussions where advantages and disadvantages were compared and discussed in order to try to fulfill the purpose of the report. Almost all interviewed persons are part of the shipping industry either as carrier or shipper representatives and therefore have somewhat of an own agenda. This had to be taken into consideration when analysing their answers on questions concerning subjective areas like competition between carriers and market development.

22
The reliability in the report was increased with the focus on using as many sources as possible and that they also should have a high trustworthiness and acceptance in their respective business. Because of the close cooperation with the members of Team Sea at GT&T the models internal acceptance from Tetra Laval will be good.

23
3 Company presentations Group Transport & Travel (GT&T) handles processes concerning purchasing of
transport and travel for the whole Tetra Laval Group. Here are the different companies
in the group presented along with a description of GT&T. The different sea freight
carriers that were interviewed and the logistic partner Geodis Wilson are also presented.
3.1 Tetra Laval Group
The Tetra Laval Group is a private industrial group of Swedish origin headquartered in Switzerland. The group consists of the three independent industry companies Tetra Pak, DeLaval and Sidel. The current organisational structure of Tetra Laval Group can be seen in figure 2. The companies' activities are focused on systems for processing, packaging and distribution of food and accessories for dairy production and animal husbandry. The three industry groups are leaders within their respective areas of business. Although they operate independently they cooperate to develop synergies between the groups.60
Figure 2 – Tetra Laval Group’s organisation structure61
3.1.1 History
The group was founded in 1991 when Tetra Pak acquired the company Alfa Laval, one of the world’s largest suppliers of equipment for the food and processing industries and agriculture. The name of the organisation was originally Tetra Pak Alfa-Laval Group. Tetra Pak and Alfa-Laval's distinct activities continued to be conducted separately by the two corporations. During 1992, the organisation gradually restructured, and on January 1st, 1993, the group took the name Tetra Laval. The new Tetra Laval Group consisted of four industry groups, Tetra Pak, Tetra Laval Food, Alfa Laval and Alfa Laval Agri.62 In order to meet increasing competition, those units within Tetra Laval that logically belonged together had been integrated into the same organisations in 1996. During the course of the year, therefore, the majority of Tetra Laval Food has been integrated with Tetra Pak. In 2000 Alfa Laval was sold to the private equity firm Industri Kapital but Alfa Laval Agri, a leading producer of dairy and farming machinery that had been split from Alfa Laval when it was bought remained a part of the Tetra Laval Group and was renamed to DeLaval, after the company's founder Gustaf de Laval.63
60 Tetra Laval internal material 61 Ibid 62 Ibid 63 Ibid

24
In 2001, Tetra Laval wanted to expand the group by acquiring the French company Sidel, a market leader in solutions for liquid food packaging. The European Commission first prohibited the merger, since it was considered to form an anticompetitive conglomerate but after an appeal made by Tetra Laval, the Court of First Instance annulled the Commission’s prohibition in October 2002, and in 2003 the merger became a reality. Although for the merge to be complete the commission made some regulations which said that64 ”the undertakings or assets brought together to be separated (…) or any other
action that may be appropriate in order to restore conditions of effective competition"65
3.1.2 Way of Business
The head of each industry group has operational management responsibility for their respective industry group and therefore reports directly to the Tetra Laval Group Board. The Group Board is responsible for the overall strategy of the Group and for controlling and supervising all of its business operations. Tetra Laval International is the financial support and control function for the board. This organisation has responsibility for financing the Tetra Laval Group and managing its overall legal structure, tax planning and equity structures. Tetra Laval International proposes and ensures compliance with Group reporting processes, executes acquisitions and disposals and plays a lead role in Corporate Governance.66 Today Tetra Laval Group is a global, decentralized organisation, which employs over 30 000 people and it is one of the world’s leading food processing and packaging companies. They cover the markets in over 165 countries and had net sales of 10 720 million EURO during 2007. Tetra Pak is by far the largest company in the group both in regards to employees and net sales which can be seen in figure 3.67
Number of Empoyees, December 2007Total Tetra Laval Group 31,069
Tetra Pak 20,859
De Laval 4,407
Sidel 5,496
Other 307
Net sales 2007 in MIO EUROTotal Tetra Laval Group 10,720
Tetra Pak 8,610
De Laval 850
Sidel 1,255Other 5
Figure 3 – Tetra Laval Group’s number of employees and net sales68
3.2 Tetra Pak
Tetra Pak was established in Lund, Sweden, 1951 by Ruben Rausing and Erik Wallenberg, starting as a subsidiary of Åkerlund & Rausing. Tetra Pak’s first product was the concept of a package. The Tetra Classic, Tetra Pak's first commercial product, was launched in 1952. Until then, milk had been sold by volume over the counter in glass
64 Tetra Laval internal material 65 http://europa.eu/, 2002-01-30 66 Tetra Laval internal material 67 Ibid 68 Ibid

25
bottles. The company showed a steady growth and in 1960 the first production plant for packaging material outside Sweden was started in Mexico. In 1965 Åkerlund & Rausing was sold whilst Ruben Rausing retained its subsidiary, AB Tetra Pak.69 During the years Tetra Pak has had different focuses on development. In the 60’s it was rationalization of production that were in focus. In the 70’s, rationalization of distribution, 80’s the consumer, 90’s environment and this century it has been integrated solutions that have been in focus.70 Today they are a world leading company in food processing and packaging. The company has expanded its business to include much more than the packaging of liquid food products. Ice cream, cheese, dry foods, fruits, vegetables and pet food are examples of what can be processed or packaged in Tetra Pak processing and packaging lines. By developing ambient packaging, which preserves the nutritional value and the taste of products, the distribution of these food products to the consumer has been greatly facilitated.71 To be able to better correspond to the customer need Tetra Pak is divided into different clusters with regional headquarters. By doing this they hope to decentralise or to help the process of decentralisation and push some of the decision-making and operational decisions out closer to the market. The different clusters are represented by different colours in figure 4.72
Figure 4 – Tetra Pak’s clusters73
3.3 DeLaval
The story of DeLaval begins in 1878 when Gustaf de Laval (1845 – 1913) patents the cream separator that revolutionises dairy production. Five years later in 1883 he founded AB Separator. In 1963 the company changed name from AB Separator to Alfa Laval AB. Then when Alfa Laval AB was acquired by Tetra Pak in 1991 the dairy and farming
69 Tetra Laval internal material 70 Ibid 71 www.tetralaval.com, 2008-09-07 72 Tetra Laval internal material 73 Ibid

26
machine part of the company was split into a separate company called Alfa Laval Agri which in 2000 became DeLaval.74 Today DeLaval is a full-service supplier to dairy farmers. The company develops, manufactures and markets equipment and complete systems for milk production and animal husbandry.75 The company supplies highly efficient system solutions for milking, herd management, animal traffic control, feeding, cooling, manure handling, ventilation and energy recovery. Additionally, DeLaval provides milking equipment installations, preventive maintenance programmes, emergency service and mobile shops to approximately one million customers across the globe in over 100 markets.76
3.4 Sidel
The Sidel Group is one of the world leaders in solutions for liquid food packaging. From its two fields of strength, blow moulding and filling, Sidel offers the equipment that is key to customers’ decision-making in the purchase of complete bottling lines. Sidel is expanding its activities to cover three main package categories; glass bottles including disposable and returnable bottles, plastic bottles (PET, HDPE and PP) and metal cans.77 It was Sidel that invented the plastic bottle in France in the early 1960’s and in the 80’s the company growth took of thanks to the global success of the PET bottles.78 In 2005 Sidel and Simonazzi merged to form a new Sidel Group within Tetra Laval. The Group today consists of five brands that each have different foundations for the group development: Sidel (blowing, barrier treatment), Combi (aseptic and food filling) Simonazzi (filling, rinsing, pasteurisation, washing, palletising/depalletising, robots), Gebo (conveying), Alfa (labelling), Cermex (end of line).79 Sidel provides service and expertise in order to adapt the products to the particular technical demands of each customer. By offering a tailored solution to the customer, Sidel create a stronger relationship with its customers.80
3.5 Tetra Laval Group Transport & Travel
Tetra Pak is divided into four different business units as shown in figure 5. GT&T are located within Supply Chain Operations according to figure 6. The Tetra Laval Group has since two year back managed its global purchasing in seven different individual segments; Base Material, Equipment and Parts, Processing, Additional Material, Transport and Travel, Indirect Material and Services and Factory Capital Equipment and Investment.
74 www.delaval.com, 2008-09-08 75 Tetra Laval internal material 76 Ibid 77 Ibid 78 www.sidel.com, 2008-09-11 79 Tetra Laval internal material 80 Sidel internal material

27
This all together creates the overall function Supply Management. GT&T has even though they are located under Tetra Pak Packaging Solutions AB, the management mandate to handle the whole groups purchasing concerning Transport and Travel issues.81
Figure 5 – Tetra Pak’s organisation structure82
Figure 6 – Supply Chain Operation’s organisation structure83
81 Tetra Laval internal material 82 Ibid 83 Ibid

28
Even though the Supply Management function in its current form only has existed for about two years, GT&T as a unique function has existed for approximately 25 years. Their existence is mainly because of the possibilities of volume accumulation and economies of scale, for example to gain better terms and prices on the transportations. Today GT&T handles approximately 75 % of all procurement within their area of expertise.84 The department currently has 14 employees all located in Lund and they are divided into different teams according to different types of transportation. The teams are Air & Express, Road & Rail, Sea, Export & Customs and Travel Management.85
3.6 Shippers and partners
In this section the logistic partner Geodis Wilson and the carriers that has been interviewed and thereby contributed to the empirical data will be presented, in order of their market shares.
3.6.1 Geodis Wilson
Geodis Wilson is part of the Geodis Group which employs 26 000 people and has a network spanning 120 countries. This makes the Geodis Group ranked among Europe's top five transport and logistics companies.86 Geodis Wilson is the result of the merger between Geodis Overseas, the air and sea freight arm of the Geodis Group, and TNT Freight Management, formerly known as Wilson Logistics, a 164-year-old company with Scandinavian roots. With 5 500 people and a global network, Geodis Wilson is one of the world’s largest freight management companies. They serve their customers with integrated supply chain solutions that deliver cargo by sea and air.87 The partnership with Tetra Laval is one of the most dedicated that Geodis Wilson administrates and over 70 employees work solely with the Tetra Laval account.88
Geodis Wilson has an in-depth knowledge of several markets including high-tech, pharmaceuticals, textiles and automotive products. They also specialise in marine logistics, industrial projects and other niche markets. The backbone of the company is a self-reliant network of offices as well as air and ocean hubs in over 50 countries. They have a strong presence in Europe, the Americas and the Asia Pacific region.89
3.6.2 Maersk
Maersk Line is the world market leading liner shipping company with a fleet of more than 470 container vessels and a capacity of 2 040 788 TEU equivalent to 15,8 % of the 84 Ingvarsson, Robert, GT&T 85 Ibid 86 www.geodiswilson.com, 2008-10-06 87 Ibid 88 Geodis Wilson 89 www.geodiswilson.com, 2008-10-06

29
world market share. This ensures reliable and comprehensive worldwide coverage. It is the largest operating group within A.P. Moller - Maersk Group both by revenue and staff.90 91 The overall operation is divided into regional offices. The office in Gothenburg is regional offices for Scandinavia, parts of Russia, the Baltic States and England / Ireland. Maersk is the largest provider of shipping to Tetra Laval although their relative share has declined. They are the only shipping line that has ocean traffic directly from Sweden (Gothenburg port) with departures once a week to the Far East and once a week to the Middle East.92
3.6.3 MSC
Mediterranean Shipping Company (MSC) is a privately owned shipping line founded in 1970. They have grown rapidly and are today the world’s 2nd largest carrier operating 405 container vessels with a capacity of 1 425 396 TEU, representing 11,0 % of the world market share. 93 The expansion has been achieved through internal growth rather than through acquisitions or mergers.94 95 MSC Sweden was established in December 1999, to strengthen MSC’s presence in the Scandinavian market.96 The major trade lane for MSC is between Europe and Asia just as for many other carriers. It is also here that they operate their biggest vessels of 12 000-14 000 TEU.97
3.6.4 COSCO
China Ocean Shipping (Group) Company (COSCO) is a Chinese state-owned shipping company founded in 1961. In 1998 they established by a merger of the COSCO container lining headquarter and COSCO Shanghai a key company specializing in container transport called COSCO Container Lines Co., Ltd, (COSCON).98 COSCON has approximately 150 vessels with the total capacity of 497 546 TEU equivalent to 3,8 % of the world market share and this ranks them the 5th largest carrier in the world. 99 They have Europe to the Far East and India as the largest trade lanes but are also prominent on trades to Australia and New Zealand. For Tetra Laval are the main trade
90 www.maerskline.com, 2008-10-06 91 AXS-Alphaliner - TOP 100, Operated fleets as per 10 November 2008 92 Jedvert, Björn, Maersk Line 93 AXS-Alphaliner - TOP 100, Operated fleets as per 10 November 2008 94 Magaji, Fredrik, MSC Sweden 95 www.mscsweden.com, 2008-10-30 96 Ibid 97 Magaji, Fredrik MSC Sweden 98 COSCO Container Lines Company Limited (2008): Sustainability report 2007 99 AXS-Alphaliner - TOP 100, Operated fleets as per 10 November 2008

30
lanes Sweden to the Far East and North America and Australia to the Far East. Penta Shipping AB is the Swedish agent for COSCO and owned by them to 75 %.100
3.6.5 “K” Line
”K” Line was established in 1919 and originates from Japan, the K stands for Kawasaki. 101 They are the 13th largest carrier in the world with a capacity of 317 547 TEU which is equivalent to 2,5 % of the world market share.102 Container vessels are only a small fraction of the total fleet, around 100 of the total 488 ships. The major fleet types are bulk and car carriers.103 "K" Line covers worldwide trade lanes and occupies a significant position in the Transpacific and North American cargo trade.104 For Tetra Laval the largest trade lanes are between South America and the Far East followed by Europe to the Far East. 105 "K" Line (Sweden) AB are agents for "K" Line. Their work consists mainly of container ships handling but also some car carrier handling. 106
3.6.6 Hyundai
Hyundai is a major conglomerate from South Korea. Their shipping section is called Hyundai Merchant Marine (HMM) and specializes in routes between Europe and the Far East. The company was established in 1976 and was originally called Asia Merchant Marine but changed name to HMM in 1982. 107 Their capacity is 250 178 TEU which is 1,9 % of the world market share and this ranks them as the 18th biggest carrier in the world.108 They operate a relatively new fleet with in principle all ships launched in the 2000’s. In Sweden they operate under the title Hyundai Merchant Marine (Scandinavia) AB.109
3.6.7 UASC
UASC (United Arab Shipping Company) was established in July 1976, jointly by the six shareholding states from the Arabian Gulf (Bahrain, Iraq, Kuwait, Qatar, Saudi Arabia and United Arab Emirates). The head office is located in the State of Kuwait with a corporate office in Dubai, United Arab Emirates.
100 Josefson, Per, Penta Shipping 101 Dirzowski, Harald, ”K” Line (Sweden)
102 AXS-Alphaliner - TOP 100, Operated fleets as per 10 November 2008 103 Dirzowski, Harald , ”K” Line (Sweden)
104 www.kline.com, 2008-11-10 105 Dirzowski, Harald, ”K” Line (Sweden)
106 Ibid
107 www.hmm21.com, 2008-11-10 108 AXS-Alphaliner - TOP 100, Operated fleets as per 10 November 2008 109 Håkansson Säll, Fredrik, Hyundai Merchant Marine (Scandinavia)

31
UASC have a capacity of 150 588 TEU which represents 1,2 % of the world market share and ranks them the 20th largest carrier in the world.110 They specialize on trade lanes to and from the Middle East and have earned a market leadership on these trades by being one of the most prominent carriers both in terms of liner cargo as well as port coverage.111 For Tetra Laval the main trades are between the Nordic countries, Italy and Spain to Saudi Arabia and other countries by the Red Sea. United Arab Agencies AB is the Swedish agent for UASC.112
110 AXS-Alphaliner - TOP 100, Operated fleets as per 10 November 2008 111 www.uasc.net, 2008-11-10 112 Andersson, Magnus, United Arab Agencies

32
3.7 Summary
The Tetra Laval Group was founded in 1991 when Tetra Pak acquired Alfa Laval. At this point Alfa Laval Agri, a leading producer of dairy and farming machinery was split from Alfa Laval. So when Alfa Laval was sold in 2000 Alfa Laval Agri was still part of the group and changed its name to DeLaval. Then in 2001 the French company Sidel, a market leader in solutions for liquid food packaging was acquired. The group is a private industrial group that today consists of these three independent industry companies whose company activities are focused on systems for processing, packaging and distribution of food and accessories for dairy production and animal husbandry. Today Tetra Laval Group is a global, decentralized organisation, which employs over 30 000 people and cover the markets in over 165 countries and net sales of 10 720 million EURO during 2007. DeLaval is a full-service supplier to dairy farmers. The company develops, manufactures and markets equipment and complete systems for milk production and animal husbandry. The Sidel Group is one of the world leaders in solutions for liquid food packaging and its activities cover three main package categories; glass bottles including disposable and returnable bottles, plastic bottles (PET, HDPE and PP) and metal cans. Tetra Pak was established in Lund, Sweden, 1951 by Ruben Rausing and Erik Wallenberg and is by far the largest company in the group both in regards to employees and net sales They are a world leading company in food processing and packaging, not only for liquid food products but also for ice cream, cheese, dry foods, fruits, vegetables and pet food. Tetra Pak is divided into four different business units, one being Supply Chain Operations under which GT&T, one of the seven individual global purchasing segments for Tetra Laval is located. GT&T has even though they are located under Tetra Pak the management mandate to handle the whole groups purchasing concerning transport and travel issues. Today GT&T handles approximately 75 % of all procurement within their area of expertise. The department currently has 14 employees all located in Lund and they are divided into different teams according to different types of transportation. The teams are Air & Express, Road & Rail, Sea, Export & Customs and Travel Management. Geodis Wilson is the logistics partner for Tetra Laval and is part of the Geodis Group which employs 26 000 people and has a network spanning 120 countries. The partnership with Tetra Laval is one of the most dedicated that Geodis Wilson administrates and over 70 employees work solely with the Tetra Laval account. Six carriers were interviewed during the work with this study; Maersk, MSC, COSCO,”K” Line, Hyundai and UASC. They are all major shipping lines covering a worldwide market.

33
4 Theoretical Frame of Reference The Theoretical Frame of Reference is supposed to give the reader a good understanding
of how the sea freight industry works. The intention is that the chapter will help the
reader to most of all understand the container shipping industry. At the end of the
chapter there is a section of how industrial purchasing is managed.
4.1 Sea Freight
Sea freight has a high cost efficiency because the large capacity and the freedom to choose route. The transported goods have to carry a small amount of variable costs such as cost of the bunker fuel per container and terminal cost relative to the large fixed costs of the ship investment and the bunker fuel consumption independent of the goods weight. On expensive capital goods the transportation cost often becomes as low as less than 6 % of the product cost and on low worthy goods the transportation cost becomes about 30 %. Today the total sea freight volume is about 3,600 million tons per year, and the increase in price of bunker oil during the 21 century looks like having no effect. Of the total world tonnage 31 % exists of bulk and kombi tonnage. Tank ships makes up the largest part of 44 %. 113 Approximately 90% of worldwide non-bulk cargo and non tank ships is transported by container114.
4.1.1 Structures for marine line system
The choice of structure for marine line systems is a strategic planning problem for carriers. A line arrangement of traffic requires fixed frequencies for departures and arrivals to meet the shippers’ requirements. Just like other transport relations the marine transports has to be connected to a larger supply chain. There are several factors that need to be taken into consideration before deciding on the structure of the line system. 115 When it comes to the service frequency, smaller unit capacities allow more frequent departures while larger units allow carriers to benefit from economies of scale. Secondly, the fleet size, vessel size and fleet mix. The optimal vessel size depends on the cargo available, shippers’ requirements on transit time and other service elements for the trade lane. The biggest vessels are often deployed on the longest routs and carriers also need to secure enough vessels to guarantee the desired frequency. Thirdly, the number of port calls. By limiting the number of port calls the voyage time is shortened and can therefore increase the number of roundtrips per year and minimizing the required number of vessels on a specific trade lane. However fewer port calls mean less access to more cargo. The different structures carriers have to decide between are the following:116
113 Lumsden (2006): Logistikens grunder (2nd ed.) 114 Levinson (2006): The Box, How the Shipping Container Made the World Smaller and the World
Economy Bigger 115 Lumsden (2006): Logistikens grunder (2nd ed.) 116 Notteboom & Vernimmen (2008): The effect of high fuel costs on liner service configuration in
container shipping
34
4.1.1.1 One link117
The simplest approach is one link i.e. a direct connection between two specific ports. This relation results in the ship always being fully unloaded in the port. This simplifies the loading and unloading process since all forms of sequencing and follow up of the cargo are eliminated.
4.1.1.2 Several links118
To be able to decrease the cost per cargo unit it is important to have high goods volumes and utilization. One way to do this is to extend the arrangement with one or more links to include several links. This will of course increase the cycle time and resulting in that the frequency will drop if not more ships are added to the trade lane.
4.1.1.3 Several links with a central link119
In an arrangement with several links there is often a link somewhere in the middle that can be seen as a central link. The reason for this might be that it is a link between two subsystems e.g. the link between two continents like Europe and North America. The consequence of this system is that it is extremely important for the ship to have a high utilization at the central link. From which port the goods come from is of less importance since the cost of the shorter links are negligible in comparison to the central link. In the same way it is less important in which port the goods are unloaded. The system also results in lower overall costs when the benefit of economy of scale becomes possible. The risk is that total shipment time increases slightly, but if the system change means better utilization after centralization the shipment time should not increase.
4.1.1.4 Loop systems – one-way or two-way120
Loop systems are an efficient way to connect different ports. It is fairly simple to expand the loop to include additional ports. A one-way loop might however generate a lot of extra transport work since the goods will not get transported the closest way. One way to get rid of this problem is by having a two-way loop with vessels going in both directions. The biggest problem with a loop system is that the ship rarely is fully unloaded and the demands on sequencing and cargo monitoring are extensive.
4.1.1.5 Feeder121
Traffic between continents is dependent on large capacities and ships used on these trade lanes are therefore very large. Not all ports are able to receive such large ships and it is therefore necessary to transport goods from these smaller ports to the one from which the large ships can deploy. This is done by a feeder system connected with the central link system. New ports can easily be included in the system by simply adding additional feeder lanes. The main disadvantage of this arrangement is that the goods have to be reloaded from the smaller to the larger ship in the large port.
117 Lumsden (2006): Logistikens grunder (2nd ed.) 118 Ibid 119 Ibid 120 Ibid 121 Ibid

35
4.1.2 Sea Terminals – Ports122
In an ideal transport network the goods flow is directly from the supplier to the costumer in a “door-to-door” transportation. This is however rarely used due to problems with utilization and in the case of sea freight the need for transhipments. Because of this terminals are used and in shipping this refers to ports. The containerisation of goods has to high extent change the layout of ports. In for example the port of Gothenburg 85 % of the bulk cargo is transported by container. This results in an efficient handling of the goods and protects it from damage and theft, thereby minimizing the need for warehouses and storage space. Only a few of the world ports are large enough to handle reloading of containers from one ship to another, so called feeder traffic. Most ports are only a connection between the sea carrier and the land based carrier. The greatest difference between sea- and land based transportation is the capacity. This is solved either by a high accumulation of trucks and railway cars on the ships arrival or by storing the cargo in the port. The later of the two is by far the most common. The time spent in port for loading and unloading is continuously reduced for different reasons. The main one being that by reducing time in port the total turnaround time can be reduced and the departure frequency increase. To be able to perform a fast loading and unloading of the ship it is demanded large spaces near the embankment to put the goods in waiting for further transport. Handling to and from the ship is done with cranes. Transportation within the port is done with a system of specialized container handling equipment. Handling to and from trucks is done with counterbalance trucks and equivalent handling to railway cars is done with a large crane. The problem with storing containers in the port is that it requires a lot of space. Onboard the ships it is possible to store them in deep shafts with up to 11 levels on top of each other. In ports only four levels are allowed due to safety and stability reasons and most often only two is used for enabling an efficient usage of the handling equipment. The consequence of this being that when the vessel sizes increase so does the need for additional storage areas. There are different types of embankment types depending on the type of ships and goods that they are supposed to handle. A few decades ago it was common that ships were directly unloaded onto other means of transportation. This resulted in long waiting time in port and a high need for embankment length and a port design with piers going out into the ocean. For ports handling with a Ro-Ro ship it is usual to have a link span which enable unloading in the ships lengthwise direction. To enhance ports handling a lot of containerships are designed with a straight embankment.
4.1.3 Imbalances and Utilization123
Normally vessels have a large carrying capacity to move goods from one port to another. This also means that if goods for some reason do not exist in a specific port it will create
122 Lumsden (2006): Logistikens grunder (2nd ed.) 123 Ibid

36
imbalances resulting in a low utilization rate. This is not desirable because it means fewer units to allocate costs on. The main flow of goods in a transportation loop where there is a high utilization rate is called headhaul. In contrast the routes which have low utilization rate are called backhaul. Imbalances in sea freight can be divided into four categories; structural, construction dependent, operational and commercial. Structural imbalance is connected to the goods and its existing flow in- and out of a specific area, e.g. a harbour. This is based solely on the underlying industrial system and cannot be affected by the sea freight system. These imbalances can only be solves by adding volumes to the backhaul route or adjusting other types of good to fit the vessel type in question. An example of this is transportation of oil in tank containers which then can be loaded on to container vessels. To gain high effectively in transportation, loading or unloading some vessels are constructed to only carry a specific type of goods e.g. flammable liquid cargo. This results in construction dependent imbalances. Since this often means that there only is a goods flow in one direction it is important to look at the economical aspects to make sure that it motivates this type of imbalance. A seaborne transport system is typically built up based on the availability of vessels that the operator has. This creates operational imbalances and is based on the vessels construction and its varying utilization along the year. This means that imbalances can be created by how vessels are used and contingent repositioned. Commercial imbalances are related to the fact that the international shipping industry is a well functioning market. This means that the use of a vessel is completely controlled by where the operator can get the highest income. This is especially common in trades that are contracted for one trip at a time. It can also be that the freight rates from a harbour are considered too low and the vessel therefore departs from another nearby harbour where the rates are higher even if there might not be a high amount of goods going into that harbour. This imbalance is created by the operator and the market together and they are therefore the only ones who can adjust it.
4.1.4 Different types of ship124
For a ship to work effectively in a supply chain it has to be adjusted to suite the unit that it is supposed to carry. Merchant ships may be divided into several categories, according to their purpose and/or size. Bulk carriers are ships designed to transport solid and dry cargo i.e. mass bulk like cement, grain, coal and ore. The ships differs in size from about 1 000 to 300 000 tons cargo carrying capacity although the normal size is around 80 000 tons. Containerships are normally Lo-Lo ships (Lift on Lift off). Some are equipped with their own cranes or other mechanisms to load and unload. Due to the technical complexity and
124 Lumsden (2006): Logistikens grunder (2nd ed.)
37
low utilization of these cranes most new ships do not have these types of cranes. This limits the containership’s possible destination ports while demand for port facilities will increase to always have some form of the capacity for lifting the containers. The containers are placed resting on each other in a cell system. Refrigerated cargo is transported either on pure reefer ships or to a large extent in containers with normal container ships. Containers are then equipped with self-refrigerating or linked to the central one, these are called reefer container. Approximately 90% of non-bulk cargo worldwide is transported by container125. The world’s largest containership to date is the M/V Emma Maersk with a volume capacity of about 15 000 TEU126. Tankers are constructed to transport liquids in bulk. A lot of different products can be transported but the crude oil and refined petroleum products stand for the largest quantities. Ro-Ro ships (Roll on Roll off) are ships where the technique of horizontal transfer of goods is the most effective way to move goods between different carriers. These vessels usually carry goods with rolling unit carrier e.g. cars, trucks and train cars. This type of loading the ship often results in low utilization of space since there often are room between the deck and the loaded goods. Due to this fact Ro-Ro ships are not as interesting to use on longer trips where capacity utilization is important. For this reason some Ro-Ro ships are design to only carry one specific type of goods. For example car carriers are a special type of Ro-Ro ships. A passenger ship is a ship whose primary function is to carry passengers. There are different types, one being the ferries that more or less works as floating bridges that can carry both passengers and their vehicle. Cruise ship is a passenger ship used for pleasure voyages, where the voyage itself and the ship's facilities are considered an essential part of the experience. There is always an overlap in function of a freight ship. This is because the shipping companies’ wants to be able to use a unique ship for more than one type of goods and over a longer time have the possibility to shift the main type of goods carried. For instance a bulk ship can take containers on deck often without any transformation of the ship, and with only a fast transformation be able to take containers in some areas of the tanks below deck.
4.1.5 Unit load, Containers
A freight container is a unit carrier of goods for different types of transportation, often rectangular size and manufactured in stainless steel plate or aluminium plate with a strengthening frame around the corners. 127
125 Levinson (2006): The Box, How the Shipping Container Made the World Smaller and the World Economy Bigger 126 AXS-Alphaliner - The worldwide reference in liner shipping TOP 100 : How it works 127 Lumsden (2006): Logistikens grunder (2nd ed.)
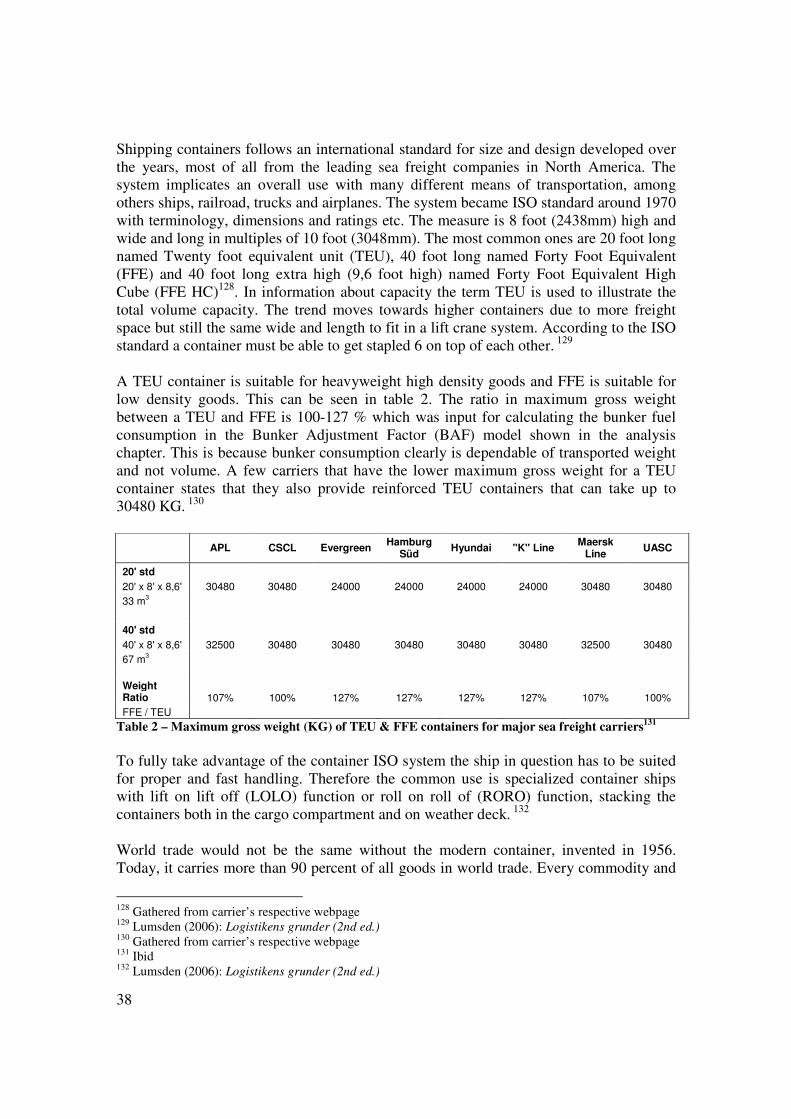
38
Shipping containers follows an international standard for size and design developed over the years, most of all from the leading sea freight companies in North America. The system implicates an overall use with many different means of transportation, among others ships, railroad, trucks and airplanes. The system became ISO standard around 1970 with terminology, dimensions and ratings etc. The measure is 8 foot (2438mm) high and wide and long in multiples of 10 foot (3048mm). The most common ones are 20 foot long named Twenty foot equivalent unit (TEU), 40 foot long named Forty Foot Equivalent (FFE) and 40 foot long extra high (9,6 foot high) named Forty Foot Equivalent High Cube (FFE HC)128. In information about capacity the term TEU is used to illustrate the total volume capacity. The trend moves towards higher containers due to more freight space but still the same wide and length to fit in a lift crane system. According to the ISO standard a container must be able to get stapled 6 on top of each other. 129 A TEU container is suitable for heavyweight high density goods and FFE is suitable for low density goods. This can be seen in table 2. The ratio in maximum gross weight between a TEU and FFE is 100-127 % which was input for calculating the bunker fuel consumption in the Bunker Adjustment Factor (BAF) model shown in the analysis chapter. This is because bunker consumption clearly is dependable of transported weight and not volume. A few carriers that have the lower maximum gross weight for a TEU container states that they also provide reinforced TEU containers that can take up to 30480 KG. 130
APL CSCL Evergreen
Hamburg Süd
Hyundai "K" Line Maersk
Line UASC
20' std
20' x 8' x 8,6' 30480 30480 24000 24000 24000 24000 30480 30480
33 m3
40' std
40' x 8' x 8,6' 32500 30480 30480 30480 30480 30480 32500 30480
67 m3
Weight Ratio 107% 100% 127% 127% 127% 127% 107% 100%
FFE / TEU
Table 2 – Maximum gross weight (KG) of TEU & FFE containers for major sea freight carriers131
To fully take advantage of the container ISO system the ship in question has to be suited for proper and fast handling. Therefore the common use is specialized container ships with lift on lift off (LOLO) function or roll on roll of (RORO) function, stacking the containers both in the cargo compartment and on weather deck. 132 World trade would not be the same without the modern container, invented in 1956. Today, it carries more than 90 percent of all goods in world trade. Every commodity and
128 Gathered from carrier’s respective webpage 129 Lumsden (2006): Logistikens grunder (2nd ed.) 130 Gathered from carrier’s respective webpage 131 Ibid 132 Lumsden (2006): Logistikens grunder (2nd ed.)

39
type of goods can be loaded and carried in ‘the box’, as the container is often referred to. As a result, modern container shipping has changed the way we transport goods around the world and has played a key role in globalisation.133
4.2 Purchasing Organisation134
Purchasing organisations are placed in various locations on the organisation chart depending on how significant purchasing is. If purchasing is seen as operational work, the purchasing organisation is placed far down in the organisational chart. The opposite is when the purchasing is seen as a strategic function or core competence in which case it will be very high placed on the organisational chart. The management's approach to purchasing is primarily based on the purchasing contribution to the final product, the company’s financial situation and how dependent the company is of their suppliers. Purchase can be divided into three levels, strategic, tactical and operational. At the strategic level decisions on purchasing issues affecting the company's market position in the long term are considered. It can be about redirecting the right decisions, establish policies or risk diversification. At the tactical level, decisions relating to the company's products, manufacturing processes and supplier selection are discussed e.g. value analysis, introducing certifications and contracting. The operational level is the lowest level and includes tasks involving the daily work such as problem solving, despatching of orders and evaluation of suppliers. There are three main types of purchasing organisations, centralised, decentralised and a mixture of the two. Decentralised purchasing is used when a company has several business units and each unit has responsibility for its financial performance. The advantage of this organisation is that each business unit purchaser can find the best supplier to fit their goals while a disadvantage is that several units in the same company might negotiate with the same supplier without reaching any scale advantages. This organisation is suitable for companies with diversified manufacturing. At a centralised purchasing organisation, it is common for the strategic and tactical purchasing to be performed by the central organisation. The advantage of this organisation is the economy of scale in purchasing and standardisation of purchased materials, while the disadvantages are less flexibility for business units. A common problem with this type of organisation is that staff on the business units feels that they can get better deals than what is done centrally and not seeing the overall benefits. This organisation is appropriate when the company has several similar business units. 133 www.maerskline.com, 2008-10-06 134 Van Weele (2005): Purchasing & supply chain management: analysis, strategy, planning and practice
(4th ed.)

40
A mixture of the above organisation types combines the strengths of both types. Strategically important products are often purchased in the central organisation while the tactical and operational purchasing is done at respective business units.

41
4.3 Summary
Sea freight is the backbone in the world trade and today the total sea freight volume is about 3,600 million tons per year. Approximately 90% of worldwide non-bulk cargo and non tank ships is transported by container. The Sea freight industry is today focusing on economies of scale and the average vessel size is continuously increasing. The different structures for marine lines systems are; one link, several links, several links with a central link or loop system. A common structure for container shipping is several links with a central link with the largest vessels on the central link and smaller feeder vessel on the connecting links. Transhipment of the goods is common today and of this reason together with the trend of increasing vessel size the terminal handling is a crucial part. Today terminals have to be able to store large amounts of goods that are to be transhipped or relocated form or to land transportation. The main flow of goods in a transportation loop where there is a high utilization rate is called headhaul. In contrast the routes which have low utilization rate are called backhaul. This type of problem is called imbalance and can be divided into four categories; structural, construction dependent, operational and commercial. For a ship to work effectively in a supply chain it has to be adjusted to suite the unit that it is supposed to carry. Merchant ships may be divided into several categories, according to their purpose and/or size; bulk carrier, container ship, tanker, Ro-Ro ship and passenger ship. The system with containers is today ISO standard and the common ones are called Twenty Foot Equivalent unit (TEU) and Forty Foot Equivalent unit (FFE). In information about capacity the term TEU is used to illustrate the total volume capacity. Purchase can be divided into three levels, strategic, tactical and operational and there are three main types of purchasing organisations, centralised, decentralised and a mixture of the two.

42
5 Empirical study The empirical study gives the reader thorough background information to understand the unique context and all the necessary information and facts needed for the analysis. The
overall structure of the empirical study and analysis is the same, but with some
subheadings that differ. First there is some background information about the shipping
industry, shipping conferences and the market outlook so the reader will understand the
following context. Then there is a description of the sea freight goods flow for Tetra
Laval and for the world trade in general along with some specific information about
Tetra Laval’s work processes and the cost structure and pricing in the industry. This is
followed by a detailed look at Bunker Adjustment Factor (BAF), Currency Adjustment
Factor (CAF) and Terminal Handling Cost (THC).
5.1 The shipping industry
5.1.1 Industry growth
The industry has grown significantly for quite some time and in 2006 the global port throughput was about 440,4 million TEU and for 2007 this figure is estimated to grow by 11,7 %. Those 440,4 million TEU’s that is handled in ports equates to a global container traffic volume of 128,3 million TEU after elimination transhipments and empty container volumes. 135 The evolution of the cellular fleet has for a long period of time shown large figures in growth, as seen in table 3. This is partly because shipments with containers have grown in popularity relative to for example bulk vessels.136
135 Drewry Shipping Consults Ltd. (2007): Annual Container Market Review and Forecast - 2007/08 136 AXS-Alphaliner (2008): The containership market 2007
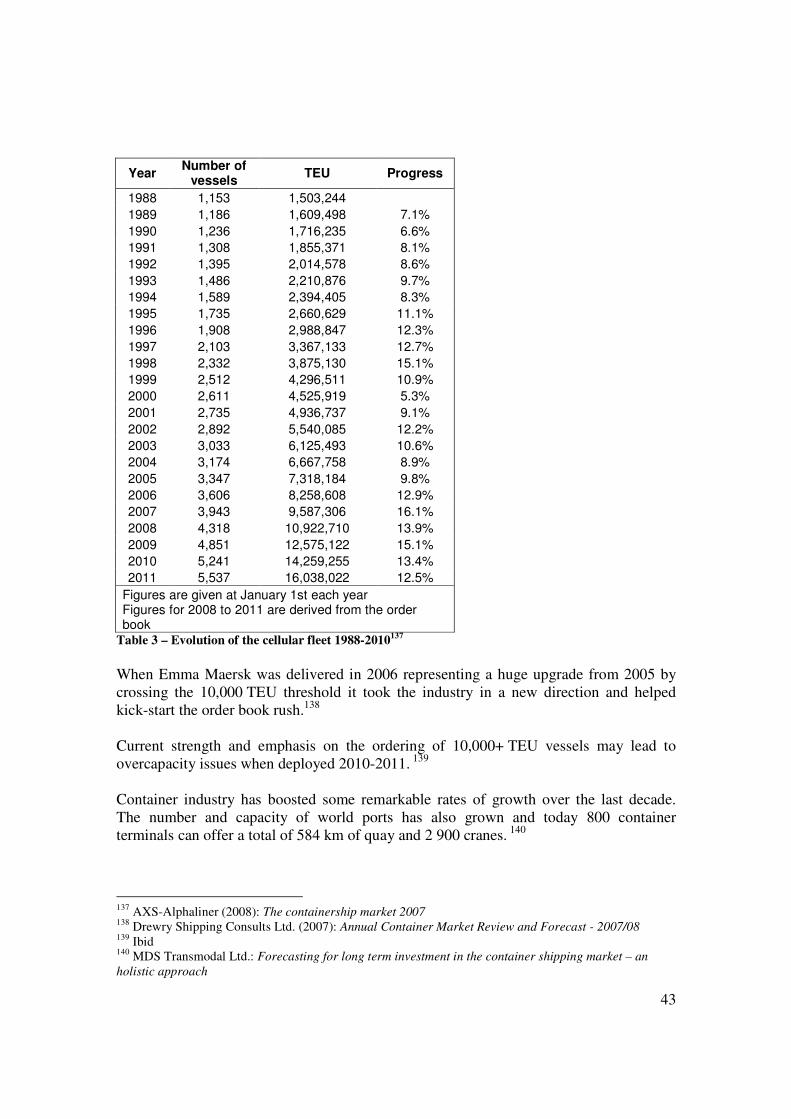
43
Year Number of
vessels TEU Progress
1988 1,153 1,503,244
1989 1,186 1,609,498 7.1%
1990 1,236 1,716,235 6.6%
1991 1,308 1,855,371 8.1%
1992 1,395 2,014,578 8.6%
1993 1,486 2,210,876 9.7%
1994 1,589 2,394,405 8.3%
1995 1,735 2,660,629 11.1%
1996 1,908 2,988,847 12.3%
1997 2,103 3,367,133 12.7%
1998 2,332 3,875,130 15.1%
1999 2,512 4,296,511 10.9%
2000 2,611 4,525,919 5.3%
2001 2,735 4,936,737 9.1%
2002 2,892 5,540,085 12.2%
2003 3,033 6,125,493 10.6%
2004 3,174 6,667,758 8.9%
2005 3,347 7,318,184 9.8%
2006 3,606 8,258,608 12.9%
2007 3,943 9,587,306 16.1%
2008 4,318 10,922,710 13.9%
2009 4,851 12,575,122 15.1%
2010 5,241 14,259,255 13.4%
2011 5,537 16,038,022 12.5%
Figures are given at January 1st each year Figures for 2008 to 2011 are derived from the order book
Table 3 – Evolution of the cellular fleet 1988-2010137
When Emma Maersk was delivered in 2006 representing a huge upgrade from 2005 by crossing the 10,000 TEU threshold it took the industry in a new direction and helped kick-start the order book rush.138 Current strength and emphasis on the ordering of 10,000+ TEU vessels may lead to overcapacity issues when deployed 2010-2011. 139 Container industry has boosted some remarkable rates of growth over the last decade. The number and capacity of world ports has also grown and today 800 container terminals can offer a total of 584 km of quay and 2 900 cranes. 140
137 AXS-Alphaliner (2008): The containership market 2007 138 Drewry Shipping Consults Ltd. (2007): Annual Container Market Review and Forecast - 2007/08 139 Ibid 140 MDS Transmodal Ltd.: Forecasting for long term investment in the container shipping market – an
holistic approach

44
The number of chartered vessels in the world fleet has risen from 14 % in 1992 to 52 % in 2006. This provides flexibility for leading carriers to grow share and means to concentrate funding on the largest of new ships, takeovers and terminals.141
5.1.2 Carriers’ market shares
The shipping industry consists of many medium sized companies. The market leader is Maersk Line which has approximately 16 % of market share. This is a relatively small share for the market leader compared to many other industries142. The runner up MSC is not far behind with 11 % and a large order book that will push them even closer to number one. CMA-CGM comes in third place with a market share of 8 % and they also have a large order book. The top three players are followed by approximately 20 carriers that have a market share of 1-4 %. The exact numbers can be seen in table 4.143 This distinguishing market structure with many medium sized companies implies that the competition is sufficient and that there is room for consolidation in the industry according to many carriers. 144
Rank Operator Capacity TEU Market Share
1 APM-Maersk 2,040,825 15.8%
2 Mediterranean Shg Co 1,425,396 11.0%
3 CMA CGM Group 982,808 7.6%
4 Evergreen Line 626,234 4.8%
5 COSCO Container L. 497,546 3.8%
6 Hapag-Lloyd 495,551 3.8%
7 APL 487,519 3.8%
8 CSCL 438,572 3.4%
9 NYK 419,256 3.2%
10 Hanjin / Senator 373,365 2.9%
11 MOL 372,691 2.9%
12 OOCL 362,579 2.8%
13 K Line 317,547 2.5%
14 Hamburg Süd Group 309,993 2.4%
15 Yang Ming Line 304,567 2.4%
16 Zim 289,822 2.2%
17 CSAV Group 285,922 2.2%
18 Hyundai M.M. 250,178 1.9%
19 PIL (Pacific Int. Line) 187,171 1.4%
20 UASC 150,588 1.2%
Table 4 – Market Share of top 20 sea freight carriers145
141 MDS Transmodal Ltd.: Forecasting for long term investment in the container shipping market – an
holistic approach 142 The Carriers 143 AXS-Alphaliner - TOP 100, Operated fleets as per 10 November 2008 144 The Carriers 145 AXS-Alphaliner - TOP 100, Operated fleets as per 10 November 2008

45
5.1.3 Liner shipping conferences146
Liner shipping conferences refers to a group of shipping companies that forms an association to agree on freight rates and passenger fares at different shipping routes. There are different shipping conferences for different regions of the world. Shipping conferences, aside from setting rates, adapt a wide number of policies such as allocation of customers, loyalty contracts, open pricing contracts, etc. Historically, eastern bloc country shipping lines have not joined these conferences. In many jurisdictions, shipping conferences are exempt from the application of competition laws but this position is being increasingly changed in order to promote greater competition and choice for shippers.
5.1.4 Regulations and factors affecting the shipping industry
The European Community (EC) council constitution number 17 from 1962 statues the EC competitions laws. In the framework of common transportation policies it turned out to be necessary to exclude the transportation area from the normal competition laws, done in regulation 4056/86, and by this a special regulation that excludes transportation came to use. The exclusion among others meant that joint pricing conferences in the shipping industry became legal. Exclusion is made if the positive effects brought about the agreement outweigh its negative affects and a fair share of these benefits is passed on to the consumer. An exceptional thing with this particular exception is that it is open ended in terms of duration. 147 Council Regulation (EC) No 1419/2006 of September 25th 2006 repealing Regulation (EEC) No 4056/86 laying down detailed rules for the application of Articles 85 and 86 (now 81 and 82) of the Treaty to maritime transport, meaning that the final step in repeal was made. The repeal of the block exemption takes effect as of October 18th 2008. Thereafter, liner carriers operating services to and/or from one or more ports in the European Union must cease all liner conference activity contrary to Article 81 of the Treaty. This is the case regardless of whether other jurisdictions allow, explicitly or tacitly, rate fixing by liner conferences or discussion agreements. Moreover, conference members should ensure that any agreement taken under the conference system complies with Article 81 as of October 18th 2008.148
146 Khemani & Shapiro (2008): Glossary of Industrial Organisation Economics and Competition Law 147 Förstainstansrättens dom, 20/9 2003, I de förenade målen T-191/98, T-212/98 – T-214/98 148 Guidelines on the application of Article 81 of the EC Treaty to maritime transport Services

46
The Commission’s main findings of the potential economic impact of repealing the liner conference block exemption are:149 150
• Transport prices for liner shipping services will decline • Service reliability on deep sea and short sea trades is expected to improve • Service quality will either be unaffected or will improve • There will be either a positive impact or no impact on the competitiveness of EU
liner shipping firms • Small liner shipping carriers will not experience particular problems • No negative impact or even a positive impact on EU ports, employment, trade
and/or developing countries. In table 5 it is illustrated what type of business activities associated with liner shipping that was legal before October 18th 2008 and what will be legal after this date.
149 The European Commission’s conclusions 150 Guidelines on the application of Article 81 of the EC Treaty to maritime transport Services

47
Activity Legally before October 18th 2008
Legally after October 18th 2008
Conferences Yes No
Trade Associations Yes Yes
Conference agreed business plans Yes No
Conference agreed surcharges and ancillary charges – BAF, CAF & THC
Yes No
Individual carrier surcharges and ancillary charges – BAF, CAF & THC
Yes Yes
Individual carrier set freight rates Yes Yes
Aggregated volume data Yes but only conference
Yes – if released with 4 weeks delay and subject to safety mechanism.
Aggregated price index Yes
Yes - if released with 3 months delay and subject to safety mechanism
Individual volume/price data Yes
Yes – if released with 12 months delay and subject to safety mechanism
Supply forecast Yes Yes – if based on publicly available sources
Demand forecast Yes Yes
Reports Yes
Yes – if based on publicly available source and aggregated data respecting minimum delays as above
Trade Association meetings Yes
Yes. As a safeguard these will be in the presence of lawyers to ensure compliance with EC competition law; meeting minutes to be publicly available
Table 5 – Legal in liner shipping before and after October 18th 2008 151
151 På Hugget (2008): Förbjudet och tillåtet för linjerederier efter 18 oktober

48
5.1.5 Shipping market outlook152
To illustrate the problem emphasised by shipper’s councils around the world about liner conferences here is an example from Global Shippers' Forum (GSF) of how carriers imposed an Emergence Bunker Surcharge (EBS) on the Asian market. Something that is possible when liner conferences are allowed. A recent announcement by eight container shipping lines in the Taiwan to Hong Kong/South China trade has confirmed the worst fears of Asian Shippers' Council (ASC), that lines are taking advantage of the lack of legislative environment in Asia to impose unwarranted charges. This proves the need of conference abolition and shippers taking charge of the variation in surcharge imposing. The eight lines, which command almost the entire trade, announced unilaterally that they would levy a new EBS of HK$440/RMB 400 per TEU to be collected from consignees in Hong Kong and South China, regardless of whether freight has already been prepaid in Taiwan. Though the announcements were made separately, the EBS was the same for all eight carriers, and so too was the effective date, July 1st. This blatant action falls on the same day as the European Commission's announcement of the final guidelines for liner shipping, spelling principles of European competition law under which they must act. The barely disguised collaboration amongst the eight lines would not have been permitted in the European Union when a formal ban on shipping conferences take effect on October 18th. It happens that all the eight lines except one are members of the Intra-Asia Discussion Agreement (IADA). IADA's attempt to impose a THC in South China in June 2007 failed, after it was outlawed by the Chinese government. Like most surcharges, the EBS was imposed unilaterally without prior consultation with customers and without any consideration of the impact it would have on their operation. Without any recourse the ASC fears that the innovative list of surcharges will become lengthier when lines converged in Asia, the remaining turf where they still enjoy the power of collective price fixing. At ASC, we have always maintained that bunker surcharge like BAF is an integral part of the freight. Charging EBS from the consignees goes against normal international liner shipping practice. The China Shippers' Association has written to the China's Ministry of Transport and Communications; and Ministry of Commerce, which states its position quite clearly, “Bunker surcharge is part of the freight; it should be paid by the party who pay the freight if so collected.” The Hong Kong Shippers' Council, Shenzhen Shippers' Association and Macau Shippers' Association in their press release demanded shipping lines to withdraw their action of collecting the charge from Hong Kong and South China. The ASC denounce the eight shipping lines for introducing EBS in the China Area (China including Shenzhen, Hong Kong and Macau) region. They call on Asian
152 www.gsf.com, 2008-09-22

49
governments to stem out this anti-competitive behaviour. It is necessary for governments to take decisive action today, or they would find EBS’s in their many guises across Asia, to the detriment of international trade. Shipping lines known to be involved include: OOCL, Wan Hai Lines, Evergreen Marine, Regional Container Lines, T.S. Lines, Kanway Shipping Ltd, Cheng Lie Navigation Ltd, Yang Ming Lines. The 2008 meeting of the GSF in Montreal confirmed the strong belief that abolishing liner shipping conferences could only benefit shippers around the world. Following the repeal of the liner shipping block exemption from 18th October Asian countries in particular will benefit from the reduced influence of conferences over prices and services. The GSF encouraged trading partners in Asia, China and India to bring about competitive reforms that would foster more competition. Dick van den Broek Humphreij chairman of the European Shipper Council (ESC) said; “we are very excited by the developments in Europe because this paves the way for shippers in Europe and worldwide to freely negotiate rates, surcharges and other terms of carriage on a fairer basis with carriers. However, we know that a change of culture will not happen overnight and therefore members of the GSF, including shipper’s councils in Asia will remain watchful to ensure that carriers are not breaching EU competition rules.” The list of charges and surcharges that shippers are asked to pay on top of freight rates for sea transport has continued to lengthen. There is an extra charge for just about everything – Terminal Handling Charge (THC), Origin Receiving Charge, Bill of Lading Fee, Documentation Fee, Equipment Management Fee, Container Seal Charge, Port Security Fee, Currency Adjustment Factor, etc. There should only be all-in freight rates. GSF accept that surcharges are sometimes necessary – in times of war, when port congestion is severe or when bunker prices hit the roof. As these are exceptional circumstances, the surcharges needed to defray the increased cost therefore should be temporary in nature, introduced after consultation with shippers.
5.1.6 Shipping industry future development
The Carriers153 The most common opinion is that the abolition in Europe will lead to abolitions in the rest of the world as well. The reason for this is that the regulation authorities in Europe have been cooperating with authorities in North America and developed a joint intention that their regulation will follow in Europe’s footsteps. The same goes with Asian interests, the difference is that in this case it is much more difficult to develop a joint intention on the topic with so many different countries’ opinion and no super national regulation authority with enough influence. A strong opinion from many carriers is that the competition before the abolition was substantial and therefore the abolition will not lead to tangible change. In many cases the conference general rate indication and surcharge indication have been overlooked because the shippers have been able to push the total price lower. This has been possible
153 The Carriers

50
because most of the container volumes in sea freight are under confidential contracts with large contracted volumes of big corporations, and prices are a question of negotiation and bargaining. Therefore the conference tariff prices have been valid in only some cases. The abolitions will in the beginning lead to a substantial market uncertainty and all parties will lie in wait of their competitors’ strategy decision. The new market condition will probably lead to, in the beginning at least, need of greater effort for shippers and forwarders trying to overview market prices. It might will also lead to more quotation of all-in freight rates without add on surcharges, although carrier would probably want to keep them if possible. Asia Shippers’ Council: Maritime Regulatory Reform 154 The implementation of the repeal of Regulation 4056/86 by the EU on 18th October 2008 will herald in a new stage for shipping. We will see a shift away from rate setting conferences to a market-based mechanism, on which rates are established based on negotiations between shipping lines and shippers. We believe that what has begun in Europe will have ripple effects around the world. And in the US there is a call for review of the Ocean Shipping Reform Act. In Asia, China's antitrust law has been put into full implementation from August 1st 2008, which is going to bring about a more market-based system in shipping. Unlike Singapore and Australia, China has made no block exemption for shipping conferences. With its sizeable volume of imports and exports, China is in a strong position to bring about changes in the obsolete conference system, an anachronism in this modern age of free market principles. We take this opportunity to call on the Chinese government to revise the present Maritime Regulations which allow collective rate setting activities. Failure to do so will result in unnecessary confusion, which will invariably be exploited by shipping lines to advance their interests. ASC expressed its concern on the aftermath of the reform to make sure that it will not lead to any unhealthy business environment. Summary155
• Many shippers have large order books because they want to be able to use lower vessel speed.
• Strong focus on Europe-Asia and inter-Asia trade lines. • Big pressure on profits due to weaker economic forecast and rising bunker cost • Many ultra large 10000-13500teu ships in companies order books pipeline with
delivery 2010-2012
5.2 Sea freight goods flow
5.2.1 Tetra Laval’s goods flow
The sea freight goods flows for Tetra Laval is divided into regional clusters descending from shipping conference regions (similar but not equal to the clusters for Tetra Pak’s
154 www.gsf.com, 2008-09-22 155 Lloyd’s List (2008): Special Report – Container Shipping Companies

51
overall business) and these clusters are referred to when defining the trade lanes specifics for this report. Tetra Laval’s top 10 major trade lanes, as seen in table 6, stands for about 85 % of the total sea freight volumes. (40’ containers, FFE are calculated as equal to two 20’ containers, TEU). Notable is that seven out of the ten trade lanes has origin area Europe. The reason for this is that the majority of Paper Board, the most common commodity shipped, is purchased in the Nordic region. Notable is also that the Europe to Far East trade lane stands for almost 30 % of the total sea freight volume. This is the backhaul route for the overall world trade, meaning that Tetra Laval can benefit from lower price levels on this route than if they shipped in headhaul direction.156
Trade Lane Number of
TEU Percentage of Total volume
Europe to Far East x 29,12%
South America East to Far East x 12,27%
Europe to Red Sea x 9,70%
Europe to Mediterranean x 8,44%
North America to Far East x 7,90%
Europe to Africa x 4,98%
Europe to North America x 3,37%
Europe to India and Pakistan x 3,27%
South America East to West India x 2,47%
Europe to South America East x 1,63% Table 6 – Tetra Laval’s top 10 major trade lanes 157
Tetra Laval’s sea freight goods flow consists of a number of different commodities. The absolute majority of shipments are of Paper Board, as seen in table 7, followed by Low Density Polyethylene and Packaging Material. These three commodities stood for 86,5 % of total sea freight volume in 2008. Paper Board is the raw material used as the major component in all Tetra Pak packages. Low Density Polyethylene stands for a group of similar plastic types. Packaging Material is finished packages on large rolls ready for customer production and filling. Closures are mostly for plastic caps that are common on Tetra Pak packages today. Aluminium Foil goes into Tetra Pak packaging production and is often a thin layer between the plastic and paper layer in a package. Strips are a thin plastic that is used to the lengthways sealing of packages. Agricultural Equipment is goods flow of DeLaval and can be milk process machines or milking machines. Machinery Cargo is all the machine equipment that Tetra Pak produces for liquid food processing, filling and distribution. Plastic straws are often added onto packages that is small onetime consumer packages. K Film is plastic film used on the inside of packages. Printing plates are used in the colour printing of packing material. Cores are the metal rolls that the aluminium foil is rolled on to when transported from supplier to factory; these are sent back and reused when the aluminium foil is disposed.158
156 Tetra Laval internal material 157 Ibid, figures from 2008 158 Ibid

52
Commodity Number of
TEU Percentage of Total Volume
Paper Board x 58,59%
Low Density Polyethylene x 15,22%
Packaging Material x 12,66%
Closures x 7,24%
Aluminium Foil x 2,37%
Strips x 1,53%
Agricultural Equipment x 0,96%
Machinery Cargo x 0,72%
Plastic Straws x 0,44%
K Film x 0,10%
Printing Plates x 0,09%
Cores x 0,07%
Total x 100,00%
Table 7 – Tetra Laval’s different commodities transported with sea freight 159
Close to 100 % of Tetra Laval’s goods flow is shipped in regular dry containers, only a small portion is reefer containers. The number of containers is spread somewhat evenly between three different sizes of containers. 20’, 40’ and 40’ HC (High Cube). Tetra Laval’s goods flow is relatively steady in volume variation over the year, meaning that there are very low amount of season variation in the majority of the sea freight goods flow. However there is a constant volume increase from year to year.160 The sea freight of Tetra Laval is exclusively with container ships and the absolute majority is full container loads, meaning that shipments with little goods that are less than full container load are very uncommon and therefore negligible.161 Tetra Laval’s top 10 sea freight suppliers can be seen in figure 7, together they stand for about 85 % of the total volume value in USD. The reason for Maersk Line having such a large part of the volume value is that Tetra Laval has a lot of goods going from Scandinavia to Far East and Maersk Line is the only carrier that has direct ocean traffic from Sweden (Gothenburg) to Far East without any transhipment. Cosco Container Line and MSC are major actors on Europe (e.g. Netherlands) to Far East that also is a large trade lane for Tetra Laval. A comparison between the top 20 sea freight carriers in the world and Tetra Laval’s top 10 sea freight carriers shows that there is similarity and that Tetra Laval’s choice of sea freight carriers reflects the overall market.162
159 Tetra Laval internal material, figures from 2008 160 Ibid 161 Team Sea 162 Tetra Laval internal material

53
Tetra Laval's top 10 sea freight carriers
12,5%
11,7%
3,9%
3,7%
3,5%
3,5%
2,5%
2,3%
2,2%
39,6%
Maersk Line
Cosco Container Line
MSC
Hamburg Süd
Hyundai Merchant Marine
UASC
CMA-CGM
Hapag-Lloyd
APL
K Line
Figure 7 – Tetra Laval’s top 10 sea freight suppliers in 2008, shown as percentage of total costs
5.2.2 World trade goods flow
World Trade imbalances for 2007 can be seen in figure 8. This figure shows that there is a substantial trade imbalance in the sea freight goods flows. This means that freight prices are high on the headhaul flows and relative lower on the backhaul flow. The two absolute major flows are from Far East to Europe and North America. These imbalances cause large problems for carriers because empty containers have to be repositioned to the large export customers from where the large import customers are. This problem is also depending on the fact that all carriers has their own containers and do not share with other carriers. The cost of empty container repositioning is on some trades not included in the freight price and the customer has to pay extra for this.163
163 The Carriers

54
Figure 8 – World Trade Imbalances 2007 164
Table 8 shows the estimated world container trade by route for 2006. The major routes as seen are; Transpacific, Europe-Far East and intra Asia that all are above 10 000 000 TEU in total volume. Worth noticing is that Intra-Regional which often is relative shorter trade lanes is a major part of total volumes, therefore world container trade is substantial both on shorter and longer distances.
164 Drewry Shipping Consults Ltd. (2008): Container Market Quarterly

55
East/West Eastbound Westbound Total
Transpacific 13780 5361 19141
Transatlantic 2433 3567 6000
Europe-Far East 5058 11277 16335
Europe-Mid-East 2135 760 2895
North America-Mid-East 360 200 560
Far East-Mid-East 550 3500 4050
Europe-S Asia 700 1100 1800
North America-S Asia 310 825 1135
Far East-S Asia 1245 1680 2925
Mid-East-S Asia 100 600 700
Total East/West 55541
North/South Southbound Northbound Total
Europe-Latin America 1200 1750 2950
Europe-Arica 1700 900 2600
Europe- Australasia 450 186 636
North America-Latin America 2250 2450 4700
North America-Africa 250 189 439
North America-Australasia 275 210 485
Far East-Latin America 1150 1200 2350
Far East-Africa 1550 975 2525
Far East-Australasia 2050 1100 3150
ME/S Asia-South 480 630 1110
South-South 355 355 710
Total North/South 11710 9945 21655
Intra-Regional Total
Asia 37222
Europe 9478
North America 1595
Mid-East 393
Latin America 1084
South Asia 225
Africa 635
Australasia 492
Total Intra-Regional 51124
World Total 128320
Table 8 – Estimated world container trade by route for 2006 (‘000 TEU) 165
Route definitions: North America includes USA, Canada and Mexico. Europe includes; North/South Europe and West/East Europe. Far East includes; North, East and South East Asia. Latin America includes; South America East Cost, South America West Cost, Central America and Caribbean. Mid East includes; Arabian Gulf, Red Sea and East Mediterranean. South includes; Latin America, Africa and Australasia.
165 Drewry Shipping Consults Ltd. (2007): Annual Container Market Review and Forecast - 2007/08

56
5.2.3 Tetra Laval’s purchase process for sea freight166
Forecasting Every year the corporate management makes a one year forecast of volumes for sea freight, this forecast together with the specific forecast from every site management makes the total forecast for nominations of container shipping volumes. Request for Quotation (RFQ) The RFQ is sent out in a web based system. The carriers that meet the requirements from the Request for Information (RFI), which is sent out some time before the RFQ, gets to answer with a proposal of service and volumes that they want to meet. The web based system relies on a large excel document with all the necessary information for the both parties, called the nomination file. It contains one row for each unique relation, meaning shipments on a specific trade lane with a specific port of destination, port of origin, container type, supplier, customer and the forecasted number of containers for the year. It can be one shipment if it is a very rare relation and over hundred shipments per year if it is common. One nomination row also contains information about what commodity that are shipped, number of transhipments, transit time, departures / month and routing. The headlines in the nomination file along with two examples of nominations can be seen in figure 9. (Notice that the rows have been split to fit into the report). The carriers make their offers by filling in their offered prices in certain columns such as forwarding fee, basic ocean freight cost, THC at origin and destination, BAF and CAF which adds up to a Grand Total. Worth noticing is especially the Ocean Freight Costs; Ocean Freight, Caf/Baf in %, Caf and Baf that are referred to throughout the report. Evaluation of Offers The RFQ is followed by an evaluation of all the offers on every relation. All the carrier’s service, volumes and prices are valued and lead to a proposal for nomination on all the relations. This means that all the irrelevant offers are deleted at this stage and the carriers that are proposed are the ones that negotiations are conducted with. Freight Negotiation The negotiation takes place in November every year and is conducted in Gothenburg in cooperation with Geodis Wilson, and all the major carriers are met face to face. All the terms for the following contract year, February to February, are brought up and revised. Nomination After the negotiations the final nomination for all the shipments for the following contract year are made. For larger relations with a high number of forecasted containers several carriers can be nominated different percentages of the relation. For 2008 Tetra Laval made about 2 500 nominations divided on 2 000 different relations. Contracting The formal contracting is made after the final nomination and all the conditions are fixed for the following year. The goods flow in and out of Singapore and Thailand area is excluded from this part of the process and is managed locally with some support from one GT&T employee. This is done once a year in January.
166 Tetra Laval internal material

57
No
min
atio
n 2
008
No
min
atio
n C
om
men
t
Su
pp
lier/S
hip
per
Pla
ce O
f Receip
t
Orig
in C
ou
ntry
Co
de
Orig
in A
rea
Destin
atio
n
Destin
atio
n C
ou
ntry
Co
de
De
stin
atio
n A
rea
Co
mm
od
ity
Carrie
r
Eq
uip
men
t
No
min
ate
d S
hare
Fo
recast (F
CL
/ year)
100% GP Plast AB Gislaved SE EUR Port Qasim PK INP PC XX 20' DV 5 5
100% GP Plast AB Gislaved SE EUR Port Qasim PK INP PC XX 40' DV HC 2 2
FOB COSTS USD OCEAN FREIGHT
Curre
ncy
Fo
rward
ing
Fee
Cu
sto
ms C
leara
nce / D
ocs
Carrie
r Fee
TH
C O
rigin
Carrie
r Hau
lag
e
Merc
han
t Hau
lag
e
TO
TA
L F
OB
CO
ST
S 2
008
Cu
rren
cy fo
r all O
CF
ch
arg
es
Ocean
Fre
igh
t 2008
Caf/B
af In
%
Caf
Baf
Co
ng
estio
n S
urc
harg
e
War R
isk s
urc
harg
e
TO
TA
L O
CE
AN
FR
EIG
HT
2008
SEK 350 200 1200 2500 702 USD 1000 0,00% 200 500 0 0 1 700
SEK 350 200 900 2500 653 USD 1500 0,00% 200 1000 0 0 2 700
USD USD C
urre
ncy
TH
C D
estin
atio
n
On
carria
ge
TO
TA
L D
ES
T. C
OS
TS
2008
GR
AN
D T
OT
AL
2008
Dep
artu
res / M
on
th
Tra
nsit tim
e in
days
(po
rt to p
ort)
Dire
ct T
ran
s-s
hip
men
t?
Ro
utin
g (P
OL
- Tra
ns-
sh
ipm
en
t po
rts - P
OD
)
- 0 2 402 4 23 1 trans-shipment Gothenburg-Hamburg--Port Qasim
- 0 3 353 4 23 1 trans-shipment Gothenburg-Hamburg--Port Qasim
Figure 9 – Example of two nominated shipments167
167 Example of nomination in the excel file where all nominations have their own row i.e. not split as in this figure (N.B. fictional numbers)

58
The rest of the purchase process is more operational work and is for the major part managed by Geodis Wilson in cooperation with GT&T. This can e.g. be booking administration, quality management, statistics revision, billing and quarterly surcharge updates. The cooperation between GT&T and Geodis Wilson is handled as shown in figure 10.168
Figure 10 – Cooperation between GT&T and Geodis Wilson169
5.2.4 Outline of sea freight contracts170
Tetra Laval has overall guidelines regarding business conduct for suppliers that concerns compliance with applicable law and regulations, employment practices, fair employment terms, environmental requirements and quality issues. These guidelines are suppose to be applicable for all forms of business partnership and are only on a general level. The ocean freight agreement is on a more specific level and states that an ocean freight programme is established providing services to the client (Tetra Laval) and all its subsidiaries and/or affiliates. This means all group companies. Here follows some more specific paragraphs of interest for this report.
168 Geodis Wilson 169 Geodis Wilson internal material 170 Tetra Laval internal material
Quality management
Corrective
actions
Action
Follow up
Statistics
Performance reviews
Forecasting
RFQ Environmental
reviews
Evaluation of offers
Freight
Negotiation
Nomination
Contracting
Contract admini- stration
Booking admini- stration
Geodis Wilson
TL GT&T

59
• The supplier agrees to have enough capacity to continuously provide service to the client only exception is a force majeure event stated in agreement. This type of event will extend the parties obligations with that specific time of disturbance.
• An appendix with all the agreed prices and nominated volumes for services along
the contract is included. If any adjustments are made to the nomination appendix, a new nomination appendix shall be made evidencing such adjustments.
• Either Party may terminate the agreement at any time by giving at least three
months written notice to the other party. The agreement can be terminated if any party fail to fulfil its obligations of essential importance and/or the other party comes under economical problems.
• The Client’s deliveries will follow the principles of ‘Incoterms 2000’.171
• The majority of the nominated volumes will be booked through the Tetra Laval
Ocean Freight Forwarder who will ensure that bookings are placed according to the enclosed nomination.
• The Supplier will work actively towards minimizing the effects of its business on
the environment. The Client assesses certain environmental aspects of the Supplier and expects continuous improvements.
• Agreed service levels and on-time performance are top priority issues for the
Client. Performance levels will be monitored and presented to the Suppliers. Quality review meetings will take place on a regular basis.
• The On-Time-In-Full performance will be measured within a timeframe of
plus/minus 48 hours of the confirmed ETA.
• No rate increases are accepted during the contract period.
• Rates and fees for transportation as well as other payment terms are specified in the Tetra Laval Nominations.
• The Supplier may not modify or change the structure in the pricelist unless agreed
with Tetra Laval Group Transport & Travel.
• CAF/BAF should be revised on a quarterly basis and must be reported to the Forwarder at least 10 working days prior to implementation. No other additions will be accepted during the contract period.
171 A set of international rules for the interpretation of the most commonly used trade terms in foreign trade

60
5.2.5 Supplier evaluation172
Contracts with carriers are always on a one year basis but the perspective of the relationship, however, is almost always longer. The reason for the contract time is that conditions change and prices cannot be fixed for too long. Some suppliers have been involved from the beginning since GT&T was formed 25 years ago. This is appreciated by Tetra Laval, where long-term relationships is perceive as positive and facilitates the core values of the parties involved. Tetra Laval is a customer large enough to obtain key account status with the major providers of transportation. GT&T often work closely with key account managers on the supplier side. At a new potential collaboration a first contact leads to an internal ranking conducted with the help of a supplier scorecard that provide input to both vendor and purchaser. The scorecard is excel-based and communicated mostly by e-mail. ISO 14001 is another part of the rankings, which in some parts of the world is a minimum requirement and in some others a requirements that comes after a few years of cooperation. It means that GT&T works actively with their suppliers in this type of questions. Overall there are few suppliers to GT&T considered to be of the highest strategic significance. They believe that most of the purchasing may be considered to be of a simpler nature. In GT&T's evaluation work, the absolutely greatest focus on transportation is that transporters pick up and deliver on time and that the goods are clean and tidy.
5.3 Cost structure, pricing & surcharges
The different costs that is associated with container shipping is; ship costs, that can be vessel operating cost and vessel capital cost, bunker costs that is given by consumption and bunker price, container cost that can be purchase and maintenance cost, administrative cost can be management, sales and purchase personnel costs and cargo handling costs can be terminal handling cost and cargo claims.173 With a bunker price of around 450 USD/MT and the container vessels sailing at 24 knots the bunker costs will represent nearly 60% of ship costs, as seen in table 9. In the fall of 2008 prices has gone down dramatically due to slowdown in the global economy and bunker prices were around 250 USD/MT. This gives bunker costs that represent about 45 % of ship costs. Same calculation is shown for lower vessel speed as well. This is more common today when the market is not expanding as it recently has done and is referred to as slow steaming. The round trip length of 23 200 nm should represent North Europe to East Asia, which is the largest trade lane round trip in today’s world trade volumes. 174
172 Ingvarsson, Robert, GT&T 173 Notteboom & Vernimmen (2008): The effect of high fuel costs on liner service configuration in container shipping 174 Ibid

61
Cost comparison for different vessel sizes, bunker costs and vessel speed-cost in USD per TEU transported (port-to-port basis)
Cost per TEU transported (USD) Vessel size and speed
4000 TEU 6500 TEU 9500 TEU
20 kn 22 kn 24 kn 20 kn 22 kn 24 kn 20 kn 22 kn 24 kn
Bunker cost=USD 450 per ton, round trip=23200nm, 10 port of call
Ship costs excluding bunker costs 285 266 251 254 237 224 218 204 193
Bunker costs 252 305 352 208 252 293 190 226 273
Container costs 89 89 89 89 89 89 89 89 89
Administrative costs 33 33 33 28 28 28 28 28 28
Cargo handling costs 142 142 142 142 142 142 142 142 142
Total 801 835 867 721 748 776 667 689 725
% bunker costs in ship costs 47% 53% 58% 45% 52% 57% 47% 53% 59%
% bunker costs in total costs 31% 37% 41% 29% 34% 38% 28% 33% 38%
Bunker cost=USD 250 per ton, round trip=23200nm, 10 port of call
Ship costs excluding bunker costs 285 266 251 254 237 224 218 204 193
Bunker costs 140 169 196 116 140 163 105 126 151
Container costs 89 89 89 89 89 89 89 89 89
Administrative costs 33 33 33 28 28 28 28 28 28
Cargo handling costs 142 142 142 142 142 142 142 142 142
Total 689 699 711 629 636 646 582 589 603
% bunker costs in ship costs 33% 39% 44% 31% 37% 42% 33% 38% 44%
% bunker costs in total costs 20% 24% 28% 18% 22% 25% 18% 21% 25%
Table 9 – Cost comparison for different vessel sizes175
5.3.1 Tetra Laval’s costs
The grand total cost for all nominated sea freight volumes was 2008 about x million USD (only indicative and roughly presented figure). In 2008 Tetra Laval’s grand total cost for the shipment of one 20’ container ranged from 260 to 8 540 USD with an average of x USD, for one 40’ container it ranged from 420 to 10 295 USD with an average of x USD and for one 40’HC container it ranged from 833 to 10 572 USD with an average of x USD when all nominations considered as equal weight independent of nominated volume. Surcharges for Tetra Laval’s sea freight is updated on a quarterly basis and only in very rare cases updated in the time in between. Currencies Table 10 shows the distribution of paid currencies for the total sea freight volume. The absolute majority, about 90%, of payments are made in USD.
175 Cost model results – Notteboom, revised to fit this report

62
Payable currency
Number of
TEU
Percentage of
total volume
EUR 8562 9,97%
GDP 93 0,11%
USD 77245 89,92%
Total 85899 100,00% Table 10 – Distribution of paid currencies for total volume in 2008
5.3.2 BAF and CAF
Carriers can give their BAF and CAF surcharges in two different ways, either as a percentage of the Ocean Freight rate or as an actual amount. The distribution between these ways is shown in table 11. It exist no less than about 260 different BAF levels, either in percentage or fixed amount and about 110 different CAF levels either in percentage or fixed amount. This illustrates the need for an own models which would decrease these amounts. For some of the nominations that has no BAF or CAF surcharge, these costs has been included in the ocean freight cost and then this sum has been updated along the year. This has been the case for example on North America trades.
Type of surcharge
BAF & CAF in percentage
CAF in percentage
BAF actual
amount
CAF actual
amount No BAF
No CAF
Total TEU 485 37073 62301 2020 23113 48342 Percentage of total volume 0,56% 43,16% 72,53% 2,35% 26,91% 53,93% Table 11 – Paid add on surcharges for total volumes in 2008
The main reason for introducing the CAF surcharge on a major part of trade lanes services is illustrated in figure 11 and depends on the fact that prices are traditionally always quoted in USD within sea freight and carriers has costs in many different currencies. The dramatic decline in the value of the USD against the EURO since 2002 has led to carriers saying that it is necessary to take an additional surcharge to compensate for this decline. 176 The USD has also declined against many smaller currencies as the SEK and that has contributed to this fact.177
176 Tetra Laval internal material 177 www.di.se, 2008-11-26

63
USD/EURsource: European Central Bank
0,7
0,8
0,9
1
1,1
1,2
1,3
1,4
1,5
1,6
1,7
1999 2000 2001 2002 2003 2004 2005 2006 2007 2008
Figure 11 – The exchange rate between USD and EURO178
5.3.3 THC
About 85 % of total volumes have THC origin surcharge included in the total FOB (Free On Board) cost according to group standard terms of delivery and not separately declared. At those nominated shipments that have THC origin specified it ranges from 70 to 290 EURO with an average of 146 EURO when some major ports are considered. THC destination surcharge do not exist (5 nominated TEU in total have it specified, which equals 0,0058 % of total volume). 179
5.3.4 Other fees and surcharges
There is a large variety of ways carriers decide to present their offers in the nomination file and which columns they decide to fill in. Some use more of an all in approach were they include all the costs in a few parameters while others specifies their costs very exact. This makes it sometimes hard to get a clear overview when comparing offers. This further emphasises the need to try to get better control of how prices are offered and how they are allowed to change during the contract period. Examples of the distribution of cost specifications are as follows.180 Forwarding fee is a cost that refers to the inland transportation from supplier to the port of origin. It stands for about 5 % of the ocean freight cost. It is a cost that occurs on all nominations.
178 www.ecb.eu, 2008-10-14 179 Tetra Laval internal material 180 Team Sea

64
Customs clearance is a fee that the customs authority in the origin country charges. This cost is specified in about 15 % of total nominations. Carrier haulage is another fee that some carriers take as part of Free On Board cost. This is specified at about 40 % of all nominations 2008. War surcharge was in 2008 subject to about 2,10 % of Tetra Laval’s total volumes. It stands for about 1,66 % of grand total costs on average for these specific shipments. Congestion surcharge was in 2008 subject to about 5,5 % of Tetra Laval’s total volumes. It stands for about 3,9 % of grand total costs on average for these specific shipments. Some fees and surcharges that have existed historically have in recent year disappeared from the cost structure. For example carrier fee, courier fee and harbour dues. When the bunker price during the summer of 2008 increased to historical record levels, some carriers that were taken by surprise introduced an Emergency BAF surcharge to try to compensate for the increasing bunker price.181
5.4 Bunker adjustment factor
In the beginning of this section information about crude oil, bunker fuel and environmental aspects are presented. This will contribute to the understanding of the managing of bunker consumption levels and to how the final look of the BAF model will be, as shown later in the analysis chapter.
5.4.1 The oil and bunker industry
5.4.1.1 Crude oil facts & figures182
• Oil accounts for 40 percent of the world's total energy demand. • The world consumes about 76 million bbl/day of oil. • United States (20 million bbl/d), followed by China (5.6 million bbl/d) and Japan
(5.4 million bbl/d) are the top oil consuming countries. • Balance recoverable reserve was estimated at about 142.7 billion tons (in 2002),
of which The Organization of the Petroleum Exporting Countries (OPEC) was 112 billion tons.
• Maximum price variation (based on data from April 1994 to March 2004) Monthly 23,25 % Yearly 28,73 %
5.4.1.2 Crude oil price – Historical development
In figure 12 the crude oil price development since the beginning of exploration is shown. The orange line is the real price in 2006 price level, free from inflation, also called fixed
181 The Carriers 182 http://www.mcxindia.com, 2008-09-02

65
price, and the blue line is the nominal price which is real price and inflation, also called floating price. In the beginning of the oil era prices was naturally high in today’s real prices because of the initial learning of how to drill for oil. Next peak in 1973 was because of OPEC’s oil embargo and in the beginning of 1980’s Iranian revolution and the Iran-Iraq War.183 During recent years the soaring oil price depends on the decline in the USD exchange rate, the current war in Iraq and the tensions between USA and Iran. 184 The protective development in Venezuela during 2007 has also contributed to the rise in oil price.185 The dramatic drop in oil price in the autumn of 2008 is because of the global financial crisis and forthcoming economic recession.186
183 Barnsky & Kilian (2004): Oil and the Macroeconomy Since the 1970s 184 www.di.se - Råvaror: Oljepriset tog revansch, 2007-10-25 185 www.di.se - Råvaror: Oljepriset fortsätter upp, 2008-02-11 186 www.di.se - Råvaror: Oljan fortsätter ned, 2008-11-20

66
Fig
ure 1
2 –
No
min
al v
ersus rea
l prices fo
r crud
e oil 1
87
187 www.eia.gov, 2008-11-20

67
5.4.1.3 Crude oil types
The two crude oils which are either traded themselves or whose prices are reflected in other types of crude oil are West Texas Intermediate and Brent. In total there are about 161 different internationally traded crude oils. Differences in the prices of these various crude oils are related to quality differences, but other factors can also influence the price relationships as well. 188 As will be further explained later, the market prices of different crude oils are basically about the weight shifting between supply and demand over time. Some experts also argue that today’s market price is to some more or less degree dependable of investment speculations in the big commodity exchanges in New York (Nymex) and London (ICE). These speculators can for example be large hedge funds or wealthy private persons. OPEC is a permanent, intergovernmental Organization, created at the Baghdad Conference on September 10–14, 1960, by Iran, Iraq, Kuwait, Saudi Arabia and Venezuela. Today it consists of 12 countries mainly from the Middle East. OPEC's mission is to coordinate and unify the petroleum policies of Member Countries and ensure the stabilization of oil markets in order to secure an efficient, economic and regular supply of petroleum to consumers, a steady income to producers and a fair return on capital to those investing in the petroleum industry. A list of nation suppliers and consumers for 2006 is shown in table 12. Top World Oil Producers, 2006 Top World Oil Consumers, 2006 (thousand barrels per day) (thousand barrels per day) Rank Country Production Rank Country Consumption
1 Saudi Arabia 10,665 1 United States 20,687 2 Russia 9,677 2 China 7,201 3 United States 8,330 3 Japan 5,159 4 Iran 4,148 4 Russia 2,811 5 China 3,845 5 Germany 2,665 6 Mexico 3,707 6 India 2,572 7 Canada 3,288 7 Canada 2,264 8 United Arab Emirates 2,945 8 Brazil 2,217 9 Venezuela 2,803 9 Korea, South 2,174 10 Norway 2,786 10 Saudi Arabia 2,139 11 Kuwait 2,675 11 Mexico 1,997 12 Nigeria 2,443 12 France 1,961 13 Brazil 2,167 13 United Kingdom 1,825 14 Algeria 2,122 14 Italy 1,732 15 Iraq 2,008 15 Iran 1,679
Table 12 – Top world oil producers and consumers189
5.4.1.4 Bunker fuel190
Bunker fuel is technically any type of fuel oil used aboard ships. It gets its name from the containers on ships and in ports that it is stored in. In the days of steam they were coal
188 www.eia.gov, 2008-09-02 189 www.eia.gov, 2008-09-10 190 www.bunkerworld.com, 2008-09-05

68
bunkers but now they are bunker-fuel tanks. Bunker fuels are purchased and stemmed all over the world. The only quality requirement applicable to this fuel is based on ISO 8217. The specification for various grades provides a very broad range. It is therefore possible to get a bunker fuel, which in terms of its usefulness to the marine engine can vary widely and yet conform to the specifications. Bunker fuel is one of the least refined oil products and therefore is similar in quality, consistence and also price to crude oil. In figure 13 the crude oil price and Rotterdam bunker price are shown from January 2007 until November 2008.The correlation is 97,25%, which is the strength of the two prices covariation.
Correlation 97,25 %
0,00
100,00
200,00
300,00
400,00
500,00
600,00
700,00
800,00
jan-
07
mar
-07
May
2007
jul-0
7
sep-
07
nov-
07
jan-
08
mar
-08
May
2008
jul-0
8
sep-
08
Crude Oil
USD/MT
Rotterdam bunker
IFO 380 USD/MT
Figure 13 – Plot of crude oil and Rotterdam bunker 191
5.4.1.5 Bunker fuel grades192
The International Standard Organization (ISO) in cooperation with the marine and petroleum industry prepared specifications to meet the requirements for marine fuels supplied worldwide for use aboard ships. There are 19 categories of residual fuels available internationally. Out of these 19, four categories or grades are most frequently supplied and used by ships. Industrial names for the four grades are IFO180, IFO380, MDO and MGO. These relate to the ISO grades RME25, RMG35, DMB and DMA respectively. Industrial nomenclature is based on the fuel viscosity193 at 50°C. IFO 180 indicates that the viscosity of the fuel is 180 centistokes (cSt) at 50°C and IFO 380 fuel will have a viscosity of 380 cSt at 50°C. IFO stands for Intermediate Fuel Oil and MDO stands for Marine Diesel Oil which is a blend of gas oil and heavy oil. MGO stands for Marine Gas Oil which is clear and not blended with heavy fuel.
191 Own representation, data from www.eia.gov and www.bunkerworld.com 192 www.bunkerworld.com, 2008-09-09 193 Resistance of a liquid to flow, or its "thickness"

69
ISO has specified 11 parameters for residual fuels and 14 parameters for distillate fuels. A specified grade of fuel should meet all the requirements set by ISO. IFO180 or RME25 has about 6 to 7 % gas oil in it where as IFO380 or RMG35 has about 3% gas oil. Because of the higher gas oil content, price of the IFO180 is higher than the heavier IFO380 grade. In addition to the difference in the gas oil content, requirements for 4 out of 11 parameters are different for the two grades. MDO or DMB is a blend of heavy fuel and gas oil and they are cheaper than pure MGO or DMA. Requirements are different for both the grades.
5.4.1.6 Bunker fuel used in the sea freight industry
High fuel costs have made the sea freight carriers look for cheaper alternatives. Cheaper higher-viscosity bunker fuels, such as IFO 420, 500, 600 and 700, are becoming more popular, as the potential savings can be substantial. IFO 500 is about 7-11 USD cheaper per metric ton that IFO 380 and for IFO 700 the savings are up to 16 USD. The use of higher-viscosity bunker fuel is however not without complications. The container vessel involved must be able to incinerate with rougher fuel grades, which often is not the case for older vessels. The higher-viscosity goes with more complex handling issues, but these are more than offset by the savings. Despite an increasing interest in the higher-viscosity grades conventional grades still remain the most common used. About 70 % of all marine fuel sales (including distillates) in Singapore concern the conventional IFO 380 grade. In US ports, where higher-viscosity fuels have gained most popularity, the share of IFO 500 still remains below 20 %. 194 The findings from interviewing the carriers also showed that the most common one used and considered when fuel costs are discussed is IFO 380, with some small variation in the IFO viscosity grade for some carriers. 195 Statements above are true for the time the ship is at sea. While in port MDO, or sometimes fuel oil, for auxiliaries is used. MDO is considerably more expensive then fuel oil on a tonne basis i.e. factor 1,5-2.0 times more than IFO 380.196 Although the fuel consumption in port is about 10 % of the consumption while at sea.197 The way that bunker fuel is bought and paid for among carriers differs to some degree. The most common opinion is that it is bought on the spot market whenever a specific vessel need new bunker fuel but some say that future contract for bunker fuel is very commonly used to hedge fuel costs.198 Containerships are designed with large bunker tanks which allow for several weeks of travel at service speed before having to re-fuel.199
194 Notteboom & Vernimmen (2008): The effect of high fuel costs on liner service configuration in
container shipping 195 The Carriers 196 Meyrick and Associates (2008): Review of BAFs - Transatlantic and Europe/Far East trades 197 Cariou, Pierre, WMU 198 The Carriers 199 Meyrick and Associates (2008): Review of BAFs - Transatlantic and Europe/Far East trades

70
5.4.1.7 Environmental aspects
The high fuel costs for carriers are not only the result of the increasing oil price. Sulphur emissions from ships are a major and increasing cause of acid downfall which has a negative effect on the environment. Concerns about this have resulted in strict emission standards in some regions and more are expected to follow. This development is contributing to a shift from Heavy Fuel Oil (HFO) to bunker with lower sulphur content, so-called Low Sulphur Fuel Oil (LSFO). Another solution is to add cleaning equipment onboard such as scrubbers and particle filters.200 For example the legislation by the European Commission, the first Sulphur Emission Control Area (SECA) came in force November 2006 in the Baltic. When entering a SECA, the vessel will have to switch to another grade of fuel oil. The installation of SECA’s throughout Europe has made carriers impose a new kind of surcharge, the low sulphur surcharge. 201 A comparison of price levels between the traditional IFO 380 bunker fuel that has relative high sulphur content against MGO with lower sulphur content and which also is generally more environmental friendly shows the significant difference. The average monthly prices from June 2008 until today show that MGO is at average 92% more expensive than IFO 380.202
5.4.2 Managing bunker consumption levels
With rising fuel prices carriers are forced to keep a tighter control of their bunker consumption. They can do so by either using cheaper grades of bunker or by changing their service design in terms of vessel speed and size or adding more vessels to a trade lane service loop. 203
5.4.2.1 Vessel speed
From a technical viewpoint there are two main challenges for carriers in coming years. One being to reduce bunker expenses and the other to do it while at the same time respond to the increasing environmental pressure to contain CO2 emissions and reduce the emissions of SO2 and NOX. The most effective way of reducing both the bunker consumption and the CO2 emissions are by reducing speed.204 Figure 14 illustrates the relation between service speed and the daily bunker consumption and indicates that just a couple of knots decrease in service speed will drastically affect the bunker consumption. For example a reduction from 26 to 23 knots in service speed for an 8 000 TEU vessel
200 Notteboom & Vernimmen (2008): The effect of high fuel costs on liner service configuration in
container shipping 201 Ibid 202 www.bunkerworld.com, 2008-12-04 203 Notteboom & Vernimmen (2008): The effect of high fuel costs on liner service configuration in container shipping 204 AXS-Alphaliner (2008): The containership market 2007
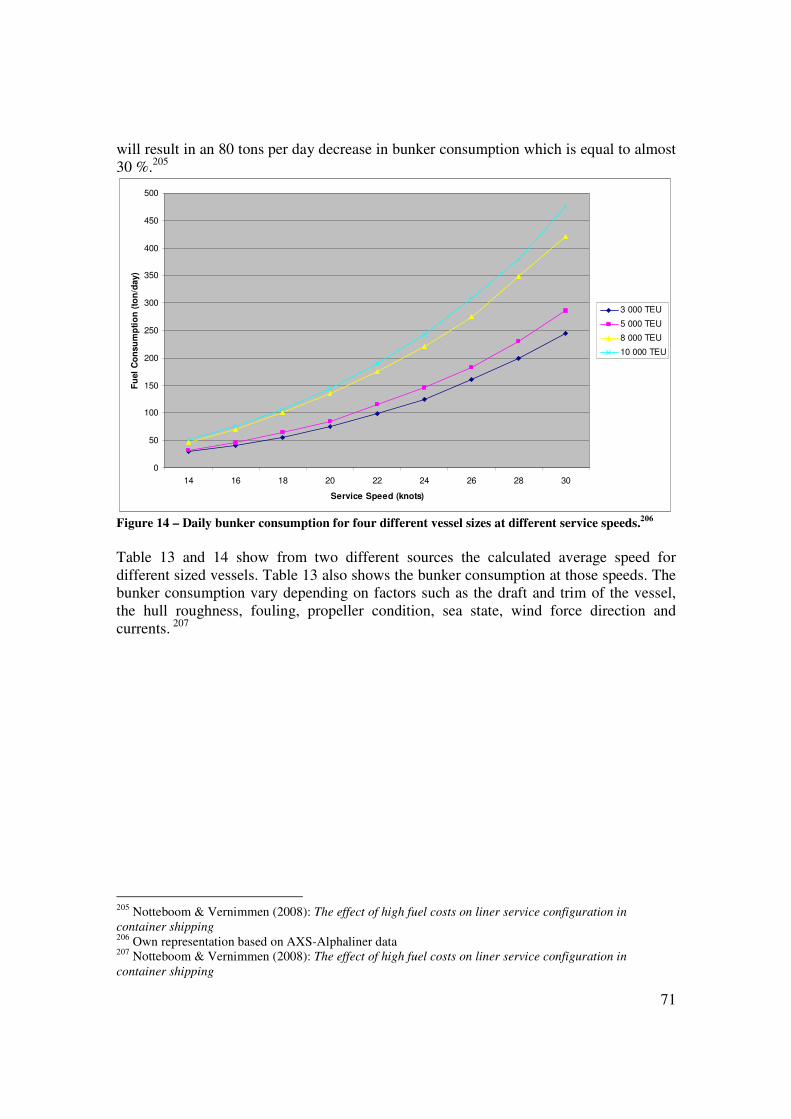
71
will result in an 80 tons per day decrease in bunker consumption which is equal to almost 30 %.205
0
50
100
150
200
250
300
350
400
450
500
14 16 18 20 22 24 26 28 30
Service Speed (knots)
Fu
el
Co
nsu
mp
tio
n (
ton
/day)
3 000 TEU
5 000 TEU
8 000 TEU
10 000 TEU
Figure 14 – Daily bunker consumption for four different vessel sizes at different service speeds.206
Table 13 and 14 show from two different sources the calculated average speed for different sized vessels. Table 13 also shows the bunker consumption at those speeds. The bunker consumption vary depending on factors such as the draft and trim of the vessel, the hull roughness, fouling, propeller condition, sea state, wind force direction and currents. 207
205 Notteboom & Vernimmen (2008): The effect of high fuel costs on liner service configuration in
container shipping 206 Own representation based on AXS-Alphaliner data 207 Notteboom & Vernimmen (2008): The effect of high fuel costs on liner service configuration in
container shipping

72
208 Lloyd’s Fairplay Ship Database (2008)
Ta
ble 1
3 –
Vessel b
un
ker fu
el con
sum
ptio
n20
8
HF
O =
He
avy F
uel O
il
** HF
O C
on
su
mp
tion
is o
nly
av
aila
ble
for 5
94 o
ut o
f the 2
259 o
bserv
atio
ns a
nd
for m
ain
en
gin
e.
* No
t sp
ecifie
d fo
ur s
troke /N
ot s
pecifie
d m
ed
ium
-hig
h s
peed
HF
O C
on
su
mp
tion
main
en
gin
e p
er te
u-m
ile
HF
O C
on
su
mp
tion
main
en
gin
e in
mt/d
ay**
- Oth
er* (%
)
- Tw
o S
troke/S
low
sp
eed
(%)
En
gin
e T
yp
es
Mean
main
en
gin
e (k
W-h
r)
Mean
ag
e (y
ear)
Mean
Sp
eed
(nm
)
Men
a s
ize (T
EU
)
Nu
mb
er #
0.0
00062
80
7
93
20699
10.1
21.2
2530
764
2000-3
000 0
.000055
102
2
98
26741
11.6
22.4
3432
350
3000-4
000 0
.00005
6
142
1
99
38616
6.5
23.9
4385
469
4000-5
000 0
.000062
199
3
97
49243
5.2
24.5
5491
285
500
0-6
000 0
.000058
229
1
99
57764
4.4
25.3
6505
146
6000-7
000 0
.000052
233
2
98
61436
4.7
25.1
7372
60
7000-8
000 0
.000051
255
1
99
64353
1.9
24.9
8293
122
8000-9
000
N/A
N/A
0
100
67259
1.4
25.1
9307
46
9000-1
0000
N/A
N/A
0
100
66580
0.6
23.6
11660
17
100000+
5.1
E-0
5
121
75
2184
36084
7.8
23.0
4
4332
2259
To
tal #

73
Table 14 – Average speed and age of world fleet209
There are currently no alternatives to the diesel engine and screw propeller on ships. Nuclear power causes ecological and safety concerns, wind power and solar cells are not realistic options today and electro-magnetic propulsion tunnels which would eliminate the need for the propeller is only a remote possibility. Kite sails are being experimented with but cannot be seen as an alternative but only as a way to save small fractions of fuel consumption during favourable wind conditions. 210
5.4.2.2 Slow steaming
Ship owners have responded to the rising fuel costs with a variety of cost-cutting measures which include lowering vessel speed and adding new ships to ensure service.211 In the autumn of 2007 lines such as CMA-CGM and Maersk Line decided to reduce service speed and add more tonnage to some of their trade lanes. It is also reported that APL, HMM and MOL are to slow down their ships on Asia-Europe trades. 212 Speed reduction is especially used on the Europe-Far East route where the loop time often increased from eight to nine weeks. The fuel savings largely offset the cost of running an additional ship. For example a 10 000 TEU ship on a Shanghai-Germany loop with an increase in loop time from eight to nine weeks means an increased time spent at sea from 39 to 46 days with the assumption that the time in port of approximately 17 days remains the same. This results in the average speed being reduced from 24 to 20,5 knots which is equivalent to 230 respectively 150 tons of bunker consumed per day according
209 Drewry Shipping Consults Ltd. (2007): Annual Container Market Review and Forecast - 2007/08 210 AXS-Alphaliner (2008): The containership market 2007 211 www.bunkerworld.com, 2008-11-28 212 Notteboom & Vernimmen (2008): The effect of high fuel costs on liner service configuration in
container shipping
Size Range (TEU
No. of Vessels
% Total Capacity (TEU)
% Average Speed (Knots)
Average Age (Years)
<500 438 10.57% 136,271 1.35% 14.0 21.3
500-999 752 18.15% 548,760 5.45% 16.9 11.3
1000-1499 611 14.74% 722,275 7.17% 18.4 12.4
1500-1999 486 11.73% 825,704 8.19% 19.7 11.1
2000-2499 302 7.29% 691,569 6.86% 20.8 11.3
2500-2999 348 8.40% 946,836 9.40% 21.9 9.8
3000-3999 317 7.65% 1,081,763 10.74% 22.5 12.5
4000-4999 354 8.54% 1,552,699 15.41% 24.0 7.2
5000-5999 239 5.77% 1,300,082 12.90% 25.2 4.7
6000-6999 114 2.75% 740,188 7.35% 25.2 4.6
7000-7999 49 1.18% 359,995 3.57% 25.1 4.4
8000-8999 93 2.24% 766,668 7.61% 25.1 1.4
9000-9999 36 0.87% 336,295 3.34% 24.8 1.1
10000+ 5 0.12% 67,500 0.67% 25.0 0.6
Grand Total 4,144 100.00% 10,076,605 100.00% 19.9 11.1

74
to figure 14. Assuming a bunker price of 500 USD per ton and considering the impact of the ninth vessel this would result in that the annual fuel bill drops from just over 230 million USD to just under 180 million USD, a saving of around 50 million USD. This more than compensates for the fixed running costs (including capital cost) of the additional ship that is about 12-16 million USD exclusive the cost of the extra containers needed.213 The current trend of slow steaming will be the third time in container shipping history that the speed is reduced on a wide range. The first time was in the aftermath of the Yom Kippur War in 1973 when crude oil prices doubled. However, speeds of 25 knots were still common. The second time speed reduction occurred was in 1979 when OPEC decided to boost crude oil prices again with an embargo. Then in 1986 crude oil prices collapsed and since then standard speeds for large containerships have been 24-25 knots.214
5.4.2.3 Services routes
Carriers often have several service routes on one specific trade lane. This is mostly true for the major carriers on the major trade lanes. The different service routes have different functions and some have very short roundtrip times while other have a high number of port calls and a long roundtrip time. Some service routes also do port calls in intermediate regions on the trade lane. For example Jeddah, Saudi Arabia sometimes is a port call on the Europe-Far East trade lane and port calls are sometimes made in Panama on the transpacific trade lane. On trade lanes the major ports are called and then feeder traffic to smaller ports in each region is used. This has to be considered when analyzing average vessel size of a specific trade lane.215
5.4.2.4 Vessel size
As a result of the strong growth in container shipping industry, carriers has in order to anticipate future volume increases embarked on ambitious expansion plans to upgrade their fleet. The tendency of larger vessels is a result of the relentless search for cost savings that for example comes with economies of scale. The scale increase in vessel size has resulted in lower bunker cost per TEU. 216 Table 15 shows the forecast of the world cellular fleet in coming years. By looking at only the development 2008 to 2010 since these figures are not as speculative as 2011 and 2012, means an increase of over 30 % TEU capacity. The Rise p.a. column shows that it is particularly in the larger vessel sizes that the capacity will increase. The capacity provided by 7 500+ TEU ships will for example triple over the coming four years and the
213 AXS-Alphaliner (2008): The containership market 2007 214 Ibid 215 Maersk, CMA-CGM 216 Notteboom & Vernimmen (2008): The effect of high fuel costs on liner service configuration in
container shipping

75
number of ships larger then 10 500 TEU will more than fivefold over the coming three years.217
Fleet as at: 1st Jan 2008 1st Jan 2009 1st Jan 2010 1st Jan 2011 1st Jan 2012 Rise p.a. (3 years)
TEU nominal Ships TEU Ships TEU Ships TEU Ships TEU Ships TEU TEU terms
10500-15500 7 106,400 12 169,800 38 494,708 83 1,075,411 158 2,044,922 n/a
7500-10499 181 1,546,426 255 1,942,507 263 2,279,066 328 2,850,221 356 3,103,499 21.4%
5100-7499 333 2,001,970 381 2,303,070 431 2,626,633 473 2,906,299 505 3,106,999 14.5%
4000-5099 466 2,112,382 541 2,449,076 646 2,915,060 705 3,179,525 758 3,418,751 17.5%
3000-3999 313 1,065,155 334 1,139,031 369 1,256,553 402 1,371,399 405 1,382,025 8.6%
2000-2999 688 1,736,991 742 1,879,690 790 2,002,428 829 2,100,388 844 2,140,566 7.4%
1500-1999 521 881,133 569 965,066 619 1,052,428 642 1,092,196 655 1,114,772 9.3%
1000-1499 660 779,108 724 853,654 795 939,583 848 1,005,296 863 1,024,415 9.8%
500-999 784 576,689 850 628,710 919 684,981 947 708,230 949 710,162 9.0%
100-499 358 115,062 343 110,557 343 110,557 343 110,557 343 110,557 -2.0%
Total 4,311 10,921,316 4,751 12,441,161 5,213 14,361,997 5,600 16,399,522 5,836 18,156,668 14.7%
Figures are far from definitive as shipyards can still accept orders for 2011 delivery
Rise p.a. (3 years) represent the average per annum growth during the 3 years 2008-2009-2010
Table 15 – World cellular fleet forecast218
The largest average ship size is on the trade lane between Europe and Far East. Taking into account the current containership order book being focused on 7500+ TEU ships the average size on the trade route will increase further in the years to come. Larger vessels will become a tough challenge for ports of the shipping industry such as terminal operators and port authorities and put enormous pressure on hinterland infrastructure.219 According to Drewry Shipping Consults Ltd.220 the average vessel size for Q3 2007 on Far East – North Europe trade lane was 7 499 TEU. For most cases the average size of the vessels in the east/west trades is rather rapidly increasing. On the Far East – Europe trade lane average vessel sizes rose by 17,3 % year-on-year, from 6 394 TEU to 7 499 TEU. About the same increase was also shown on the Far East – Mediterranean trade lane where average sizes went from 4 037 TEU to 4 724 TEU. On the Far East – US West Coast route the average vessel size is 5 069 TEU which gives a 3,6 % increase year-on-year and to the East Coast the figure is 4 190 TEU with a 6.8 % year-on-year increase. US – Mediterranean trade lane increased by 4 % year-on-year to 3 509 TEU.221 Because of the difference in goods flow and length between trade lanes different sizes of vessels are deployed on them. The trade lanes with the most goods flow and longest journey deploys the largest vessels. The average vessel sizes in TEU from two different
217 Notteboom & Vernimmen (2008): The effect of high fuel costs on liner service configuration in
container shipping 218 AXS-Alphaliner (2008): The Cellular fleet forecast 219 Notteboom & Vernimmen (2008): The effect of high fuel costs on liner service configuration in
container shipping 220 Independent maritime consultancy company 221 Drewry Shipping Consults Ltd. (2007): Annual Container Market Review and Forecast - 2007/08
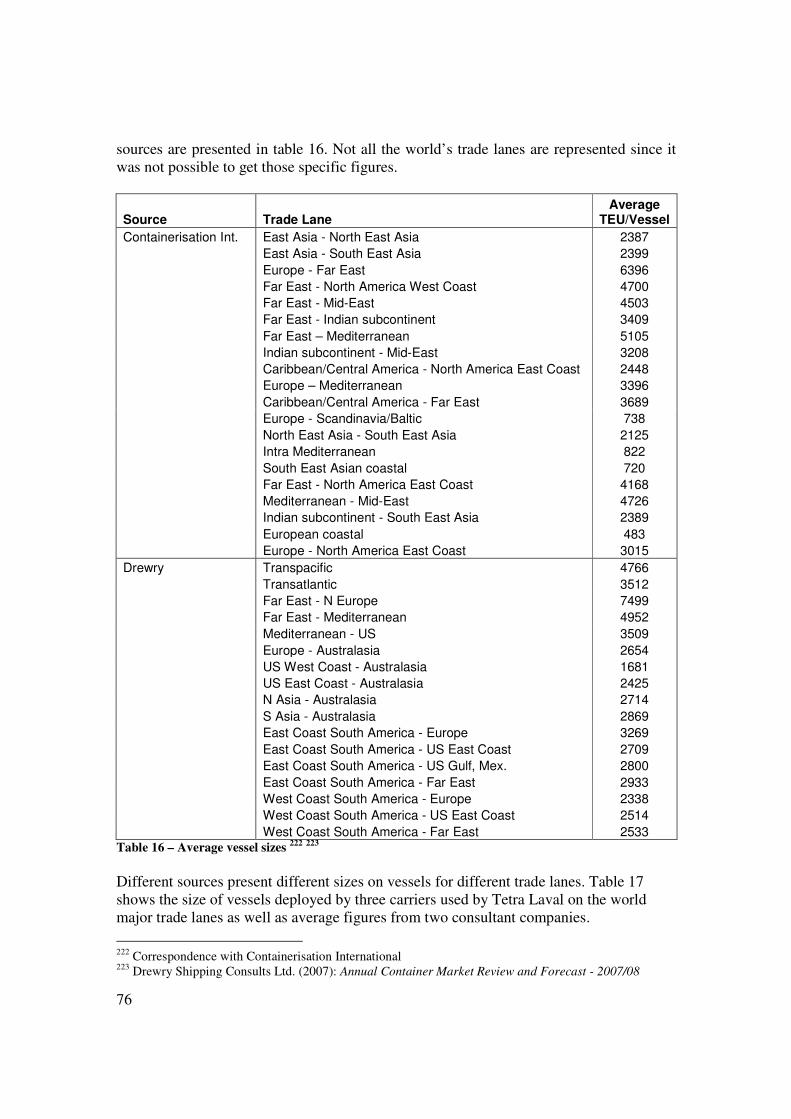
76
sources are presented in table 16. Not all the world’s trade lanes are represented since it was not possible to get those specific figures.
Source Trade Lane Average
TEU/Vessel
Containerisation Int. East Asia - North East Asia 2387
East Asia - South East Asia 2399
Europe - Far East 6396
Far East - North America West Coast 4700
Far East - Mid-East 4503
Far East - Indian subcontinent 3409
Far East – Mediterranean 5105
Indian subcontinent - Mid-East 3208
Caribbean/Central America - North America East Coast 2448
Europe – Mediterranean 3396
Caribbean/Central America - Far East 3689
Europe - Scandinavia/Baltic 738
North East Asia - South East Asia 2125
Intra Mediterranean 822
South East Asian coastal 720
Far East - North America East Coast 4168
Mediterranean - Mid-East 4726
Indian subcontinent - South East Asia 2389
European coastal 483
Europe - North America East Coast 3015
Drewry Transpacific 4766
Transatlantic 3512
Far East - N Europe 7499
Far East - Mediterranean 4952
Mediterranean - US 3509
Europe - Australasia 2654
US West Coast - Australasia 1681
US East Coast - Australasia 2425
N Asia - Australasia 2714
S Asia - Australasia 2869
East Coast South America - Europe 3269
East Coast South America - US East Coast 2709
East Coast South America - US Gulf, Mex. 2800
East Coast South America - Far East 2933
West Coast South America - Europe 2338
West Coast South America - US East Coast 2514
West Coast South America - Far East 2533 Table 16 – Average vessel sizes 222 223
Different sources present different sizes on vessels for different trade lanes. Table 17 shows the size of vessels deployed by three carriers used by Tetra Laval on the world major trade lanes as well as average figures from two consultant companies.
222 Correspondence with Containerisation International 223 Drewry Shipping Consults Ltd. (2007): Annual Container Market Review and Forecast - 2007/08

77
UASC Hyundai Maersk Meyrick MDS Transmodal
Transatlantic 4000 3000 4494
Europe/Far East 6919 and 3802 8000 11000 7000 6455
Transpacific 6000 11000 5159 Table 17 – Specific vessel sizes224 225
There are factors that limit the development in vessel size. One being that the canals in the world is to some degree bottle necks for the size of ships and therefore also global trade. The two most important ones for the global trade are the Panama Canal and the Suez Canal. The smallest one today is the Panama Canal that is limited to the PANAMAX-size of wide<32.5m length<230m and depth<12m226. However the Panama Canal is being expanded and the work is expected to finish in 2014 and when this is done it will be able to handle 12 000 TEU vessels.227
5.4.3 Vessel utilization
On many trade lanes, at least one leg of the roundtrip, vessel utilization is limited by deadweight rather than volume constrains e.g. transpacific eastbound and Far East-Europe westbound. This means that the full slot intake of the vessels sometimes becomes unusable when encountering anything but lightweight cargoes. This phenomenon is especially true for newer ships where the average deadweight per slot is less than that of previous generations. 228 Some of the interviewed persons also addressed this issue saying that ships reaches max capacity in weight way before it reaches its max capacity in volume.229 For the deployment of the global East-West headhaul supply/demand balance the aggregate utilization for 2007 was 89,0 %. The headhaul utilization for North Europe – Far East that is the largest trade lane for Tetra Laval was as high as 96,7%. The backhaul utilization for this trade lane was 58,6 % which gives an average of 77,7 %.230 In order to get high utilization carriers choose vessels sizes on trade lanes to suit the demand in goods flow for the headhaul direction. For backhaul the utilization is somewhat lower in number of full containers but because of the repositioning of empty containers the actual number of containers onboard is still relatively high. This phenomenon is closely related to how prices are set in the container shipping market. Ocean freight rates are adjusted to how the weight between supply and demand looks for the moment and also to the development of total world trade volume allocation.231
224 Gathered from carrier’s respective webpage 225 MDS Transmodal Ltd.: Forecasting for long term investment in the container shipping market – an
holistic approach 226 www.pancanal.com, 2008-09-19 227 Drewry Shipping Consults Ltd. (2007): Annual Container Market Review and Forecast - 2007/08 228 Ibid 229 The Carriers 230 Drewry Shipping Consults Ltd. (2007): Annual Container Market Review and Forecast - 2007/08 231 The Carriers

78
It is hard to get an exact world average of utilization for container ships since this information is very sensitive for individual carriers, but at a liner conferences level (aggregated level) an average of roughly about 80 % can be assumed.232 In other studies and reports done on fuel costs and BAF vessel utilization has been estimated. In Meyrick’s report the utilization was estimated to 75% on the roundtrip Europe – Far East and 85 % on the transatlantic roundtrip.233 Notteboom and Vernimmen estimated, based on expert information the vessel utilization on North Europe - Far East to 95 % on the westbound leg and 80 % on the eastbound leg.234
5.4.4 Time in port
The average time per port call can be estimated to about one day. On longer trade lanes like Europe - Far East the relative time in port is lower than on for example transatlantic trade since the time it takes for the vessel to travel between the two clusters is longer and the relative time at sea increases. In times of lower volumes carriers decrease their number of service routes and increases the number of port calls on the remaining routes.235 One carrier gave the example that on Far East - Europe the total roundtrip time is 65-70 days, including port calls of 15-20 days. On the transatlantic trade the transit time over the Atlantic is 5-6 days and time in port about 5 days in Europe and 5 days in America. When excluding extreme values in number of port calls a median amount on a roundtrip for the Europe - Far East trade lane is between 14-18 days. The port calls for South America - Far East is between 15-20 days, Europe - Red Sea 8-10 days and Europe - Mediterranean 7-12 days.236
5.4.5 Congestion and carrier owned terminals
Sometimes there is congestion in ports which makes ships having to wait in line in order to get to load and unload their goods. This increases the ships time in port and makes it delayed on its route if they do not increase the speed in between ports. Congestion is in some parts of the world a growing problem. Ports with continuously growing goods volumes have large trouble to cope with infrastructure expansion and parts of the world that have poor infrastructure from start are the two common cases. This is to some carriers such a large concern that they started to build their own terminals e.g. APM Terminals which is the A.P. Moeller Maersk owned subsidiary that focuses on port and terminal investing. Carrier’s consortium that takes on this challenge is also an occurring phenomenon. This problem also demands better cooperation with national
232 Cariou, Pierre, WMU 233 Meyrick and Associates (2008): Review of BAFs - Transatlantic and Europe/Far East trades 234 Notteboom & Vernimmen (2008): The effect of high fuel costs on liner service configuration in
container shipping 235 The Carriers 236 Gathered from carrier’s respective webpage

79
authorities and politicians to create a long term joint intention of infrastructure investment. Port congestion is likely to become an even greater problem in 2008-2009, particularly in Europe. 237
5.4.6 Shippers opinion about BAF surcharge and historical levels
Table 18 illustrates that there is a good correlation between movements in BAF level and movements in bunker fuel price from January 2001 to January 2008. The bars show the Far East Freight Conference (FEFC) BAF level and the line show the bunker fuel price. A lag of one to two months between the BAF change and the movement in the bunker fuel price confirms the stated methodology adopted by carriers and conferences that next month’s BAF is based on the previous one to two months average bunker fuel prices. This correlation is in this specific case established by Meyrick238, but the same type of correlations has been shown in an academic report by Professor Pierre Cariou at World Maritime University and Professor Francois-Charles Wolff at the University of Nantes.239 Under some assumptions about bunker fuel consumption as vessel size and speed etc. and extrapolation to get the baseline bunker price for the BAF, Meyrick & Associates prepared an analysis for Europe Shippers Council that tried to show if the BAF level has been cost recovery or profit maximization. On the trade lane Europe to Far East where FEFC set the BAF level they found that the BAF level for March 2008 was about 17 % higher than true cost recovery. On the transatlantic trade lane where Transatlantic Conference Agreement (TACA) set the BAF level they found that the BAF level for March 2008 was about 228 % higher that true cost recovery. The belief that the BAF level has been higher than cost recovery is with this report to some degree proven, though one has to take into consideration that the report was prepared for the European Shippers Council that represent the freight buyer’s side on the subject and therefore the percentage declared must be considered as very roughly accurate.
237 Drewry Shipping Consults Ltd. (2007): Annual Container Market Review and Forecast - 2007/08 238 Meyrick and Associates (2008): Review of BAFs - Transatlantic and Europe/Far East trades 239 Cariou & Wolff (2006): An analysis of Bunker Adjustment Factor and freight rates in the Europe/Far
East market 2000-2004

80
Table 18 – Correlation between Far East Freight Conference (FEFC) BAF level and IFO 380 bunker average from Rotterdam and Singapore. 240
5.4.7 Existing BAF models
Since the abolition of the liner conferences in October 2008 carriers need their own independent method of calculating the BAF surcharge. They have then taken different approaches on how they present their BAF announcements. Some have chosen to present it in the same way as the conferences did with only giving out amounts. A few however have chosen to create and present their own calculation models in an attempt to provide a simple, fair, and transparent BAF. The first and most evident is the Maersk formula which was announced in early 2008 and offers a degree of transparency which has previously not been witnessed and the reaction has been relatively positive241. Among the other carriers there is a variety in how transparent their calculations are. Some give the calculation periods for the bunker price which they use to do their calculations but not the trade specific constants. Others give the type of bunker price they monitor and/or in which ports.
5.4.7.1 Maersk Line BAF Formula242
The formula can be seen in figure 15 and takes into account the bunker price change, transit time, the routes’ imbalance and the average bunker consumption per container and day on the specific route.
240 Meyrick and Associates (2008): Review of BAFs - Transatlantic and Europe/Far East trades 241 Shippersvoice (2008): Maersk fuel surcharge calculator gets early approval 242 Maersk Line customer material

81
Figure 15 – Maersk BAF formula243
Bunker price change = The change in bunker cost, up or down. The price change is the new average price during the measurement period of three months minus a bunker base element. The base bunker element cost is included in the base ocean freight rate. The bunker price used is a weight of the bunker price in relevant ports for the specific trade. Bunker consumption = The amount of metric tons of bunker fuel needed to transport a 20' container each day of the transit. Maersk has divides the world into 14 different geographical clusters and the bunker consumption is calculated as the total amount of tons consumed on all the routes between those two clusters divided by the capacity utilized in TEU*days on the ships on these routes. For a 40' container the bunker consumption is multiplied by a factor two. Transit time = The average number of days of a round trip voyage, divided by two, equals the one way transit time. Imbalance factor = Is the ratio of headhaul to backhaul. This measures the inequality between imports and exports in each trade. For backhaul the factor is less than 1 and therefore gives a lower BAF. The sum of the headhaul and backhaul imbalance factors between two clusters always equals 2. All these parameters are presented for each specific trade lane. The BAF levels are valid for three months and the announcement period for the new levels are one months.
5.4.7.2 APL244
APL has made a formula that is not applied to all their costumers but only to some of the larger ones, Tetra Laval included. Their formula consists of intervals between the percentage change between bunker charge at the time of the offer in USD/ton and the average charge for the calculation period of either one or three months depending on if the new levels are supposed to be valid for one or three months. The calculation document is based on Microsoft Excel and can be seen in figure 16. By inserting numbers in the yellow cells a % Change and Adjustment will be calculated according to the table with intervals. The model is in other words not trade lane specific. How APL’s makes their calculations are not shown.
243 www.maerskline.com/baf, 2008-10-27 244 APL customer material

82
IFO 380 Charge at time of offer (USD/Tonne) Month 1
IFO 380 Averaged Charge (USD/Tonne) Month 2
% Change Month 3
Adjustment Average
% Change Between Adjustment
0% 9% $0
10% 19% $30
20% 29% $60
30% 39% $90
40% 49% $120
50% 59% $150 60% 69% $180
70% 79% $210
80% 89% $240
90% 99% $270 Figure 16 – APL’s BAF model with calculation for a three months period
5.4.7.3 MOL245
MOL has given a formula that states:
MOL BAF = (Current Bunker Price – Base Bunker Level) x Trade Sensitivity
Current Bunker Price = This is the weighted average of the marine bunker prices as publicly available among benchmark bunker ports selected as per the actual bunkering pattern in each trade lane. MOL takes it from Platt’s 246 based on IFO 380. The measurement period for captioned trades is monthly, and the BAF in “n” month will be based on the average from the 26th day in “n-3” month to the 25th day in “n-2” month. Base Bunker Level = This is the bunker price that has been embedded in the Base ocean freight. Trade Sensitivity = This is the average bunker consumption per laden container. The calculation is made from the parameters, including service speed, vessel voyage days, vessel capacity, space utilization level, bunker consumption rate and in some cases trade imbalance. From this formula, the BAF is updated monthly with the prior notice on the 1st day in “n-1” month basically.
245 MOL customer material 246 Internet site with bunker price quotes

83
5.4.7.4 UASC247
UASC has given a formula that states:
BAF = Bunker Price Change x Trade Related Factor
But besides this very little information Bunker price change = The increase or decrease of bunker cost compared with the benchmark level. Trade related factor = Determined by the actual bunker consumption, transit time and utilization level of each trade. UASC will apply an element to reflect the imbalance only if they experience changes in current container flows.
5.4.7.5 OOCL248
OOCL has made a formula that takes into consideration their specific costs and operational requirements. It is based on trade, trade lane and service loop and also considers vessel size and round voyage capacity. OOCL has made a policy decision not to disclose the actual values for each component in the formula since they feel the formula contains commercially sensitive operational data which they have no intention of sharing with the market. The formula is in general terms however. BAF = Total Fuel Consumption x (Current Bunker Price/ton – Base Bunker Price/ton) /
/Projected cargo loaded onboard
The BAF level is updated every month if the bunker price has moved beyond the agreed band of 25 USD (either up or down). They use Platt’s as third party provider of bunker price information and look at a variation of different fuel grades for all the major locations around the world
5.4.7.6 Other shippers’ BAF formulas
From the interviews that have been conducted it has also become evident that a few companies that are in somewhat the same position as Tetra Laval i.e. larger Swedish company with a substantial container flow, already have their own BAF calculators that they have been able to negotiate into agreements with their carriers. The researchers have contacted these companies and were in two cases (A and B) able to get to see some parts of their models without the sensitive data and also had shorter discussions with one of them about their line of thought when creating their calculation model. Company A has a model that is similar to the one APL has presented with ten percent intervals that equals to a specific amount in USD. The difference is that for changes 247 UASC customer material 248 OOCL customer material

84
under 10 % there is no update of BAF. Company A has quarterly updates and uses a three month calculation period where they look at the price of IFO 380 bunker at the Rotterdam exchange. These figures they get from Platt’s. Company B has a formula more similar to Maersk’s where they calculate the bunker consumption in ton/TEU for different trade lanes but instead of multiplying it with the Bunker Price Change they multiply it with the average price of the calculation period giving the total bunker cost instead of the price change i.e. their BAF includes the entire bunker cost. When calculating the ton/TEU factor they take into consideration; average vessel size, vessel speed, consumption per day in tons, transit time and utilization.
Trends
Most BAF models are built up in the following way: BAF = Bunker Price Change x Trade Specific Factor
The trade specific factor includes parameters as bunker consumption, transit time etc. When examining the information and BAF formulas given by carriers for Tetra Laval and benchmark companies it is hard to make any relevant statistics since they vary so much in which information they give. A few trends can however be seen for some parameters.
• The two main sites used as data source for bunker prices are Platt’s and Bunkerworld and they are about evenly common.
• The type of bunker used is mostly IFO 380 or in some cases a mixture of different marine bunker fuels where IFO 380 is the main grade.
• For places used as bunker stations three different approach are used. The first is to use relevant ports for specific trade lane. The second to use only one port and in this case Rotterdam is the most common. The third approach is to use a basket of world ports applied to all trade lanes.
• For a De Minimis Rule there are also three different approaches. Not having any limit at all, using an amount in USD or the most common to use a percentage. These are often between ± 5 to 15 %.
• The generally used announcement period for new updates is one month while some uses only seven working days.
• The relationship between BAF for 20’ and 40’ containers is almost always a factor 2.
• Carriers present a number of different BAF levels for different trade lanes which they build up from clusters. There is a variety in how many clusters different carriers use depending on how their specific routes look like. Not all carriers work worldwide.
5.4.8 Carriers’ view on BAF models249
From the interviews the researchers were able to collect some views on BAF and surcharges in general. Important to note is as stated in the methodology chapter that it is agencies that were interviewed, not personnel with any key responsibility for surcharges within respective carrier company.
249 The Carriers
85
BAF is a surcharge as any other that only is supposed to cover the carrier’s actual costs and not generate profit. The BAF should in other words be the same for all costumers. The fact that larger costumers can get lower price per container should be reflected in the sea freight price and not in the surcharges. When trying to construct a BAF formula it is important to take in consideration that the bunker consumption varies a lot between different types of ships, mainly depending on the vessel size and type of engine which is related to the age. Some carriers also brought up the risk of change in bunker type used to a finer and more expensive one because of environmental issues. All did however agree that consumption should be calculated as the total of a roundtrip i.e. both headhaul and backhaul. This because the BAF otherwise would be to high backhaul since the utilization is much lower in that direction. Whether or not an imbalance factor should affect the BAF was looked upon differently by the carriers. Some thought that it should be included since it made it possible to compensate shippers with goods flow backhaul further while other thought that imbalances should be calculated and compensated in the ocean freight rate.
5.5 Currency adjustment factor
5.5.1 Currency market
The foreign exchange market or currency market exists wherever one currency is traded for another. It is the largest and most liquid financial market in the world, and includes trading between large banks, central banks, currency speculators, multinational corporations, governments, and other financial markets and institutions. The average daily trade in the global currency market and related markets is continuously growing and was last reported to be over 4 trillion USD in April 2007 by the Bank for International Settlement.250 Because carriers have costs in different currencies that fluctuate against the currencies in which they have their income, they feel the need to charge a CAF. Before the 18th October 2008 the CAF surcharge has been set by the liner conferences just as the BAF but since the abolition of European liner conferences carriers now have to set their own CAF surcharge levels as well.251 The CAF surcharge should reflect the weighted average variation of the currencies that the carriers’ costs occur in relative to the USD that most carriers have their income in. When the currencies that the carriers’ costs occur in gains in value relative to the USD the CAF surcharge increases and carriers get compensation for the USD decline.252
250 www.bis.org – 2008-10-08 251 The Carriers 252 Ibid

86
5.5.2 Existing CAF models
5.5.2.1 Maersk Line CAF formula253
In an attempt to be fair and transparent towards shippers Maersk Line has created their own CAF formula. The general idea of the updated formula is that it will be the same for all trades that apply this charge, the underlying data is sourced from external parties (Financial Times and Reuters) and it will rise and fall in line with currency developments. It is in its new look implemented on some specific trades on October 1st 2008 and after evaluation the rest of the world will follow if clearance. The formula is stated as follows;
Currency variation X basket of currencies = monthly CAF
Currency variation of each currency is compared against a “base line” which has been fixed for each trade based on its individual requirements. The variation calculation is based on the change of each currency included in the basket of currencies, up or down, on a monthly basis and in relation to the USD. Basket of currencies is made up of currencies in which Maersk Line incurs costs to run a given trade. A percentage weighting has been given to these currencies to reflect their relative share of the total costs of providing a service. There is one specific CAF surcharge for each trade to ensure a fair application of CAF and different currency basket for each of the trades. The CAF surcharge for one specific month will be the average currency levels for the month taken twice a week at Wednesdays and Fridays. The announcement period is one month so all parties will know in advance the CAF level that will be applicable. CAF surcharge will apply to the following rate elements; Basic ocean freight, Transport (or feeder) Additional, Congestion, War Risk, Dangerous Cargo, Special Equipment, Peak Season Charge and Winter Surcharge. Example of CAF for Asia – Europe, westbound and eastbound, can be seen in table 19. Each currency is weighted relative to its share of the trade specific network costs incurred by Maersk Line. In the right bottom corner the exact CAF surcharge can be seen.
253 Maersk Line customer material

87
Country Currency Rate of exchange as published 30/4 2008
Base line 2/1 2003
Variation Weight % CAF %
UK GBP 0,5073 0,6212 22% 3,9 0,87564
EC EURO 0,6407 0,9529 49% 16,7 8,13757
Sweden SKR 5,9953 8,7133 45% 0,9 0,40802
Denmark DKK 4,7808 7,0784 48% 6,6 3,17189
Norway NOK 5,1237 6,9278 35% 0,3 0,10563
Russia RUB 23,6404 31,95 35% 1,5 0,52725
Japan JPY 103,365 118,67 15% 2,3 0,34056
Turkey TRL 1,2875 1,66 29% 0,7 0,20252
Egypt EGP 5,385 4,63 -14% 0,7 -0,09814
Singapore SGD 1,3611 1,7345 27% 1,8 0,49381
Malaysia MYR 3,1515 3,8 21% 0,5 0,10289
Indonesia IDR 9220 8950 -3% 0,3 -0,00879
Vietnam DONG 16122 15401 -4% 0,3 -0,01342
Thailand THB 31,7 43,1 36% 0,5 0,17981
Hong Kong HKD 7,7914 7,7984 0% 1,8 0,00162
China YUAN 6,985 8,277 18% 6,5 1,20229
Philippines PHP 42,165 53,385 27% 0,1 0,02661
Taiwan TWD 30,4045 34,77 14% 0,5 0,07179
Korea KRW 1001,1 1186,05 18% 0,6 0,11085
USA USD 1,00 1,00 0,00% 53,5 0,00
Total 100 15,8384
Table 19 – Maersk Line CAF surcharge254
The included currencies and its relative weighting are in many ways similar to the FEFC CAF level that has been used by carriers prior to October 18th. This comparison can be seen in table 20. The Maersk Line CAF surcharge for The South Asia & Middle East - Europe trade lane was previous two different conference specific CAF surcharges but Maersk Line decided to put these two together to reduce the complexity of the surcharge tariff.
254 Maersk Line customer material

88
Country Currency FEFC cost weighting
Maersk Line cost weighting
UK GBP 7,92 3,9
EC EURO 18,49 16,7
Sweden SKR 0,91 0,9
Denmark DKK 4,59 6,6
Norway NOK 0,26 0,3
Russia RUB 0,25 1,5
Japan JPY 7,41 2,3
Turkey TRL 0,07 0,7
Egypt EGP 0,55 0,7
Singapore SGD 4,24 1,8
Malaysia MYR 0,77 0,5
Indonesia IDR 0,61 0,3
Vietnam DONG 0,16 0,3
Thailand THB 0,51 0,5
Hong Kong HKD 5,25 1,8
China YUAN 4,16 6,5
Philippines PHP 0,22 0,1
Taiwan TWD 1,85 0,5
Korea KRW 2,75 0,6
USA USD 39,03 53,5
Total 100 100
Table 20 – Cost weighting comparison255
5.5.2.2 MOL256
MOL has a CAF formula that is based on the following logic. The currency weighted costs are the actual costs that incurred last month on the trade lane that the specific CAF surcharge is applicable on, therefore the CAF surcharge will be trade lane specific. The monthly currency exchange rate internally used for its financial operations is used for CAF as well, which is announced by the bank of Tokyo-Mitsubishi UFJ in Tokyo, Japan. The CAF surcharge will be reviewed and updated monthly. CAF surcharge in “n” month will be based on the currency exchange rate in “n-2” month, and will be announced on the 1st day in “n-1” month.
5.5.2.3 UASC257
UASC has announced a CAF surcharge that is the weighted average of the fluctuations of the currencies in a particular trade. The exchange rates will be internally monitored from Reuters’ quoting. It will be reviewed and announced on a monthly basis. The same CAF level is applicable for both westbound and eastbound shipments.
255 Maersk Line customer material 256 MOL customer material 257 UASC customer material

89
5.5.3 Carriers’ view on CAF models258
There is a common view on the CAF surcharge that seems to be reflected among most of the market actors both shippers and carriers. The CAF surcharge should reflect the weighted average variation of the currencies that the carriers’ costs occur in relative to the USD, that most carriers have their income in. When the currencies that the carriers’ costs occur in gains in value relative to the USD the CAF surcharge increases and the carriers get compensation for the USD decline. For some carriers it is trade lane specific with a high geographical uniqueness and for some it is the same figure for large geographical areas. The common view about the cost weighting (currency baskets) is that it is sensitive business information that should not be shared but some carriers have a more transparent way of business and believes that the cost weighting can be shared if it is done in a careful way.
5.6 THC
The THC surcharge is considered to be fixed on an annual basis. It has been fixed in most conference agreements historically and the market prediction is that it will be fixed annually without exception in the future. The surcharge is supposed to cover the container handling costs at port inland arrival and departure and at shipment handling. There is some variation in if THC should cover overall port costs or only handling costs and historically this opinion has varied from carrier to carrier. The THC has previous been conference unique and therefore sometimes been at different levels in the same port. Another observation is that it has been at the exact same level in many ports for several years, in some cases back to the 1980’s. The intention after the European conference abolition is that the THC should be at a specific level for a strict geographical area and all carriers have to set their own THC level.259 Maersk Line THC’s – European scope The new THC approach is implemented in Europe during autumn of 2008 and rest of the world will follow during 2009. Maersk Line THC is supposed to reflect actual cost related to terminal handling. This new approach is for an implementation period intended only for the European market. The elements are handling at gate, in yard and into/off vessel, administration and operational contingency and local practice as tax and duty and union and royalty expenses. THC levels will be reviewed and updated annually. Review will take place in 3rd quarter and new THCs will be implemented in 4th quarter. The review period can be adjusted to fit customer’s specific contract duration. THCs will be set for dry and reefer cargo, specific per country of port, same levels for all trades, valid for both import and export cargo and same for TEU and FFE.260
258 The Carriers 259 Ibid 260 Maersk Line customer material

90
5.7 Summary
The container shipping industry has grown steadily for many years and today the market consists of a few market leading companies and many medium sized ones. The industry is and has been subject to shipping conferences which refers to a group of shipping companies that forms an association to agree on freight rates at different shipping routes. The European Council has with start on October 18th 2008 banned shipping conferences on trade to and from Europe and many people with knowledge of the industry believes this deregulation will follow in other parts of the world. Tetra Laval has for their sea freight goods flow divided the world into different clusters and the shipments between these are called trade lanes. A large amount of the shipped goods are from Europe to other part of the world which often is backhaul direction. After forecasting the volumes that needs to be shipped the coming year a RFQ is sent out to carriers. When they filled in their offers the proposals are evaluated and then in November each year negotiations are held with carriers and from this they get nominations on different trade lanes. All contracts are for one year, February to February. There is a variety of ways in which carriers make their offers. Some lean more towards all in rates while others specifies their fees and surcharges and they also want different surcharges to vary during the contract period. This makes offers hard to compare and the need for own surcharge models for shippers becomes evident. Carriers charge BAF because of the volatile bunker price and CAF because of currency fluctuations. The bunker fuel price is highly correlated to the oil price. There are many different grades of bunker but the most common grade used is IFO 380 which is a relatively low quality and low price bunker. In order to meet rising fuel costs carriers need to keep tighter control of their bunker consumption. This is done among other ways by changing their service design in terms of vessel speed and size and adding more vessels to a trade lane service loop. Just a couple of knots decrease in speed has drastic effect on the bunker consumption. A lot of carriers have started using slow steaming to reduce their speeds and adding an extra vessel to their service routes. In order to meet future volume increases and get cost savings by economies of scale carriers order larger and larger vessels and the average size becomes increasingly larger. Different sized vessels are used on different trade lanes. The trade lanes that have the largest goods flow and are the longest deploys the largest ships. It is hard to get figures of the actual utilization on ships. Most documentation and previous studies however indicates that an average level of 80 % can be estimated. The ships reach the max capacity in weight way before it reaches its max capacity in volume. Some of the transit time is the time the ships spend in ports. This time differs depending on the number of port calls but every port call can be estimated to take one day. The time is also connected to the problem with congestion in ports and the congestion surcharge carriers charge.

91
There has been a good relation between conference BAF and bunker prices but it has been shown that for some trade lanes the BAF level has been higher than the cost recovery to some degree. After October 2008 carriers need to present their own BAF and CAF and therefore some carriers have constructed and presented their own models. Even if they often have a similar approach and there are clear trends they use different parameters to some extent and also vary in transparency. There are also companies in similar situation as Tetra Laval that already have implemented their own models on the market. When constructing own models it is important to consider that parameters can vary a lot between carriers. Most BAF models are built up in the following way:
BAF = Bunker Price Change x Trade Specific Factor
Where the trade specific factor includes parameters as bunker consumption, transit time etc. CAF models are made up of currency baskets with a number of differently weighted currencies where USD is the main currency. THC has been fixed in most conference agreements historically and the market prediction is that it will be fixed annually without exception in the future.

92
6 Analysis The analysis chapter is introduced with a look at cost structure, pricing & surcharges for
Tetra Laval and the carriers, followed by the major parts of the analysis concerning
Bunker Adjustment Factor (BAF) and Currency Adjustment Factor (CAF). Here the
update models for BAF and CAF will be stated and thoroughly explained. After a brief
analysis of the Terminal Handling Cost (THC), the result and evaluation of the BAF
model implementation is presented.
6.1 Cost structure, pricing & surcharges
The grand total cost for all nominated sea freight volumes was 2008 about x million USD (only indicative and roughly presented figure). The fact that about 90% of payments of sea freight is made in USD implies that the BAF change should also be in USD. Another important factor for this is that bunker fuel are always quoted and paid in USD. This also implies that the CAF should be in relation to the USD and not in relation to the EURO. When calculating how the BAF and CAF surcharge has varied over the quarters for resent years some exclusion has been made. All lesser to the amount currencies were excluded so only nominations paid in EURO and USD was considered. As seen in table 10 in the empirical study, these two currencies stand for almost all payments. Then the trade lanes that have BAF included in the ocean freight cost were excluded. In this case the basic ocean freight cost varies over the quarters. This was done because there is no possibility to get enough information from the nomination document on which specific surcharges that has varied from one quarter to another, so therefore this exclusion had to be done. This exclusion stands for about 27 % of total volumes. There is a very small amount, less than one percentage of total volume that has a percentage surcharge that includes both BAF and CAF and the fraction between them cannot be seen. Because of the uncertainty of these nominations they had to be excluded. The nominations that remain as basic data for the calculations in table 21 stands for 72 % of total sea freight volumes.
Grand total (USD) CAF cost (USD) CAF in % BAF cost (USD) BAF in %
Q1 2008 x x 3,41% x 32,49%
Q2 2008 x x 3,33% x 31,98%
Q3 2008 x x 3,63% x 35,69%
Q4 2008 x x 3,43% x 38,89% Table 21 – Total cost and the fraction of BAF and CAF cost for a selection of nominated volume in 2008
The contribution of BAF and CAF change to Grand total cost development can be seen in table 22. The absolute major part (64,42 %) of cost variation during 2008 is referred to the BAF change. CAF change contributed only with 3,51 %. Other variable costs along one contract year are excluded from the analysis in the report because they as individuals stands for small variations, but may be such as war risk and congestion surcharges and also small variations in goods volume development in deviation from forecasted figures. It may also be variable costs that are not associated with the ocean freight such as

93
forwarding fee. These costs contributed to the remaining part of about 32 % of cost variation during 2008.
2008 Grand Total
cost development
BAF change of Grand Total development
CAF change of Grand Total development
Q1 to Q2 2,30% 9,89% -0,30%
Q2 to Q3 13,96% 62,23% 5,81%
Q3 to Q4 7,27% 82,90% 0,66%
Q1 to Q4 25,05% 64,42% 3,51%
Table 22 – The total cost development and BAF & CAF change fractions
The increase in BAF cost is nothing that should be considered because the distribution of total bunker costs between ocean freight price and BAF is unknown and different from carrier to carrier. The CAF cost increase was 25,8 % for 2008 for the selected volumes in table 21 gives a hint of how CAF costs varies over the year because the CAF surcharge is in all cases applicable on the ocean freight cost, although this figure is only indicative and cannot be considered as the exchange rate variation.
6.2 Bunker Adjustment Factor
To make the line of thought in the following sections easier for the reader to understand the complete BAF model is hereby stated and briefly explained. A more thorough explanation of the model is made in the end of the BAF analysis.
BAF change = Bunker fuel consumed (MT/TEU) x Bunker Price Change (USD)
Bunker fuel consumed (MT/TEU) = Bunker Consumption * Average Transit Time * (1 – Time in Port) / (Average Vessel Capacity * Utilization) When starting to put together a BAF model for Tetra Laval different parameters that would affect the outcome were discussed. The following sections discuss these parameters separately and explain why sometimes theoretically correct values have been used and sometimes more subjective data specific for Tetra Laval. The parameters were not necessarily discussed in the order that they are presented in this chapter. Since they are all depending on each other, deciding one sometimes meant that another that had been decided upon before had to be changed in order to get the final result as good as possible. The main goal when deciding on the different parameter was that the model should be as fair and accurate as possible so that neither Tetra Laval nor the carriers would lose or gain from the model. Carriers should only get paid for actual costs in a fair way. If that goal is obtained the probability of the carriers accepting the model into the contracts would most likely be greater. With a clear model and set of rules carriers will be able to adjust the ocean freight rates in a competitive way and it would be easier for Tetra Laval to compare the different offers before signing a contract since the BAF would change the
94
same along the year independent of which carrier Tetra Laval choose. Since the model adjusts both up and down the model can be considered as risk-sharing. The previous studies that have been made about the correlation between BAF and bunker prices show that they have been somewhat correlated. This suggests that shippers have not been exposed to large overprices in the past even though some studies shows this fact. But because of the lack of transparency no one can be absolutely sure. The model is not constructed to save money or to pressure the carriers. The reason is rather to obtain own control of the costs and not having to be surprised when carriers come with their updates. This ease the work of forecasting the own costs and as stated before, by implementing a general model for all the carriers it is also easier to evaluate the different offers at the negotiations in November. Before, there was a risk that Tetra Laval signed a contract that in November had the lowest total cost but during the year had higher increases of their surcharges then other carriers, which would result in Tetra Laval’s annual cost for that trade would be higher with that carriers then it would have been if they for instance had signed a contract with the carrier with the next lowest bid. By using the same model for all carriers BAF updates will be the same whichever carrier that are nominated for a trade and as a result eliminating this problem.
6.2.1 Cluster dividing
Some formulas that were reviewed during the data gathering were not trade lane specific. It was considered very hard for Tetra Laval to use this approach because of the relatively complex situation with goods flow all over the world with a large variety of different trade lengths even though some major trade lanes stands for a large part of the total volumes. There was also a discussion about if average bunker consumption per TEU per day for the entire world should be used and then only having the number of transit days varying between different trade lanes. Nor this approach was considered possible because of the vessel fleets and therefore also the consumption per TEU per day between different trade lanes and carriers varies too much. The fact that there are models already used in the market that uses these approaches could be explained by those companies having a less complex goods flow which is easier to generalise about. So for Tetra Laval to be able to get approval from all carriers, trade lane specific BAF changes were decided upon were several parameters are specific for each trade lane. The question was then how many clusters that the world should be divided into. As explained in the empirical study Tetra Laval’s goods flow, Tetra Laval has already divided the world into different clusters for their sea freight. To be more exact there are 12 different clusters distributed as shown in figure 17. These cluster regions are already specified in the origin area and destination area columns in the nomination file that is used. To make the internal work with updates easier it was decided that it was the trade between these areas that should be the foundation of the model. Using 12 clusters results in there being 78 different trade lanes and of these 56 will have Tetra Laval’s goods shipped between or within them in 2009. For a list of all trade lanes see appendix B.

95
Figure 17 – Tetra Laval’s different sea freight clusters
6.2.2 Imbalance Factor
A few of the already existing BAF models that were reviewed included an imbalance factor. This factor is multiplied with the BAF figure and is between zero and one if the trade lane is considered as backhaul and between one and two if the trade lane is considered to be headhaul. The sum of the imbalance factors for headhaul and backhaul for one trade lane should always be two implying that the total BAF for both trade lane directions is not affected by the imbalance factors. By doing so a difference of BAF change for headhaul and backhaul is created and the question that arises is of course if this is a good way to handle BAF surcharge. The first consequence of having an imbalance factor would be that the amount of different BAF changes would almost double (since not all trade lanes are unbalanced and cluster internal flows have no direction the amount would not completely double). The main reason for including an imbalance factor is for compensating shippers with goods flow in backhaul direction and if the model is not going to include an imbalance factor this compensation has to be done in another way. Tetra Laval’s view on this is that the compensation for backhaul should be in the ocean freight price. By having a clear set of rules that all the carriers are aware of and have accepted even those carriers that want to use an imbalance factor can adapt to Tetra Laval’s set of rules and adjust their ocean freight rates as they see fit. This decision also results in that other parameters such as utilization that is different for backhaul and headhaul have to be calculated as average of the total roundtrip.

96
6.2.3 Update of trade lane specific parameters
To make the model as simple as possible there should be as few parameters as possible that vary during the contract period. Since there is very little changes in trade specific parameters such as vessel sizes, fuel types, transit time etc. these should be fixed for the entire contract period. The only part that is supposed to vary in the model is the bunker price. The trade lane specific parameters will be reviewed annually when a new contract is to be signed. Not saying that they will be changed every year but that they will be reviewed and considered.
6.2.4 Fuel type
There were three different fuel type alternatives that were considered possible using as price reference; a mixture of different marine fuels, only the most common type IFO 380 or a mixture of IFO 380 and Low Sulphur Fuel Oil (LSFO). When analysing the gathered data for this parameter it was not very clear which alternative that would be the most fair or accurate. What was clear was however that IFO 380 was the most common grade and if a mixture would be used this grade would have the far biggest fraction. The fact that marine diesel oil (MDO) is used while at port was considered negligible since the fuel consumption here is so little in relation to the one while at sea. Another approach when analysing the problem is what would be the easiest to monitor and the most simple to understand. Using this approach it would of course be easiest to monitor only one type of fuel. Looking at the models that already exists this is the case. It was therefore decided to use IFO 380 as the bunker fuel type for price reference.
6.2.5 Data source for prices
The two main internet sites that are used for monitoring bunker prices, Platt’s and Bunkerworld, seem to be just as common to use. The prices on the sites does not differ significantly either and therefore this choice is of less importance. Since Bunkerworld has some ports for which they do not charge any fee for bunker price access, this was considered the most public one and therefore the most suitable to use.
6.2.6 Bunker stations
The discussion was mainly whether only one port was to be used for bunker price quotation or if a worldwide average should be used. The idea of having trade lane specific bunker stations with for the trade lane relevant ports was considered too complex to administrate. There is also little difference in USD between bunker prices at different ports which makes this choice less important since it therefore will not have that large impact on the final result. Table 23 shows the standard deviation between monthly average prices at four ports. It also shows the standard deviation for the change between different months at these ports and that proves to be even smaller in USD. From this fact the conclusion that the bunker fuel is more expensive in some ports then in other can be drawn, but when looking at the price changes over time this does not really matter. Since Bunkerworld quote prices free of charge for some major ports these were considered the most suitable to use. The world average therefore consists of four ports; Singapore City, Singapore; Huston, US; Fujairah, United Arab Emirates and Rotterdam,

97
Netherlands. By using four ports the risk that the prices in one port for some reason differ very much due to extreme situations in supply and demand variations gets more insignificant. The increased workload for monitoring four ports instead of one was not considered very extensive. A world average was also compared to an average of ports that was more suitable for Tetra Laval’s specific flow but since the differences between port’s prices is that modest and that for using Tetra Laval specific ports would result in having to have membership to Bunkerworld to see the price notations this was not considered a better solution. IFO380 (USD/MT) Rotterdam Houston Singapore Fujairah Avg. STDEV (USD)
Monthly avg. Nov 221,00 237,50 239,50 243,50 235,38 9,9
Oct 384,00 404,50 409,00 413,00 402,63 12,9
Sep 549,50 582,00 614,00 602,50 587,00 28,3
Aug 622,50 658,00 673,00 691,00 661,13 29,1
Jul 680,50 716,50 720,50 720,50 709,50 19,4
Jun 597,50 625,50 629,50 631,50 621,00 15,9
May 543,00 566,00 582,00 586,00 569,25 19,5
Apr 495,00 500,00 522,00 528,00 511,25 16,2
Mar 471,00 480,00 493,00 501,00 486,25 13,4
Change between months
Oct - Nov -163,00 -167,00 -169,50 -169,50 -167,25 3,1
Sep - Oct -165,50 -177,50 -205,00 -189,50 -184,38 16,9
Aug - Sep -73,00 -76,00 -59,00 -88,50 -74,13 12,1
Jul - Aug -58,00 -58,50 -47,50 -29,50 -48,38 13,6
Jun - Jul 83,00 91,00 91,00 89,00 88,50 3,8
May - Jun 54,50 59,50 47,50 45,50 51,75 6,4
Apr - May 48,00 66,00 60,00 58,00 58,00 7,5
Mar - Apr 24,00 20,00 29,00 27,00 25,00 3,9
Table 23 – Monthly average prices and price changes at different ports261
6.2.7 Vessel Size
From the empirical data that was collected the average vessel sizes used on some of the trade lanes for Tetra Laval was given but not for all. It was therefore necessary to compare different trade lanes with one another. This was done by looking at the total global trade volumes for different regions, the length of the trade lanes, which service route they were included on and the need for feeder vessel traffic. When considering the overall goods flow it was said that the larger goods flow the larger the ship. The same applied when it came to lengths. All trade lanes were divided into three groups; short, medium and long distance and the longer the trade lane the larger the ship. By doing this and taking help of the service route information collected from carriers, it was possible to equate trade lanes where no data of average vessels sizes could be found with those where it could. The question was then whether or not the exact averages should be used or if generalisations and adaption to Tetra Laval’s good flow should be made. To make the 261 Bunkerworld.com

98
model and work with updating simpler it was decided that only six different sizes should be used in the model; 2 000, 3 000, 4 000, 5 000, 6 000 and 8 000 TEU per vessel. Every trade lane was analysed and discussed separately and then placed in the most suitable group. The reason that they were not only placed according to the average vessel sizes was that Tetra Laval mostly relies on the major carriers which are those who have the largest vessels on the market which is shown by the benchmark figures in table 17. When discussing each trade lane the average vessel size was however the main base but was often rounded up to fit in one of the mentioned groups. The fact that larger vessels are deployed continuously and the average vessel size increase also contributed to the decision to round up. All decided vessel sizes can be seen in appendix B.
6.2.8 Vessel Speed
The consumption of bunker for a ship is highly dependent on the speed in which it travels as shown by figure 14 in the empirical study. With the increase in use of slow steaming this becomes a problem since data of average vessel speeds gets rapidly outdated. But since the average speeds was the only quantitative data available this had to be used. The figures from Lloyd’s register are also relatively new (October 2008) and should include some of the trend with slow steaming. The average speeds from Lloyd’s register were given in intervals and because the vessel sizes that were decided upon is in the middle of these intervals the speeds had to be extrapolated262. The results can be seen in table 24.
Vessel Size TEU Knots
2000 21
3000 22
4000 23
5000 24
6000 25
8000 25 Table 24 – Average Vessel speeds
There was no way to obtain valid data of the speeds for specific Tetra Laval goods flow. The interviewed persons were not enough involved in that line of questioning and therefore could not provide a proper answer.
6.2.9 Bunker Consumption
For all the data that was gathered the bunker consumption was directly related to the size and speed of the ship. The concern that some of the persons interviewed expressed regarding the different consumption concerning the age and type of engine of the ship could not be considered since any specific data for this could not be obtained. The data obtained however had already taken the age and type of engine into consideration when calculation the average consumption. Given that the world fleet becomes newer the consumption at a certain speed should decrease over time even if only to some small extent.
262 The process of constructing new data points outside a discrete set of known data points

99
Since the vessel sizes and speed already has been set it was only to extract the consumption from figure 14. No consideration has been taken to whether a ship of a specific size normally is used at different speeds at different trade lanes. It has been generalised that for example all 3 000 TEU ships use the same speed whichever trade lane it is deployed on. The consumption per day at sea per vessel size at the given speed can be seen in table 25.
Vessel Size TEU Knots
Daily Consumption
2000 21 67
3000 22 91
4000 23 126
5000 24 174
6000 25 214
8000 25 248 Table 25 – Average Vessel bunker consumption
When consumptions were decided for each trade lane these were compared to the consumptions used by Maersk Line in their formula and showed to be similar. Their dividing of the world into clusters is not exactly the same as the one for Tetra Laval but they are equal enough to be comparable. This implies that vessel sizes and speeds that were decided upon for the model are valid in practice as well.
6.2.10 Ratio between TEU and FFE
Looking at the empirical data collected for this parameter it is evident that the general industry standard is to use the factor 2 when assessing the consumption for a FFE from a calculation of consumed bunker fuel per TEU. However since the bunker consumption is more dependent on the deadweight then the volume of the container, this figure was questioned whether it was accurate or not. The capacity especially on newer ships is limited by the deadweight rather than the volume of containers. The carriers therefore need some low density goods to be able to get high utilization on their ships. 40’ containers maximum gross weight is lower than 20’ containers per volume unit as shown in table 2. In fact the maximum weight for a 20’ container is almost the same as the one for a 40’ container according to some carriers. Tetra Laval’s standpoint is therefore that they should not result in twice as much BAF change for 40’ containers when those containers are wanted and needed by the carriers and that does not make the ship consume twice as much bunker as a 20’ container. After analysing the structure and weight of Tetra Laval’s goods the factor between TEU and FFE was therefore set to 1,5. Important to remember is that this figure only affects the bunker change in the formula and if carriers want to charge twice as much in bunker costs for 40’ as for 20’containers in their offers, Tetra Laval cannot do anything about that. The figure only shows what Tetra Laval believes is a fair amount to pay in BAF change for a 40’ container.

100
The consequence this has on the model is that the MT/TEU for 40’ containers becomes lower than it otherwise would have been but since the model works in both ways it is not true to say that the carriers get paid to little. If the bunker price drops the decrease in what Tetra Laval pays will be smaller than it would have been with the factor 2. Once again it is important to remember that the model is risk- sharing.
6.2.11 Transit time
The first choice that had to be made for this parameter was whether an industry average or an average of Tetra Laval specific transit time should be used. To try to make the final model as fair as possible specific transit times for Tetra Laval were decided upon. The problem then was which time period of goods flow that would be used as base for the calculations. Using nominations for 2008 would result in average transit times that were outdated, and without the effect of slow steaming etc. these figures would probably be too low. Using the 2009 figures was not possible either since these would not be decided upon until after the negotiations in November 2008 when the model was implemented and the figures therefore had to be set. It was therefore decided that average transit time calculations should be made on the offers that had past the first evaluation done by Team Sea and representatives from Geodis Wilson, and were still valid for the negotiations. These figures of course contained several offers for some trade lanes that after the negotiations would not be nominated. The transit times are therefore not the actual average of what the transit times will be for 2009 but an average of the offers that were valid up to the final negotiation. When the calculation base was decided, average transit times for each cluster to cluster trade lane was calculated. There was made no distinction in which direction the ship travelled since it already had been decided that the trade should be considered as total roundtrips. The calculations were made with consideration to the number of containers that the different relations between the clusters contained. More exactly what was done was that the number of forecasted containers was multiplied with the quoted number of transit days for each relation. These were then summed up and divided by the total number of containers. The calculations cannot be displayed because of the large space they occupy but the results of number of transit days can be seen in appendix B. The fact that each trade lane is occupied by many different carriers that have different transit time both compared with other carriers and compared with own service routes on the trade lane, gives a standard deviation in Tetra Laval’s transit time for each trade lane. For all trade lanes accumulated the average transit time for 2009 are 24,4 days and the standard deviation of 5,6 days or 23 %. This is not a negligible standard deviation, but when looking at the option with having a number of different transit times on every trade lane that would not be manageable. There is also the fact that some existing and already implemented models on the market does not take transit time into consideration at all, it was considered that an average transit time with a standard deviation of 23 % could be used because it will nevertheless improve the accuracy of the model.
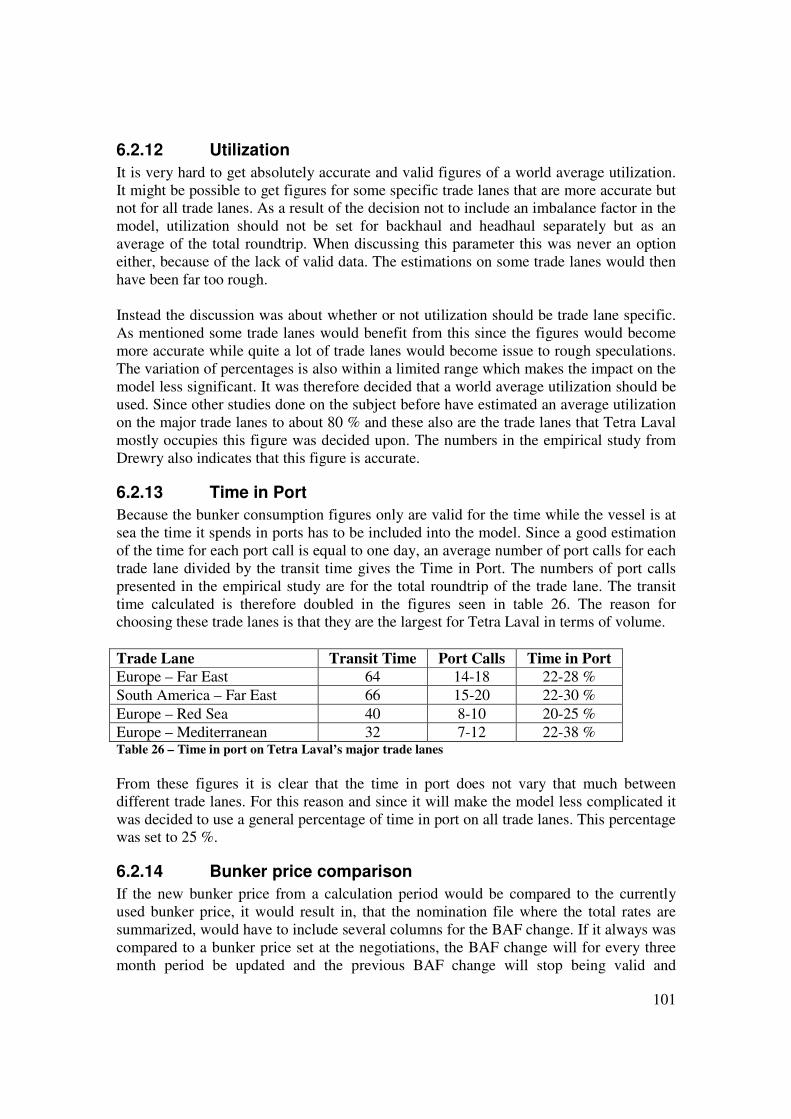
101
6.2.12 Utilization
It is very hard to get absolutely accurate and valid figures of a world average utilization. It might be possible to get figures for some specific trade lanes that are more accurate but not for all trade lanes. As a result of the decision not to include an imbalance factor in the model, utilization should not be set for backhaul and headhaul separately but as an average of the total roundtrip. When discussing this parameter this was never an option either, because of the lack of valid data. The estimations on some trade lanes would then have been far too rough. Instead the discussion was about whether or not utilization should be trade lane specific. As mentioned some trade lanes would benefit from this since the figures would become more accurate while quite a lot of trade lanes would become issue to rough speculations. The variation of percentages is also within a limited range which makes the impact on the model less significant. It was therefore decided that a world average utilization should be used. Since other studies done on the subject before have estimated an average utilization on the major trade lanes to about 80 % and these also are the trade lanes that Tetra Laval mostly occupies this figure was decided upon. The numbers in the empirical study from Drewry also indicates that this figure is accurate.
6.2.13 Time in Port
Because the bunker consumption figures only are valid for the time while the vessel is at sea the time it spends in ports has to be included into the model. Since a good estimation of the time for each port call is equal to one day, an average number of port calls for each trade lane divided by the transit time gives the Time in Port. The numbers of port calls presented in the empirical study are for the total roundtrip of the trade lane. The transit time calculated is therefore doubled in the figures seen in table 26. The reason for choosing these trade lanes is that they are the largest for Tetra Laval in terms of volume. Trade Lane Transit Time Port Calls Time in Port Europe – Far East 64 14-18 22-28 % South America – Far East 66 15-20 22-30 % Europe – Red Sea 40 8-10 20-25 % Europe – Mediterranean 32 7-12 22-38 % Table 26 – Time in port on Tetra Laval’s major trade lanes
From these figures it is clear that the time in port does not vary that much between different trade lanes. For this reason and since it will make the model less complicated it was decided to use a general percentage of time in port on all trade lanes. This percentage was set to 25 %.
6.2.14 Bunker price comparison
If the new bunker price from a calculation period would be compared to the currently used bunker price, it would result in, that the nomination file where the total rates are summarized, would have to include several columns for the BAF change. If it always was compared to a bunker price set at the negotiations, the BAF change will for every three month period be updated and the previous BAF change will stop being valid and

102
exchanged against the new BAF change. In this way the BAF change can be represented in one column in the nomination file. The later of these alternatives is the one that was decided upon and the bunker price set before the contract start is called the tender bunker price in the model.
6.2.15 De Minimis rule
A De Minimis rule refers to a trigger level in bunker price development up or down, either in percentage of fixed amount that decides if a BAF change update is made or if previous valid level will be valid until next time for update. For this parameter one has to weigh the cost and workload of updating and sending out new BAF change levels against the risk of carriers not getting paid for their expenses if the bunker price increases or that Tetra Laval pays more than they should when the bunker price decreases. In discussion with Tetra Laval and Geodis Wilson it was decided that there should be a rule but not what it would be based on or how big it was going to be. First it had to be decided whether it should be based on a percentage or fixed amount in USD of the bunker price change. After a discussion and simulations it was decided that the choice does not have any larger impact. It might be better to use the fixed amount since that does not take into consideration the actual price of the bunker. If a percentage is used it would mean that if the bunker price is very high there might be changes in price that would have great effect in USD but not in percentage that would not be made. Important to remember however is that the model is supposed to be risk-sharing and if the price increase, it would mean that the carriers will not get paid enough for their expenses but in the same way if the price goes down but is still within the De Minimis rule Tetra Laval would pay more than what the carriers actual expenses are. If the bunker price is high it does not mean that any part in the relation is worse off but rather that the risk taking increases for both parts. If the bunker price on the other hand is very low there might be an update of BAF change even if it would not affect the total cost in any larger way. After going through the input from the interviewed carriers and other models it was evident that it was more of an industry standard to use percentage and therefore this approach was chosen. What then had to be decided was what percentage that was going to be used. This was done when the rest of the model was already finished and all the other parameters were set. By testing a few different possible percentages on different levels of bunker prices to see what the outcome would be in USD for when BAF was not changed. An example of levels of the De Minimis rule for the trade lane Europe – Far East can be seen in table 27. The table shows the largest possible amount the bunker price could increase with without there being an update of BAF and what amount this equals in BAF change. The examples are made for De Minimis rules of 10 % and 20 % at bunker prices of 500 USD/MT and 200 USD/MT. It is shown that when the rule is 20 % the BAF change level for when an update first is made is significant high. Therefore the De Minimis rule was set to 10 % which can be considered as relatively low.

103
Trade Lane
Average Vessel
Capacity (TEU)
Bunker Consumption
(tons/day)
Average Transit Time
(days)
ton/TEU
Bunker Price
Change (USD)
BAF Change (USD)
EUR F.E 8000 248 32 0,93 50 46,5 10 % increase at 500 USD/MT
EUR F.E 8000 248 32 0,93 20 18,6 10 % increase at 200 USD/MT
EUR F.E 8000 248 32 0,93 100 93,0 20 % increase at 500 USD/MT
EUR F.E 8000 248 32 0,93 40 37,2 20 % increase at 200 USD/MT
Table 27 – Example of De Minimis rule impact at 10 % and 20 %
6.2.16 Valid Period
Valid period means the period that the BAF change update is valid. At the moment Tetra Laval receives quarterly updates from the carriers. There is no reason to decrease this period to monthly. That would only result in an extensive workload for updating surcharge levels. It was considered to have half year updates, but the main issue with that would be that the levels would lag in time and the carriers would be exposed to a risk of the bunker price increasing rapidly as it did in the summer 2008 and then the carriers would not get paid for that increase until half a year later. In a broader context Tetra Laval puts great value in having long term relationship with its suppliers. Therefore the model should not only be seen on a year to year basis but as something that is continuous over several years and collaborated within. Therefore the intension is that the model will be valid for as many years as possible and only redesigned if a dramatic market change occurs. Since the annual contract with the carriers last from February to February and not the calendar year it was decided that the quarterly updates should shift forward one month in time so that the three month valid period will start with February to April and continuing, this is illustrated together with the calculation period and announcement period in the coming section Complete BAF model.
6.2.17 Calculation period
Calculation period means the period from when the average bunker price is sourced. The first and most important standpoint for this parameter is that since shipments are done all around the year all the calculation periods together should also cover all the months of the year. The calculation period is closely related to the valid period and since the valid period was set to three months, this time period was considered the most suitable for the calculation period as well.
6.2.18 Announcement period
Announcement period is the time between calculation period and valid period. The way that the administration is supposed to work in the coming year when the BAF model has been introduced is that Tetra Laval through Geodis Wilson are going to send out the new BAF change for the coming valid period. This would not be that much of a problem if it was not for the fact that other surcharges such as CAF are updated by the carriers. It is therefore important that Tetra Laval gets the CAF update for the coming period as early as possible to be able to include them in the new rates that are sent out.

104
Since the calculation period is set to include averages of whole months and the start of the valid period is supposed to be at the 1st of a month the announcement period has to be a multiple of whole months. Reasonable would be either zero, one or two months and since zero is not practically possible this is not any choice and two months are considered to be a far too long time since the actual price would then lag too much, the only alternative therefore is one month and since this also is somewhat of a standard for the industry this was considered the best option. In practice one month might not always be absolutely true because of the problem with the CAF update.
6.2.19 Complete BAF model
From the parameters discussed above the following complete model was decided upon and implemented in 2009 years’ contract. The following text section is extracted from parts of the letter that were sent out to all carriers before negotiations 2009, the letter can be seen in Appendix C.
BAF change = Bunker fuel consumed (MT/TEU) x Bunker Price Change (USD)
• MT/TEU is unique for cluster to cluster trade lanes, since it depends on Trade
Lane specific parameters such as bunker consumption and average transit time.
• Bunker fuel consumed (MT/TEU) = Bunker Consumption * Average Transit Time * (1 – Time in Port) / (Average Vessel Capacity * Utilization)
• Average Bunker Price from the calculation period will be compared to the
currently existing bunker price from previous update and if the difference is within ± 10 % there will be no changes in BAF level.
• Average Bunker Price from the calculation period will then be compared to the
annual Tender Bunker Price along the year, and gives the Bunker Price Change.
• Bunker Price Change (USD) = Average Bunker Price for calculation period – Tender Bunker Price
• Bunker Price will be the average of IFO 380 in Houston, Rotterdam, Singapore
and Fujairah with Bunkerworld.com as public source.
• BAF Change for FFE will be 1,5 x BAF Change for TEU. • BAF will be reviewed on a three month period basis as follows

105
Oct Nov Dec Jan Feb Mar Apr May Jun Jul Aug Sep Oct Nov Dec Jan
Period 1
Period 2
Period 3
Period 4
Calculation period
Announcement period
Valid period
• Annual Tender Bunker Price will be set before negotiations with calculation period Jul-Sep, announcement period in October and valid Nov-Jan.
• The 1st possible update will be valid Feb-Apr with calculation period Oct-Dec and
one month announcement period in January. Example of BAF changes
• Tender Bunker Price is 550 USD/MT based on calculation period in Jul-Sep, announcement period in October and valid period Nov-Jan.
• If the average bunker price for Oct-Dec is within ± 10 % of Tender Bunker Price
(495 - 605 USD/MT) there will be no adjustment of BAF level on February 1st. • If there are no adjustment of BAF levels for February, calculation period Jan-Mar
will be compared to the Tender Bunker Price of 550 USD/MT and give possible BAF Change valid May-Jul.
• If average bunker price for Oct-Dec exceeds the ± 10 % limits, the change will be
as follows on e.g. Europe – North America. • If average bunker price for Oct-Dec for example is 675 USD/MT the bunker price
change will be 675-550 = 125 USD/MT and gives the BAF Change 74 USD.
Trade Lane
Average Vessel
Capacity (TEU)
Bunker Consumption
(tons/day)
Average Transit Time
(days)
MT/TEU
Bunker Price
Change (USD)
BAF Change (USD)
EUR NAM 5000 174 18 0,59 125 74
• If average bunker price for Oct-Dec is 425 USD/MT the bunker price change will be 425-550 = -125 USD/MT and gives the BAF Change -74 USD.
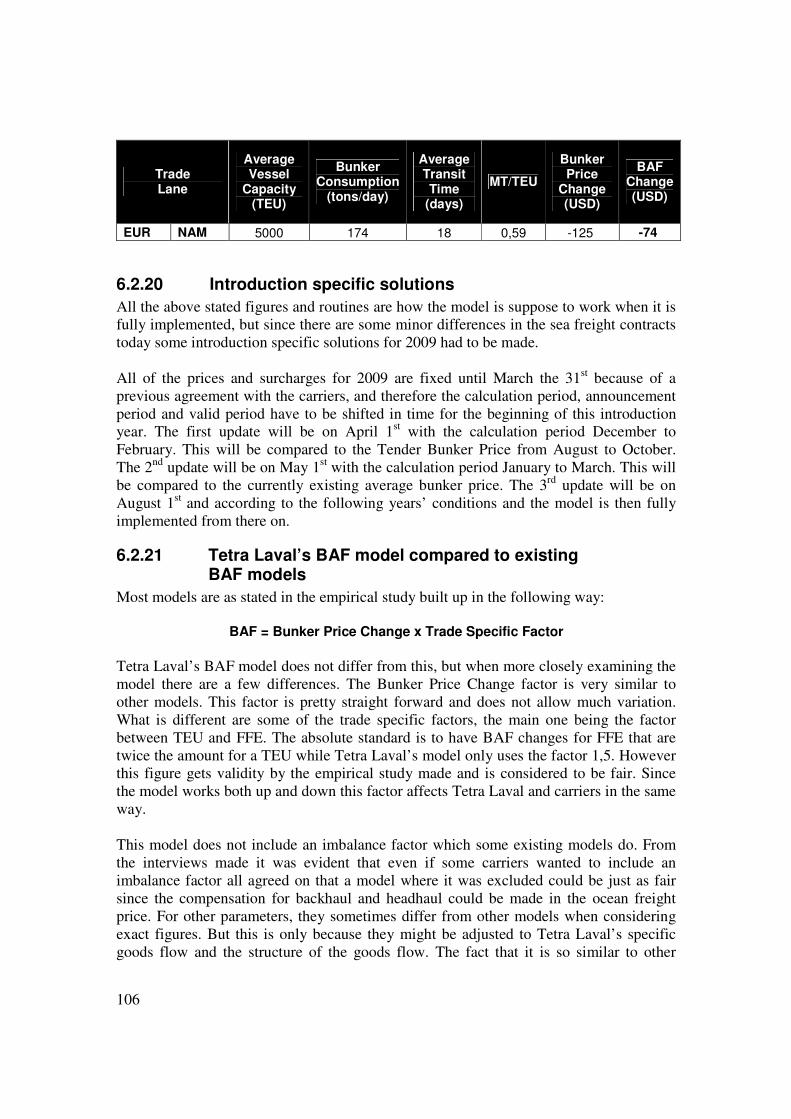
106
Trade Lane
Average Vessel
Capacity (TEU)
Bunker Consumption
(tons/day)
Average Transit Time
(days)
MT/TEU
Bunker Price
Change (USD)
BAF Change (USD)
EUR NAM 5000 174 18 0,59 -125 -74
6.2.20 Introduction specific solutions
All the above stated figures and routines are how the model is suppose to work when it is fully implemented, but since there are some minor differences in the sea freight contracts today some introduction specific solutions for 2009 had to be made. All of the prices and surcharges for 2009 are fixed until March the 31st because of a previous agreement with the carriers, and therefore the calculation period, announcement period and valid period have to be shifted in time for the beginning of this introduction year. The first update will be on April 1st with the calculation period December to February. This will be compared to the Tender Bunker Price from August to October. The 2nd update will be on May 1st with the calculation period January to March. This will be compared to the currently existing average bunker price. The 3rd update will be on August 1st and according to the following years’ conditions and the model is then fully implemented from there on.
6.2.21 Tetra Laval’s BAF model compared to existing BAF models
Most models are as stated in the empirical study built up in the following way:
BAF = Bunker Price Change x Trade Specific Factor
Tetra Laval’s BAF model does not differ from this, but when more closely examining the model there are a few differences. The Bunker Price Change factor is very similar to other models. This factor is pretty straight forward and does not allow much variation. What is different are some of the trade specific factors, the main one being the factor between TEU and FFE. The absolute standard is to have BAF changes for FFE that are twice the amount for a TEU while Tetra Laval’s model only uses the factor 1,5. However this figure gets validity by the empirical study made and is considered to be fair. Since the model works both up and down this factor affects Tetra Laval and carriers in the same way. This model does not include an imbalance factor which some existing models do. From the interviews made it was evident that even if some carriers wanted to include an imbalance factor all agreed on that a model where it was excluded could be just as fair since the compensation for backhaul and headhaul could be made in the ocean freight price. For other parameters, they sometimes differ from other models when considering exact figures. But this is only because they might be adjusted to Tetra Laval’s specific goods flow and the structure of the goods flow. The fact that it is so similar to other

107
models is considered to be good since it means that it might be easier for carriers to understand and therefore to implement.
6.3 Implementation of BAF model
The intentions to implement a Tetra Laval specific BAF model was first announced in late summer 2008 to considered carriers. The BAF model was announced in its final version the week before negotiations, so that the carrier’s responsible employees could reflect over it before the meetings. At the negotiations in November 2008 it was brought up as a topic of discussion at the negotiation meetings with the carriers. It was considered as an important part in the agreement with all the carriers. Since two thirds of Tetra Laval’s sea freight container shipments has origin area Europe the introduction of the BAF model to all the contracted carriers will be easier to justify because it is unnecessary complex to have two different models, one own for Europe and one from conferences for the rest of the world, and they should therefore accept Tetra Laval’s model on a global basis. The small amount of carriers that have only shipments outside Europe will have lesser incentive for accepting the model, but since all information points to that liner conferences ruling becomes less evident and larger shippers e.g. Tetra Laval are able to get special customised solutions as long as the model is considered to be as fair and transparent as possible.
6.4 Currency Adjustment Factor
Sea freight carriers are in an industry that is exposed to costs in many different small and large currencies and therefore currency variations is a concern for them, and above this they have almost all their earnings in USD because traditionally customers always purchase sea freight in USD. This is also the case for Tetra Laval’s sea freight costs where almost 90 % of total volumes were paid in USD in 2008. Currency variations have during the 21st century been a large concern for carriers, mostly because of the decline of USD exchange rate in relation to many other currencies. CAF surcharge was for these reasons introduced on a broader front during 2002-2003 in the container sea freight industry. For Tetra Laval’s total container sea freight volume in 2008 about 46 % was subject to CAF surcharge in either percentage upon ocean freight price or fixed additional amount in USD. CAF is therefore a significant surcharge that renders large concern when it comes to cost management. The amount of the surcharge has varied over the recent years and has ranged between 3,33 % and 3,63 % of grand total costs during 2008. This can be considered as a moderate percentage but when it is in relation to the grand total cost that is a significant cost it becomes important in spite of everything, if one compare the CAF cost with only the total ocean freight cost the percentage figure will increase. The difficult part when analysing the impact of CAF (same for BAF surcharge) is that you must know when the base line currency exchange rate is set in time that is compared with the current exchange rate. Otherwise it is impossible to know how the cost is distributed between ocean freight cost and CAF surcharge. This is illustrated with an example (all other costs hypothetical excluded);

108
• If ocean freight price is 2000 USD and a base line in 2002 is used, it might give a CAF surcharge of 10 % and the total cost will be 2200 USD.
• If ocean freight price is 2100 USD and a base line in 2004 is used, it might give a CAF surcharge of 4,75 % and the total cost will still be 2200 USD.
⇒ These two scenarios have the same total cost and must be considered as equal when sea freight costs is evaluated, but they have different CAF surcharge costs depending on the difference of when the base line for the currencies is placed in time.
Of the reason illustrated in the example it becomes impossible to make purchase decisions on analysing the CAF surcharge percentage. When analysing prices and costs for coming contract year it is therefore an assessment of grand total costs that becomes important, and the CAF surcharge must be seen only as a part of this, impossible to have any opinion about. The development that one has to monitor is the quarterly update that follows along the contract year. Therefore the CAF surcharge in the annual price proposal from all carriers must be considered as a base line and the cost development from there on is the issue that has to be assessed. This sums up in the need for Tetra Laval to set up an own model for the quarterly CAF surcharge update and take control of the cost development along the year. This means that Tetra Laval will along the contract year always know what parameters that will affect their sea freight costs and also the possibility to simulate how different currency exchange rate variations will affect future costs.
6.4.1 Other CAF models
The findings from comparing the CAF surcharge models of the three carriers that are stated in the empirical chapter are few but distinct and are as follows; there are not that many different ways that one can construct a CAF surcharge. The common intension is that a currency basket should be used that in some way reflect the currencies of the actual costs that is associated with a trade lane service. The problem is to decide if precisely all currencies should be included or for reducing the complexity only the ones that the significant costs occur in. It is only Maersk Line that declares their currency baskets and their Europe – Far East CAF currency basket contains no less than 20 different national currencies, which indicates that their likely intension is to include as many currencies as possible that their costs occurs in. This conclusion is made because a carrier calls about 14-18 ports on this specific trade lane and cost cannot occur in that many more currencies. The close similarity to the previous FEFC263 CAF surcharge is something that strengthens the credibility of their currency basket setup. Another question is how geographically specific the currency basket should be. There is a trade off between administration cost and surcharge accuracy meaning if there should be one currency basket for each specific service route or if it is possible to reduce the accuracy and have currency baskets for cluster to cluster trade lanes. The CAF surcharge models that was analysed did not give the full picture of this trade off.
263 Far East Freight Conference, ceased to exist on 18th October 2008

109
The other part of the CAF surcharge model is what calculation period, announcement period and valid period that should be used. The three analysed CAF models uses the average currency exchange rate for month n-2, have an announcement period of a whole month in n-1 and valid period for the n month. The likely meaning of the announcement period is to notice the affected customers in good time before valid period so no questions will be unanswered when the valid period starts. With this system there will be a new CAF surcharge once a month. This specificity in time periods is also a question of trade off between administration cost and surcharge accuracy. Though no one should be worse off if the time period instead were a quarter or half a year, but the difference is the lag or time shift of occurring costs later or much later in time which may be a phenomenon of unnecessary uncertainty if the time period is relatively long.
6.4.2 CAF model proposition
First the complete CAF model is stated so the reader easier can follow the line of thought in the following sections.
CAF (%) = ∑ (Currency variation x weighting of currency) Summation for all currencies included in basket
The function of the above stated model is very much similar to the existing CAF models in the shipping industry. The difference is that the input figures and way of using it will be streamlined to fit Tetra Laval’s way of business and most important the update will be in our hands and transparent for all affected parties. In similarity to the BAF model it is only the three month updates along one contract year that will be considered and the annual CAF surcharge that the carriers give in their proposal is considered to be fixed during the contract year and not affecting the three month CAF surcharge update. This means that the CAF model will be stand alone from the CAF surcharge that the carriers gives in annual price proposals. In theory the CAF surcharge should be applicable on the total ocean freight cost including BAF, because it is supposed to contain a large weight of USD that bunker is paid in and also because the currency baskets is intended to reflect total costs of a service. It may though also be considered to exclude the BAF and/or at least BAF change from the appliance for simplicity and the look of the used weighted cost variation.
6.4.3 Cluster dividing
The 12 clusters used for the BAF model will also be used when setting up the CAF model. This is the most logical and simple distribution and an adequate accuracy is achieved tough keeping the complexity at a moderate level. This distribution will contribute to a simple currency basket setup shown in the Currency Baskets section.
6.4.4 Data source for exchange rates
The source should be a trustworthy and simple public internet website. The fact that the currency baskets contain a large amount of currencies leaves not that many sources to
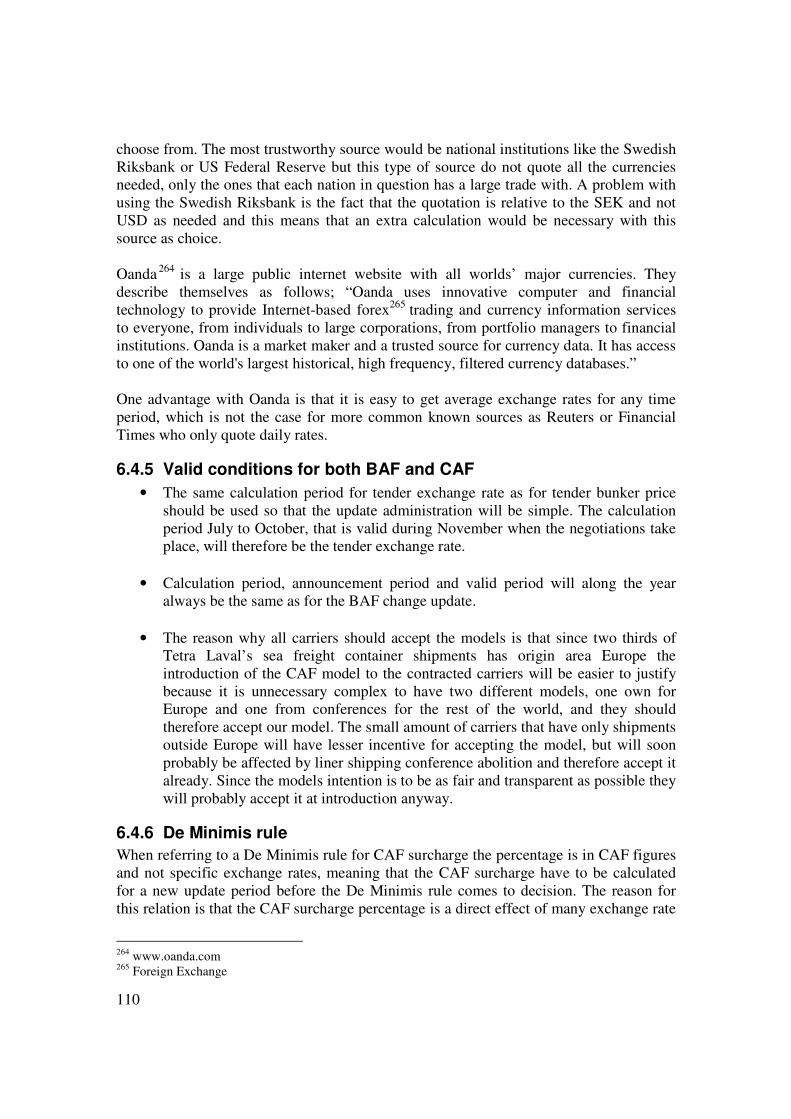
110
choose from. The most trustworthy source would be national institutions like the Swedish Riksbank or US Federal Reserve but this type of source do not quote all the currencies needed, only the ones that each nation in question has a large trade with. A problem with using the Swedish Riksbank is the fact that the quotation is relative to the SEK and not USD as needed and this means that an extra calculation would be necessary with this source as choice. Oanda 264 is a large public internet website with all worlds’ major currencies. They describe themselves as follows; “Oanda uses innovative computer and financial technology to provide Internet-based forex265 trading and currency information services to everyone, from individuals to large corporations, from portfolio managers to financial institutions. Oanda is a market maker and a trusted source for currency data. It has access to one of the world's largest historical, high frequency, filtered currency databases.” One advantage with Oanda is that it is easy to get average exchange rates for any time period, which is not the case for more common known sources as Reuters or Financial Times who only quote daily rates.
6.4.5 Valid conditions for both BAF and CAF
• The same calculation period for tender exchange rate as for tender bunker price should be used so that the update administration will be simple. The calculation period July to October, that is valid during November when the negotiations take place, will therefore be the tender exchange rate.
• Calculation period, announcement period and valid period will along the year
always be the same as for the BAF change update.
• The reason why all carriers should accept the models is that since two thirds of Tetra Laval’s sea freight container shipments has origin area Europe the introduction of the CAF model to the contracted carriers will be easier to justify because it is unnecessary complex to have two different models, one own for Europe and one from conferences for the rest of the world, and they should therefore accept our model. The small amount of carriers that have only shipments outside Europe will have lesser incentive for accepting the model, but will soon probably be affected by liner shipping conference abolition and therefore accept it already. Since the models intention is to be as fair and transparent as possible they will probably accept it at introduction anyway.
6.4.6 De Minimis rule
When referring to a De Minimis rule for CAF surcharge the percentage is in CAF figures and not specific exchange rates, meaning that the CAF surcharge have to be calculated for a new update period before the De Minimis rule comes to decision. The reason for this relation is that the CAF surcharge percentage is a direct effect of many exchange rate
264 www.oanda.com 265 Foreign Exchange

111
variations that gives direct effect on the costs. This is also why it will differ from the BAF surcharge that has a De Minimis rule considering the bunker price instead of the BAF change in specific. This is used because BAF change is dependable on trade lane specific factors giving the MT/TEU consumption. In simplified words CAF is dependable on many external implications and therefore the De Minimis rule is in relation to CAF surcharge percentage but BAF is dependable on one external and many internal implications and therefore its De Minimis rule is in relation to bunker price. Because generally it is likely that the exchange rate volatility along one year is much lesser than bunker price volatility, the De Minimis rule or trigger percentage have to be much smaller, perhaps 2 or 5 %. If it is chosen to a small figure the updates will also have a small cost impact and the administration that is dedicated will be very high in relation to cost impact. This also means that there is a possibility to have the CAF fixed for the whole contract year if market conditions allow it and in that way the three month CAF update is used only if exchange rates are volatile or other market risks implies the need.
6.4.7 Currency Baskets
A currency basket are the currencies that carriers cost occurs in relative the USD in a specific cluster region and their relative internal weighting. A logic and simple way of setting up the currency baskets is one basket for each cluster area and when assessing a basket for a trade lane the basket will be the two baskets of both the origin and destination cluster areas together. The weighting should be equal (50%) so an easy currency basket assessment for a specific trade lane will be possible. The logic of this is that although a container vessel will have port calls in between the origin area and destination area for the shipment in question, Tetra Laval should not be exposed to these currency risks. Such small currencies’ weighting in previous used currency baskets have most time been so nominal that the impact of CAF surcharge have been under 0,4 percentage units in calculation simulations shown in empirical study table 19. This nominal impact to the CAF surcharge also implies that the number of currencies in a basket can stay well below 20 for both currency baskets assessed together, for example seven to ten for each basket. An example of a currency basket setup for 2007-2008 is shown in table 28 and 29. Tender exchange rate: July to September 2007 Calculation period for the first valid period: October to December 2007 Announcement period: January 2008 Valid period: February to April 2008
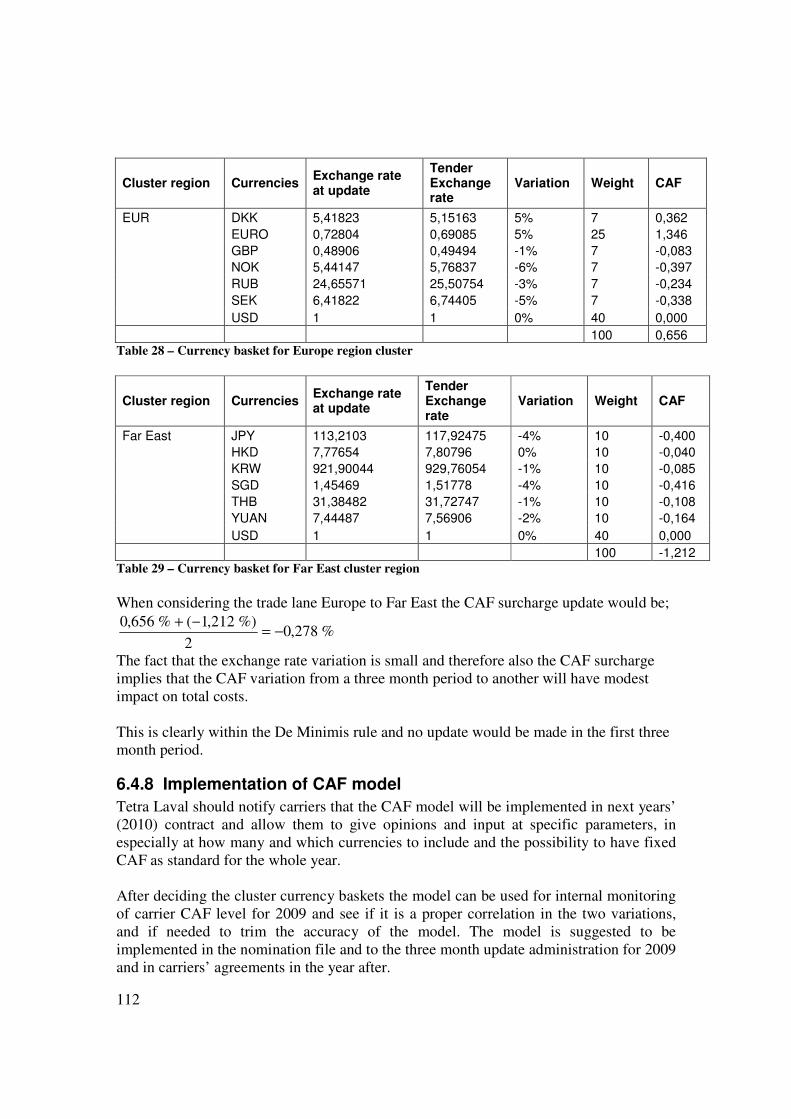
112
Cluster region Currencies Exchange rate at update
Tender Exchange rate
Variation Weight CAF
EUR DKK 5,41823 5,15163 5% 7 0,362
EURO 0,72804 0,69085 5% 25 1,346
GBP 0,48906 0,49494 -1% 7 -0,083
NOK 5,44147 5,76837 -6% 7 -0,397
RUB 24,65571 25,50754 -3% 7 -0,234
SEK 6,41822 6,74405 -5% 7 -0,338
USD 1 1 0% 40 0,000
100 0,656 Table 28 – Currency basket for Europe region cluster
Cluster region Currencies Exchange rate at update
Tender Exchange rate
Variation Weight CAF
Far East JPY 113,2103 117,92475 -4% 10 -0,400
HKD 7,77654 7,80796 0% 10 -0,040
KRW 921,90044 929,76054 -1% 10 -0,085
SGD 1,45469 1,51778 -4% 10 -0,416
THB 31,38482 31,72747 -1% 10 -0,108
YUAN 7,44487 7,56906 -2% 10 -0,164
USD 1 1 0% 40 0,000
100 -1,212 Table 29 – Currency basket for Far East cluster region
When considering the trade lane Europe to Far East the CAF surcharge update would be;
%278,02
%)212,1(%656,0−=
−+
The fact that the exchange rate variation is small and therefore also the CAF surcharge implies that the CAF variation from a three month period to another will have modest impact on total costs. This is clearly within the De Minimis rule and no update would be made in the first three month period.
6.4.8 Implementation of CAF model
Tetra Laval should notify carriers that the CAF model will be implemented in next years’ (2010) contract and allow them to give opinions and input at specific parameters, in especially at how many and which currencies to include and the possibility to have fixed CAF as standard for the whole year. After deciding the cluster currency baskets the model can be used for internal monitoring of carrier CAF level for 2009 and see if it is a proper correlation in the two variations, and if needed to trim the accuracy of the model. The model is suggested to be implemented in the nomination file and to the three month update administration for 2009 and in carriers’ agreements in the year after.

113
6.5 Terminal Handling Cost
The findings and opinion of the THC is homogenous with the carriers. It should be fixed for the whole contract year and should not vary that much over a longer time period either. This because it is associated with labour cost and some port investments costs and therefore only suppose to increase with labour cost development and in some rare exceptions with new big port investments (not standard interchange investments). Because of its associated costs it should be geographically specific for a region or unique port. There is also for the THC, as for BAF and CAF, a trade off between administration cost and surcharge accuracy. The intentions among carriers and also Tetra Laval are to reduce the amount of THC’s to a regional specific level to remain accurate but at a reasonable lower degree of complexity. The reason that Tetra Laval and other shippers should keep the THC surcharge specification is that it gives a hint of understanding the specific carrier’s costs and therefore gives better input to contract negotiations with the carriers.
6.6 Results and evaluation of the BAF model implementation
The general response from the negotiations with the carriers was positive since the BAF model was implemented in 2009 years’ contracts for most carriers. One circumstance that made the implementation more complex is the fact that bunker fuel prices has descended significantly in the autumn of 2008 and the market uncertainty is very significant because of this and the related global economic recession. The container freight rates has also descended at a broad perspective and because of this some carriers with very low priced backhaul trade lanes have gotten fixed all in prices for all their nominated volumes for the whole following contract year, but with a clause saying that if prices and bunker fuel costs will reach for the sky again, Tetra Laval’s BAF model will come into effect. The fact that the tender bunker price was set to 550 USD/MT from average price of the calculation period August to October gave some implications. The findings from the first negotiation meetings indicated that perhaps the tender bunker price was too high because of the continuing decline in bunker prices. Carriers had made their offers before the final model containing the tender bunker price was set and many carriers had made offers based on lower bunker prices. The reason that it was considered as too high is that when the first update is done and the BAF change will be made it will most likely be negative and with a too high tender bunker price the negative BAF change will be large. A decision was then made that the tender bunker price for this introduction year should be adjusted to September, October and November’s (until the negotiation date in November) average bunker price of 413 USD/MT. This adjustment made most carriers confident to agree in the BAF model implementation.

114
Of the other parameters in the model it was mainly the ratio between TEU and FFE that some carriers had remarks on. This ratio is in most carriers’ BAF models stated as 2, and therefore the logic of choosing 1,5 had to be emphasised. In the end neither this nor any other parameter had any remarks that could not be explained or agreed upon. In conclusion all Tetra Laval’s contracts for 2009 will contain the BAF model or be all in prices.
115
6.7 Summary
BAF is the surcharge that contributed most to the overall Grand Total cost development during 2008 with a contribution of over 60 %. This shows that it is the most important surcharge to focus on. The fact that about 90% of payments of sea freight is made in USD implies that the BAF change should also be in USD. Tetra Laval’s model for BAF change every third month during a one year contract is:
BAF change = Bunker fuel consumed (MT/TEU) x Bunker Price Change (USD)
The Bunker fuel consumed (MT/TEU) = Bunker Consumption * Average Transit Time * (1 – Time in Port) / (Average Vessel Capacity * Utilization). It is trade lane specific since some of the parameters depend on trade lane specific characteristics. The Bunker Price Change (USD) = Average Bunker Price for calculation period – Tender Bunker Price. The Tender Bunker price being a price level set before the contract start. For the model to come into use the average bunker price from the calculation period will be compared to the currently existing bunker price from previous update and if the difference is within ± 10 % there will be no changes in BAF level. The main goal when deciding on the different parameter was that the model should be as fair, transparent and accurate as possible so that neither Tetra Laval nor the carriers would lose or make money from the model. Carriers should only get paid for actual costs in a fair way. Since the model adjusts both up and down the model can be considered as risk-sharing. Tetra Laval’s model is very similar to other already existing models on the market. The difference is of course that some parameters e.g. transit time have been adjusted to better suit Tetra Laval’s specific goods flow. Most notable parameters are otherwise the ratio between BAF change for TEU and FFE that Tetra Laval has set to 1,5 instead on the more common factor 2. This model also excludes an imbalance factor that some other models contain. The proposal for a CAF model that for the coming year is to be used as an internal monitoring tool is based on currency baskets for every cluster. For a trade lane the two cluster currency basket are assessed together. This model then also becomes similar to already existing ones. Tetra Laval’s CAF model is:
CAF (%) = ∑ (Currency variation x weighting of currency) Summation for all currencies included in basket
It is based on the same clusters and time periods for calculation, announcing and validation as for the BAF model. The findings and opinion of the THC is homogenous with the carriers. It should be fixed for the whole contract year and that is also Tetra Laval’s stand point.

116
7 Conclusions and Recommendations Here will all the findings from the analysis chapter be placed in a future perspective and
conclusions and recommendations will be provided. The outline will be in line with the
analysis and empirical chapter taking in concern Bunker Adjustment Factor (BAF)
Currency Adjustment Factor (CAF) and Terminal Handling Cost (THC) separately. At
the end of the chapter some general conclusions and recommendations will be stated.
7.1 Bunker Adjustment Factor
The BAF surcharge is a major concern for shippers because of its constant increase, its volatility in both a short and long term perspective and the fact that it stands for the majority of the variable costs during a contract year. The shipping industry has high conformity with low possibility of business differentiation and therefore Tetra Laval’s model is similar to already existing ones but with better suiting for their specific goods flow. The BAF model was implemented in 2009 years’ contract and should after its first year of use be evaluated by GT&T and Geodis Wilson and the trade lane specific parameters should be reviewed and possibly updated. Parameters that might change between years are mainly the transit time that needs to be recalculated to reflect the coming year’s actual transit times, the average vessel size that is steadily increasing because of the large vessel sizes in the order books and the average vessel speed that is decreasing because of the trend with slow steaming, but if the bunker price are low carriers might stop using it. The average utilization will most likely not change because of the fact that carriers put ships to the side in times of low volumes to keep the utilization high and increasing the number of ships in times of high volumes. Change in global goods volumes might however affect transit times and the time in port if carriers decide to change their service routes. The ratio for BAF change between TEU and FFE should not be changed even though it was subject to some complaints and remarks. The environmental demands from policy makers, lobby organisations and the general public will most likely force the carriers to in the future bunker with more environmental friendly Low Sulphur Fuel Oil (LSFO) and similar products. This will give the carriers higher costs for bunker fuel resulting in that the freight rates and surcharges will increase for the shippers. It will be a huge adjustment for the industry but necessary for future environmental demands. The example of Sulphur Emission Control Area (SECA) in different regions in Europe will expectantly soon spread to other geographical areas in the world, driving the entire industry towards a necessary lower emission adjustment. These implications and the fact that it will increase shipping costs give the BAF model an even more justified need. This means that it will be more important to monitor bunker fuel cost when the fraction of total costs probably will increase and the annual variation in USD therefore also will increase. Some effort may be done in a promotional perspective and the understanding of the model can be facilitated, so that for coming years all carriers will accept it. The
117
advantages of having an own BAF model cannot be fully facilitated unless all carriers use the model because if they do not the offers cannot be compared on the same basis before negotiations. To handle the BAF change update during the contract year a Microsoft Excel worksheet included in the nomination file will be used. Its overall layout will be similar to the one seen in appendix B. In the nomination file’s main worksheet a BAF change column will be linked to the attached worksheet and in that way an update will be distributed to all sea freight nominations and then noticed to all affected carriers. All figures of tender bunker price, average bunker price and BAF changes will be registered and kept here for statistical performance evaluation.
7.2 Currency Adjustment Factor
A general conclusion for the CAF surcharge is that it will not vary that much with the three month updates as indicated in table 28 in the analysis chapter but can over a whole year with extreme currency variations be considerable. It has in addition a small impact on total costs that is shown in table 29 in the analysis chapter. During 2009 the CAF model can be used as an internal benchmark model to monitor that the carrier provided CAF surcharge updates is in line with overall exchange rate variations. The most important monitoring however is the one between different carriers to see that they have the same CAF surcharge on specific trade lanes. If there is a possibility during 2009 to have a dialog of the introduction of the CAF model for 2010 with the affected carriers it may be considered. Topic of discussion should be the currencies to include in the currency baskets, their relative weight, the De Minimis rules and also the possibility to have the CAF surcharge fixed for the whole contract year. It is recommended that the CAF model is to be used only when necessary and requested, those years when high currency variation is expected or a high market uncertainty exists. Perhaps the first years with the new market conditions, when there is a degree of uncertainty in the shipping market, the CAF model can be used and if shown that CAF variations have a modest impact, the CAF can be fixed for a whole contract year. If it is decided to have a fixed CAF a general De Minimis rule of for example if EUR/USD drops 20% during the year the CAF update will be restored, may be considered. A Microsoft Excel worksheet included in the nomination file will be used, in similarity to a BAF change worksheet. All currency baskets are stated here and linked to CAF update calculations. In the nomination file’s main worksheet the CAF percentage update figure from the attached CAF worksheet will give an amount in a specific CAF update column and in that way an update will be distributed to all sea freight nominations and then noticed to all affected carriers. All figures of tender exchange rate, average exchange rate and CAF updates will be registered and kept for statistical performance evaluation.

118
7.3 Terminal Handling Cost
The Terminal Handling Cost should not be at the top of the agenda when discussing the choice of sea freight supplier. The main reason is that it will be fixed for the whole contract year in all nominations and the only role it has is that it gives a hint of what cost distribution a specific carrier have. These implications may lead to that the THC will get lower attentions in future if all-in-prices will increase in use. There is even a possibility that the THC surcharge specification will disappear from some trade lanes with high competitiveness and to some degree be included in the ocean freight price.
7.4 General Conclusions and recommendations
A reason that the introduction of the BAF and CAF models have been seen as a realistic option for Tetra Laval is the fact that their annual sea freight volumes is a considerable amount (about 100 000 TEU for 2009) and therefore Tetra Laval stands for a large amount of the carriers annual fixed volumes. This gives Tetra Laval a good bargaining position and the carriers get the benefit to secure large volumes for coming year. The carriers can give fixed annual price proposals and be confident that Tetra Laval will manage the surcharge updates during the year and have confident in the variation because of the transparency of the models parameters. It is important that all carriers use the models in order to be able to evaluate offers in a fair and correct way. It is therefore necessary to be clear on this point before next year’s negotiations. If the CAF model is implemented Tetra Laval will take control over the updates for the two major sea freight surcharges that varies along one contract year. Today there are no other surcharges or variable costs related to sea freight that are considered necessary to assess in a similar way. It is important that this is done because it will eliminate the problem with having major surcharges updated both internally and externally. Another alternative is to have the CAF fixed for the whole contract period and only having the BAF variable. This would give the same effect with Tetra Laval having complete responsibility of the major surcharge updates. The later alternative is what is recommended since the CAF impact on Grand Total costs has not been that evident. The focus and impact of the three surcharges in question have been on a falling magnitude. The absolute major focus has been on the BAF surcharge followed by CAF and last the THC that took a lesser focus. This is in line with and because of their intergroup rank and impact on total cost and variation over time. The objective was to set up models for the costs that has to vary during a contract year and which is possible to be fairly assessed. This has now been made and the future lies in wait that will discover the outturn. A possible future development in the shipping industry after the abolition of shipping conferences is that the amount of different surcharges will decrease and the price transparency will increase. Perhaps there will exist all-in-prices, which is fixed over a relative long time, on some trade lanes in the future.

119
7.5 Summary
The BAF surcharge is a major concern for shippers because of its constant increase, its volatility in both a short and long term perspective and the fact that it stands for the majority of the variable costs during a contract year. The BAF model was implemented in 2009 years’ contract. A general conclusion for the CAF surcharge is that it will not vary that much with the three month updates. It has in addition a small impact on total costs. It is recommended that the CAF model is to be used only when necessary and requested, those years when high currency variation is expected or a high market uncertainty exists. If it is decided to have a fixed CAF a general De Minimis rule of for example if EUR/USD drops 20% during the year the CAF update will be restored, may be considered. The THC will be fixed for the whole contract year in all nominations and the only role it has is that it gives a hint of what cost distribution a specific carrier have. Today there are no other surcharges or variable costs related to sea freight that are considered necessary to assess in a similar way. A possible future development in the shipping industry after the abolition of shipping conferences is that the amount of different surcharges will decrease and the price transparency will increase.

120
References
Written sources
Literature
Andersen, Ib (1998): Den uppenbara verkligheten, Studentlitteratur, Lund, Sweden. Arbnor, Ingemar & Bjerke, Björn (1994): Företagsekonomisk metodlära (2nd ed.), Studentlitteratur, Lund, Sweden. Björklund, Maria & Paulsson, Ulf (2003): Seminarieboken: att skriva, presentera och
opponera, Studentlitteratur, Lund, Sweden. Bryman, Alan (2004): Social Research Methods, Oxford University Press, Oxford, UK. Holme, Idar Magne & Krohn Solvang, Bernt (1997): Forskningsmetodik om
kvalitativa och kvantitativa metoder (2nd ed.), Studentlitteratur, Lund, Sweden. Levinson, Marc (2006): The Box, How the Shipping Container Made the World Smaller
and the World Economy Bigger, Princeton Univ. Press, New Jersey, US Lumsden, Kenth (2006): Logistikens grunder (2nd ed.), Studentlitteratur, Lund, Sweden. Miles, Matthew B. & Huberman, Michael (1994): Qualitative Data Analysis, Sage Publications Inc., Beverly Hills, CA., USA Wallén, Göran (1993): Vetenskapsteori och forskningmetodik, Studentlitteratur, Lund, Sweden. Weele, Arjan J. van (2005): Purchasing & supply chain management: analysis, strategy,
planning and practice (4th ed.), Thomson Learning, London, UK.
Articles and reports
AXS-Alphaliner (2008): “The containership market 2007”, Report AXS-Alphaliner (2008): “The worldwide reference in liner shipping TOP 100: How it works” AXS-Alphaliner (2008): “The Cellular fleet forecast” Barnsky, Robert B. and Kilian, Lutz (2004): “Oil and the Macroeconomy Since the 1970s”, Journal of Economic Perspectives, Vol. 18(4), p. 115-134

121
Cariou P., Wolff F-C., (2006): “An analysis of Bunker Adjustment Factor and freight rates in the Europe/Far East market 2000-2004”, Maritime Economics and Logistics, Vol 8(2), p. 187-201 COSCO Container Lines Company Limited (2008): “Sustainability report 2007” Drewry Shipping Consults Ltd. (2007): “Annual Container Market Review and Forecast - 2007/08”, Report. Drewry Shipping Consults Ltd. (2008) “Container Market Quarterly”, June Frankel, Robert; Naslund, Dag & Bolumole, Yemisi (2005): “The “white space” of logistics research: A look at the role of methods usage”, Journal of Business Logistics, Vol 26(2), p. 185-208. Gammelgaard, Britta (2003): “Schools in logistics research? A methodological framework for analysis of the discipline”, International Journal of Physical Distribution & Logistics Management, Vol. 34(6), p. 479-491 Khemani, R. S. and Shapiro, D. M. (2008): “Glossary of Industrial Organisation Economics and Competition Law”, commissioned by the Directorate for Financial, Fiscal and Enterprise Affairs, OECD. Lindroth, Robert (2001): “Reflection on Process-based Supply Chain Modeling and Analysis”, Department of Industrial Management and Logistics. Lund University. Lloyd’s Fairplay Ship Database (2008): Lloyd’s Maritime information Services Lloyd’s List (2008): “Special Report – Container Shipping Companies”, 2008-08-27. MDS Transmodal Ltd. “Forecasting for long term investment in the container shipping market – an holistic approach”, Report Meyrick and Associates (2008): “Review of BAFs - Transatlantic and Europe/Far East trades” Report prepared for the European Shippers’ Council, Melbourne, May. Notteboom, Theo E. & Vernimmen, B. (2008): “The effect of high fuel costs on liner service configuration in container shipping”, Journal of Transport Geography, In Press, Corrected Proof, Available online 7 July 2008. På Hugget (2008): “Förbjudet och tillåtet för linjerederier efter 18 oktober”, European Liner Affairs Association, carrier conference meeting Singapore, made available through Swedish Logistics På Hugget newspaper nr 320, 2008-09-11

122
Shippersvoice (2008): “Maersk fuel surcharge calculator gets early approval”, 2008-01-22
Verbal Sources
Academics
Cariou, Pierre, Professor, World Maritime University, 2008-11-06 Larsson, Everth, Professor, Lund University, 2008-10-10
Geodis Wilson
Kjellberg, Magnus, Coordinator Ocean – Tetra Laval, Geodis Wilson, 2008-10-13 Persson , Jenny, Ass. Global Account Manager – Tetra Laval, Geodis Wilson, 2008-10-13
The Carriers
Josefson, Per, Branch and Sales Manager, Penta Shipping AB, 2008-10-23 Dirzowski, Harald, Sales Co-ordinator, “K” Line (Sweden) AB, 2008-10-23 Jedvert, Björn, Key Client Manager, Key Client Sales Scandinavia, Maersk Line, 2008-10-13 Andersson Magnus, Sales Manager, United Arab Agencies AB, 2008-10-23 Håkansson Säll, Fredrik, General Manager, Hyundai Merchant Marine (Scandinavia) AB, 2008-10-13 Magaji, Fredrik, MSC Sweden, 2008-10-23
Team Sea
Jansson, Hans, Global Procurement – Ocean Freight, Tetra Laval Group Transport & Travel, Several occasions Nilsson, Per, Global Procurement – Ocean Freight, Tetra Laval Group Transport & Travel, Several occasions Hellqvist, Björn, Global Procurement – Ocean Freight, Tetra Laval Group Transport & Travel, Several occasions.
Other
Ingvarsson, Robert, Director, Tetra Laval Group Transport & Travel, 2008-04-23
Electronic sources
AXS-Alphaliner TOP 100, Operated fleets as per 10 November 2008, www1.axsmarine.com/public/publicTOP100.php, 2008-11-11 Bank for International Settlements, www.bis.org - Triennial Central Bank Survey (December 2007), 2008-10-08 Bunkerworld, www.bunkerworld.com, several occasions

123
Commission adopts decision for the divestiture of Tetra Laval's shareholding in Sidel http://europa.eu, 2008-09-08 Dagens Industri, www.di.se - Råvaror: Oljepriset tog revansch, 2007-10-25 Dagens Industri, www.di.se - Råvaror: Oljepriset fortsätter upp, 2008-02-11 Dagens Industri, www.di.se - Råvaror: Oljan fortsätter ned, 2008-11-20 Dagens Industri, www.di.se – Valutor, several occasions Energy Information Authority, www.eia.gov, several occasions European Central Bank, www.ecb.eu, 2008-10-14 Geodis Wilson, www.geodiswilson.com, 2008-10-06 Global Shippers’ Forum, www.gsf.com, 2008-09-22 Multi Commodity Exchange of India, www.mcxindia.com, 2008-09-22 Panama Canal Authority, www.pancanal.com, 2008-09-19 Sidel, www.sidel.com, 2008-09-11 Tetra Laval, www.tetralaval.com, 2008-09-07
Carriers’ webpages
APL, www.apl.com COSCO, www.coscon.com CSCL, www.cscl.com.cn Evergreen, www.evergreen-marine.com Hamburg Süd. www.hamburgsud.com Hyundai Merchant Marine, www.hmm21.com “K” Line, www.kline.com Maersk Line, www.maerskline.com MSC Sweden, www.mscsweden.com UASC, www.uasc.net

124
Legal text and studies
Maritime transport regulation ruling 4056/86, European Court of Justice, Official Journal of the EU, 1986-12-22 Förstainstansrättens dom, I de förenade målen T-191/98, T-212/98 – T-214/98, Europeiska unionens officiella tidning nr C 007, 10/01/2004 s. 0029 - 0030, 2003-09-20 Guidelines on the application of Article 81 of the EC Treaty to maritime transport Services, SEC (2008) 2151 final, COMMISSION OF THE EUROPEAN COMMUNITIES, 2008-07-01 The European Commission’s conclusions take account of three independent studies undertaken to establish the impact of the repeal of the block exemption. The latest study (see IP/05/1408) is the combined work of Global Insight, an international consultancy with significant experience in liner shipping, the Berlin University of Technology and the Institute of Shipping Economics and Logistics in Bremen. Commission adopts decision for the divestiture of Tetra Laval's shareholding in Sidel http://europa.eu/rapid/pressReleasesAction.do?reference=IP/02/174&format=HTML&aged=0&language=EN&guiLanguage=en, 2002-01-30

125
Appendix
Appendix A – Interview Questions for Carriers
Since the interviews were conducted in Swedish the researchers decided to present the questions in Swedish.
• Vilka är era stora rutter, frekvens? Volymvärde? o Totalt o För Tetra Pak
• Hur ser eran flotta ut överlag? o Antal o Ålder
• Hur kommer avskaffandet av linje konferenser påverka er? o Tror ni det kommer att bli tuffare konkurrens mellan rederier? o Vem ansvarade för prissättning inom konferenserna? o Kommer arbetsbelastningen att förbli lika eller öka? o Kommer ni att presentera tilläggspriser direkt till kunden eller använda en
beräkningsformel så kunden kan se hur ni räknar? o Tror ni resten av världens konferenser också kommer avskaffas? o Vad ser ni för övriga tydliga trender inom sjöfrakt?
• Hur kalkylerar ni era kostnader för sjöfrakt? o Vilka kostnader ska sjöfrakten bära, direkt och indirekt (overhead
kostnader)? o Vilka kostnader påverkar grundpriset för sjöfrakt? o Hur tror ni att era olika kostnader kommer variera på kort och lång sikt?
Ge gärna exempel. • Hur valde ni ingående parametrar för tilläggskostnaderna?
o Bunker Adjustment Factor (BAF) o Currency Adjustment Factor (CAF) o Terminal Handling Cost (THC) o Använder ni historiska kostnader eller prognoser som bas för
tilläggskostnaderna? o Om ni använder en kostnadsformel presenterad för kunden, hur utvecklade
ni den? o Skiljer sig avtalen angående BAF, CAF & THC med era olika kunder?
• Hur ofta kommer ni att presentera nya tilläggskostnader (BAF, CAF, THC)? o Veckovis, månadsvis eller kvartalsvis? o Om kunden vill ha fasta kostnader för en längre period, hur kommer det
att påverka eran prisberäkning? • Vilken typ av bunker bränsle använder ni er av på eran flotta?
o Hur hanterar ni kostnader för bränsle? o Handlar ni på spotmarknad eller knyter ni terminskontrakt? o Betalar kunderna för den specifika bränslekostnaden på sin egen rutt eller
för en total genomsnittskostnad för alla rutter? • Använder ni er av ”slow steaming”? I sådana fall när? Vilka effekter ger det er?

126
• Hur hanterar ni fördröjning/köbildning i hamnar? o Hur påverkar relaterade kostnader era kunder?
• Hur hanterar ni obalanser i volym på rutterna? o Hur ser era obalanser ut? o Använder ni er av detta för att differentiera prissättning? o I detta fall, hur?

127
Appendix B – Trade Lane Specific Data
Trade Lane
Average Vessel
Capacity (TEU)
Bunker Consumption
(MT/day)
Average Transit Time (days)
MT/TEU
Bunker Price
Change (USD)
BAF Change (USD)
AFR AFR 2000 67 27 0,85
AFR AUN 2000 67 44 1,38
AFR EUR 3000 91 28 0,80
AFR F.E 3000 91 30 0,85
AFR GUL 3000 67 24 0,50
AFR INP 3000 67 22 0,46
AFR MED 3000 91 30 0,85
AFR NAM 3000 91 31 0,88
AFR RED 3000 67 16 0,34
AFR SAE 3000 91 22 0,63
AFR SAW 3000 91
AFR WIT 2000 67 15 0,47
AUN AUN 2000 67
AUN EUR 3000 91 40 1,14
AUN F.E 3000 91 18 0,51
AUN GUL 2000 67
AUN INP 2000 67 25 0,79
AUN MED 3000 91
AUN NAM 3000 91 33 0,94
AUN RED 2000 67
AUN SAE 3000 91 39 1,11
AUN SAW 3000 91
AUN WIT 2000 67
EUR EUR 2000 67 8 0,25
EUR F.E 8000 248 32 0,93
EUR GUL 6000 214 23 0,77
EUR INP 6000 214 26 0,87
EUR MED 2000 67 16 0,50
EUR NAM 5000 174 18 0,59
EUR RED 6000 214 20 0,67
EUR SAE 4000 126 17 0,50
EUR SAW 4000 126 27 0,80
EUR WIT 3000 91 22 0,63
F.E F.E 3000 91 10 0,28
F.E GUL 5000 174 26 0,85
F.E INP 5000 174 14 0,46
F.E MED 8000 248 30 0,87
F.E NAM 8000 248 24 0,70
F.E RED 5000 174 25 0,82
F.E SAE 4000 126 33 0,97
F.E SAW 4000 126 34 1,00
F.E WIT 3000 91 32 0,91
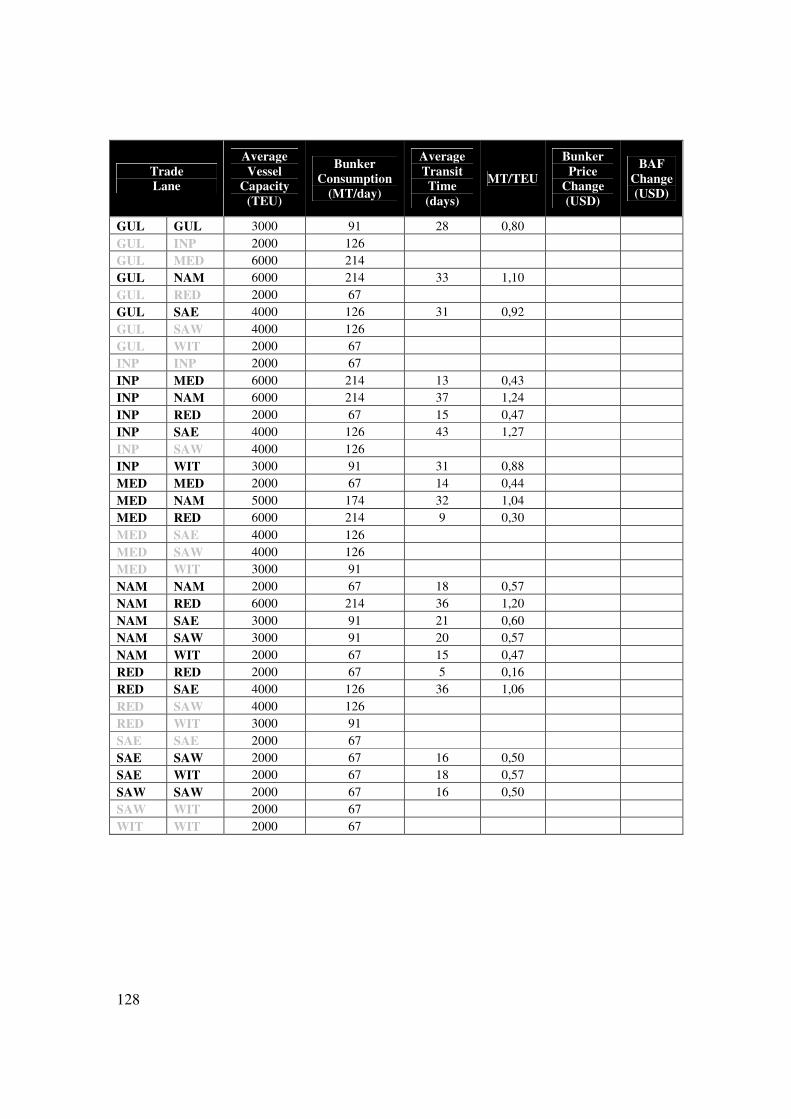
128
Trade Lane
Average Vessel
Capacity (TEU)
Bunker Consumption
(MT/day)
Average Transit Time (days)
MT/TEU
Bunker Price
Change (USD)
BAF Change (USD)
GUL GUL 3000 91 28 0,80
GUL INP 2000 126
GUL MED 6000 214
GUL NAM 6000 214 33 1,10
GUL RED 2000 67
GUL SAE 4000 126 31 0,92
GUL SAW 4000 126
GUL WIT 2000 67
INP INP 2000 67
INP MED 6000 214 13 0,43
INP NAM 6000 214 37 1,24
INP RED 2000 67 15 0,47
INP SAE 4000 126 43 1,27
INP SAW 4000 126
INP WIT 3000 91 31 0,88
MED MED 2000 67 14 0,44
MED NAM 5000 174 32 1,04
MED RED 6000 214 9 0,30
MED SAE 4000 126
MED SAW 4000 126
MED WIT 3000 91
NAM NAM 2000 67 18 0,57
NAM RED 6000 214 36 1,20
NAM SAE 3000 91 21 0,60
NAM SAW 3000 91 20 0,57
NAM WIT 2000 67 15 0,47
RED RED 2000 67 5 0,16
RED SAE 4000 126 36 1,06
RED SAW 4000 126
RED WIT 3000 91
SAE SAE 2000 67
SAE SAW 2000 67 16 0,50
SAE WIT 2000 67 18 0,57
SAW SAW 2000 67 16 0,50
SAW WIT 2000 67
WIT WIT 2000 67

129
Appendix C – Letter with BAF conditions
Tetra Laval Bunker Adjustment Factor
The following conditions are valid for BAF updates
• Carriers total all in prices will be valued at the annual negotiation.
• Tetra Laval will manage the BAF updates and implement change according to the formula,
BAF = MT of Bunker fuel consumed per TEU (MT/TEU) X Bunker Price Change.
• MT/TEU is unique for cluster to cluster trade lanes, since it depends on Trade Lane specific
parameters such as bunker consumption and average transit time. These can be seen in
Appendix 1 – Trade Lanes.
• Trade Lane specific parameters will be reviewed on an annual basis.
• Average Bunker Price from the calculation period will be compared to the currently existing
bunker price from previous update and if the difference is within ± 10 % there will be no
changes in BAF level.
• Average Bunker Price from the calculation period will then be compared to the annual
Tender Bunker Price along the year, and gives the Bunker Price Change.
• Bunker Price will be the average of IFO 380 in Houston, Rotterdam, Singapore and Fujairah
with Bunkerworld.com as public source.
• BAF Change for FFE will be 1,5 x BAF Change for TEU. This figure is based on the structure of
Tetra Laval’s goods.
• For calculation examples, see Appendix 2 – Example of BAF Changes.

130
Tender BAF and first update for introduction year Due to the fact that this year’s tender BAF will be fixed until April 1
st and not updated at
February 1st
, the calculation period for the Tender Bunker Price is set to Aug-Oct instead of
Jul-Sep.
This years Tender Bunker Price will be 550 USD/MT which is shown in the table below.
Singapore Fujairah Houston Rotterdam Average
Aug 673 691 658 622,5 661
Sep 614 602,5 582 549,5 587
Oct 409 413 404,5 384 403
550
• The 1st
update will be on April 1st
with the calculation period Dec-Feb. This will be compared
to the Tender Bunker Price from Aug-Oct.
• The 2nd
update will be on May 1st with the calculation period Jan-Mar. This will be compared
to the currently existing average bunker price.
• The 3rd
update will be on Aug 1st
and according to the following year conditions.
Tender BAF and updates for following years • BAF will be reviewed on a 3 month period basis as follows
Oct Nov Dec Jan Feb Mar Apr May Jun Jul Aug Sep Oct Nov Dec Jan
Period 1
Period 2
Period 3
Period 4
Calculation period
Announcement period
Valid period
• Annual Tender Bunker Price will be set before negotiations with calculation period Jul-Sep.
• The 1st
possible update will be valid Feb-Apr with calculation period Oct-Dec and 1 month
announcement period in January.
Questions We are prepared to answer any questions you may have in connection to this letter:
Per Nilsson e-mail: XXXXX telephone XXXXX

131
Appendix 1 – Trade Lanes
When calculating the BAF Change the following estimations has been made
• Average utilization of a containership is set to 80 % based on statistics from Lloyd’s Register.
• Time in Port of the Total Transit Time is set to 25 % based on the structure of Tetra Laval’s
goods flow.
Explanation of headlines in table
• Trade Lane is valid for both directions
• Average Vessel Capacity (TEU) is specific for trade lane and based on statistics from Lloyd’s
Register, Containerisation International, world trade volumes, length of trade lane and input
from some specific carriers.
• Bunker Consumption (MT/day) is given by specific vessel capacity at average speed based
on statistics from Lloyd’s Register
Vessel Size TEU Knots Consumption
2000 21 67
3000 22 91
4000 23 126
5000 24 174
6000 25 214
8000 25 248
• Average Transit Time (days) is based on Tetra Laval’s nominated shipments for 2009
• MT/TEU = Bunker Consumption X Average Transit Time X (1 – Time in Port) /
(Average Vessel Capacity X Utilization)
• Bunker Price Change (USD) = Average Bunker Price for calculation period – Tender Bunker
Price
• BAF Change (USD) = MT/TEU X Bunker Price Change

132
Trade Lane
Average Vessel
Capacity (TEU)
Bunker Consumption
(tons/day)
Average Transit Time
(days)
MT/TEU
Bunker Price
Change (USD)
BAF Change (USD)
AFR AFR 2000 67 27 0,85
AFR AUN 2000 67 44 1,38
AFR EUR 3000 91 28 0,80
AFR F.E 3000 91 30 0,85
AFR GUL 3000 67 24 0,50
AFR INP 3000 67 22 0,46
AFR MED 3000 91 30 0,85
AFR NAM 3000 91 31 0,88
AFR RED 3000 67 16 0,34
AFR SAE 3000 91 22 0,63
AFR SAW 3000 91
AFR WIT 2000 67 15 0,47
AUN AUN 2000 67
AUN EUR 3000 91 40 1,14
AUN F.E 3000 91 18 0,51
AUN GUL 2000 67
AUN INP 2000 67 25 0,79
AUN MED 3000 91
AUN NAM 3000 91 33 0,94
AUN RED 2000 67
AUN SAE 3000 91 39 1,11
AUN SAW 3000 91
AUN WIT 2000 67
EUR EUR 2000 67 8 0,25
EUR F.E 8000 248 32 0,93
EUR GUL 6000 214 23 0,77
EUR INP 6000 214 26 0,87
EUR MED 2000 67 16 0,50
EUR NAM 5000 174 18 0,59
EUR RED 6000 214 20 0,67
EUR SAE 4000 126 17 0,50
EUR SAW 4000 126 27 0,80
EUR WIT 3000 91 22 0,63
F.E F.E 3000 91 10 0,28
F.E GUL 5000 174 26 0,85
F.E INP 5000 174 14 0,46
F.E MED 8000 248 30 0,87
F.E NAM 8000 248 24 0,70
F.E RED 5000 174 25 0,82
F.E SAE 4000 126 33 0,97
F.E SAW 4000 126 34 1,00
F.E WIT 3000 91 32 0,91
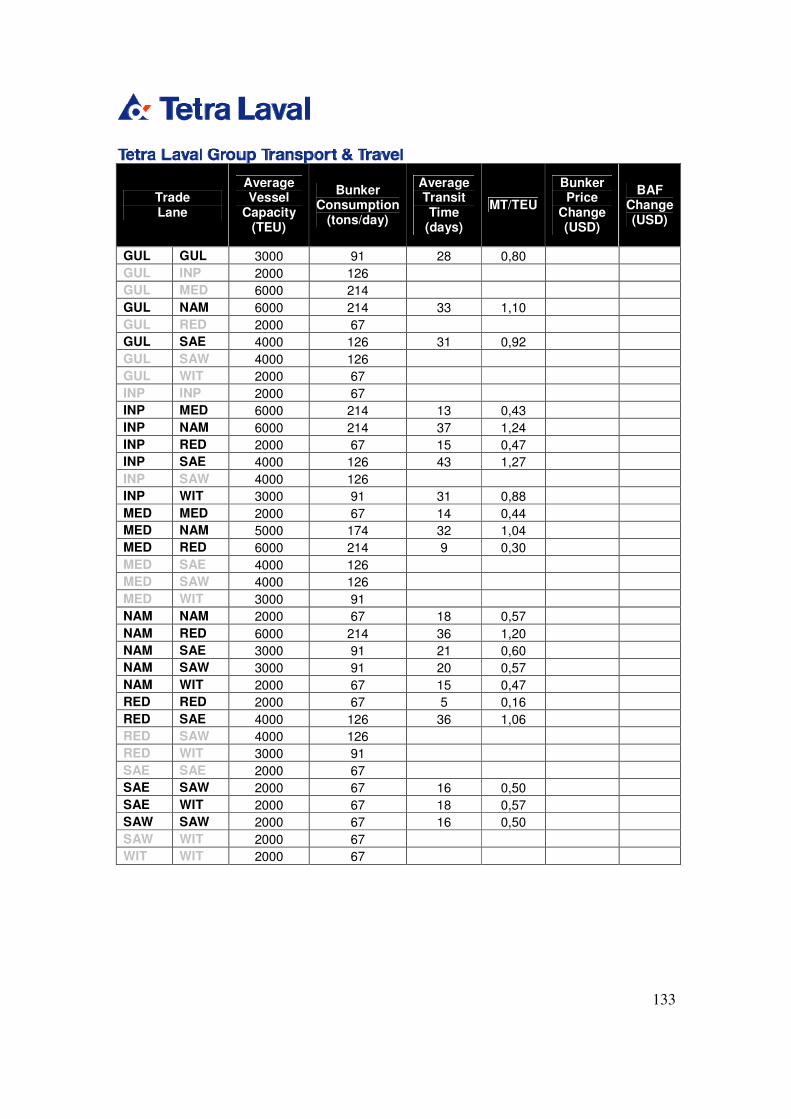
133
Trade Lane
Average Vessel
Capacity (TEU)
Bunker Consumption
(tons/day)
Average Transit Time
(days)
MT/TEU
Bunker Price
Change (USD)
BAF Change (USD)
GUL GUL 3000 91 28 0,80
GUL INP 2000 126
GUL MED 6000 214
GUL NAM 6000 214 33 1,10
GUL RED 2000 67
GUL SAE 4000 126 31 0,92
GUL SAW 4000 126
GUL WIT 2000 67
INP INP 2000 67
INP MED 6000 214 13 0,43
INP NAM 6000 214 37 1,24
INP RED 2000 67 15 0,47
INP SAE 4000 126 43 1,27
INP SAW 4000 126
INP WIT 3000 91 31 0,88
MED MED 2000 67 14 0,44
MED NAM 5000 174 32 1,04
MED RED 6000 214 9 0,30
MED SAE 4000 126
MED SAW 4000 126
MED WIT 3000 91
NAM NAM 2000 67 18 0,57
NAM RED 6000 214 36 1,20
NAM SAE 3000 91 21 0,60
NAM SAW 3000 91 20 0,57
NAM WIT 2000 67 15 0,47
RED RED 2000 67 5 0,16
RED SAE 4000 126 36 1,06
RED SAW 4000 126
RED WIT 3000 91
SAE SAE 2000 67
SAE SAW 2000 67 16 0,50
SAE WIT 2000 67 18 0,57
SAW SAW 2000 67 16 0,50
SAW WIT 2000 67
WIT WIT 2000 67

134
Appendix 2 - Example of BAF changes
Following example are based on Tender Bunker Price, calculation periods and valid periods for
introduction year.
• If the average bunker price for Dec-Feb is within ± 10 % of Tender Bunker Price
(495 - 605 USD/MT) there will be no adjustment of BAF level on April 1st.
• If there are no adjustment of BAF levels for April, calculation period Jan-Mar will be
compared to the Tender Bunker Price of 550 USD/MT and give possible BAF Change valid
May-Jul.
• If average bunker price for Dec-Feb exceeds the ± 10 % limits, the change will be as follows
on e.g. Europe – North America.
• If average bunker price for Dec-Feb for example is 675 USD/MT the bunker price change will
be 675-550 = 125 USD/MT and gives the BAF Change 74 USD.
Trade Lane
Average Vessel
Capacity (TEU)
Bunker Consumption
(tons/day)
Average Transit Time
(days)
MT/TEU
Bunker Price
Change (USD)
BAF Change (USD)
EUR NAM 5000 174 18 0,59 125 74
• If average bunker price for Dec-Feb is 425 USD/MT the bunker price change will be
425-550 = -125 USD/MT and gives the BAF Change -74 USD.
Trade Lane
Average Vessel
Capacity (TEU)
Bunker Consumption
(tons/day)
Average Transit Time
(days)
MT/TEU
Bunker Price
Change (USD)
BAF Change (USD)
EUR NAM 5000 174 18 0,59 -125 -74