cortical drive of low-frequency oscillations in the human nucleus
TRANSCRIPT

1
Cortical drive of low-frequency oscillations 1 in the human nucleus accumbens 2 during action selection 3 4 Max-Philipp Stenner1,2,*, Vladimir Litvak1, Robb B. Rutledge1,5, Tino Zaehle2, Friedhelm 5 C. Schmitt2, Jürgen Voges3,4, Hans-Jochen Heinze2,4, Raymond J. Dolan1,5 6 7
1Wellcome Trust Centre for Neuroimaging, University College London, 12 Queen Square, 8 London WC1N 3BG, United Kingdom 9
2Department of Neurology, Otto-von-Guericke-University Magdeburg, Leipziger Str. 44, 10 39120 Magdeburg, Germany 11
3Department of Stereotactic Neurosurgery, Otto-von-Guericke-University Magdeburg, 12 Leipziger Str. 44, 39120 Magdeburg, Germany 13
4Department of Behavioral Neurology, Leibniz Institute for Neurobiology, Brenneckestr. 14 6, 39118 Magdeburg, Germany 15
5Max Planck University College London Centre for Computational Psychiatry and Ageing 16 Research, London WC1B 5EH, United Kingdom 17 *correspondence: Wellcome Trust Centre for Neuroimaging, 12 Queen Square, WC1N 18 3BG, UK, telephone: 0044-20 3448 4377, email: [email protected] 19
20
Running title: Cortico-accumbens coupling during action selection 21
22 23
24 25
Articles in PresS. J Neurophysiol (April 15, 2015). doi:10.1152/jn.00988.2014
Copyright © 2015 by the American Physiological Society.

2
Abstract 26 The nucleus accumbens is thought to contribute to action selection by integrating 27 behaviourally relevant information from multiple regions including prefrontal cortex. 28 Studies in rodents suggest that information flow to the nucleus accumbens may be 29 regulated via task-dependent oscillatory coupling between regions. During instrumental 30 behaviour, local field potentials in the rat nucleus accumbens and prefrontal cortex are 31 coupled at delta frequencies (Gruber et al., 2009a), possibly mediating suppression of 32 afferent input from other areas and thereby supporting cortical control (Calhoon and 33 O’Donnell, 2013). Here, we demonstrate low-frequency cortico-accumbens coupling in 34 humans, both at rest and during a decision-making task. We recorded local field 35 potentials (LFP) from the nucleus accumbens in six epilepsy patients who underwent 36 implantation of deep brain stimulation electrodes. All patients showed significant 37 coherence and phase-synchronization between LFP and surface EEG at delta and low 38 theta frequencies. While the direction of this coupling indexed by Granger causality 39 varied between subjects in the resting-state data, all patients showed a cortical drive of 40 the nucleus accumbens during action selection in a decision-making task. In three 41 patients this was accompanied by a significant coherence increase over baseline. Our 42 results suggest that low-frequency cortico-accumbens coupling represents a highly 43 conserved regulatory mechanism for action selection. 44
45
Keywords 46
nucleus accumbens, action selection, local field potentials, synchronization, Deep Brain 47 Stimulation 48

3
Introduction 49
The nucleus accumbens contributes to the selection of goal-directed actions by 50 integrating behaviourally relevant information from the hippocampus, the amygdala 51 and prefrontal cortex, among other areas (Grace, 2000; Goto and Grace, 2008). These 52 inputs are likely integrated as a function of current task requirements (Gruber et al., 53 2009a; Calhoon and O’Donnell, 2013; Stuber, 2013). Previous work suggests that this 54 task-dependent integration may be regulated by inter-area coupling of oscillatory 55 synaptic potentials. In rodents, theta oscillations (around 7 Hz) in the ventromedial 56 striatum (which includes the nucleus accumbens) are coherent with hippocampal theta 57 oscillations during active exploration (Gruber et al., 2009a) and in maze tasks (Berke et 58 al., 2004; van der Meer and Redish, 2011). Entrainment of ventral striatal single units to 59 the hippocampal theta rhythm has been associated with combined contextual (spatial) 60 and motivational information (Tabuchi et al., 2000; van der Meer and Redish, 2011). 61 Together, these results have led to the proposal that theta coupling between the 62 hippocampus and the ventral striatum/nucleus accumbens may regulate how 63 contextual information influences action selection (Grace, 2000; Gruber et al., 2009a; 64 Pennartz et al., 2009). 65
66
Instrumental behaviour, on the other hand, has been associated with oscillatory 67 coupling of the nucleus accumbens with prefrontal cortex at delta frequencies (1-4 Hz). 68 Gruber et al. (2009) found strong delta coherence between the nucleus accumbens core 69 and prefrontal cortex, accompanied by enhanced single-unit cross-correlation, when 70 rats engaged in instrumental behaviour as compared to periods of active exploration. 71 Because theta coherence between the nucleus accumbens core and the hippocampus 72
4
was simultaneously reduced, the authors suggested that cortico-accumbens coupling 73 may override a hippocampal influence on neuronal excitability in the nucleus 74 accumbens (Calhoon and O’Donnell, 2013), thereby promoting behavioural flexibility. 75 Translation of these findings to humans has remained speculative, largely because 76 electrophysiological data from the human nucleus accumbens are rare. Such data have 77 recently become more tractable via recordings from deep brain stimulation (DBS) 78 electrodes, implanted in the nucleus accumbens for treatment of neurological or 79 neuropsychiatric disorders. 80
81
Here, we examined functional and directed connectivity between cortex and the nucleus 82 accumbens in six patients treated with DBS for drug-resistant epilepsy. We studied 83 coherence, phase-synchronization and Granger causality both at rest and during a 84 value-based decision-making task. Given reports of cortico-accumbens connectivity at 85 delta frequencies in rodents (Gruber et al., 2009a), we expected to find low-frequency 86 coupling between cortical EEG and local field potentials (LFP) in the nucleus 87 accumbens. Furthermore, we predicted that the strength of this coupling would 88 increase during the action selection stage of our decision-making task, accompanied by 89 evidence for a cortical drive of low-frequency oscillations in the nucleus accumbens, as 90 demonstrated in rodents (Gruber et al., 2009a; Calhoon and O’Donnell, 2013). Scalp 91 recordings may reflect hippocampal signals in addition to neocortical signals (e.g. 92 Kaplan et al., 2012). Here, we could rule out a substantial hippocampal contribution to 93 the observed LFP/EEG coupling in two of the patients who had undergone unilateral 94 resection of the hippocampus prior to DBS surgery. 95

5
Methods 96 Patients 97
Six patients with pharmacoresistant partial epilepsy participated in the study (mean ± 98 SD age: 39.5 ± 8.6 years; three females; all right handed; see table 1 for details). All 99 patients participated in in-house protocols aiming to objectify safety and potential anti-100 ictal efficacy of deep brain stimulation of the nucleus accumbens. Clinical outcomes 101 have been reported elsewhere (Schmitt et al., 2014). Both this clinical trial and the 102 experiments reported here were approved by the institutional review board of the 103 University of Magdeburg (registration number 03/08), and all patients gave written 104 informed consent. 105
106
Electrode implantation 107
All patients underwent stereotactically guided surgery with implantation of quadripolar 108 electrodes in the nucleus accumbens and anterior thalamus of each hemisphere 109 (Medtronic, model 3387). Planning of electrode placement and surgical procedures 110 were performed as described in detail in previous work (Voges et al., 2002; Zaehle et al., 111 2013). For the nucleus accumbens, standardized coordinates were 2 mm rostral to the 112 anterior border of the anterior commissure at the level of the mid-sagittal plane, 3–4 113 mm ventral and 6–8 mm lateral of the midline. For each patient, these standardized 114 coordinates were adjusted according to pre-surgical MRI, taking into account the 115 anatomy of the vertical limb of Broca’s diagonal band as an important landmark. 116 Specifically, electrodes were placed 2–2.5 mm lateral of the vertical limb of Broca’s 117 band, in the caudo-medial part of the nucleus accumbens. This area is thought to 118
6
correspond to the remnant of the shell area in primates (Sturm et al., 2003), as defined 119 by histochemical criteria. The position of each electrode was confirmed by 120 intraoperative stereotactic X-ray images and postoperative CT. At least two contacts of 121 each quadripolar electrode were placed inside the nucleus accumbens, covering those 122 parts equivalent to the nucleus accumbens shell and core regions in rodents. 123
124
Following surgery, electrode leads were externalized for six days, allowing test 125 stimulation with different parameters as well as recordings from depth electrodes in 126 various psychological tasks and at rest. Subsequently, electrode cables were connected 127 to an impulse generator located beneath the left pectoral muscle. 128
129
Procedure & task 130
Data were collected on two separate days between the third and fifth day post surgery, 131 with one dataset collected at rest and one collected during a decision-making task. Four 132 patients contributed both resting-state data and task-related data. For one patient (P5), 133 only resting-state data were collected, and for another patient (P6), only task-related 134 data were collected. Consequently, each dataset comprised five patients. For the resting-135 state recordings, patients sat comfortably in an upright position and were asked to 136 remain as still as possible, with their eyes open. Three to ten minutes of resting-state 137 data were recorded. 138
139

7
The task dataset was recorded during a standard economic decision-making task, 140 presented on a laptop computer. The nucleus accumbens is active in a variety of tasks 141 that involve action selection (Nicola, 2007). We used a task for which strong responses 142 are reliably recorded from the human nucleus accumbens during action selection in 143 previous functional MRI studies (Tom et al., 2007; Rutledge et al., 2014). Activity of 144 single neurons in the nucleus accumbens can be used to predict subsequent actions in a 145 financial decision-making task (Patel et al., 2012), even after controlling for the 146 probability of reward. Because the objective value of the gamble in our task changes 147 from trial to trial, making appropriate actions requires subjects to determine the 148 subjective value of each available gamble. This makes such an economic decision task 149 ideal for studying goal-directed actions. Furthermore, this task allowed us to 150 additionally test for value and reward prediction error signals that might relate to 151 dopamine, which have been identified in this area using other techniques (Patel et al., 152 2012; Hart et al., 2014). These investigations are the subject of a separate study. 153
154
The task required patients to decide whether to accept or reject a monetary gamble 155 offer. If accepted, a gamble could result in a monetary gain or loss with equal 156 probabilities. Each patient made 200 choices between this risky gamble option and a 157 safe option, which was worth 0 euros. There were five different win amounts for the 158 risky option (25, 40, 55, 75, 100 euro cents). Loss amounts for the risky option (5-200 159 euro cents) were determined by multiplying gain amounts by 20 different multipliers, 160 ranging from 0.5 to 5 to accommodate a wide range of gain-loss sensitivity. The risky 161 gamble option and the safe option were represented by three numbers on the screen, 162 each presented in black font in the centre of a white rectangle (figure 2A; the screen 163

8
background colour was black). Two of the three numbers were presented on one side of 164 the screen (left or right) and corresponded to the possible gain and loss of the current 165 gamble offer. The potential loss amount, indicated by a negative sign, and the possible 166 win amount were presented slightly below and above the horizontal meridian of the 167 screen, respectively, at equal eccentricities from the centre of the screen. The third 168 number, representing the safe option, was always zero and was presented on the 169 opposite side of the screen, on the horizontal meridian. The side of the screen 170 (left/right) on which each of the two options (safe option and gamble) was presented 171 was counterbalanced across trials. 172
173
Each trial started with the presentation of the two options on the screen. Patients chose 174 the option presented on the left or on the right by pressing one of two keys on a 175 keyboard with their left or right hand, respectively (left “Ctrl” and “Enter” on the 176 number block, respectively). There was no time limit for this decision. If patients chose 177 to gamble, the outcome was randomly determined by the computer and displayed after 178 a 2 s delay period for 1.5 s. The inter-trial interval (ITI) was jittered between 1.5 and 2 s. 179 The outcome of each trial counted for real money. Subjects were endowed with 15 180 euros at the start of the experiment and, in addition to this endowment, earned an 181 average of 15.66 euros (range, 3.73 to 27.38 euros), which was paid out at the end of the 182 experiment. Before the main experiment, patients practised the task and became 183 familiar with the range of possible wins and losses for 50 trials, which did not count for 184 real money. 185
186

9
Recording and analyses of local field potentials 187
LFP- and surface EEG-recording 188
Local field potentials were recorded continuously from four contacts on each of the four 189 DBS-electrodes (one in the nucleus accumbens and one in the anterior thalamic nucleus 190 of each hemisphere). Electrode contacts (platinum-iridium) were 1.5 mm wide and 191 spaced 1.5 mm apart (edge-to-edge distance). Simultaneous to LFP recordings, data 192 from two to five surface EEG electrodes (gold plated silver electrodes) were also 193 recorded (no online filters). Surface electrode number and placement varied between 194 patients due to post-surgical head bandages. The only surface EEG channel that was 195 available across all patients and both datasets was Cz (positioned according to the 10-196 20 system). 197
198
Data were digitized at a sampling rate of 512 Hz using a Walter Graphtek system. 199 Following previous work (Litvak et al., 2012), we analysed LFP data from DBS-200 electrodes in a bipolar montage, in which each contact is referenced to one 201 neighbouring contact. This results in three channels per DBS-electrode (i.e., each of the 202 three most ventral contacts was referenced against its dorsal neighbour). This bipolar 203 montage maximizes spatial specificity for the nucleus accumbens by minimizing volume 204 conduction effects from distant sources. Surface EEG channels were referenced against 205 the left ear lobe. 206
207
Preprocessing 208

10
LFP and surface EEG data were analysed using FieldTrip (Oostenveld et al., 2011) and 209 Matlab (version R2012a; Mathworks). Line noise was removed using a narrow-band 210 bandstop-filter (4th order, two-pass Butterworth filter). Visual inspection showed a slow 211 drift at the very beginning of the resting-state data, likely due to a long time constant of 212 the amplifier. This drift was removed using a high-pass filter (6th order, two-pass 213 Butterworth filter; cutoff frequency: 0.5 Hz). For each patient, resting-state data were 214 then epoched into consecutive segments of 2 seconds each (yielding 80 to 284 epochs 215 per patient). For the task dataset, data were epoched from 1.5 seconds before the onset 216 of the two options on the screen to 5 seconds after patients indicated their choices by 217 pressing a key (this corresponds to 3 seconds after the onset of the outcome in trials in 218 which patients chose to gamble). Because movement artefacts were more likely during 219 the task than during the resting-state recordings (for which patients only had to sit 220 still), a simple artefact rejection routine was added for the task dataset. Specifically, a 221 trial was rejected if the maximum amplitude variance across all available channels in 222 that trial exceeded a set threshold, as implemented by standard options in FieldTrip. 223 This resulted, on average, in a rejection of 12.5% of all task-related trials. 224
225
Time windows for distinct task stages 226
Our primary interest in the task dataset was to test for a modulation of cortico-227 accumbens connectivity during different stages of the task. Specifically, we asked how 228 connectivity changed as patients decided between the two options and anticipated and 229 subsequently saw the outcome of a chosen gamble. To compare connectivity during the 230 decision-, anticipation- and outcome stage to a baseline, we divided each trial into four 231 consecutive time windows, each equal to 1.5 seconds in duration (figure 2A). The 1.5 232

11
seconds prior to the onset of the two options on the screen served as a baseline (“ITI” in 233 figure 2A). The decision stage was defined as the time interval 1.5 seconds before 234 patients pressed a key to choose one of the two options. Trials in which patients 235 responded to the presentation of the options faster than 1.5 seconds were excluded 236 from analysis (of all four task stages). Given response times in the task (median: 2.09 s 237 (P1), 3.04 s (P2), 1.52 s (P3), 2.11 s (P4) and 1.46 s (P6)), this time interval of 1.5 s is 238 likely to include (aspects of) the decision process. A pre-response interval of 1.5 s also 239 allowed us to use analysis time windows of equal duration across the four task stages 240 (note that, across trials, the shortest inter-trial interval available as a baseline was 1.5 241 s). Accordingly, the anticipation stage of the task was defined as the 1.5 seconds that 242 preceded the onset of the gamble outcome, while the 1.5 seconds after outcome 243 presentation corresponded to the outcome stage. 244
245
By design, trials in which patients chose the safe option differed fundamentally from 246 gamble trials in that, in the former, patients knew immediately the outcome of their 247 decision. Consequently, anticipation- and outcome stages do not exist in trials in which 248 the safe option was chosen, at least not in the same sense as in gamble trials. Because 249 the connectivity metrics used here are sensitive to the number of trials used for 250 analysis, trials in which patients chose the safe option were excluded from the 251 comparison of the four task stages (note that we report a control analysis of our main 252 contrast of interest – comparing the decision stage to the baseline – which does include 253 trials in which the safe option was chosen). The numbers of trials available for all four 254 task stages, i.e., trials in which subjects chose to gamble and responded with a minimum 255 reaction time of 1.5 seconds, were 66 (P1), 102 (P2), 48 (P3), 103 (P4) and 63 (P6). 256

12
257
Functional and directed connectivity 258
Because the brain and surrounding tissues have no relevant capacitance across the 259 frequency range of interest in EEG (<<1 kHz), signals measured at surface electrodes 260 instantaneously reflect underlying cortical generators (e.g., Penny et al., 2011; Schomer 261 and Lopes da Silva, 2012). Because of this, connectivity between LFP recorded via DBS 262 electrodes and surface EEG can be interpreted as cortico-subcortical coupling. 263
264
We first computed the spectral coherence between the signal at Cz and the signal at 265 each of the six accumbens channels (three for each hemisphere). Coherence indexes the 266 consistency of a linear phase- and amplitude-relation between two signals across trials 267 (Walter, 1963). Coherence is defined as the absolute value of the trial-averaged cross-268 spectrum, normalized by the square root of the product of the two trial-averaged 269 autospectra. Coherence ranges from 0 to 1, with higher values indicating higher 270 consistency of a phase- and amplitude-relation between two signals. Coherence was 271 computed across trials from the cross- and auto-spectra after obtaining a fast Fourier 272 transform of the Hanning-tapered data for each trial/resting-state epoch. 273
274
Because coherence intermingles phase and amplitude, we tested for significant phase-275 synchronization between cortex (Cz) and the nucleus accumbens with a separate 276 metric. To test for phase-synchronization, the weighted phase-lag index (wPLI) was 277 computed, a recent extension (Vinck et al., 2011) of the phase-lag index (PLI; Stam, 278 Nolte, & Daffertshofer, 2007). The (signed) PLI is defined as the trial-averaged sign of 279

13
the imaginary component of the cross-spectrum and ranges from -1 to 1. In cases where 280 two signals show little or no (non-zero) phase-synchronization, the PLI tends towards 281 zero. Values closer to -1 or 1, on the other hand, indicate that phase lags or leads 282 between two signals are not equiprobable across trials, thus reflecting a consistent 283 phase-relation. A further improvement in the sensitivity of the PLI has recently been 284 demonstrated by weighting the sign of the imaginary part of the cross-spectrum by its 285 magnitude (i.e., by the π/2 component of the phase difference between signals; Vinck et 286 al., 2011). Here, the wPLI was computed on the basis of the single-trial Fourier spectra 287 using standard settings in FieldTrip. 288
289
To determine directionality of information flow between cortex and the nucleus 290 accumbens, we computed a nonparametric variant of pairwise Granger causality 291 (Dhamala et al., 2008). Pairwise Granger causality indexes the contribution of one time 292 series to forecasting a second time series, over and above the variance already 293 explained by the past information of the latter. In the frequency domain, the 294 computation of Granger causality is based on the spectral transfer function and the 295 noise covariance matrix, which can be obtained either from an autoregressive model or, 296 alternatively, nonparametrically, from a factorization of the spectral matrix. The latter 297 approach avoids any assumptions regarding a specific autoregressive model order and 298 was used here. Nonparametric Granger causality was computed from single-trial 299 Fourier spectra in FieldTrip, using standard settings (i.e., a factorization based on the 300 Wilson algorithm (Wilson, 1972)). 301
302
14
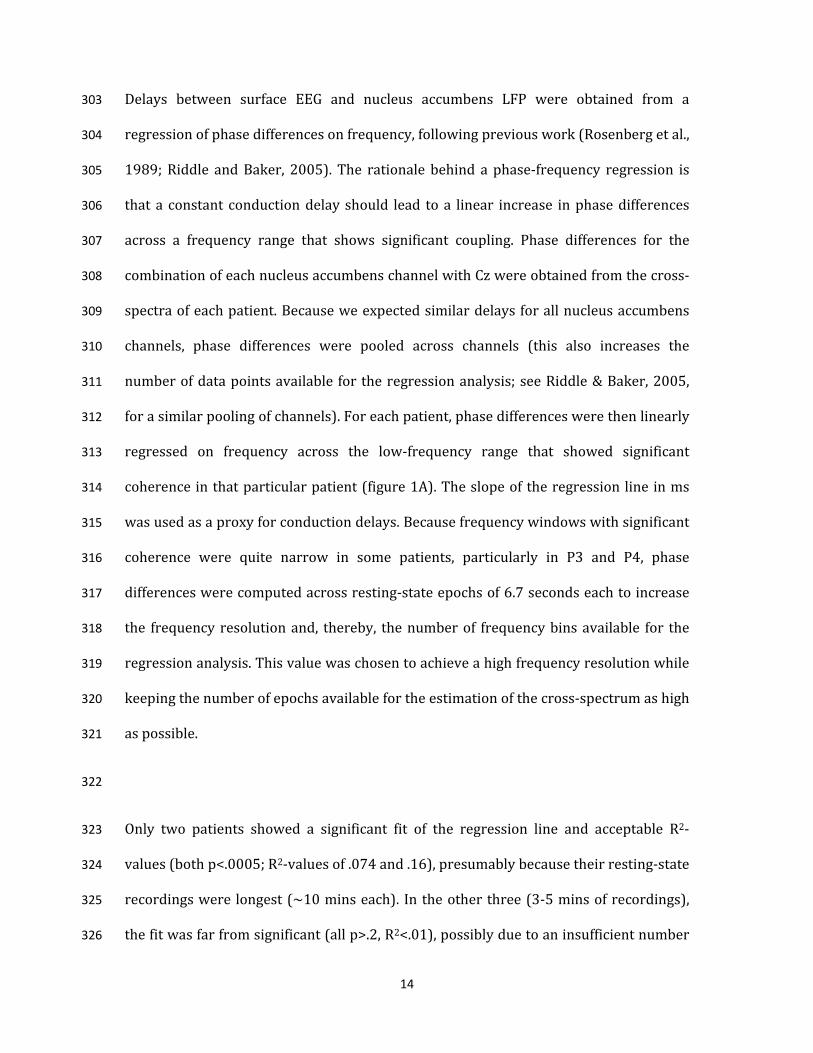
Delays between surface EEG and nucleus accumbens LFP were obtained from a 303 regression of phase differences on frequency, following previous work (Rosenberg et al., 304 1989; Riddle and Baker, 2005). The rationale behind a phase-frequency regression is 305 that a constant conduction delay should lead to a linear increase in phase differences 306 across a frequency range that shows significant coupling. Phase differences for the 307 combination of each nucleus accumbens channel with Cz were obtained from the cross-308 spectra of each patient. Because we expected similar delays for all nucleus accumbens 309 channels, phase differences were pooled across channels (this also increases the 310 number of data points available for the regression analysis; see Riddle & Baker, 2005, 311 for a similar pooling of channels). For each patient, phase differences were then linearly 312 regressed on frequency across the low-frequency range that showed significant 313 coherence in that particular patient (figure 1A). The slope of the regression line in ms 314 was used as a proxy for conduction delays. Because frequency windows with significant 315 coherence were quite narrow in some patients, particularly in P3 and P4, phase 316 differences were computed across resting-state epochs of 6.7 seconds each to increase 317 the frequency resolution and, thereby, the number of frequency bins available for the 318 regression analysis. This value was chosen to achieve a high frequency resolution while 319 keeping the number of epochs available for the estimation of the cross-spectrum as high 320 as possible. 321
322
Only two patients showed a significant fit of the regression line and acceptable R2-323 values (both p<.0005; R2-values of .074 and .16), presumably because their resting-state 324 recordings were longest (~10 mins each). In the other three (3-5 mins of recordings), 325 the fit was far from significant (all p>.2, R2<.01), possibly due to an insufficient number 326

15
of trials available to estimate the cross-spectrum with sufficiently low noise (≤40 trials 327 each) and a relatively low number of frequency bins for the regression (as low as 11). 328 Since data segments for the different task stages were only 1.5 seconds long, delays 329 were only computed from the resting-state data. 330
331
For all connectivity analyses, the lowest frequency and the frequency resolution were 332 defined as the inverse of the trial/epoch length in seconds. For the resting-state dataset, 333 coherence spectra, wPLI spectra and Granger causality spectra were explored over a 334 broad frequency range (up to 100 Hz). Having established a frequency window of 335 interest in our analysis of the resting-state data, we tested for a task-dependent 336 modulation of cortico-accumbens connectivity in this frequency window (≤6 Hz). Note 337 that this frequency window of interest was obtained from the independent analysis of 338 the resting-state dataset. Since we had no prior hypothesis regarding any difference 339 between the left and right nucleus accumbens, or between ventral and dorsal channels, 340 mean spectra across all six nucleus accumbens channels were used for statistical 341 analysis. We show data for the left and right nucleus accumbens separately in figure 3. 342 Separate analyses of the three DBS channels of each electrode showed no systematic 343 differences across individuals. 344
345
Statistics 346
Due to the moderate size of our study sample (five patients for each dataset) statistical 347 group-level inference is inappropriate. Instead, we report statistical results for 348 individual patients and note commonalities and differences between single-patient 349

16
statistical results. All statistical analyses were based on nonparametric resampling tests. 350 To test for significant peaks in the coherence- and wPLI spectra, the trial order of single-351 trial Fourier spectra was randomly shuffled for the nucleus accumbens, but not for Cz 352 (the same shuffled trial order was used for all six nucleus accumbens channels). 353 Coherence and the wPLI were then re-computed from the shuffled data. This was 354 repeated for at least 4000 iterations, each with a unique, shuffled trial order for the 355 nucleus accumbens. For each frequency bin, a p-value was computed as the proportion 356 of iterations whose (coherence- or wPLI-) values exceeded the value obtained from the 357 original data. These p-values were corrected for multiple comparisons across frequency 358 bins using Bonferroni correction (between 0 and 100 Hz for the resting-state data and 359 ≤6 Hz for the task data). Bonferroni-corrected p-values below .025 were considered 360 significant (corresponding to a two-sided test). To test for significant peaks in the 361 coherence spectrum, a one-sided threshold (.05) was used because we were only 362 interested in coherence which was larger for the original data than the shuffled data. 363
364
To test for significant peaks in the Granger causality spectra, we compared spectra 365 computed from the original data to Granger causality obtained after reversing the order 366 of time bins within each channel (effectively reversing the time axis in all channels), as 367 recently suggested by Haufe et al. (2013). Because Granger causality is sensitive to 368 temporal order, reversing the time axis should also reverse the direction of information 369 flow as indexed by Granger causality. In contrast, any spurious causality, for example, 370 due to common coloured noise or differences in the signal-to-noise-ratio between 371 channels (e.g., Nolte et al., 2008), should not be affected by a reversal of the time axis 372 (Haufe et al., 2012). To test whether Granger causality was significantly greater when 373

17
computed from the original vs. the time-reversed data, a nonparametric permutation 374 test was used. For each trial, Fourier spectra from the original and the time-reversed 375 data were first randomly assigned to two separate pools of trials. Granger causality was 376 then re-computed for each pool. This was repeated for at least 1000 iterations, each 377 with a unique permutation. For each frequency bin, a p-value was obtained as the 378 proportion of permutations which resulted in a Granger causality difference that was 379 larger than the observed difference between the original data and the time-reversed 380 data. These p-values were corrected for multiple comparisons across frequency bins 381 using Bonferroni correction (between 0 and 100 Hz for the resting-state data and ≤6 Hz 382 for the task data). Since we were only interested in Granger causality peaks which were 383 larger for the original than the time-reversed data, a one-sided significance threshold 384 was used (Bonferroni-corrected p-values below .05). 385
386
Permutation tests were also used to test for a significant modulation of coherence 387 during the decision-making task. Here, we tested for changes in cortico-accumbens 388 coherence during each of the decision-, anticipation- and outcome stages of the task, 389 each in relation to baseline. As a baseline, we used the inter-trial interval instead of our 390 resting-state data because the two datasets were recorded on two separate days, so that 391 potentially confounding factors, e.g., differences in tiredness, were not controlled for. Having 392 established a frequency window of interest in the analysis of the resting-state data (≤6 393 Hz), p-values were obtained from the permutation distribution after averaging 394 coherence values across this frequency window of interest. p-values were Bonferroni-395 corrected for the number of contrasts (3) and considered significant if they fell below 396 .025 (corresponding to a two-sided test). The same procedure was used to test for 397

18
differences in cortico-accumbens connectivity between the left and right nucleus 398 accumbens and for differences between cortico-accumbens and cortico-thalamic 399 coherence. 400

19
Results 401
Cortico-accumbens connectivity at rest 402
We first tested for significant coherence between surface-channel EEG (at Cz) and LFP 403 from the nucleus accumbens at rest. A broad frequency range was explored (up to 100 404 Hz). As expected, we found significant peaks in the coherence spectrum at low 405 frequencies (between 2.5 to 5 Hz). Remarkably, a significant low-frequency peak was 406 present in each of the five patients (figure 1A; Bonferroni-corrected for multiple 407 comparisons across all frequency bins up to 100 Hz). Peak frequencies and peak 408 morphology varied across patients, with some patients (P1, P2 and P5), showing more 409 than one distinct peak at low (delta/theta) frequencies. Up to 100 Hz, no other 410 significant peaks were identified which were consistent across patients (P2 showed a 411 separate peak at beta frequencies). When comparing cortico-accumbens vs. cortico-412 thalamic coherence, averaged across frequencies ≤ 6 Hz, cortico-accumbens coherence was 413 significantly stronger in three patients (P2, P3 and P5; all p<.001). The remaining two patients 414 showed trends in the same direction (P4: p=.07; P1: p=.15). 415
416
Coherence intermingles the amplitude- and phase-relation between two signals. To test 417 specifically for cortico-accumbens phase-synchronization, we computed the weighted 418 phase-lag index (wPLI; Vinck et al., 2011), a measure of a consistent (non-zero) phase-419 relation between two signals. Results closely resembled our coherence findings. Each of 420 the five patients showed a significant low-frequency (3 to 5 Hz) peak in the wPLI 421 spectrum (figure 1B; Bonferroni-corrected for multiple comparisons across all 422 frequency bins up to 100 Hz). In one patient (P2), the sign of the wPLI separated three 423

20
distinct peaks in the spectrum, one at delta/theta frequencies, as in all other patients, 424 and one each at higher theta frequencies and in the beta band. 425
426
Both spectral coherence and the wPLI measure functional connectivity. To study the 427 direction of information flow between cortex and the nucleus accumbens at rest, a 428 nonparametric variant of spectral Granger causality was computed. Significant peaks at 429 low frequencies (< ~10 Hz) were identified in the Granger causal spectrum of each 430 patient (figure 1C; Bonferroni-corrected for multiple comparisons across all frequency 431 bins up to 100 Hz). The direction of information flow, from cortex to the nucleus 432 accumbens or vice versa, varied between patients. Two patients (P2 and P4) showed a 433 predominantly subcortical drive (nucleus accumbens leading). In one patient (P1), we 434 observed a predominantly cortical drive. Patient P5 showed a cortical drive at ~2.5 Hz 435 and a subcortical drive at ~9 Hz, and in patient P3, a clear distinction between 436 directions was difficult to establish. 437
438
Delays between surface EEG and nucleus accumbens LFP were estimated from the slope 439 of a linear regression of phase differences on frequency across the range that showed 440 significant coherence peaks (figure 1A). Only two patients (P1 and P2) showed a 441 significant fit of the linear regression (both p<.0005; R2-values of .074 and .16), while 442 the fit was not significant in the remaining three patients (all p>.2, R2<.01; see methods 443 for a discussion of possible reasons). In P1, the estimated delay from cortex to the 444 nucleus accumbens was +38 ms, while in P2, the delay was -100 ms. These delays are in 445 line with the Granger causality results from these two patients (figure 1C). Patient P1, 446
21
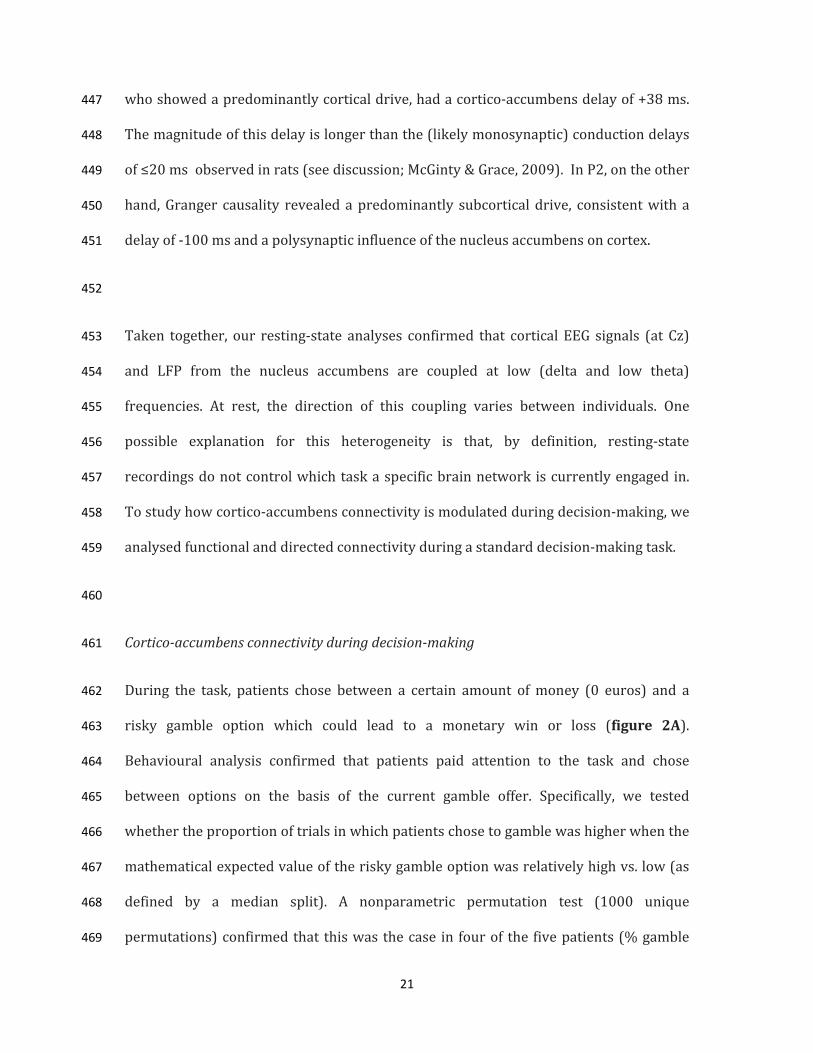
who showed a predominantly cortical drive, had a cortico-accumbens delay of +38 ms. 447 The magnitude of this delay is longer than the (likely monosynaptic) conduction delays 448 of ≤20 ms observed in rats (see discussion; McGinty & Grace, 2009). In P2, on the other 449 hand, Granger causality revealed a predominantly subcortical drive, consistent with a 450 delay of -100 ms and a polysynaptic influence of the nucleus accumbens on cortex. 451
452
Taken together, our resting-state analyses confirmed that cortical EEG signals (at Cz) 453 and LFP from the nucleus accumbens are coupled at low (delta and low theta) 454 frequencies. At rest, the direction of this coupling varies between individuals. One 455 possible explanation for this heterogeneity is that, by definition, resting-state 456 recordings do not control which task a specific brain network is currently engaged in. 457 To study how cortico-accumbens connectivity is modulated during decision-making, we 458 analysed functional and directed connectivity during a standard decision-making task. 459
460
Cortico-accumbens connectivity during decision-making 461
During the task, patients chose between a certain amount of money (0 euros) and a 462 risky gamble option which could lead to a monetary win or loss (figure 2A). 463 Behavioural analysis confirmed that patients paid attention to the task and chose 464 between options on the basis of the current gamble offer. Specifically, we tested 465 whether the proportion of trials in which patients chose to gamble was higher when the 466 mathematical expected value of the risky gamble option was relatively high vs. low (as 467 defined by a median split). A nonparametric permutation test (1000 unique 468 permutations) confirmed that this was the case in four of the five patients (% gamble 469
22
chosen, high vs. low expected value: 59% vs. 33% (P1), 68% vs. 53% (P2), 78% vs. 47% 470 (P3), 93% vs. 70% (P6); all permutation p-values < .025, corresponding to a two-sided 471 test). Only one patient (P4) chose the gamble offer equally often when its expected 472 value was relatively high vs. low (76% vs. 76%). Subjects earned, on average, an 473 additional 15.66 euros (range, 3.73 to 27.38 euros). In contrast, a random chooser 474 would earn an additional 8.83 euros on average, and four of the five patients earned 475 more than that. Patients made their choices with a mean median response time of 2.09 476 seconds (range of median response times, 1.46-3.04 seconds). On average, they chose to 477 gamble in 65.3% of trials. There was considerable variability in preferences across 478 subjects (range, 46-81.5%), as expected in a task like this (Tom et al., 2007). Four of the 479 five patients were consistent in their preference for choosing gambles, as evidenced by 480 permutation tests that compared the tendency to choose a gamble in the first vs. second 481 half of the experiment. Patients P1, P2, P4 and P6 chose a similar proportion of gambles 482 in the first and second half (p> .09, threshold for significance at .025), while patient P3 483 chose significantly more gambles in the second than in the first half, p=.005). 484
485
We were interested how direction and strength of connectivity between cortex and the 486 nucleus accumbens changed during the course of a trial, specifically in the low-487 frequency window of interest that we established in our resting-state analyses (≤ 6 Hz). 488 To this end, low-frequency coherence values during the decision-, anticipation- and 489 outcome stages of the task were compared to a baseline (the inter-trial interval). Figure 490
2B shows coherence spectra during all four stages of the task (the colour-coding 491 corresponds to the colours in figure 2A). Four of the five patients (P2 to P6) showed at 492 least one peak in the frequency window of interest (≤6 Hz) in at least one of the four 493

23
task stages. Peak frequencies were slightly lower than at rest (around 2 Hz). 494 Numerically, the highest coherence peak occurred during the decision stage of the task 495 in all five patients, followed by the anticipation stage in four of the five patients. 496 Coherence below 6 Hz was significantly higher during the decision stage as compared to 497 baseline in three of the five patients (P2, P3 and P6; all p-values < .025 after Bonferroni-498 correction). The patient whose coherence- and wPLI spectra at rest revealed two 499 distinct peaks at delta and theta frequencies (P2, figure 1A and B) also showed two 500 corresponding coherence peaks during the task. When comparing the anticipation- and 501 outcome stage to baseline, we found a significant enhancement of coherence across the 502 frequency window of interest only in one patient and one task stage (the outcome stage 503 in P1). Trials in which patients chose the safe option (0 euros) were excluded from the 504 analysis of task coherence to this point to avoid differences in trial numbers (see 505 methods). However, when computing coherence across all trials and comparing the 506 decision stage to baseline, we found a very similar pattern of results (with P2, P3 and P6 507 showing a significant enhancement of low-frequency coherence during the decision 508 stage; P4 showed a trend for significance of .031). In contrast to this increase in cortico-509 accumbens coherence during the action selection stage of the task, no task-modulation of 510 cortico-thalamic coherence ≤6 Hz was observed in any of the five patients (all p>.3). 511
512
We tested whether this enhancement of functional connectivity during the decision 513 stage coincided with a cortical drive of low-frequency oscillations in the nucleus 514 accumbens, as predicted from the animal literature (Gruber et al., 2009a; Calhoon and 515 O’Donnell, 2013). Granger causality spectra confirmed that all patients showed a 516 significant cortical drive at frequencies similar to their coherence peaks (except P3, who 517

24
showed a trend of p=.08; figure 2C, Bonferroni-corrected for multiple comparisons 518 across all frequency bins ≤ 6 Hz). For P2, there was a significant cortical drive at ~2.5 Hz 519 and a significant subcortical drive at ~5.5 Hz, which, together, mapped well onto the 520 two distinct low-frequency peaks observed in the coherence spectra of this patient at 521 rest and during the task. 522
523
EEG/LFP connectivity does not reflect hippocampus/nucleus accumbens coupling 524
Previous studies suggest that scalp recordings may reflect hippocampal signals in 525 addition to neocortical signals (e.g. Kaplan et al., 2012). In rodents, oscillations in the 526 hippocampus and the nucleus accumbens are coupled at theta frequencies (Berke et al., 527 2004; Gruber et al., 2009a). Accordingly, the EEG/LFP connectivity observed here could, 528 in principle, reflect connectivity between the nucleus accumbens and the hippocampus, 529 rather than the neocortex. To address a potential hippocampal influence on our 530 connectivity findings, we made use of the fact that two of the patients had undergone 531 surgical resection of the medial temporal lobe to treat their epilepsy. Patients P3 and P4 532 had undergone right and left temporal lobe resection, respectively, three and nine years 533 before DBS surgery. In non-human primates (unlike in rodents) hippocampal 534 projections to the nucleus accumbens do not cross to the contralateral hemisphere 535 (Friedman et al., 2002). Under the assumption that this holds for humans (see 536 discussion), we tested for differences in delta/theta coherence as a function of 537 hemisphere (operated vs. non operated hemisphere). If the hippocampus made a 538 substantial contribution to the observed low-frequency coherence, we would expect 539 reduced coherence peaks in the operated hemisphere, both at rest and during the task. 540

25
If there was no substantial hippocampal contribution, removal of the hippocampus 541 should have little impact. 542
543
Patient P4 indeed showed a significant reduction in delta/theta coherence in the left 544 (operated) hemisphere at rest relative to the right (not operated) hemisphere 545 (resampling p-value <.025). Importantly, however, this patient showed no difference 546 between hemispheres during the decision-stage of the task, where a similar coherence 547 peak was observed in both hemispheres (figures 3A and B). For patient P3, who had 548 undergone right temporal lobe resection, we found significantly stronger coherence in 549 the operated hemisphere during the task (resampling p-value <.025) and no difference 550 at rest. In addition, patient P2, who had not undergone any surgery of the medial 551 temporal lobe, also showed significantly stronger coherence (at rest) in the right vs. left 552 hemisphere, similarly to P4 and P3. 553
554
555
556
557

26
Discussion 558
We demonstrate oscillatory coupling between local field potentials in the human 559 nucleus accumbens and surface EEG at delta and low theta frequencies, both at rest and 560 during a decision-making task. During the action selection stage of the task, this 561 coupling consists of a cortical drive of ~2 Hz oscillations in the nucleus accumbens, 562 accompanied by an increase in cortico-accumbens coherence. 563
564
Low-frequency oscillations and nucleus accumbens network function 565
Low-frequency coupling of local field potentials and cross-correlation of single units in 566 the hippocampus and the nucleus accumbens are well established in rodents (Tabuchi 567 et al., 2000; Berke et al., 2004; Gruber et al., 2009a; van der Meer and Redish, 2011). 568 Entrainment of nucleus accumbens neurons to the hippocampal theta rhythm is thought 569 to convey contextual (spatial) information (Tabuchi et al., 2000; van der Meer and 570 Redish, 2011), possibly constraining afferent drive from prefrontal cortex during action 571 selection (Grace, 2000; Goto and Grace, 2008). Conversely, recent studies show that 572 prefrontal input to the nucleus accumbens can suppress excitatory drive from the 573 hippocampus. Specifically, Calhoon & O’Donnell (2013) reported that 50 Hz train 574 stimulation of medial prefrontal cortex attenuated excitatory post-synaptic potentials in 575 the nucleus accumbens that were elicited via hippocampal projections. Because train 576 stimulation is thought to mimic burst firing of prefrontal neurons during instrumental 577 behaviour (Peters et al., 2005), the authors argued that naturally occurring afferent 578 input from prefrontal cortex, specifically during instrumental action, may also suppress 579 hippocampal drive, possibly via inhibitory interneurons. During instrumental 580

27
behaviour, local field potentials in the nucleus accumbens core and prefrontal cortex are 581 coupled at delta frequencies (1-4 Hz), accompanied by a decrease in theta coupling of 582 the nucleus accumbens with the hippocampus (Gruber et al., 2009a). Taken together, 583 this suggests that cortico-accumbens coupling at delta frequencies may be involved in 584 aspects of instrumental action, at least in rodents. Translation of these findings to 585 human physiology has so far been speculative because electrophysiological data from 586 the human nucleus accumbens is rare. 587
588
Here, we demonstrate cortico-accumbens coupling at low frequencies in humans. In 589 particular, we find a cortical drive of 2-3 Hz oscillations in the nucleus accumbens 590 during the action selection stage of a standard decision-making task, accompanied by an 591 increase in 2 Hz coherence between cortex and the nucleus accumbens. The delay 592 between cortex and the nucleus accumbens was estimated to be ~38 ms from a phase-593 frequency regression of the resting-state data of one patient (which allowed for 594 sufficiently long epochs, see methods). This delay is longer than the (monosynaptic) 595 conduction delays between frontal cortex and the nucleus accumbens reported in rats 596 (≤20 ms; McGinty & Grace, 2009). One possible reason for this is that cortico-accumbens 597 coherence may involve an additional step of synaptic transmission. A plausible 598 candidate for mediating cortico-accumbens coherence is the pool of inhibitory 599 interneurons in the nucleus accumbens. Calhoon & O’Donnell (2013) reported evidence 600 for an involvement of GABAergic neurotransmission in the heterosynaptic suppression 601 of hippocampal input by prefrontal stimulation in rats, consistent with reports that 602 prefrontal stimulation activates nucleus accumbens interneurons (Gruber et al., 2009b). 603 Interneurons account only for a minority of striatal neurons (Jiang and North, 1991), 604

28
and their direct contribution to local field potentials (and, thus, to the observed cortico-605 accumbens coherence) is therefore likely to be small. Taken together, intermediate 606 transmission via interneurons would agree with findings in rodents and could account 607 for the delay between surface EEG and LFP observed here. However, we note that our 608 estimation of the conduction delay should be treated with caution since it is based on 609 data of a single patient. Furthermore, previous studies have shown that delays 610 computed on the basis of phase differences may not correspond well to conduction 611 delays (Williams and Baker, 2009). 612
613 A role of low-frequency oscillations in the nucleus accumbens, in the range of theta 614 frequencies, in human decision-making has been proposed before. Cohen et al. (2009) 615 reported a transient increase in phase-synchronization at ~4-8 Hz approximately 250 616 to 550 ms after the outcome in a reversal learning task, both between the left and right 617 nucleus accumbens and between the nucleus accumbens and a frontal EEG electrode. In 618 contrast to this transient phenomenon (~1 cycle), we report cortico-accumbens 619 connectivity over much longer segments (1.5 to 2 seconds) and at lower frequencies (2-620 5 Hz) which, importantly, changes in strength and direction during action selection. The 621 cortical drive consistently observed during action selection in our study is in agreement 622 with a previous report of a Granger-causal influence of cortex on the nucleus accumbens 623 in humans (Cohen et al., 2012). However, that study focused on connectivity during 624 outcome anticipation in a task that had no action selection component, and found 625 connectivity across a broad frequency range (of up to 20 Hz, possibly due to a limited 626 frequency resolution, as the authors note). In contrast, we demonstrate an increase in 627

29
low-frequency coupling and a consistent cortical drive during the action selection stage 628 of our decision-making task. 629
630
Cortical sources involved in low-frequency coupling with the nucleus accumbens 631
We studied connectivity between surface EEG recorded at electrode Cz and LFP from 632 the nucleus accumbens. Given that surface EEG signals are subject to a high degree of 633 volume conduction and distortion of the electric field by the skull, EEG signals at central 634 sensors such as Cz likely contain components from widely distributed cortical sources. 635 We addressed the possibility of a substantial contribution of hippocampal signals, 636 recorded at surface electrodes, to the observed EEG/LFP connectivity in two patients 637 who had undergone unilateral resection of the medial temporal lobe in the past. Using 638 anterograde and retrograde tracer techniques, Friedman et al. (2002) demonstrated 639 that anatomical connections between the hippocampus and the nucleus accumbens in 640 macaque monkeys do not cross to the contralateral hemisphere. We are not aware of 641 any anatomical studies in humans that have addressed this issue. Assuming that these 642 results also hold in humans, we tested whether ipsilateral removal of the hippocampus 643 systematically reduced the observed EEG/LFP coherence. Since this was not the case, a 644 substantial hippocampal contribution seems unlikely. It is possible, however, that the 645 nucleus accumbens of the operated hemisphere is indirectly coupled with the 646 contralateral hippocampus, e.g. via coupling between the nucleus accumbens of each 647 hemisphere (Cohen et al., 2009). Note that a neocortical contribution to the observed 648 EEG/LFP connectivity does not imply that a single cortical source is consistently 649 involved. Indeed, we find differences in coupling between our resting-state data and the 650 task data, both in peak frequencies (which are slightly lower during the task) and in 651

30
direction (with a consistent cortical drive during the task, but not at rest). This may 652 indicate that slightly different cortical sources or neuronal populations are involved in 653 cortico-accumbens coupling as a function of the task. Future studies that combine high-654 density EEG or MEG with simultaneous DBS-recordings may reveal the precise cortical 655 topography of this coupling. 656
Limitations 657
Invasive recordings from the human nucleus accumbens are only available when there 658 is a clinical indication for DBS therapy. Here, we studied data recorded from patients 659 with epilepsy. All patients underwent video-EEG-monitoring, which documented a focal, 660 i.e., cortical, epileptogenic zone and excluded other epilepsy syndromes. In animal 661 models (Deransart et al., 2000) as well as in epilepsy patients (Schmitt et al., 2014), the 662 nucleus accumbens can be involved in seizure propagation. Accordingly, the clinical 663 rationale underlying DBS of the nucleus accumbens in epilepsy is a suppression of 664 seizure propagation, not of an epileptogenic focus. However, we cannot exclude the 665 possibility that the nucleus accumbens functions differently in these patients as 666 compared to healthy individuals. During recordings, patients were constantly under 667 supervision. No seizure was observed or reported in any case. In addition, no inter-ictal 668 epileptic activity was observed in the recorded data. Epileptic activity in the nucleus 669 accumbens as a potential confounding factor can therefore be excluded. 670
671
It is important to note that all six patients were on treatment with anticonvulsant drugs 672 during data acquisition (table 1). The predominant mechanisms of action of these drugs 673 consist either in a blockade of ion channels (LCM, LTG, ZNS, CBZ, OXC) and/or in an 674

31
interference with GABAergic neurotransmission (STP, Clozabam). While we cannot rule 675 out the possibility that these drugs changed cortico-accumbens connectivity, we note 676 that the heterogeneity in medication across patients (table 1) contrasts with the high 677 consistency of our findings. In particular, patients whose medication involved drugs 678 known to enhance or mimic GABAergic neurotransmission (especially Clobazam and 679 STP in P2, possibly also CBZ in P2 and P3) showed similar results as all other patients, 680 whose medication acts primarily via ion channels (LCM and LTG in patients P4, P5 and 681 P6; but see Cunningham & Jones, 2000, for a potential GABAergic enhancement by LTG, 682 although this has been questioned, see Braga, Anderjaska, Post, & Li, 2002). 683
684
Our study depends on a precise placement of DBS electrodes into the nucleus 685 accumbens. Despite high surgical expertise, we cannot fully exclude slight imprecision 686 in electrode placement. Since safety considerations forbid post-surgical MRI, the 687 location of the electrodes can only be assessed by combining pre-surgical MRI with 688 post-surgical computer tomography. Following this approach, coordinates of the most 689 ventral contacts in our study, averaged across all patients, are [7 6 -9] (right 690 hemisphere) and [-7 6 -9] (left hemisphere; normalized to MNI space). However, this 691 analysis is subject to some inaccuracy itself, since it relies on two separate imaging 692 techniques and data from two different days. 693
694
We cannot exclude the possibility that discrete structural changes to the nucleus 695 accumbens during electrode implantation, such as trauma or oedema, may have 696 influenced coherence and Granger causality spectra. Structural changes due to electrode 697

32
implantation are thought to be responsible for the so-called ‘stun effect’, i.e., a transient 698 amelioration of symptoms in some patients with Parkinson’s Disease in the first days 699 after DBS surgery, before the stimulator is switched on (e.g., Eusebio and Brown, 2009). 700 However, it is difficult to explain a frequency-specific task modulation, as demonstrated 701 in our study (figure 2), purely on the basis of such structural alterations. 702
703
In summary, we demonstrate highly consistent, oscillatory coupling between cortex and 704 the human nucleus accumbens at delta and low theta frequencies. During action 705 selection, this coupling turns into a cortical drive of delta oscillations in the nucleus 706 accumbens. In view of a similar coupling in rodents during instrumental behaviour, and 707 in light of the high consistency of our findings across subjects, cortico-accumbens delta 708 coupling may represent a highly conserved mechanism of regulating neuronal 709 excitability and, ultimately, action selection in the nucleus accumbens. 710
711
33
References 712
Berke JD, Okatan M, Skurski J, Eichenbaum HB. Oscillatory entrainment of striatal 713 neurons in freely moving rats. Neuron 43: 883–96, 2004. 714
Braga MFM, Anderjaska VA, Post RM, Li H. Lamotrigine reduces spontaneous and 715 evoked GABA A receptor-mediated synaptic transmission in the basolateral amygdala: 716 implications for its effects in seizure and affective disorders. Neuropharmacology 42: 717 522–529, 2002. 718
Calhoon GG, O’Donnell P. Closing the gate in the limbic striatum: prefrontal 719 suppression of hippocampal and thalamic inputs. Neuron 78: 181–90, 2013. 720
Cohen MX, Axmacher N, Lenartz D, Elger CE, Sturm V, Schlaepfer TE. Nuclei 721 accumbens phase synchrony predicts decision-making reversals following negative 722 feedback. J Neurosci Off J Soc Neurosci 29: 7591–8, 2009. 723
Cohen MX, Bour L, Mantione M, Figee M, Vink M, Tijssen M a J, van Rootselaar A-F, 724 van den Munckhof P, Schuurman PR, Denys D. Top-down-directed synchrony from 725 medial frontal cortex to nucleus accumbens during reward anticipation. Hum Brain 726 Mapp 33: 246–52, 2012. 727
Cunningham MO, Jones RS. The anticonvulsant, lamotrigine decreases spontaneous 728 glutamate release but increases spontaneous GABA release in the rat entorhinal cortex 729 in vitro. [Online]. Neuropharmacology 39: 2139–46, 2000. 730 http://www.ncbi.nlm.nih.gov/pubmed/10963757. 731
Deransart C, Riban V, Le B-T, Marescaus C, Depaulis A. Dopamine in the striatum 732 modulates seizures in a genetic model of absence epilepsy in the rat. Neursocience 100: 733 335–344, 2000. 734
Dhamala M, Rangarajan G, Ding M. Analyzing information flow in brain networks with 735 nonparametric Granger causality. Neuroimage 41: 354–62, 2008. 736
Eusebio A, Brown P. Synchronisation in the beta frequency-band - The bad boy of 737 parkinsonism or an innocent bystander? Exp Neurol 217: 1–3, 2009. 738
Friedman DP, Aggleton JP, Saunders RC. Comparison of hippocampal, amygdala, and 739 perirhinal projections to the nucleus accumbens: combined anterograde and retrograde 740 tracing study in the Macaque brain. J Comp Neurol 450: 345–65, 2002. 741
Goto Y, Grace A a. Limbic and cortical information processing in the nucleus 742 accumbens. Trends Neurosci 31: 552–8, 2008. 743
Grace AA. Gating of information flow within the limbic system and the pathophysiology 744 of schizophrenia. [Online]. Brain Res Rev 31: 330–41, 2000. 745 http://www.ncbi.nlm.nih.gov/pubmed/10719160. 746

34
Gruber AJ, Hussain RJ, O’Donnell P. The nucleus accumbens: a switchboard for goal-747 directed behaviors. PLoS One 4: e5062, 2009a. 748
Gruber AJ, Powell EM, O’Donnell P. Cortically activated interneurons shape spatial 749 aspects of cortico-accumbens processing. J Neurophysiol 101: 1876–82, 2009b. 750
Hart AS, Rutledge RB, Glimcher PW, Phillips PEM. Phasic dopamine release in the rat 751 nucleus accumbens symmetrically encodes a reward prediction error term. J Neurosci 752 34: 698–704, 2014. 753
Haufe S, Nikulin V V, Müller K-R, Nolte G. A critical assessment of connectivity 754 measures for EEG data: a simulation study. Neuroimage 64: 120–33, 2013. 755
Haufe S, Nikulin V V, Nolte G. Alleviating the Influence of Weak Data Asymmetries on 756 Granger-Causal Analyses. In: Latent Variable Analysis and Signal Separation: Lecture 757 Notes in Computer Science, edited by Theis F, Cichocki A, Yeredor A, Zibulevsky M. 2012, 758 p. 25–33. 759
Jiang BYZ, North RA. Membrane Properties and Synaptic Responses of Rat Striatal 760 Neurones in vitro. J Physiol 443: 533–553, 1991. 761
Kaplan R, Doeller CF, Barnes GR, Litvak V, Düzel E, Bandettini P a, Burgess N. 762 Movement-related theta rhythm in humans: coordinating self-directed hippocampal 763 learning. PLoS Biol 10: e1001267, 2012. 764
Litvak V, Eusebio A, Jha A, Oostenveld R, Barnes G, Foltynie T, Limousin P, Zrinzo 765 L, Hariz MI, Friston K, Brown P. Movement-related changes in local and long-range 766 synchronization in Parkinson’s disease revealed by simultaneous 767 magnetoencephalography and intracranial recordings. J Neurosci Off J Soc Neurosci 32: 768 10541–53, 2012. 769
McGinty VB, Grace A a. Timing-dependent regulation of evoked spiking in nucleus 770 accumbens neurons by integration of limbic and prefrontal cortical inputs. J 771 Neurophysiol 101: 1823–35, 2009. 772
Van der Meer M a a, Redish a D. Theta phase precession in rat ventral striatum links 773 place and reward information. J Neurosci 31: 2843–54, 2011. 774
Nicola SM. The nucleus accumbens as part of a basal ganglia action selection circuit. 775 Psychopharmacology (Berl) 191: 521–50, 2007. 776
Nolte G, Ziehe A, Nikulin V V, Schlögel A, Krämer N, Brismar T, Müller K-R. Robustly 777 estimating the flow direction of information in complex physical systems. Phys Rev Lett 778 100, 2008. 779
Oostenveld R, Fries P, Maris E, Schoffelen J-M. FieldTrip: Open source software for 780 advanced analysis of MEG, EEG, and invasive electrophysiological data. Comput Intell 781 Neurosci 2011: 156869, 2011. 782

35
Patel SR, Sheth S a, Mian MK, Gale JT, Greenberg BD, Dougherty DD, Eskandar EN. 783 Single-neuron responses in the human nucleus accumbens during a financial decision-784 making task. J Neurosci 32: 7311–5, 2012. 785
Pennartz CM a, Berke JD, Graybiel AM, Ito R, Lansink CS, van der Meer M, Redish a 786 D, Smith KS, Voorn P. Corticostriatal Interactions during Learning, Memory Processing, 787 and Decision Making. J Neurosci 29: 12831–8, 2009. 788
Penny WD, Friston KJ, Ashburner JT, Kiebel SJ, Nichols TE, editors. Statistical 789 Parametric Mapping: The Analysis of Functional Brain Images. Academic Press, 2011. 790
Peters YM, O’Donnell P, Carelli RM. Prefrontal cortical cell firing during maintenance, 791 extinction, and reinstatement of goal-directed behavior for natural reward. Synapse 56: 792 74–83, 2005. 793
Riddle CN, Baker SN. Manipulation of peripheral neural feedback loops alters human 794 corticomuscular coherence. J Physiol 566: 625–39, 2005. 795
Rosenberg JR, Amjad AM, Breeze P, Brillinger DR, Halliday DM. The Fourier 796 Approach to the Identification of Functional Coupling between Neuronal Spike Trains. 797 Prog Biophys molec Biol 53: 1–31, 1989. 798
Rutledge RB, Skandali N, Dayan P, Dolan RJ. A computational and neural model of 799 momentary subjective well-being. Proc. Natl. Acad. Sci. ( August 4, 2014). doi: 800 10.1073/pnas.1407535111. 801
Schmitt FC, Voges J, Heinze H-J, Zaehle T, Holtkamp M, Kowski AB. Safety and 802 feasibility of nucleus accumbens stimulation in five patients with epilepsy. J Neurol 261: 803 1477–84, 2014. 804
Schomer DL, Lopes da Silva F. Niedermeyer’s Electroencephalography: Basic Principles, 805 Clinical Applications, and Related Fields. 6th ed. Lippincott Williams & Wilkins, 2012. 806
Stam CJ, Nolte G, Daffertshofer A. Phase lag index: assessment of functional 807 connectivity from multi channel EEG and MEG with diminished bias from common 808 sources. Hum Brain Mapp 28: 1178–93, 2007. 809
Stuber GD. Cortical operation of the ventral striatal switchboard. Neuron 78: 6–7, 2013. 810
Sturm V, Lenartz D, Koulousakis A, Treuer H, Herholz K, Klein JC, Klosterkötter J. 811 The nucleus accumbens: a target for deep brain stimulation in obsessive–compulsive- 812 and anxiety-disorders. J Chem Neuroanat 26: 293–299, 2003. 813
Tabuchi ET, Mulder a B, Wiener SI. Position and behavioral modulation of 814 synchronization of hippocampal and accumbens neuronal discharges in freely moving 815 rats. Hippocampus 10: 717–28, 2000. 816
Tom SM, Fox CR, Trepel C, Poldrack R a. The neural basis of loss aversion in decision-817 making under risk. Science 315: 515–8, 2007. 818

36
Vinck M, Oostenveld R, van Wingerden M, Battaglia F, Pennartz CM a. An improved 819 index of phase-synchronization for electrophysiological data in the presence of volume-820 conduction, noise and sample-size bias. Neuroimage 55: 1548–65, 2011. 821
Voges J, Volkmann J, Allert N, Lehrke R, Koulousakis A, Freund H-J, Sturm V. 822 Bilateral high-frequency stimulation in the subthalamic nucleus for the treatment of 823 Parkinson disease: correlation of therapeutic effect with anatomical electrode position. J 824 Neurosurg 96: 269–79, 2002. 825
Walter DO. Spectral Analysis for Electroencephalograms: Mathematical Determination 826 of Neurophysiological Relationships from Records of Limited Duration. Exp Neurol 8: 827 155–181, 1963. 828
Williams ER, Baker SN. Circuits generating corticomuscular coherence investigated 829 using a biophysically based computational model. I. Descending systems. J Neurophysiol 830 101: 31–41, 2009. 831
Wilson GT. The Factorization of Matricial Spectral Densities. SIAM J Appl Math 23: 420–832 426, 1972. 833
Zaehle T, Bauch EM, Hinrichs H, Schmitt FC, Voges J, Heinze H-J, Bunzeck N. 834 Nucleus accumbens activity dissociates different forms of salience: evidence from 835 human intracranial recordings. J Neurosci 33: 8764–71, 2013. 836 837

37
Acknowledgements 838 We thank Christian Kluge and Dominik Bach for valuable suggestions regarding data 839 analysis and interpretation. This work was supported by the Wellcome Trust (Ray 840 Dolan Senior Investigator Award 098362/Z/12/Z). MPS was supported by a scholarship 841 from the German Research Foundation (Deutsche Forschungsgemeinschaft DFG, STE 842 2091/1-2). RBR was supported by the Max Planck Society. TZ, JV and HJH received 843 funding from the German Research Foundation (Deutsche Forschungsgemeinschaft, 844 Sonderforschungsbereich SFB-779 TPA2). The Wellcome Trust Centre for 845 Neuroimaging is supported by core funding from the Wellcome Trust 091593/Z/10/Z. 846 The authors declare no competing financial interests. 847

38
Tables 848
849
850
851
852
Table 1. Patient data. 853
ID
gender/age/ disease duration
(years) epilepsy syndrome etiology seizure
lateralisationseizure onset AED surface EEG
(resting-state/ task)
P1 M /41/12 multifocal cryptogenic bilateral fronto-temporal LCM 400 mg ZNS 400 mg FCz, Cz/ Oz, Fpz, Cz P2 M/32/31 multifocal genetic (SCNA1) left, possibly bilateral bifrontal and left medio-temporal
OXC 900 mg Clobazam 5 mg STP 4500 mg T1, T2, Fpz, Oz, Cz/Oz, Fpz, Cz, POz P3 F/44/30 multifocal hippocampal sclerosis* bilateral temporal CBZ 1200 mg Oz, Fpz, Cz/ Oz, Fpz, Cz P4 M/40/31 focal left hippocampal sclerosis† left temporal LTG 400 mg LCM 400 mg Oz, Fpz, Cz/ Oz, Fpz, Cz P5 F/28/12 multifocal cryptogenic bilateral temporal LTG 200 mg LCM 200 mg Fpz, Cz/ no task data P6 F/52/17 focal cryptogenic left temporal LTG 250 mg LCM 400 mg no resting-state data/Oz, Fpz, Cz LCM – Lacosamide; ZNS – Zonisamide; OXC – Oxcarbazepine; STP – Stiripentol; CBZ – 854 Carbamazepine; LTG – Lamotrigine; 855 *underwent right temporal lobe resection 3 years before DBS surgery 856 †underwent left temporal lobe resection 9 years before DBS surgery 857

39
Figure legends 858
859
Figure 1 Coherence, phase-synchronization and Granger causality between cortex 860
(EEG surface electrode at Cz) and the nucleus accumbens in resting-state data. 861 Each row shows data for one of the five patients (P1 to P5). All x-axes represent 862 frequency in Hz. The light grey vertical shading indicates frequency bins at which the 863 original spectrum (black line) is significantly different from the trial-shuffled spectra (A 864 and B) or the time-reversed spectrum (C, dotted line). The dark grey shading in A and B 865 corresponds to two standard deviations around the mean of the trial-shuffled spectra. 866 Numbers next to peaks correspond to peak frequencies. A, Coherence and B, the 867 weighted phase-lag index (wPLI), a measure of (non-zero) phase-synchronization, for 868 all six patients. In C, the left column shows Granger causality spectra representing a 869 cortical drive of the nucleus accumbens, while the right column shows coupling in the 870 opposite direction (nucleus accumbens leading cortex). All patients show significant 871 peaks in the coherence- and wPLI spectra at low (delta and theta) frequencies (A and B). 872 The direction of cortico-accumbens coupling at rest varies across patients (C). 873
874
Figure 2 Coherence and Granger causality between cortex (Cz) and the nucleus 875
accumbens during the decision-making task. A, Schematic of one trial of the task 876 with distinct task stages (all intervals are equal to 1.5 seconds in duration). ITI, inter-877 trial interval. B, Coherence as a function of frequency during all four stages of the task, 878 colour-coded as in A (black: baseline/ITI, red: decision stage, green: anticipation stage, 879 blue: outcome stage). Coherence is significantly enhanced during the decision stage as 880

40
compared to baseline in three patients (P2, P3 and P6). Numbers next to peaks 881 correspond to peak frequencies. Each row shows data for one of the five patients (P1 to 882 P6). C, Granger causality spectra for the decision stage of the task. As in figure 1, C, the 883 left column shows a Granger causal influence of cortex on the nucleus accumbens, while 884 the right column shows coupling in the opposite direction (nucleus accumbens leading 885 cortex). The dotted line shows Granger causality after reversing the time axis at all 886 channels. The grey vertical shading indicates frequency bins at which the original 887 spectrum (black line) is significantly greater than the spectrum computed after 888 reversing the time axis. Four of the five patients show a significant cortical drive of delta 889 oscillations in the nucleus accumbens (trend in P3). 890
891
Figure 3 Coherence between cortex (Cz) and the nucleus accumbens, separately 892
for each hemisphere, both at rest and during the decision stage of the task. In all 893 plots, the dotted line represents coherence spectra between cortex and the right 894 nucleus accumbens, and the solid line corresponds to coherence with the left nucleus 895 accumbens. A, Coherence at rest. B, Coherence during the decision stage of the task. The 896 boxes mark the two patients (P3 and P4) who had undergone resection of the right (P3) 897 and left (P4) medial temporal lobe in the past. Cortico-accumbens coherence is not 898 altered systematically by unilateral resection of the hippocampus (P3 and P4). 899
900 901

frequency [Hz]
ph
ase-s
yn
ch
ron
izati
on
(w
PL
I)
Gra
ng
er
cau
sality
co
here
nce
P1 P1
P2 P2
P3 P3
P4 P4
P5 P5
P1
P2
P3
P4
P5
Cz AC AC CzCBA
2.5 Hz
5 Hz
5 Hz
4 Hz
3 Hz
4 Hz
3.5 Hz
7.5 Hz
4 Hz
5 Hz
3 Hz

5 10 15
0.1
0.3
frequency
5 10 15
0.1
0.3
frequency
5 10 15
0.1
0.3
frequency
5 10 15
0.1
0.3
frequency
5 10 15
0.1
0.3
frequency
ITIdecision antici-
pation outcome
A
B C Cz CzAC AC
frequency [Hz]
co
he
ren
ce
Gra
ng
er
ca
us
ali
ty
P1P1
P2
P2
P3
P3
P4
P4
P6
P6
2 Hz
2.5 Hz
5.5 Hz
2 Hz
(2 Hz)
2 Hz2.5 Hz
2 Hz
2 Hz
1.5 Hz

5 10 15
0.1
0.3
0.5
co
he
ren
ce
frequency
5 10 15
0.1
0.3
0.5
co
he
ren
ce
frequency
5 10 15
0.1
0.3
0.5
co
he
ren
ce
frequency
5 10 15
0.1
0.3
0.5
co
he
ren
ce
frequency
5 10 15
0.1
0.3
0.5
co
he
ren
ce
frequency
5 10 15
0.1
0.3
0.5
co
he
ren
ce
frequency
5 10 15
0.1
0.3
0.5
co
he
ren
ce
frequency
5 10 15
0.1
0.3
0.5
co
he
ren
ce
frequency5 10 15
0.1
0.3
0.5
co
he
ren
ce
frequency
5 10 15
0.1
0.3
0.5
co
he
ren
ce
frequency
P1
P1
P2
P2
P3
P3
P4
P4
P5
P6
co
he
ren
ce
frequency [Hz]
right temporallobe resection
left temporal lobe resection
restin
g-s
tate
decis
ion
sta
ge (ta
sk)c
oh
ere
nc
e
A
B
left nucleus accumbens
right nucleus accumbens