correspondence analysis application
TRANSCRIPT

CONFIDENTIAL © 2014 PAREXEL INTERNATIONAL CORP.
CORRESPONDENCE ANALYSIS APPLICATION IN CLASS COMPARISON STUDIES PhUSE London 2014
Edyta Winciorek

© 2014 PAREXEL INTERNATIONAL CORP. / CONFIDENTIAL2
AGENDA
FROM GENE EXPRESSION TO EXPRESSION CARTOGRAPHY
1. MICROARRAY GENE EXPRESSION PROFILE –PRELIMINARIES
2. TYPES OF DNA MICROARRAY EXPERIMENTS
3. EXAMPLE -CORRESPONDENCE ANALYSIS APPLICATION IN CLASS COMPARISON STUDIES
4. CONCLUSION
© 2014 PAREXEL INTERNATIONAL CORP. / CONFIDENTIAL3
LONDON, U.K.
MICROARRAY GENE EXPRESSION PROFILEPRELIMINARIES

© 2014 PAREXEL INTERNATIONAL CORP. / CONFIDENTIAL4
HYBRIDIZATION
Hybridization is the process of joining two complimentary strands of DNA or one of DNA and RNA to form a double-stranded molecule.DNA double-stranded structure is
formed through the hybridization of these complementary singlestranded chains.
Given these characteristics, it is possible to detect a target gene by hybridizing it with DNA that has a complementary sequence.
Source: http://www.olympus-global.com/en/news/2000b/nr000926oligoe.jsp

© 2014 PAREXEL INTERNATIONAL CORP. / CONFIDENTIAL5
DNA ARRAY
glass slide where single-stranded DNA (calledprobe) with various sequences are printed on the surface of the substrate in a localized features that are arranged in a grid-like pattern.
Extract and isolate mRNA from the subject tissues or cells
Reverse transcribed mRNA to givenunique cDNA population
Embed population onto specially coated glass slides
The slides are coated with positivelycharged polysine. DNA is negativelycharged, so that cDNA stick to theslide through an ionic interaction.
Source: http://www.dnalc.org/view/15992-DNA-microarrays.html

© 2014 PAREXEL INTERNATIONAL CORP. / CONFIDENTIAL6
SAMPLE PREPARATION AND LABELLING
The cDNA from ill tissue (e.g. tumor) are labelled with red fluorescent tag
Cyanine 5 (Cy5).
The cDNA from normal(reference) tissue are labelled with
green tag Cyanine 3 (Cy3).
Tagged cDNA arrays are incubated, which bound the matching genes printed on the arrays.
If the gene is expressed only in tumour cells, the sequence is red.
If the gene is expressed only in normal cells, the
sequence is green.
If the gene is expressed in both cells, the sequence is yellow.
Source: Jon Pollack 2011: Microarrays and Analysis of Hybridization Data , Genomic Medicine.

© 2014 PAREXEL INTERNATIONAL CORP. / CONFIDENTIAL7
GENE EXPRESSION
The next step after hybridization is to generate an image using laser-induced fluorescent imaging.
Such created image is finally transformed
into numbers and
will be the basis of
the statistical analysis.
The amount of fluorescence measured at each sequence specific location is directly proportional to the amount of mRNA with complementary sequence present in the sample analyzed
Source: Jon Pollack 2011: Microarrays and Analysis of Hybridization Data , Genomic Medicine.

© 2014 PAREXEL INTERNATIONAL CORP. / CONFIDENTIAL8
I genes and J hybridizations are collected into the IxJmatrix N with elements nij -the gene expression level for each gene Gi in hybridizations Hj.
GENE EXPRESSION MATRIX
H1 H2 H3 H4 … Hj
normalized geneexpression levels
sample annotation
geneidentifires
Gene expression matrix needs to be preprocessed, for example the logarithm of the raw intensity values is taken or normalization of data is performed.

© 2014 PAREXEL INTERNATIONAL CORP. / CONFIDENTIAL9
LONDON, U.K.
TYPES OF DNAMICROARRAYEXPERIMENTS
© 2014 PAREXEL INTERNATIONAL CORP. / CONFIDENTIAL10
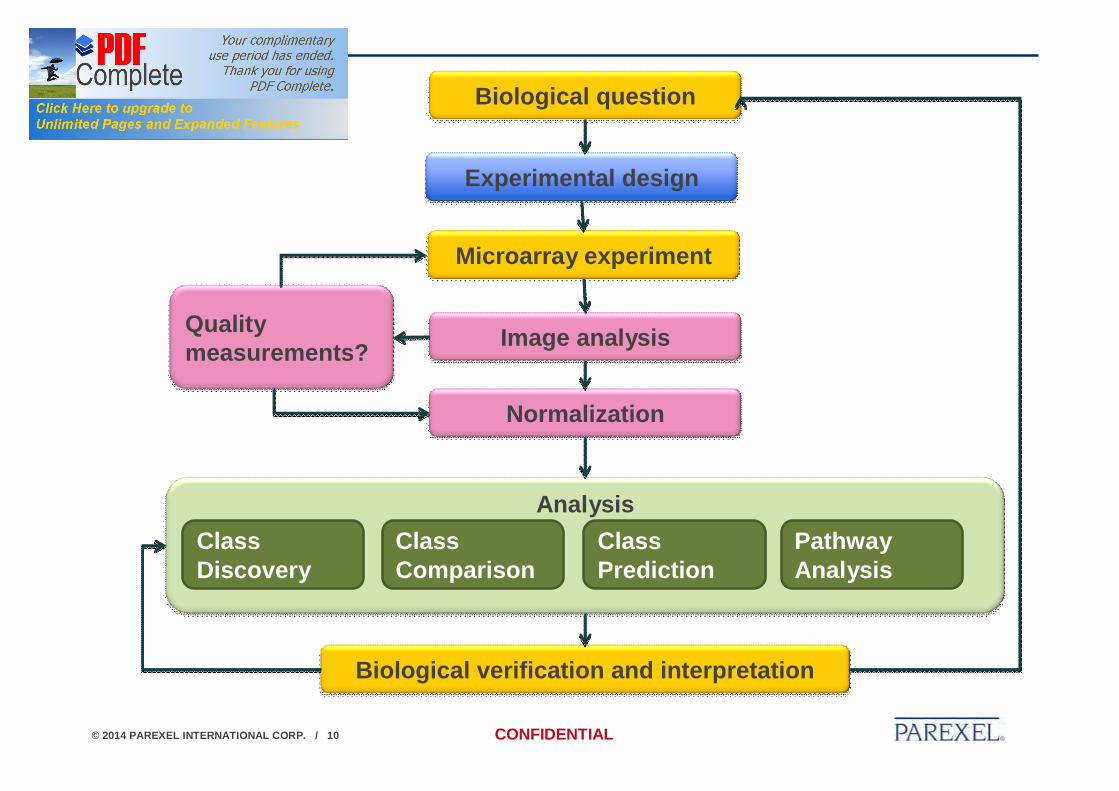
Biological question
Experimental design
Analysis
Microarray experiment
Image analysis
Normalization
Biological verification and interpretation
Quality measurements?
Class Discovery
Class Prediction
Pathway Analysis
Class Comparison

© 2014 PAREXEL INTERNATIONAL CORP. / CONFIDENTIAL11
CLASS DISCOVERY (CLUSTERING)
Discovery of co-regulated groups of genes of 2 types of patients A and B.
Identification of the genes that are similarly expressed.
Unsupervised machine learning method such as hierarchical clustering, k-means clustering or self-organizing maps.
Detection of spatial or temporal expression patterns.
Dimension reduction of the gene expression matrix.
Source: Tarca, A. L., Romero, R., Draghici, S. (2006). Analysis of microarray experiments of geneexpression profiling. American journal of obstetrics, 195, no. 2, 373–388.

© 2014 PAREXEL INTERNATIONAL CORP. / CONFIDENTIAL12
CLASS PREDICTION (CLASSIFICATION)
Determine mathematical model well describing the classification rule used to distinguish the pre-defined classes.
Estimate the parameters of the mathematical function used in this model.
Estimate the accuracy of the predictor.
Class Prediction example: assignment of type to a new sample of gene expression matrix.
Identification the sample’s class membership basing on its gene expression profile using supervised machine learning method such as discriminantanalysis.
Source: Sánchez, A. and Ruíz de Villa, M. (2008). A Tutorial Review of Microarray Data Analysis

© 2014 PAREXEL INTERNATIONAL CORP. / CONFIDENTIAL13
PATHWAY ANALYSISBiological interpretation of the list of genes selected in microarray analysis experiment.
Gene functional association networks for selected pathways.
Gene functional association network: Node color reflects expression changes in microarray. Red: upregulatedexpression. Green: downregulatedexpression. Gray: not covered by microarray data.
Source: Zhaoyuan Fang, Weidong Tian and Hongbin Ji 2011: A network-based gene-weighting Approach for pathway analysis.

© 2014 PAREXEL INTERNATIONAL CORP. / CONFIDENTIAL14
CLASS COMPARISON (DIFFERENTIAL ANALYSIS)Comparison of the gene expression levels of gens between groups of patients using such methodology as Student’s t-test, ANOVA, survivalanalysis, PCA, Correspondence Analysis. .
Distinction of Tumor vs. Normal1 000 genes .
Source: Jon Pollack 2011: Microarrays and Analysis of Hybridization Data , Genomic Medicine

© 2014 PAREXEL INTERNATIONAL CORP. / CONFIDENTIAL15
LONDON, U.K.
CORRESPONDENCEANALYSIS

© 2014 PAREXEL INTERNATIONAL CORP. / CONFIDENTIAL16
CORRESPONDENCE ANALYSIS
n gene profiles:vectors in m-dimensional
experiment space
m hybridisation profiles:vectors in n-dimensional
experiment space
Projection into a common subspace oflow dimensionality for visualisation
Projection into a common subspace oflow dimensionality for visualisation
Visualisation of hybridisations and genes at the same time
Visualisation of hybridisations and genes at the same time
Reveals interdependencies (correspondence) betweenhybridisations and genes
Reveals interdependencies (correspondence) betweenhybridisations and genes

© 2014 PAREXEL INTERNATIONAL CORP. / CONFIDENTIAL17
H1 H2 H3 H4 … HjThe hybridizations are represented in n-dimensional gene space (heren=3). The plane is selected such that the distance of hybridization vectors to the plane is minimal, thus conserving point-to-point distances among those vector points as well as possible.
CORRESPONDENCE ANALYSIS
Genes and tissues are typically classified using correlations of grossexpression level. Thenet relationship between a pair of genes may be measured by partial correlation.

© 2014 PAREXEL INTERNATIONAL CORP. / CONFIDENTIAL18
PROC CORRESPTABLES statement instructs PROC CORRESP to create a contingency table from raw, categorical data.
VAR statement instructs PROC CORRESP to read an existing contingency table.
ID statement (only with VAR statement) labels the rows of the tables with the ID values and places the IDvariable in the output data set.
BY statement separate analyses on observations in groups defined by the BY variables.
WEIGHT Statement specifies weights for each observation and indicates supplementary observations for simple correspondence analyses with VAR statement input.
SUPPLEMENTARY statement specifies variables that are to be represented as points in the joint row and column space but that are not used in determining the locations of the other, active row and column points of the contingency table.

© 2014 PAREXEL INTERNATIONAL CORP. / CONFIDENTIAL19
EXAMPLE - Alon et al. (1999): series of 62 AffimetrixGeneChip experiments upon normal (N) and cancerous (T) colon tissue.
The total χ2-statistic, which is a measure of the association between the rows and columns is 5008.79 and is explained equally for both the dimensions – i.e. about 53.27% explain Dimension 1 and 46.73% explain Dimension 2. This indicates that the association between the row and column categories is essentially two dimensional.

© 2014 PAREXEL INTERNATIONAL CORP. / CONFIDENTIAL20
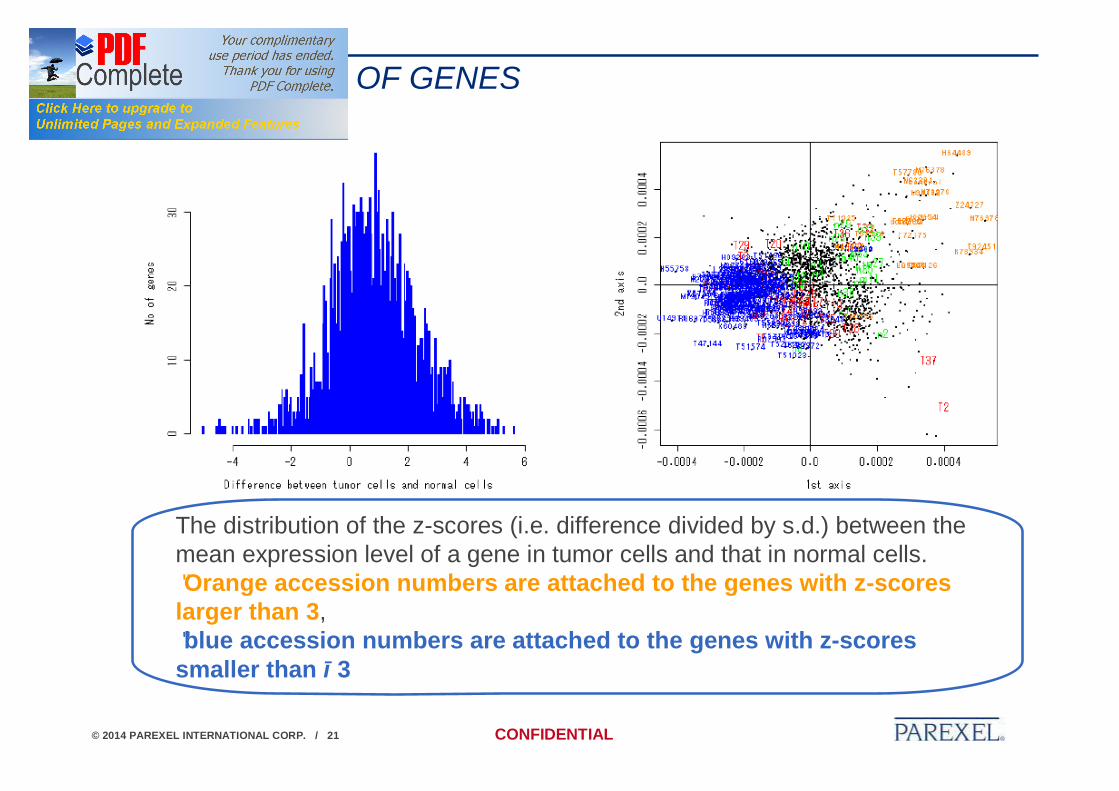
SCATTER PLOT OF GENES
Tissues T33 and n39 are located close together, althoughthey are of different tissue types and from different individuals.
The distant pair of T33 and T26 shows a low correlation of gene expression, although they are of the same tissue type
The normal cells are mostly distributed in the upper-right region, whereas the tumor cells are distributed in the lower-left region, so the visualseparation is moderately good.
© 2014 PAREXEL INTERNATIONAL CORP. / CONFIDENTIAL21
DISTRIBUTION OF GENES
The distribution of the z-scores (i.e. difference divided by s.d.) between the mean expression level of a gene in tumor cells and that in normal cells. •Orange accession numbers are attached to the genes with z-scores larger than 3, •blue accession numbers are attached to the genes with z-scores smaller than −3

© 2014 PAREXEL INTERNATIONAL CORP. / CONFIDENTIAL22
CONCLUSION
CORRESPONDENCEANALYSIS:
No parametrisation needed.
Projection into a commonsubspace hybridisations and genes.
The result of experiments can be used in medicine for comparing clinically relevant groups (e.g., healthy vsdiseased).
MICROARRAYS DNA EXPERIMENTS :
Enables the researchers tomonitor the expression levels of thousands of genessimultaneously.
Expression matrix can be used to detect the new subclasses of diseases, protect clinically important outcomes, such as the response to therapy and survival.
Problem: large number of genes vs. relatively small number of experiments.
Dimensionality reduction.

© 2014 PAREXEL INTERNATIONAL CORP. / CONFIDENTIAL23
THANK YOU
© 2014 PAREXEL INTERNATIONAL CORP. / CONFIDENTIAL23