correlation of corneal thickness and volume with intraoperative phacoemulsification parameters...
TRANSCRIPT
ARTICLE
Q 2014 ASC
Published by
Correlation of corneal thicknessand volume with intraoperative
phacoemulsification parameters usingScheimpflug imaging and optical
coherence tomographyMelissa M. Wong, MD, Anita N. Shukla, MD, Wuqaas M. Munir, MD
RS an
Elsev
PURPOSE: To evaluate post-phacoemulsification corneal edema using central corneal thickness (CCT)and central corneal volume (CCV) derived from Scheimpflug imaging, optical coherence tomography(OCT), and ultrasound (US) pachymetry and to correlate CCV with phacoemulsification parameters.
SETTING: Department of Ophthalmology, Boston Medical Center, Boston, Massachusetts, USA.
DESIGN: Prospective case study.
METHODS: Scheimpflug imaging (Pentacam HR), OCT (Cirrus HD-OCT), and US pachymetry(Pachmate) were used to measure the CCT, CCV, and phacoemulsification parameters afteruneventful phacoemulsification over a 1-month follow-up.
RESULTS: In the 16 eyes assessed, the Scheimpflug CCT was less than the US CCT preoperatively(PZ.01) and 1 week postoperatively (PZ.02). The OCT CCT was less than the US CCT at 1 weekand 1 month (both P<.01). At 3.0 mm, the CCV was increased at 1 day and 1 week (both P<.01) butreturned to preoperative levels by 1 month (PZ.09). However, the 7.0 mm CCV remained elevatedat 1 month (P<.01). There were strong correlations between the change in the 7.0 mm CCV and theestimated fluid used (r Z 0.76) and phacoemulsification time (r Z 0.61).
CONCLUSIONS: Scheimpflug imaging andOCTunderestimated theCCT innormal eyes comparedwithUS pachymetry, with a trend toward thicker measurements in acutely edematous corneas. Althoughthe CCV returned to preoperative values at 1 month, the peripheral cornea remained edematous,possibly because of a correlation with the estimated amount of fluid used and phacoemulsificationtime.
Financial Disclosure: No author has a financial or proprietary interest in any material or methodmentioned.
J Cataract Refract Surg 2014; 40:2067–2075 Q 2014 ASCRS and ESCRS
Cataract surgery leads to corneal edema,1 which canaffect visual acuity and intraocular pressure (IOP)measurement and can limit examination of otherocular structures. Significant corneal edema can limitpatient functioning and may also require morefrequent applications of antiinflammatory agents. His-torically, ultrasound (US) pachymetry has been usedto quantify corneal edema.2 However, limitations ofUS pachymetry are that it can measure 1 dimensionof corneal thickness only and it measures the thickness
d ESCRS
ier Inc.
in 1 focal area only. In addition, the measurement isperformed with a contact probe, which can be affectedby the location of contact and the amount of indenta-tion by the probe. New technology, such as Scheim-pflug imaging and optical coherence tomography(OCT), provide additional measurements of thecornea. These include corneal thickness, corneal curva-ture, anterior and posterior surface curvatures andelevations, calculated corneal power, and cornealvolume. They also allow one to recreate tomographic
http://dx.doi.org/10.1016/j.jcrs.2014.03.031 20670886-3350

2068 CORRELATION OF CCT AND CCV WITH INTRAOPERATIVE PHACOEMULSIFICATION PARAMETERS
images of many structures in the anterior segment.In addition, both methods are noncontact, likelyincreasing the safety of postoperative measurements.
Several studies3–8 have compared the repeatability ofcentral corneal thickness (CCT) measurements usingvarious techniques. Others have compared the validityof OCT, Scheimpflug imaging, and other techniqueswith standard US pachymetry in normal eyes.Although CCT measurements using different instru-ments in normal eyes are often comparable, they shouldnot be used interchangeably.9,10 O'Donnell et al.11
found reasonable agreement inCCT and anterior cham-ber depth measurements between a Scheimpflugcamera and an optical low-coherence reflectometry(OLCR) device. They found poorer agreement betweenOLCR and OCT. Central corneal thickness measure-ments have been assessed in eyes with ocular pathol-ogy, such as glaucoma,12 and in eyes after refractivesurgery.13,14 Few studies have examined corneal pa-rameters in the abnormal setting of postoperativeedema after cataract surgery.15–18
Other benefits of the new instruments include theability to measure corneal volume. Central cornealvolume (CCV) correlates with corneal thickness andpower and can affect several important clinical factors,including refraction and IOP. Suzuki et al.19 used aScheimpflug camera to evaluate the correlationbetween endothelial cell density (ECD) after phaco-emulsification and the corneal volume at the 3.0 mmand 10.0 mm diameters. Although they found no cor-relation between ECD and corneal volume, they didnote that the 3.0 mm CCV had returned to preopera-tive values by 1 month postoperatively whereas the10.0 mm CCV remained significantly higher thanpreoperatively. Zeng et al.20 performed a prospectiverandomized study evaluating phacoemulsificationwith varying torsional modalities and found that theamount of intraoperative US torsional energy corre-sponded to the postoperative visual acuity, CCT,and mean corneal endothelial cell loss.
Despite these studies, it is not well known whethernoncontact pachymetry is reliable in the edematous
Submitted: November 15, 2013.Final revision submitted: February 14, 2014.Accepted: March 3, 2014.
From the Department of Ophthalmology, Boston Medical Center,Boston, Massachusetts, USA.
Presented at the ASCRS Symposium on Cataract, IOL andRefractive Surgery, Chicago, Illinois, USA, April 2012.
Corresponding author: Wuqaas M. Munir, MD, 419 W RedwoodStreet, Suite 470, Baltimore, Maryland 21043, USA. E-mail:[email protected].
J CATARACT REFRACT SURG - V
cornea, with reports limited to the context of cornealrefractive surgery.21,22 Given that pachymetric data areoften most clinically useful in pathologic settings, weevaluated noncontact pachymetry after cataract surgery.In addition, we included only surgeries performed bysenior ophthalmology residents, which would likely beassociated with more postoperative corneal edema thansurgery performed by more experienced physicians.
We thus sought to compare the accuracy ofScheimpflug imaging and OCT with the current goldstandard of US pachymetry in the measurement ofCCT in eyes having cataract surgery. We also exam-ined 3 CCV zones (3.0 mm, 5.0 mm, and 7.0 mm) todetermine the evolution of the changes in CCV afterphacoemulsification. Finally, we studied the correla-tion between intraoperative phacoemulsificationparameters and postoperative pachymetric andcorneal volume data.
PATIENTS AND METHODS
This prospective study evaluated eyes having cataract sur-gery at Boston Medical Center, Boston, Massachusetts,USA. The center's institutional review board reviewed thestudy. All patients provided informed consent.
Patients were diagnosed with cataract and had phaco-emulsification with subsequent posterior capsule intraoc-ular lens (IOL) implantation. Surgeries were performedby a senior ophthalmology resident with the sameattending surgeon (W.M.M.). Eyes with preexisting oculardisease such as retinal pathology, complex surgeriesrequiring the use of iris or capsule support devices, or sur-geries with retained lens fragments or other complicationswere excluded.
Surgical Technique
Topical anesthesia or peribulbar anesthesia was adminis-tered with the use of monitored anesthesia care. Cyclopento-late 1.0%, phenylephrine 2.5%, and tropicamide 0.5% wereinstilled to dilate the pupils before surgery. The eyes and sur-rounding adnexa were cleansed with povidone–iodine 5.0%solution. Trypan blue was used as needed on a case-by-casebasis. A dispersive ophthalmic viscosurgical device (OVD)(sodium hyaluronate 3.0%–chondroitin sulfate 4.0%[Viscoat]) was injected into the anterior chamber. A 2.75 mmtriplanar clear corneal incision (CCI) was created, followedby a manual continuous curvilinear capsulorhexis.
Phacoemulsification of the cataractous lens was per-formed using the Infiniti Vision System (Alcon Laboratories,Inc.). Remaining cortical material was removed with irriga-tion/aspiration. The capsular bag was refilled with a cohe-sive OVD (sodium hyaluronate 1.0% [Provisc]), and anAcrysof SN60WF aspheric IOL (Alcon Laboratories, Inc.)was injected into the capsular bag using a C cartridge.Corneal wounds were closed in a sutureless fashion withstromal hydration of the lateral wound walls.
Measurements
The CCT was measured using a Scheimpflug camera(Pentacam HR, Oculus Optikger€ate GmbH), OCT system
OL 40, DECEMBER 2014
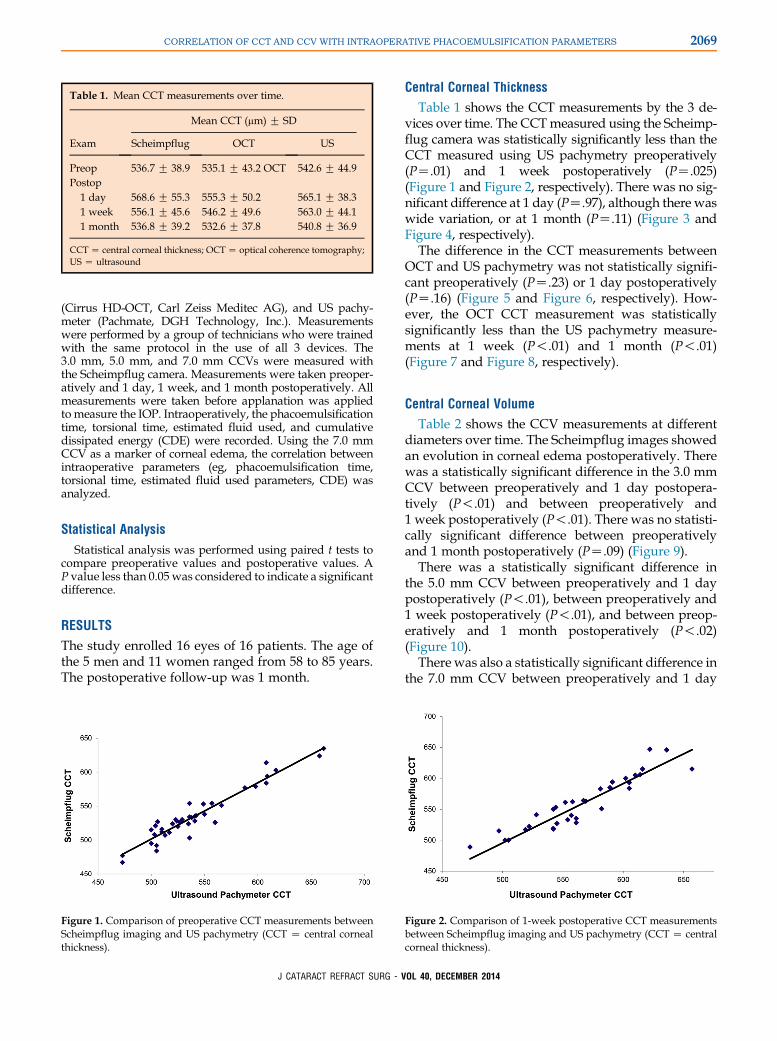
Table 1. Mean CCT measurements over time.
Exam
Mean CCT (mm) G SD
Scheimpflug OCT US
Preop 536.7 G 38.9 535.1 G 43.2 OCT 542.6 G 44.9Postop
1 day 568.6 G 55.3 555.3 G 50.2 565.1 G 38.31 week 556.1 G 45.6 546.2 G 49.6 563.0 G 44.11 month 536.8 G 39.2 532.6 G 37.8 540.8 G 36.9
CCTZ central corneal thickness; OCTZ optical coherence tomography;US Z ultrasound
2069CORRELATION OF CCT AND CCV WITH INTRAOPERATIVE PHACOEMULSIFICATION PARAMETERS
(Cirrus HD-OCT, Carl Zeiss Meditec AG), and US pachy-meter (Pachmate, DGH Technology, Inc.). Measurementswere performed by a group of technicians who were trainedwith the same protocol in the use of all 3 devices. The3.0 mm, 5.0 mm, and 7.0 mm CCVs were measured withthe Scheimpflug camera. Measurements were taken preoper-atively and 1 day, 1 week, and 1 month postoperatively. Allmeasurements were taken before applanation was appliedtomeasure the IOP. Intraoperatively, the phacoemulsificationtime, torsional time, estimated fluid used, and cumulativedissipated energy (CDE) were recorded. Using the 7.0 mmCCV as a marker of corneal edema, the correlation betweenintraoperative parameters (eg, phacoemulsification time,torsional time, estimated fluid used parameters, CDE) wasanalyzed.
Statistical Analysis
Statistical analysis was performed using paired t tests tocompare preoperative values and postoperative values. AP value less than 0.05 was considered to indicate a significantdifference.
RESULTS
The study enrolled 16 eyes of 16 patients. The age ofthe 5 men and 11 women ranged from 58 to 85 years.The postoperative follow-up was 1 month.
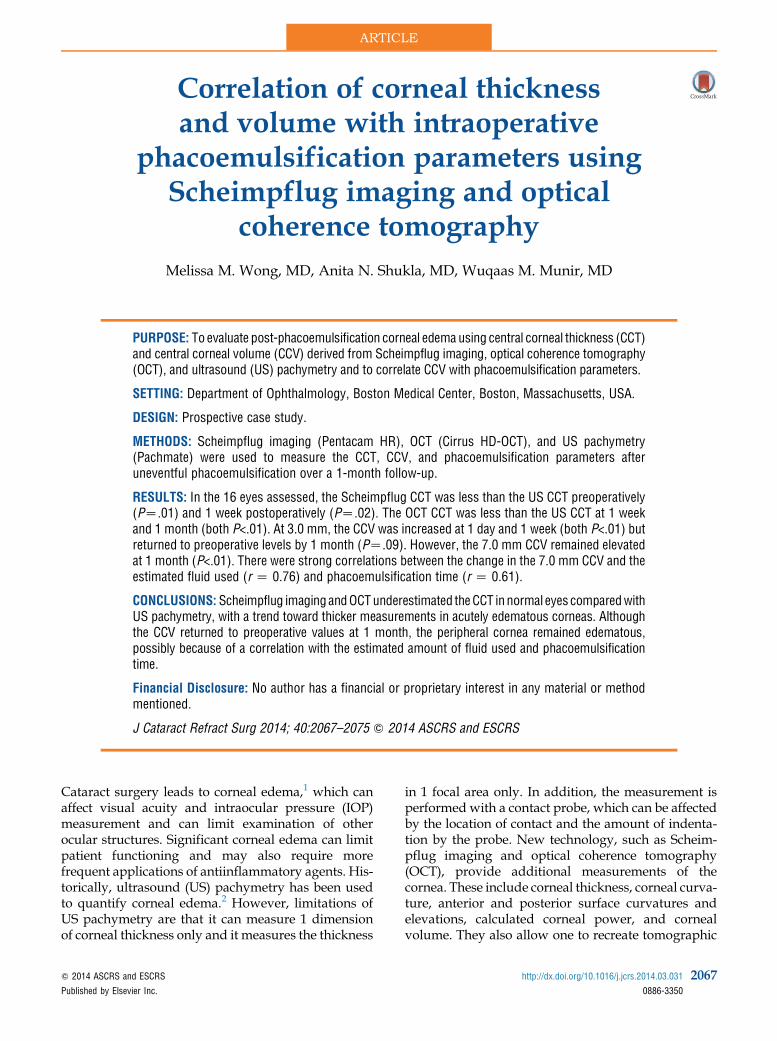
Figure 1. Comparison of preoperative CCT measurements betweenScheimpflug imaging and US pachymetry (CCT Z central cornealthickness).
J CATARACT REFRACT SURG - V
Central Corneal Thickness
Table 1 shows the CCT measurements by the 3 de-vices over time. The CCTmeasured using the Scheimp-flug camera was statistically significantly less than theCCT measured using US pachymetry preoperatively(PZ.01) and 1 week postoperatively (PZ.025)(Figure 1 and Figure 2, respectively). There was no sig-nificant difference at 1 day (PZ.97), although there waswide variation, or at 1 month (PZ.11) (Figure 3 andFigure 4, respectively).
The difference in the CCT measurements betweenOCT and US pachymetry was not statistically signifi-cant preoperatively (PZ.23) or 1 day postoperatively(PZ.16) (Figure 5 and Figure 6, respectively). How-ever, the OCT CCT measurement was statisticallysignificantly less than the US pachymetry measure-ments at 1 week (P!.01) and 1 month (P!.01)(Figure 7 and Figure 8, respectively).
Central Corneal Volume
Table 2 shows the CCV measurements at differentdiameters over time. The Scheimpflug images showedan evolution in corneal edema postoperatively. Therewas a statistically significant difference in the 3.0 mmCCV between preoperatively and 1 day postopera-tively (P!.01) and between preoperatively and1 week postoperatively (P!.01). There was no statisti-cally significant difference between preoperativelyand 1 month postoperatively (PZ.09) (Figure 9).
There was a statistically significant difference inthe 5.0 mm CCV between preoperatively and 1 daypostoperatively (P!.01), between preoperatively and1 week postoperatively (P!.01), and between preop-eratively and 1 month postoperatively (P!.02)(Figure 10).
There was also a statistically significant difference inthe 7.0 mm CCV between preoperatively and 1 day
Figure 2. Comparison of 1-week postoperative CCT measurementsbetween Scheimpflug imaging and US pachymetry (CCT Z centralcorneal thickness).
OL 40, DECEMBER 2014
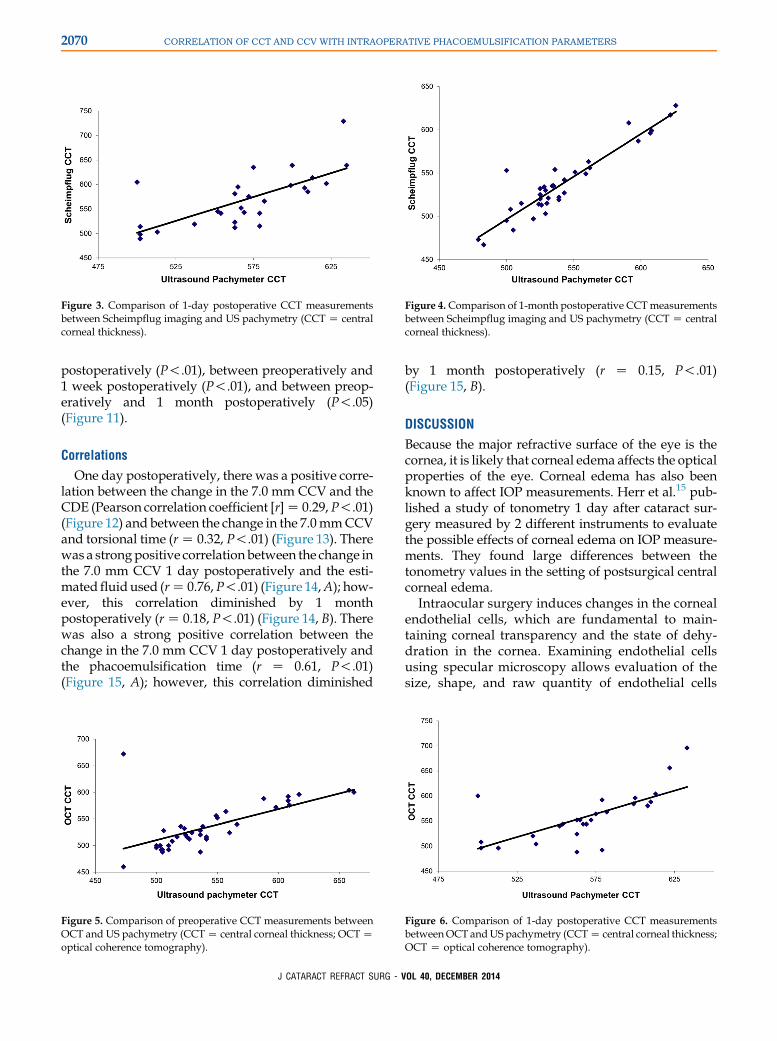
Figure 3. Comparison of 1-day postoperative CCT measurementsbetween Scheimpflug imaging and US pachymetry (CCT Z centralcorneal thickness).
Figure 4.Comparison of 1-month postoperative CCTmeasurementsbetween Scheimpflug imaging and US pachymetry (CCT Z centralcorneal thickness).
2070 CORRELATION OF CCT AND CCV WITH INTRAOPERATIVE PHACOEMULSIFICATION PARAMETERS
postoperatively (P!.01), between preoperatively and1 week postoperatively (P!.01), and between preop-eratively and 1 month postoperatively (P!.05)(Figure 11).
Correlations
One day postoperatively, there was a positive corre-lation between the change in the 7.0 mm CCV and theCDE (Pearson correlation coefficient [r]Z 0.29,P!.01)(Figure 12) and between the change in the 7.0mmCCVand torsional time (rZ 0.32, P!.01) (Figure 13). Therewas a strongpositive correlation between the change inthe 7.0 mm CCV 1 day postoperatively and the esti-mated fluid used (rZ 0.76,P!.01) (Figure 14,A); how-ever, this correlation diminished by 1 monthpostoperatively (rZ 0.18, P!.01) (Figure 14, B). Therewas also a strong positive correlation between thechange in the 7.0 mm CCV 1 day postoperatively andthe phacoemulsification time (r Z 0.61, P!.01)(Figure 15, A); however, this correlation diminished
Figure 5. Comparison of preoperative CCT measurements betweenOCT and US pachymetry (CCTZ central corneal thickness; OCTZoptical coherence tomography).
J CATARACT REFRACT SURG - V
by 1 month postoperatively (r Z 0.15, P!.01)(Figure 15, B).
DISCUSSION
Because the major refractive surface of the eye is thecornea, it is likely that corneal edema affects the opticalproperties of the eye. Corneal edema has also beenknown to affect IOP measurements. Herr et al.15 pub-lished a study of tonometry 1 day after cataract sur-gery measured by 2 different instruments to evaluatethe possible effects of corneal edema on IOP measure-ments. They found large differences between thetonometry values in the setting of postsurgical centralcorneal edema.
Intraocular surgery induces changes in the cornealendothelial cells, which are fundamental to main-taining corneal transparency and the state of dehy-dration in the cornea. Examining endothelial cellsusing specular microscopy allows evaluation of thesize, shape, and raw quantity of endothelial cells
Figure 6. Comparison of 1-day postoperative CCT measurementsbetweenOCT andUS pachymetry (CCTZ central corneal thickness;OCT Z optical coherence tomography).
OL 40, DECEMBER 2014
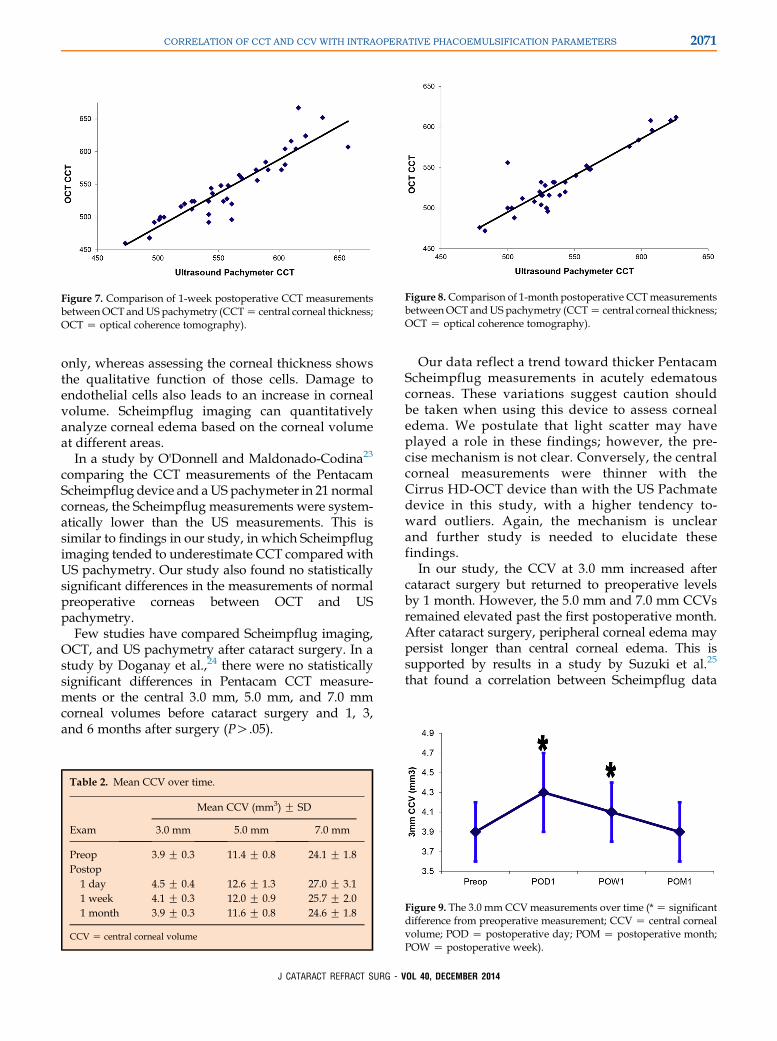
Figure 7. Comparison of 1-week postoperative CCT measurementsbetweenOCT andUS pachymetry (CCTZ central corneal thickness;OCT Z optical coherence tomography).
Figure 8.Comparison of 1-month postoperative CCTmeasurementsbetweenOCT andUS pachymetry (CCTZ central corneal thickness;OCT Z optical coherence tomography).
2071CORRELATION OF CCT AND CCV WITH INTRAOPERATIVE PHACOEMULSIFICATION PARAMETERS
only, whereas assessing the corneal thickness showsthe qualitative function of those cells. Damage toendothelial cells also leads to an increase in cornealvolume. Scheimpflug imaging can quantitativelyanalyze corneal edema based on the corneal volumeat different areas.
In a study by O'Donnell and Maldonado-Codina23
comparing the CCT measurements of the PentacamScheimpflug device and aUS pachymeter in 21 normalcorneas, the Scheimpflug measurements were system-atically lower than the US measurements. This issimilar to findings in our study, in which Scheimpflugimaging tended to underestimate CCT compared withUS pachymetry. Our study also found no statisticallysignificant differences in the measurements of normalpreoperative corneas between OCT and USpachymetry.
Few studies have compared Scheimpflug imaging,OCT, and US pachymetry after cataract surgery. In astudy by Doganay et al.,24 there were no statisticallysignificant differences in Pentacam CCT measure-ments or the central 3.0 mm, 5.0 mm, and 7.0 mmcorneal volumes before cataract surgery and 1, 3,and 6 months after surgery (PO.05).
Table 2. Mean CCV over time.
Exam
Mean CCV (mm3) G SD
3.0 mm 5.0 mm 7.0 mm
Preop 3.9 G 0.3 11.4 G 0.8 24.1 G 1.8Postop
1 day 4.5 G 0.4 12.6 G 1.3 27.0 G 3.11 week 4.1 G 0.3 12.0 G 0.9 25.7 G 2.01 month 3.9 G 0.3 11.6 G 0.8 24.6 G 1.8
CCV Z central corneal volume
J CATARACT REFRACT SURG - V
Our data reflect a trend toward thicker PentacamScheimpflug measurements in acutely edematouscorneas. These variations suggest caution shouldbe taken when using this device to assess cornealedema. We postulate that light scatter may haveplayed a role in these findings; however, the pre-cise mechanism is not clear. Conversely, the centralcorneal measurements were thinner with theCirrus HD-OCT device than with the US Pachmatedevice in this study, with a higher tendency to-ward outliers. Again, the mechanism is unclearand further study is needed to elucidate thesefindings.
In our study, the CCV at 3.0 mm increased aftercataract surgery but returned to preoperative levelsby 1 month. However, the 5.0 mm and 7.0 mm CCVsremained elevated past the first postoperative month.After cataract surgery, peripheral corneal edema maypersist longer than central corneal edema. This issupported by results in a study by Suzuki et al.25
that found a correlation between Scheimpflug data
Figure 9. The 3.0 mm CCVmeasurements over time (*Z significantdifference from preoperative measurement; CCV Z central cornealvolume; POD Z postoperative day; POM Z postoperative month;POW Z postoperative week).
OL 40, DECEMBER 2014
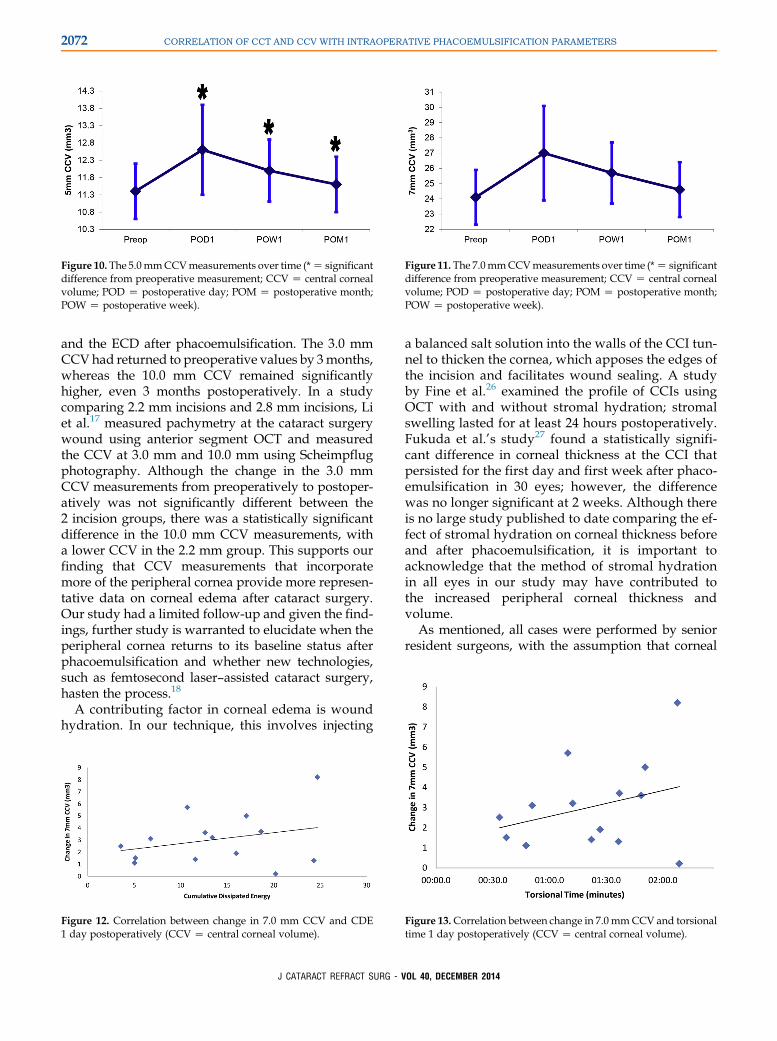
Figure 10. The 5.0mmCCVmeasurements over time (*Z significantdifference from preoperative measurement; CCV Z central cornealvolume; POD Z postoperative day; POM Z postoperative month;POW Z postoperative week).
Figure 11. The 7.0mmCCVmeasurements over time (*Z significantdifference from preoperative measurement; CCV Z central cornealvolume; POD Z postoperative day; POM Z postoperative month;POW Z postoperative week).
2072 CORRELATION OF CCT AND CCV WITH INTRAOPERATIVE PHACOEMULSIFICATION PARAMETERS
and the ECD after phacoemulsification. The 3.0 mmCCVhad returned to preoperative values by 3months,whereas the 10.0 mm CCV remained significantlyhigher, even 3 months postoperatively. In a studycomparing 2.2 mm incisions and 2.8 mm incisions, Liet al.17 measured pachymetry at the cataract surgerywound using anterior segment OCT and measuredthe CCV at 3.0 mm and 10.0 mm using Scheimpflugphotography. Although the change in the 3.0 mmCCV measurements from preoperatively to postoper-atively was not significantly different between the2 incision groups, there was a statistically significantdifference in the 10.0 mm CCV measurements, witha lower CCV in the 2.2 mm group. This supports ourfinding that CCV measurements that incorporatemore of the peripheral cornea provide more represen-tative data on corneal edema after cataract surgery.Our study had a limited follow-up and given the find-ings, further study is warranted to elucidate when theperipheral cornea returns to its baseline status afterphacoemulsification and whether new technologies,such as femtosecond laser–assisted cataract surgery,hasten the process.18
A contributing factor in corneal edema is woundhydration. In our technique, this involves injecting
Figure 12. Correlation between change in 7.0 mm CCV and CDE1 day postoperatively (CCV Z central corneal volume).
J CATARACT REFRACT SURG - V
a balanced salt solution into the walls of the CCI tun-nel to thicken the cornea, which apposes the edges ofthe incision and facilitates wound sealing. A studyby Fine et al.26 examined the profile of CCIs usingOCT with and without stromal hydration; stromalswelling lasted for at least 24 hours postoperatively.Fukuda et al.’s study27 found a statistically signifi-cant difference in corneal thickness at the CCI thatpersisted for the first day and first week after phaco-emulsification in 30 eyes; however, the differencewas no longer significant at 2 weeks. Although thereis no large study published to date comparing the ef-fect of stromal hydration on corneal thickness beforeand after phacoemulsification, it is important toacknowledge that the method of stromal hydrationin all eyes in our study may have contributed tothe increased peripheral corneal thickness andvolume.
As mentioned, all cases were performed by seniorresident surgeons, with the assumption that corneal
Figure 13.Correlation between change in 7.0 mmCCV and torsionaltime 1 day postoperatively (CCV Z central corneal volume).
OL 40, DECEMBER 2014
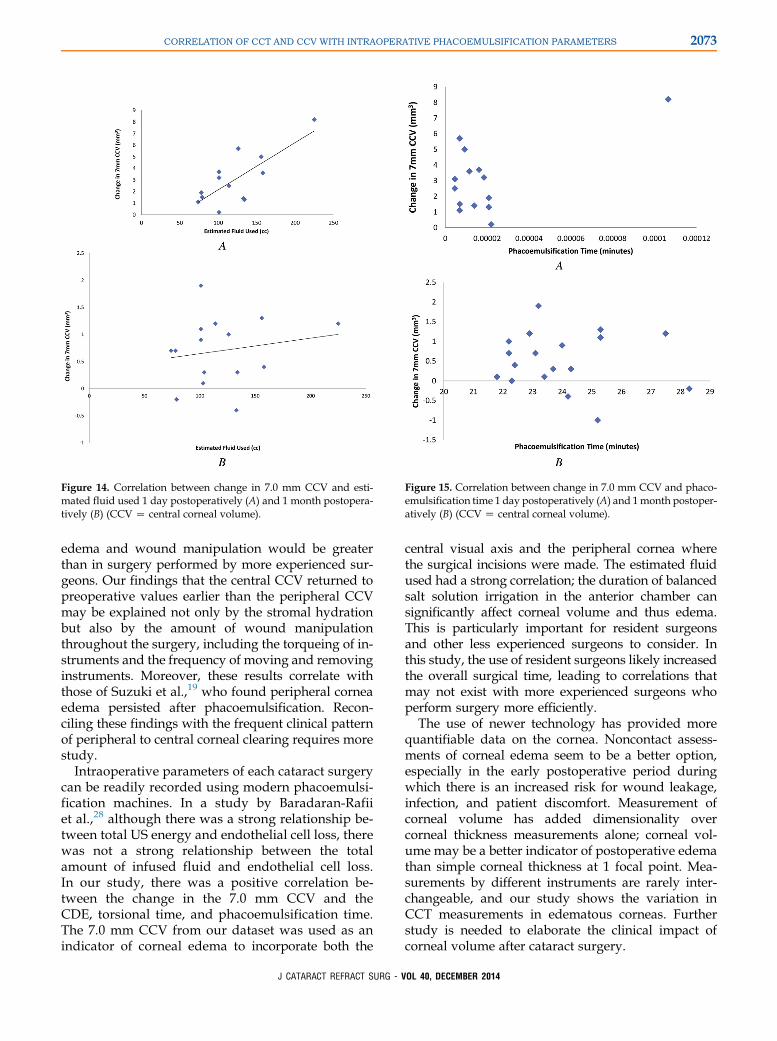
Figure 14. Correlation between change in 7.0 mm CCV and esti-mated fluid used 1 day postoperatively (A) and 1 month postopera-tively (B) (CCV Z central corneal volume).
Figure 15. Correlation between change in 7.0 mm CCV and phaco-emulsification time 1 day postoperatively (A) and 1month postoper-atively (B) (CCV Z central corneal volume).
2073CORRELATION OF CCT AND CCV WITH INTRAOPERATIVE PHACOEMULSIFICATION PARAMETERS
edema and wound manipulation would be greaterthan in surgery performed by more experienced sur-geons. Our findings that the central CCV returned topreoperative values earlier than the peripheral CCVmay be explained not only by the stromal hydrationbut also by the amount of wound manipulationthroughout the surgery, including the torqueing of in-struments and the frequency of moving and removinginstruments. Moreover, these results correlate withthose of Suzuki et al.,19 who found peripheral corneaedema persisted after phacoemulsification. Recon-ciling these findings with the frequent clinical patternof peripheral to central corneal clearing requires morestudy.
Intraoperative parameters of each cataract surgerycan be readily recorded using modern phacoemulsi-fication machines. In a study by Baradaran-Rafiiet al.,28 although there was a strong relationship be-tween total US energy and endothelial cell loss, therewas not a strong relationship between the totalamount of infused fluid and endothelial cell loss.In our study, there was a positive correlation be-tween the change in the 7.0 mm CCV and theCDE, torsional time, and phacoemulsification time.The 7.0 mm CCV from our dataset was used as anindicator of corneal edema to incorporate both the
J CATARACT REFRACT SURG - V
central visual axis and the peripheral cornea wherethe surgical incisions were made. The estimated fluidused had a strong correlation; the duration of balancedsalt solution irrigation in the anterior chamber cansignificantly affect corneal volume and thus edema.This is particularly important for resident surgeonsand other less experienced surgeons to consider. Inthis study, the use of resident surgeons likely increasedthe overall surgical time, leading to correlations thatmay not exist with more experienced surgeons whoperform surgery more efficiently.
The use of newer technology has provided morequantifiable data on the cornea. Noncontact assess-ments of corneal edema seem to be a better option,especially in the early postoperative period duringwhich there is an increased risk for wound leakage,infection, and patient discomfort. Measurement ofcorneal volume has added dimensionality overcorneal thickness measurements alone; corneal vol-ume may be a better indicator of postoperative edemathan simple corneal thickness at 1 focal point. Mea-surements by different instruments are rarely inter-changeable, and our study shows the variation inCCT measurements in edematous corneas. Furtherstudy is needed to elaborate the clinical impact ofcorneal volume after cataract surgery.
OL 40, DECEMBER 2014

2074 CORRELATION OF CCT AND CCV WITH INTRAOPERATIVE PHACOEMULSIFICATION PARAMETERS
WHAT WAS KNOWN
� Although US pachymetry is the gold standard of measuringcorneal thickness, other techniques (eg, OCT and Scheimp-flug imaging) can measure corneal parameters such asthickness and volume, etc.
WHAT THIS PAPER ADDS
� Noncontact pachymetry methods (Scheimpflug imagingand anterior segment OCT) tended to underestimate CCTcompared with US pachymetry in abnormal conditions,such as eyes with corneal edema after cataract surgery.
� The change in CCV postoperatively correlated with anincreased CDE, estimated fluid used, and phacoemulsifica-tion time.
REFERENCES1. Ravalico G, Tognetto D, Palomba MA, Lovisato A, Baccara F.
Corneal endothelial function after extracapsular cataract extrac-
tion and phacoemulsification. J Cataract Refract Surg 1997;
23:1000–1005
2. Lundberg B, Jonsson M, Behndig A. Postoperative corneal
swelling correlates strongly to corneal endothelial cell loss after
phacoemulsification cataract surgery. Am J Ophthalmol 2005;
139:1035–1041
3. Williams R, Fink BA, King-Smith PE, Mitchell GL. Central
corneal thickness measurements: using an ultrasonic instru-
ment and 4 optical instruments. Cornea 2011; 30:1238–1243
4. RaoHL, Kumar AU, Kumar A, CharyS, Senthil S, Vaddavalli PK,
Garudadri CS. Evaluation of central corneal thickness measure-
ment with RTVue spectral domain optical coherence tomogra-
phy in normal subjects. Cornea 2011; 30:121–126
5. Christensen A, Narv�aez J, Zimmerman G. Comparison of cen-
tral corneal thicknessmeasurements by ultrasoundpachymetry,
Konan noncontact optical pachymetry, and Orbscan pachyme-
try. Cornea 2008; 27:862–865
6. Brugin E, Ghirlando A, Gambato C, Midena E. Central corneal
thickness; z-ring corneal confocalmicroscopy versus ultrasound
pachymetry. Cornea 2007; 26:303–307
7. Airiani S, Trokel SL, Lee SM, Braunstein RE. Evaluating central
corneal thickness measurements with noncontact optical low-
coherence reflectometry and contact ultrasound pachymetry.
Am J Ophthalmol 2006; 142:164–165
8. Barkana Y, Gerber Y, Elbaz U, Schwartz S, Ken-Dror G, Avni I,
Zadok D. Central corneal thickness measurement with the Pen-
tacam Scheimpflug system, optical low-coherence reflectom-
etry pachymeter, and ultrasound pachymetry. J Cataract
Refract Surg 2005; 31:1729–1735
9. Ceylan OM, Turk A, Erdurman C, Mumcuoglu T, Erdem U,
GokceG, Dagli S. Comparison of Oculus Pentacam and Stratus
optical coherence tomography for measurements of central
corneal thickness. Cornea 2011; 30:670–674
10. Ishibazawa A, Igarashi S, Handa K, Nagaoka T, Ishiko S, Ito H,
Yoshida A. Central corneal thickness measurements with
Fourier-domain optical coherence tomography versus ultrasonic
pachymetry and rotating Scheimpflug camera. Cornea 2011;
30:615–619
J CATARACT REFRACT SURG - V
11. O’Donnell C, Hartwig A, Radhakrishnan H. Comparison of cen-
tral corneal thickness and anterior chamber depthmeasured us-
ing LenStar LS900, Pentacam, and Visante AS-OCT. Cornea
2012; 31:983–988
12. Garcia-Medina JJ, Garcia-Medina M, Garcia-Maturana C,
Zanon-Moreno V, Pons-Vazquez S, Pinazo-Duran MD.
Comparative study of central corneal thickness using
Fourier-domain optical coherence tomography versus ultra-
sound pachymetry in primary open-angle glaucoma. Cornea
2013; 32:9–13
13. ProsperoPonceCM,RochaKM,Smith SD, Krueger RR.Central
and peripheral corneal thickness measured with optical coher-
ence tomography, Scheimpflug imaging, and ultrasound pachy-
metry in normal, keratoconus-suspect, and post-laser in situ
keratomileusis eyes. J Cataract Refract Surg 2009; 35:1055–
1062
14. Spadea L, Giammaria D, Di Genova L, Fiasca A. Comparison
of optical low coherence reflectometry and ultrasound pachy-
metry in the measurement of central corneal thickness before
and after photorefractive keratectomy. J Refract Surg 2007;
23:661–666
15. Herr A, Remky A, Hirsch T, Rennings C, PlangeN. Tonometry in
corneal edema after cataract surgery: dynamic contour tonom-
etry versus Goldmann applanation tonometry. Clin Ophthalmol
2013; 7:815–819. Available at: http://www.ncbi.nlm.nih.gov/
pmc/articles/PMC3647600/pdf/opth-7-815.pdf. Accessed June
28, 2014
16. Kandarakis A, Soumplis V, Karampelas M, Koutroumanos I,
Panos C, Kandarakis S, Karagiannis D. Response of corneal
hysteresis and central corneal thickness following clear corneal
cataract surgery. Acta Ophthalmol 2012; 90:526–529. Available
at: http://onlinelibrary.wiley.com/doi/10.1111/j.1755-3768.2010.
02078.x/pdf. Accessed June 28, 2014
17. Li Y-J, Kim H-J, Joo C-K. Early changes in corneal edema
following torsional phacoemulsification using anterior segment
optical coherence tomography and Scheimpflug photography.
Jpn J Ophthalmol 2011; 55:196–204
18. Tak�acs AI, Kov�acs I, Mih�altz K, Filkorn T, Knorz MC, Nagy ZZ.
Central corneal volume and endothelial cell count following
femtosecond laser-assisted refractive cataract surgery
compared to conventional phacoemulsification. J Refract Surg
2012; 28:387–391
19. Suzuki H, Takahashi H, Hori J, Hiraoka M, Igarashi T, Shiwa T.
Phacoemulsification associated corneal damage evaluated by
corneal volume. Am J Ophthalmol 2006; 142:525–528
20. Zeng M, Liu X, Liu Y, Xia Y, Luo L, Yuan Z, Zeng Y, Liu Y.
Torsional ultrasoundmodality for hard nucleus phacoemulsifica-
tion cataract extraction. Br J Ophthalmol 2008; 92:1092–1096.
Available at: http://bjo.bmj.com/content/92/8/1092.full.pdf. Ac-
cessed June 28, 2014
21. Grewal DS, Brar GS, Grewal SPS. Assessment of central
corneal thickness in normal, keratoconus, and post-laser in
situ keratomileusis eyes using Scheimpflug imaging, spectral
domain optical coherence tomography, and ultrasound pachy-
metry. J Cataract Refract Surg 2010; 36:954–964
22. Park S-H, Choi S-K, Lee D, Jun E-J, Kim J-H. Corneal thickness
measurement using Orbscan, Pentacam, Galilei, and ultra-
sound in normal and post-femtosecond laser in situ keratomileu-
sis eyes. Cornea 2012; 31:978–982
23. O’Donnell C, Maldonado-Codina C. Agreement and repeat-
ability of central thickness measurement in normal corneas us-
ing ultrasound pachymetry and the OCULUS. Pentacam.
Cornea 2005; 24:920–924
24. Doganay S, Bozgul Firat P, Emre S, Yologluz S. Evaluation of
anterior segment parameter changes using the Pentacam after
OL 40, DECEMBER 2014
2075CORRELATION OF CCT AND CCV WITH INTRAOPERATIVE PHACOEMULSIFICATION PARAMETERS
uneventful phacoemulsification. Acta Ophthalmol 2010;
88:601–606. Available at: http://onlinelibrary.wiley.com/doi/
10.1111/j.1755-3768.2008.01446.x/pdf. Accessed June 28,
2014
25. Suzuki H, Oki K, Takahashi K, Shiwa T, Takahashi H. Func-
tional evaluation of corneal endothelium by combined mea-
surement of corneal volume alteration and cell density after
phacoemulsification. J Cataract Refract Surg 2007;
33:2077–2082
26. Fine IH, Hoffman RS, Packer M. Profile of clear corneal cataract
incisions demonstrated by ocular coherence tomography.
J Cataract Refract Surg 2007; 33:94–97
27. Fukuda S, Kawana K, Yasuno Y, Oshika T. Wound architecture
of clear corneal incision with or without stromal hydration
observed with 3-dimensional optical coherence tomography.
Am J Ophthalmol 2011; 151:413–419
J CATARACT REFRACT SURG - V
28. Baradaran-Rafii A, Rahmati-Kamel M, Eslani M, Kiavash V,
Karimian F. Effect of hydrodynamic parameters on corneal
endothelial cell loss after phacoemulsification. J Cataract
Refract Surg 2009; 35:732–737
OL
40, DECEMBER 2014First author:Melissa M. Wong, MD
Department of Ophthalmology,Boston Medical Center, Boston,Massachusetts, USA