corneal thickness and endothelial cell density measured by non-contact specular microscopy and...
TRANSCRIPT

Corneal thickness and endothelial cell density measured by non-contact
specular microscopy and pachymetry in Rhesus macaques
(Macaca mulatta) with laser-induced ocular hypertension
F.J. Olliviera,*, D.E. Brooksa, A.M. Komaromya, M.E. Kallberga, S.E. Andrewa,H.L. Sappa, M.B. Sherwoodb, W.W. Dawsonb
aDepartment of Small Animal Clinical Sciences, College of Veterinary Medicine, P.O. Box 100126, University of Florida, Gainesville, FL 32601-0126, USAbDepartment of Ophthalmology, College of Medicine, University of Florida, Gainesville, FL, USA
Received 15 August 2002; accepted in revised form 24 February 2003
Abstract
Purpose. Sustained increase in intraocular pressure (IOP) in humans results in a loss of corneal endothelial cells and an increase of corneal
thickness. The effects of chronically elevated IOP on the corneal endothelium of monkeys with laser-induced ocular hypertension, a
commonly used animal model of human glaucoma have not been documented. This study examined the central corneal thickness (CCT), the
corneal endothelial cell density (ECD), and the corneal endothelial cell size (ACS) in Rhesus monkeys with experimental ocular
hypertension.
Materials and methods. Ten male monkeys with argon laser-induced ocular hypertension in one eye for an average duration of 2·4 ^ 0·7
years, were sedated with ketamine hydrochloride, and the CCT, ECD, and ACS measured at the center of the cornea of both eyes with a
Topcon SP-2000Pe non-contact specular microscope (Topcon America Corporationw, Paramus, NJ, USA). CCT was also measured using a
DHG-500 Pachettee ultrasonic pachymeter (DHG Technology Inc., Exton, PA, USA). Mean and standard deviation (S.D.) of CCT, ECD and
ACS for each eye was calculated and statistically compared.
Results. Mean CCT in the hypertensive and normal eyes measured by specular microscopy was 0·477 ^ 0·023 mm and
0·468 ^ 0·020 mm, respectively. Mean ECD in the hypertensive and normal eyes was 2601·7 ^ 631·8 and 3990·2 ^ 402·9 cells mm22,
respectively. The mean size of the endothelial cells was 252·4 ^ 23·9 mm2 in the normal eye and 408·7 ^ 115·0 mm2 in the hypertensive eye.
No significant difference in the measurement of CCT was observed between the specular microscope and the pachymeter ðp ¼ 0·46Þ:
No significant difference in the mean CCT was observed between the two eyes ðp ¼ 0·4820Þ; whereas the mean ECD was significantly
lower in the hypertensive eye than in the normal eye ðp , 0·001Þ: The ECD was inversely related to the length of IOP elevation ðp , 0·001Þ:
Conclusions. No difference in the corneal thickness measurement was observed between the specular microscopy and the pachymetry
techniques. Chronic ocular hypertension did not significantly affect the CCT, but caused a significant loss of endothelial cells in the center of
the cornea of the laser treated eyes compared to the normotensive eyes. The duration of elevated IOP was the most important factor affecting
the ECD.
q 2003 Elsevier Science Ltd. All rights reserved.
Keywords: cornea; corneal thickness; endothelial cell density; intraocular pressure; Rhesus monkeys; hypertension; specular microscopy; pachymetry
1. Introduction
Sustained ocular hypertension in humans causes a loss of
corneal endothelial cells (Setala, 1979; Olsen, 1980; Bigar
and Witmer, 1982; Gagnon et al., 1997) and an increase in
corneal thickness (Herndon et al., 1997; Copt et al., 1999;
Brusini et al., 2000; Ventura et al., 2001). Increased corneal
thickness can adversely affect intraocular pressure (IOP)
measurements (Wolfs et al., 1997; Shah et al., 1999; Brusini
et al., 2000; Thomas et al., 2000). Monkeys with
experimental laser-induced ocular hypertension are com-
monly used as an animal model of human glaucoma,
although the effects of chronic elevated IOP on the monkey
0014-4835/03/$ - see front matter q 2003 Elsevier Science Ltd. All rights reserved.
DOI:10.1016/S0014-4835(03)00055-1
Experimental Eye Research 76 (2003) 671–677
www.elsevier.com/locate/yexer
* Corresponding author. Dr F. J. Ollivier, Department of Small Animal
Clinical Sciences, Ophthalmology Service, College of Veterinary
Medicine, P.O. Box 100126, University of Florida, Gainesville, FL
32601-0126, USA.
E-mail address: [email protected] (F.J. Ollivier).

cornea have not been documented. The purpose of this study
was to determine the central corneal thickness (CCT), the
corneal endothelial cell density (ECD), and the corneal
endothelial cell size (ACS) by specular microscopy and
pachymetry in Rhesus monkeys with laser-induced ocular
hypertension.
2. Materials and methods
2.1. Animal
Ten ðN ¼ 10Þ male Rhesus monkeys (Macaca mulata),
between 4 and 8 years of age, were used for this study.
Ocular hypertension had been produced in the right eye
(OD) by repeated argon laser photocoagulation of the
trabecular meshwork. One to two hundred laser burns were
applied to the mid-portion of the trabecular meshwork for
3608, with a spot size of 50 mm, power of 1·5 W, and
exposure of 0·5 sec. If a sustained rise in IOP was not
achieved, the laser sessions were repeated to produce a
prolonged and consistent elevation of IOP. The animals
were kept in individual cages in well-defined and standar-
dized conditions (humidity and temperature controlled
room, 12-hr light/12-hr dark cycle), with food and water
ad libitum. All experiments were conducted in accordance
with the ARVO Resolution for the Use of Animals in
Ophthalmic and Vision Research.
2.2. Sedation
Sedation was induced with intramuscular (IM) injection
of ketamine hydrochloride (20 mg kg21) for the IOP and the
corneal measurements.
2.3. Measurement of IOP
The IOP in both eyes was measured by a single
investigator using a calibrated Tonopene XL applanation
tonometer (Mentorw, Norwell, MA, USA) with the
monkeys in a sitting position. Before the IOP measurement,
30 ml of 0·4% oxybuprocaine (Ciba Vision Ophthalmics), a
topical anesthetic, was instilled into both eyes. Tonometry
was performed three times in each eye and averaged for
each measurement. The IOP measurements were performed
the same day as the corneal parameters measurements.
2.4. CCT, ECD and ACS measurements
CCT, ECD and ACS were measured at the center of the
cornea of both eyes with a Topcon SP-2000Pe non-contact
specular microscope (Topcon America Corporationw, Para-
mus, NJ, USA). This auto-focusing specular microscope is
equipped with automated analysers that make calculation of
corneal endothelial cell variables simple and fast: ECD was
determined by an automatic count of the cells present on
a 0·1 £ 0·1 mm2 image that was taken when the fine
alignment and precise focus was obtained. The average
cell size (ACS) corresponded to the mean of the size of 20
cells randomly selected in the central portion of the image
captured with the non-contact specular microscope. CCT
was also measured on a different day using a DHG-500
Pachettee ultrasonic pachymeter (DHG Technology Inc.,
Exton, PA, USA).
The techniques used to measure the CCT by these
differing pieces of equipment will be mentioned and
compared in the discussion.
2.5. Statistical analysis
Mean and standard deviation (S.D.) of IOP, CCT, ECD,
and ACS for each eye were calculated and statistically
compared (t-test). Mean and S.D. CCT measured for each
eye using the specular microscope and the pachymeter were
also statistically compared (paired t-test). Mean and
standard deviation (S.D.) ECD for the two durations of
IOP elevation (19 and 35 months) for the hypertensive eye
were calculated and statistically compared (t-test). The tests
were considered statistically significant if the p-value was
less than 0·05.
3. Results
The age (mean ^ S.D.) of these animals was 6·7 ^ 1·4
years. An average of 2·3 ^ 1·0 laser sessions had been
necessary to maintain an increased IOP of 38·3 ^
10·8 mmHg in the right eye (versus 14·8 ^ 0·8 mmHg in
the normal eye) for 2·4 ^ 0·7 years (Fig. 1).
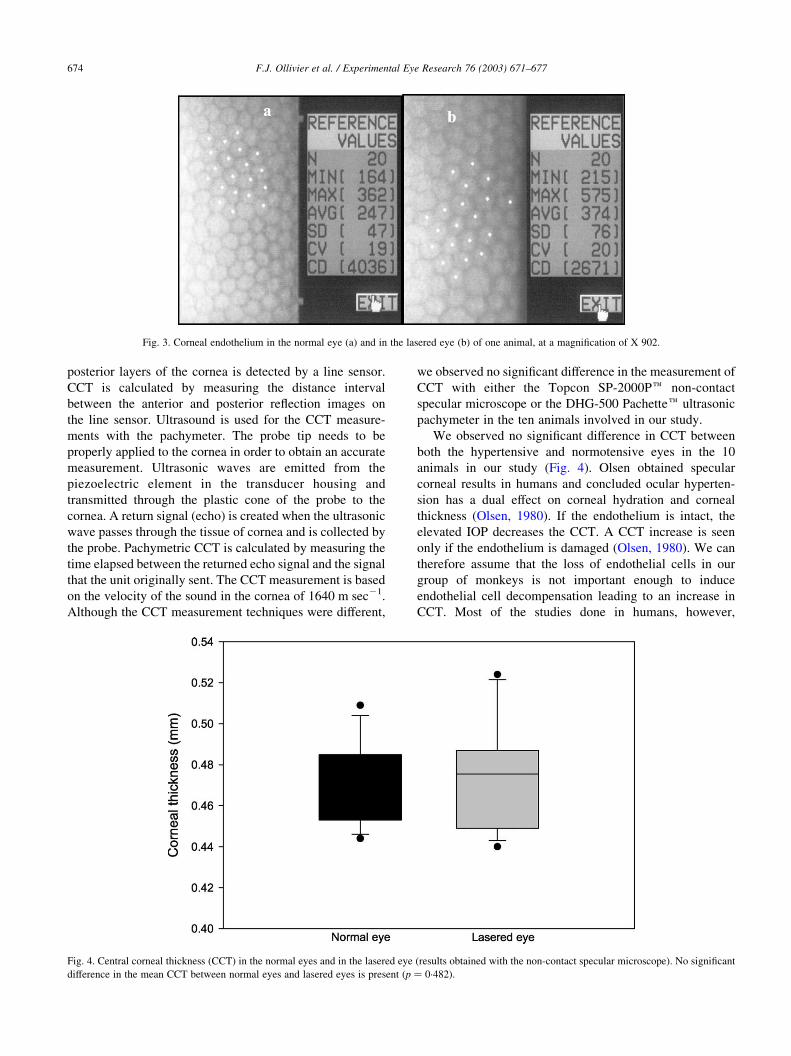
The observed specular characteristics of the corneal
endothelium in the normal and lasered eyes of one animal
examined with the Topcon SP-2000Pe non-contact specular
microscope are shown in Figs 2 and 3. Mean CCT in the
hypertensive and normal eyes was 0·477 ^ 0·030 and
0·468 ^ 0·020 mm, respectively (Fig. 4). Mean ECD in the
hypertensive and normal eyes was 2601·7 ^ 631·8 and
3990·2 ^ 402·9 cells mm22, respectively (Fig. 5). The ACS
of the endothelial cells in the normal eye varied from 161·7
and 432·2 mm2 with an average of 252·4 ^ 23·9 mm2
(Fig. 6). In the hypertensive eye, the ACS was
408·7 ^ 115·0 mm2 with a range of 278·1–638·5 mm2
(Fig. 6).
Mean CCT measured in the hypertensive and normal
eyes with the DGH-500 Pachettee pachymeter was
0·487 ^ 0·020 and 0·480 ^ 0·030 mm, respectively
(Table 1).
No significant difference in the CCT was observed
between the Topcon SP-2000Pe non-contact specular
microscope and the DGH-500 Pachettee pachymeter
(p ¼ 0·34 and 0·46).
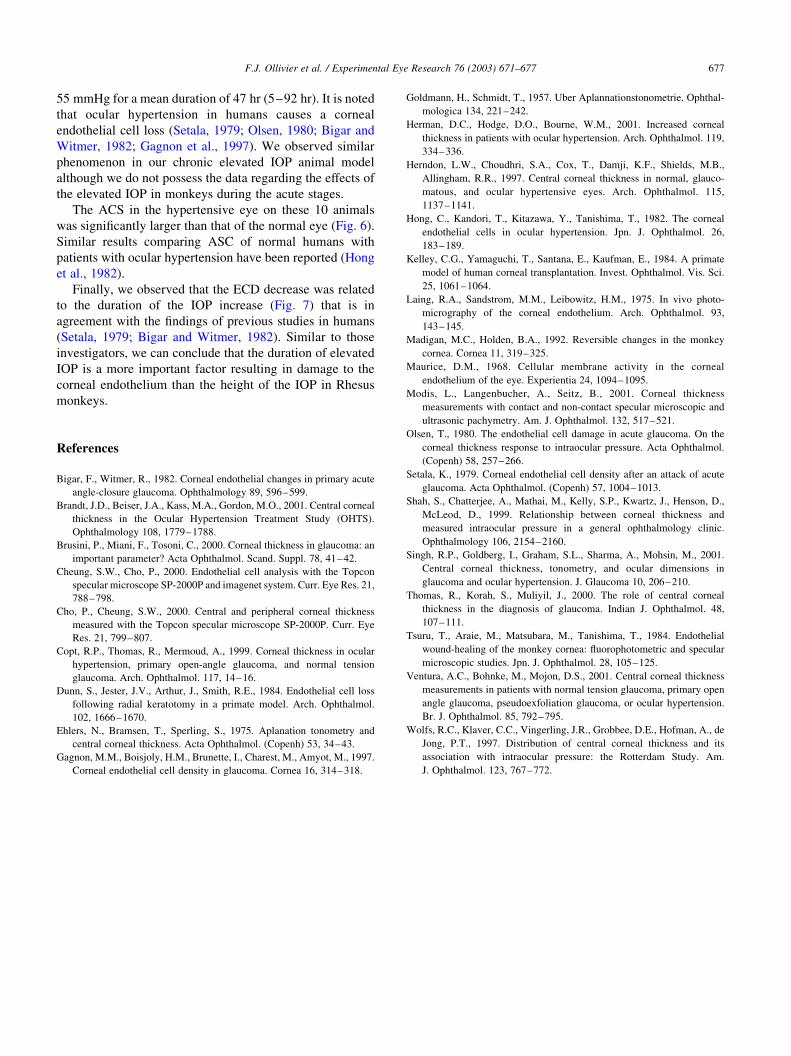
No significant difference in the mean CCT was observed
between the two eyes ðp ¼ 0·4820Þ (Fig. 4), whereas
F.J. Ollivier et al. / Experimental Eye Research 76 (2003) 671–677672

the mean ECD was significantly lower (33% decrease) in
the hypertensive eye than in the normal eye ðp , 0·001Þ
(Fig. 5). The ECD was inversely related to the length of IOP
elevation with the mean ECD significantly lower in the
hypertensive eye where the IOP had been raised for 35
months than in the hypertensive eye with the IOP elevated
for 19 months ðp , 0·001Þ (Fig. 7).
4. Discussion
The corneal endothelial cells were examined and
photographed in vivo for the first time with a specular
microscope in 1968 (Maurice, 1968; Laing et al., 1975). The
Topcon SP-2000Pe non-contact specular microscope used
in our study is reported to have good repeatability and
reproducibility in the determination of the CCT, ECD
and ACS in human eyes (Cheung and Cho, 2000; Cho and
Cheung, 2000; Modis et al., 2001). Modis et al. (2001)
showed this non-contact specular microscope was reliable
and comparable with instruments like ultrasonic pachy-
meters and contact specular microscopes for the measure-
ment of the CCT, ECD and ACS. The CCT, ECD and ACS
have been previously evaluated for contact lens wear,
corneal transplantation and corneal wound healing studies
in Rhesus monkeys (Dunn et al., 1984; Kelley et al., 1984;
Tsuru et al., 1984; Madigan and Holden, 1992; ). However,
the effects of chronically elevated IOP on the monkey
cornea are not documented in monkeys with experimental
laser-induced ocular hypertension, a commonly used animal
model of human glaucoma.
Central corneal thickness measurements can be obtained
with the Topcon SP-2000Pe non-contact specular micro-
scope and the DHG-500 Pachettee ultrasonic pachymeter.
The CCT measurement is done without contacting the
cornea using a near infrared light in the specular
microscope. An angled slit beam of light is projected onto
the cornea, and the light reflected by the anterior and
Fig. 1. Intraocular pressure (IOP) in the normal eye and the lasered eye. *A significant difference in the mean IOP between lasered and normal eyes is present
ðp , 0·0001Þ:
Fig. 2. Corneal endothelium in the normal eye (a) and in the lasered eye (b) of one animal, at a magnification of X 282.
F.J. Ollivier et al. / Experimental Eye Research 76 (2003) 671–677 673
posterior layers of the cornea is detected by a line sensor.
CCT is calculated by measuring the distance interval
between the anterior and posterior reflection images on
the line sensor. Ultrasound is used for the CCT measure-
ments with the pachymeter. The probe tip needs to be
properly applied to the cornea in order to obtain an accurate
measurement. Ultrasonic waves are emitted from the
piezoelectric element in the transducer housing and
transmitted through the plastic cone of the probe to the
cornea. A return signal (echo) is created when the ultrasonic
wave passes through the tissue of cornea and is collected by
the probe. Pachymetric CCT is calculated by measuring the
time elapsed between the returned echo signal and the signal
that the unit originally sent. The CCT measurement is based
on the velocity of the sound in the cornea of 1640 m sec21.
Although the CCT measurement techniques were different,
we observed no significant difference in the measurement of
CCT with either the Topcon SP-2000Pe non-contact
specular microscope or the DHG-500 Pachettee ultrasonic
pachymeter in the ten animals involved in our study.
We observed no significant difference in CCT between
both the hypertensive and normotensive eyes in the 10
animals in our study (Fig. 4). Olsen obtained specular
corneal results in humans and concluded ocular hyperten-
sion has a dual effect on corneal hydration and corneal
thickness (Olsen, 1980). If the endothelium is intact, the
elevated IOP decreases the CCT. A CCT increase is seen
only if the endothelium is damaged (Olsen, 1980). We can
therefore assume that the loss of endothelial cells in our
group of monkeys is not important enough to induce
endothelial cell decompensation leading to an increase in
CCT. Most of the studies done in humans, however,
Fig. 3. Corneal endothelium in the normal eye (a) and in the lasered eye (b) of one animal, at a magnification of X 902.
Fig. 4. Central corneal thickness (CCT) in the normal eyes and in the lasered eye (results obtained with the non-contact specular microscope). No significant
difference in the mean CCT between normal eyes and lasered eyes is present ðp ¼ 0·482Þ:
F.J. Ollivier et al. / Experimental Eye Research 76 (2003) 671–677674

reported a greater CCT in patients with ocular hypertension
than in normals, and in patients with primary
open-angle glaucoma or normal tension glaucoma (Herndon
et al., 1997; Copt et al., 1999; Brusini et al., 2000;
Brandt et al., 2001; Herman et al., 2001; Singh et al.,
2001; Ventura et al., 2001). The measurement of the CCT is
important as the CCT influences the IOP measurements
(Goldmann and Schmidt, 1957; Ehlers et al., 1975; Wolfs
et al., 1997). It has been reported that an increased CCT
leads to an overstimation of IOP in 39% of cases (Herndon
et al., 1997; Wolfs et al., 1997; Thomas et al., 2000). For this
reason, the CCT measurement is recommended in human
patients evaluated for glaucoma to avoid misclassification
(Shah et al., 1999; Thomas et al., 2000; Singh et al., 2001).
The change in central ECD should represent any
alteration in endothelial cell number, as the detrimental
effect of the increased IOP should uniformly affect the
whole cornea (Setala, 1979). In this study, we observed a
significant ECD decrease (33%) in the hypertensive eye of
10 Rhesus monkeys (Fig. 5). There was no statistical
relationship between the level of IOP and the difference in
ECD. Investigators have obtained similar results in human
studies: Bigar and Witmer (1982) reported a reduction in
ECD of 33% in patients with an average elevated IOP of
Fig. 5. Corneal endothelial cell density (ECD) in the normal eyes and in the lasered eyes. *A significant difference in the mean ECD between normal eyes and
lasered eyes is present ðp , 0·0001Þ:
Fig. 6. Corneal endothelial cell size in the normal eyes and in the lasered eyes. *A significant difference in the mean cell size between normal eyes and lasered
eyes is present ðp , 0·0001Þ:
F.J. Ollivier et al. / Experimental Eye Research 76 (2003) 671–677 675

Table 1
Various parameters of the cornea in 10 Rhesus monkeys with a normotensive eye (left eye) and a laser induced hypertensive eye (right eye)
CCT Pachymeter
(mm)
CCT Specular microscope
(mm)
Mean cell size
(m2)
ECD
(number of cells/mm2)
IOP
(mm Hg)
Duration of elevated IOP
(months)
Right eye
Animal 1 0·472 0·44 604 1654 45·7 35
Animal 2 0·491 0·524 594 1682 59·7 35
Animal 3 0·500 0·472 489 2042 27·7 35
Animal 4 0·498 0·479 333 2998 25 35
Animal 5 0·493 0·487 410 2438 45·3 35
Animal 6 0·480 0·446 317 3157 29·3 35
Animal 7 0·473 0·467 355 2816 37·7 19
Animal 8 0·529 0·449 374 2671 36 19
Animal 9 0·479 0·519 288 3471 45·7 19
Animal 10 0·463 0·483 323 3088 31 19
Mean ^ S.D. 0·487 ^ 0·02 0·477 ^ 0·03 408·7* ^ 115·0 2601·7* ^ 631·8 38·3* ^ 10·8 28·6 ^ 8·3
p value 0·436 0·482 ,0·0001 ,0·0001 ,0·0001
Left eye
Animal 1 0·486 0·456 276 3623 15·7 NA
Animal 2 0·449 0·509 267 3741 14 NA
Animal 3 0·491 0·499 267 3732 15·3 NA
Animal 4 0·514 0·469 210 4758 15 NA
Animal 5 0·497 0·448 265 3772 15·7 NA
Animal 6 0·450 0·462 225 4443 14 NA
Animal 7 0·474 0·459 274 3644 14·3 NA
Animal 8 0·507 0·444 236 4223 16 NA
Animal 9 0·463 0·485 233 4284 14 NA
Animal 10 0·473 0·453 271 3682 14·7 NA
Mean ^ S.D. 0·480 ^ 0·03 0·468 ^ 0·02 252·4* ^ 23·9 3990·2* ^ 402·9 14·8* 6 0·8 NA
CCT ¼ central corneal thickness; ECD ¼ endothelial cell density, IOP ¼ intraocular pressure. *Significant difference between the normal eyes and lasered
eyes.
Fig. 7. Effect of duration of ocular hypertension on corneal endothelial cell density (ECD) in the lasered eyes (OD). The ocular hypertersion was maintained for
19 months in 5 animals and for 35 months in 5 other monkeys. *A significant difference in the ECD is present between the 2 duration groups ðp , 0·0001Þ:
F.J. Ollivier et al. / Experimental Eye Research 76 (2003) 671–677676
55 mmHg for a mean duration of 47 hr (5–92 hr). It is noted
that ocular hypertension in humans causes a corneal
endothelial cell loss (Setala, 1979; Olsen, 1980; Bigar and
Witmer, 1982; Gagnon et al., 1997). We observed similar
phenomenon in our chronic elevated IOP animal model
although we do not possess the data regarding the effects of
the elevated IOP in monkeys during the acute stages.
The ACS in the hypertensive eye on these 10 animals
was significantly larger than that of the normal eye (Fig. 6).
Similar results comparing ASC of normal humans with
patients with ocular hypertension have been reported (Hong
et al., 1982).
Finally, we observed that the ECD decrease was related
to the duration of the IOP increase (Fig. 7) that is in
agreement with the findings of previous studies in humans
(Setala, 1979; Bigar and Witmer, 1982). Similar to those
investigators, we can conclude that the duration of elevated
IOP is a more important factor resulting in damage to the
corneal endothelium than the height of the IOP in Rhesus
monkeys.
References
Bigar, F., Witmer, R., 1982. Corneal endothelial changes in primary acute
angle-closure glaucoma. Ophthalmology 89, 596–599.
Brandt, J.D., Beiser, J.A., Kass, M.A., Gordon, M.O., 2001. Central corneal
thickness in the Ocular Hypertension Treatment Study (OHTS).
Ophthalmology 108, 1779–1788.
Brusini, P., Miani, F., Tosoni, C., 2000. Corneal thickness in glaucoma: an
important parameter? Acta Ophthalmol. Scand. Suppl. 78, 41–42.
Cheung, S.W., Cho, P., 2000. Endothelial cell analysis with the Topcon
specular microscope SP-2000P and imagenet system. Curr. Eye Res. 21,
788–798.
Cho, P., Cheung, S.W., 2000. Central and peripheral corneal thickness
measured with the Topcon specular microscope SP-2000P. Curr. Eye
Res. 21, 799–807.
Copt, R.P., Thomas, R., Mermoud, A., 1999. Corneal thickness in ocular
hypertension, primary open-angle glaucoma, and normal tension
glaucoma. Arch. Ophthalmol. 117, 14–16.
Dunn, S., Jester, J.V., Arthur, J., Smith, R.E., 1984. Endothelial cell loss
following radial keratotomy in a primate model. Arch. Ophthalmol.
102, 1666–1670.
Ehlers, N., Bramsen, T., Sperling, S., 1975. Aplanation tonometry and
central corneal thickness. Acta Ophthalmol. (Copenh) 53, 34–43.
Gagnon, M.M., Boisjoly, H.M., Brunette, I., Charest, M., Amyot, M., 1997.
Corneal endothelial cell density in glaucoma. Cornea 16, 314–318.
Goldmann, H., Schmidt, T., 1957. Uber Aplannationstonometrie. Ophthal-
mologica 134, 221–242.
Herman, D.C., Hodge, D.O., Bourne, W.M., 2001. Increased corneal
thickness in patients with ocular hypertension. Arch. Ophthalmol. 119,
334–336.
Herndon, L.W., Choudhri, S.A., Cox, T., Damji, K.F., Shields, M.B.,
Allingham, R.R., 1997. Central corneal thickness in normal, glauco-
matous, and ocular hypertensive eyes. Arch. Ophthalmol. 115,
1137–1141.
Hong, C., Kandori, T., Kitazawa, Y., Tanishima, T., 1982. The corneal
endothelial cells in ocular hypertension. Jpn. J. Ophthalmol. 26,
183–189.
Kelley, C.G., Yamaguchi, T., Santana, E., Kaufman, E., 1984. A primate
model of human corneal transplantation. Invest. Ophthalmol. Vis. Sci.
25, 1061–1064.
Laing, R.A., Sandstrom, M.M., Leibowitz, H.M., 1975. In vivo photo-
micrography of the corneal endothelium. Arch. Ophthalmol. 93,
143–145.
Madigan, M.C., Holden, B.A., 1992. Reversible changes in the monkey
cornea. Cornea 11, 319–325.
Maurice, D.M., 1968. Cellular membrane activity in the corneal
endothelium of the eye. Experientia 24, 1094–1095.
Modis, L., Langenbucher, A., Seitz, B., 2001. Corneal thickness
measurements with contact and non-contact specular microscopic and
ultrasonic pachymetry. Am. J. Ophthalmol. 132, 517–521.
Olsen, T., 1980. The endothelial cell damage in acute glaucoma. On the
corneal thickness response to intraocular pressure. Acta Ophthalmol.
(Copenh) 58, 257–266.
Setala, K., 1979. Corneal endothelial cell density after an attack of acute
glaucoma. Acta Ophthalmol. (Copenh) 57, 1004–1013.
Shah, S., Chatterjee, A., Mathai, M., Kelly, S.P., Kwartz, J., Henson, D.,
McLeod, D., 1999. Relationship between corneal thickness and
measured intraocular pressure in a general ophthalmology clinic.
Ophthalmology 106, 2154–2160.
Singh, R.P., Goldberg, I., Graham, S.L., Sharma, A., Mohsin, M., 2001.
Central corneal thickness, tonometry, and ocular dimensions in
glaucoma and ocular hypertension. J. Glaucoma 10, 206–210.
Thomas, R., Korah, S., Muliyil, J., 2000. The role of central corneal
thickness in the diagnosis of glaucoma. Indian J. Ophthalmol. 48,
107–111.
Tsuru, T., Araie, M., Matsubara, M., Tanishima, T., 1984. Endothelial
wound-healing of the monkey cornea: fluorophotometric and specular
microscopic studies. Jpn. J. Ophthalmol. 28, 105–125.
Ventura, A.C., Bohnke, M., Mojon, D.S., 2001. Central corneal thickness
measurements in patients with normal tension glaucoma, primary open
angle glaucoma, pseudoexfoliation glaucoma, or ocular hypertension.
Br. J. Ophthalmol. 85, 792–795.
Wolfs, R.C., Klaver, C.C., Vingerling, J.R., Grobbee, D.E., Hofman, A., de
Jong, P.T., 1997. Distribution of central corneal thickness and its
association with intraocular pressure: the Rotterdam Study. Am.
J. Ophthalmol. 123, 767–772.
F.J. Ollivier et al. / Experimental Eye Research 76 (2003) 671–677 677