corn and cotton root growth in response to soil impedance and water potential1
TRANSCRIPT

DIVISION S-6-SOIL AND WATERMANAGEMENT AND CONSERVATION
Corn and Cotton Root Growth in Response to Soil Impedance and Water Potential
B. BAR-YOSEF AND J. R. LAMBERT2
ABSTRACTThe equation dL/dt = C-L, which relates root elongation rate
(dl/dt) to root length capable of growth (L), was tested on split rootsystems of corn and cotton under controlled laboratory conditions.Evidence is presented for the validity of the equation for the variousparts of the root system when the growth period was up to 50 days.While the equation held, C, the specific root growth rate, was affectedby soil impedance and water potential (i/<), varying between 0.02 and0.15 per day for the cotton and between 0.03 and 0.28 per day forcorn. When the various parts of the root system were under the samesoil density (d) and different >/<, C varied with i/- according to a bell-shaped relationship. When d was different, C decreased monotonical-ly with increasing d values.
The flux of water uptake by cotton and com had a peak at a matricpotential between -0.13 and -0.20 bar and was about 0.02 and 0.03ml cm"' root day'1, respectively.
' Contribution no. 1497 from the S.C. Agric. Exp. Stn. Publishedby permission of the Director. Received 14 Aug. 1978. Approved 23Apr. 1981.
2 Soil Scientist, ARO, Bet Dagan, Israel; and Professor of Agric.Engineering, Clemson Univ., Clemson, S.C.
Additional Index Words: split roots, water uptake, bulk density.
Bar-Yosef, B., and J. R. Lambert. 1981. Corn and cotton root growthin response to soil impedance and water potential. Soil Sci. Soc. Am.J. 45:930-935.
ROOT GROWTH is a result of many simultaneousprocesses which are controlled by plant and en-
vironmental factors. Among the measurable plant-related factors, the rate of carbohydrate supply fromthe shoots to the roots, the current roots which serve asa sink for the carbohydrates, and the plant species seemto be of special importance. Under constant environ-ment conditions, Hillel and Talpaz (1976) and Lambertand Baker (1982) hypothesized that root elongation ratecan be described by Eq. [1], where L is the currentlength of roots capable of longitudinal growth (cm), t istime (days), and C is the specific root elongation rateper day:
dL/dt = C'L. [1]

BAR-YOSEF & LAMBERT: ROOT GROWTH IN RESPONSE TO SOIL IMPEDANCE AND WATER POTENTIAL 931
--OD=30.5cm-
-ID = 29.2cm-
^Jl̂OD= 7.0cmI D = 6.3 cm
Fig. 1—Schematic description of the soil container: a = suctionoutlet; b = ceramic plate; c = window (diam = 1.2 cm) for roots.The partitions are 0.6-cm thick.
This equation is analogous to the one used by Williams(1946) to develop a relative growth rate concept and isvalid only as long as carbohydrate supply is nonlimiting.As in kinetic reactions in general, C is a function of en-vironmental or external factors, manifested as ametabolic supply.
Some of these factors have recently been investigatedquite intensively in relation to elongation rate ratherthan to C. The effects of soil water potential and soilimpedance on root growth and elongation rate werereviewed by Taylor (1974) and by Taylor et al. (1972).Further investigations of those effects were reported byHemsath and Mazurak (1974), Voorhees et al. (1975),and Grimes et. al. (1975). While there is a consensusthat root growth of various crops is sharply impededwhen soil impedance exceeds approximately 20 bar, theeffect of water potential per se on elongation rate is con-troversial. Taylor et al. (1972) reported that at apenetrometer resistance of 0.05 bar, root length of cot-ton and peanuts was unaffected by water potentials be-tween -0.17 and -7.0 bar. Hemsath and Mazurak(1974) showed that, at a given constant impedance, amatric potential of -1/3 bar was more favorable forsorghum root extension than a matric potential of-0.15 bar. Inconsistency among the results probablyemanates from interactions between matric potentialand other factors which affect root growth. Such fac-tors would include oxygen supply (Voorhees et al.,1975; Grable and Siemer, 1968; Huck, 1970), nitrateconcentration (May et al., 1965; Drew et al., 1973), andsoil temperature (Taylor, 1974).
The objectives of the present work were (i) to checkexperimentally the validity of Eq. [1] for various por-tions of a root system held under different but constantenvironmental conditions (in this case, L in Eq. [1] willbecome the root length per soil volume where the con-stant conditions are defined); and (ii) to relate C to soilstrength and water potential to enable prediction of rootgrowth under nonuniform soil conditions. The indepen-dent effects of other factors, not easily controlled in asoil system, were analyzed in nutrient solution andreported elsewhere (Bar-Yosef and Lambert, 1978).
BULKDENSITY1,72 i 0.05
10 20 30VOLUMETRIC WATER CONTENT
(% vol )
10 20 30VOLUMETRIC WATER CONTENT (%vol)
Fig. 2— Water retention curve (drying, bulk density of 1.45 g/cm3)and soil impedance at various densities and volumetric water con-tents.
MATERIALS AND METHODS
To allow and analyze local growth in response to local effects, thesplit root system technique previously used by Brouwer (1962), Giskinand Kohnke (1965), and others was adapted.
The growth container schematically shown in Fig. 1 was constructedof two coaxial acrylic cylinders, the annular volume of which wasradially partitioned into six compartments. The volume of each com-partment is 2,550 cm3. The bottom of each compartment consists of a1-bar high-flow porous ceramic plate, 0.6 cm in thickness, cementedto a 0.6-cm high by 0.6-cm wide acrylic frame to facilitate suctionfrom an outlet beneath each compartment.
The soil was a Norfolk sandy loam (fine-loamy, siliceous thermicTypic Paleudults) topsoil with a texture of 5% clay, 16% silt, and79% sand. The water retention curve (drying) and penetrometer im-pedance vs. water content, at various densities, determined by a 5-mmdiam. blunt-tip penetrometer, are presented in Fig. 2.
Experiment (A)—The independent variable was minimum soilmatric potential. The soil in each compartment was packed to a bulkdensity of 1.45 g/cm3 by pouring weighed, air-dried soil and packing itto predetermined volumes in 2-cm layers. Microtensiometers wereplaced 6 and 20 cm from the top and 5 cm from the external wall dur-ing packing. The filled soil cells were wetted from the bottom. Veryshortly before the water front reached the top, a seedling, pregrownfor about 10 days in nutrient solution to have at least six lateral oradventitious roots of about 5 cm in length, was supported in a rubberstopper and placed in the internal cylinder. The roots were then gentlypassed through the windows (C in Fig. 1) into each compartment andcovered with soil. To minimize uncontrolled root growth and uptake,the cotton taproot and other roots were kept in the internal cylinder,which was sealed 1 cm below the window and filled with dry quartzsand after root transfer was complete. After 2 days, suction was ap-plied to obtain the minimum matric potentials which were - 3 ± 1,-10±2, -20±3, -30±5, -40±6, and -60±10 cbars. Theminimum matric potential throughout the growth period was con-trolled by surface irrigation and suction. The desired potentials wereobtained several hours after irrigation, depending upon treatment.The experiment was repeated twice for cotton (Gossypium hirsutum
932 SOIL SCI. SOC. AM. J., VOL. 45, 1981
L. var. 'Coker 310') and once for corn (Zea mays L. var. 'Pioneer3009').
Experiment (B)—The independent variable was soil density. Thesoil was packed as described above to yield densities of 1.35 ±0.05,1.40±0.05, 1.50±0.05, 1.55 ±0.05, and 1.80±0.05 g/cmj. Thematric potential in all the compartments was regulated to be -16 ±3cbars. This experiment was conducted with cotton only.
The volume of drained water, tensiometer readings, and root lengthvisible through the outside wall were recorded at intervals of 1 to 2days. Measurements of plant height, leaf length, and leaf width weremade each 3rd day. Root length was measured in increments of 2 cmon the wall. To minimize evaporation, prevent algae development,and eliminate any root inhibition by light, the soil surface and con-tainer were covered by black polyethylene.
Supply of nutrients was assumed to be nonlimiting. Nitrate wasadded in the first irrigation to give an average concentration of 10meq/liter in the soil solution. Nitrate was added during the experimentto compensate losses by leaching and uptake. Uptake by cotton andcorn as a function of age were estimated from data by Halevy (1976)and Bar-Yosef and Kafkafi (1972), respectively, and weighted for thevarious cells according to their root length. Phosphorus andpotassium were applied as KH2PO, and K2SO4 (200 and 100 mg/kgsoil, respectively) when packing the soil. An osmotic potential,estimated to be about -0.6 bar, existed in all the compartments.
The experiments were conducted in a growth chamber withautomatically controlled temperature, humidity, and photoperiod. Alight intensity of 650 /te nr2 sec"' PAR at the plants' canopy height,obtained by cool-white fluorescent and incandescent bulbs, was on for16 hours, followed by 8 hours of darkness. The "day" and "night"temperatures and relative humidities were 24±1°C, 17±1°C, and70±2% and 90±2%, respectively, as recorded by a hygrother-mograph.
At the end of Experiment (A), approximately 40 days aftertransplanting, the total soil in each of the compartments was removedin 2-cm layers and analyzed for water content and root dry weight.The roots were separated from the air-dry soil by dry-sieving, thesmallest opening being 0.2 mm. To convert root length per soil layer,as measured on the outside wall, to dry root concentration in the bulksoil, a vision depth of 0.3 cm, root radius (r) of 0.020 cm, specificweight of 1.0 g/cm', and dry matter content of 10% were assumed forcotton and 0.025 cm, 1.0 g/cm~3, and 10%, respectively, for corn.These values were estimated from the present experimental results. Asimilar value for r was used by Taylor and Klepper (1975). Based onthese assumptions, the root density obtained by separating andweighing the roots and root density estimated from root lengthmeasured on the outside wall were linearly correlated, and the coeffi-cients are summarized for several soil layers in Table 1. The regression
Q.
E
E500-^
IELJ
-J 200-
oen300 z
10 20 30TIME AFTER TRANSPLANTING (doys)
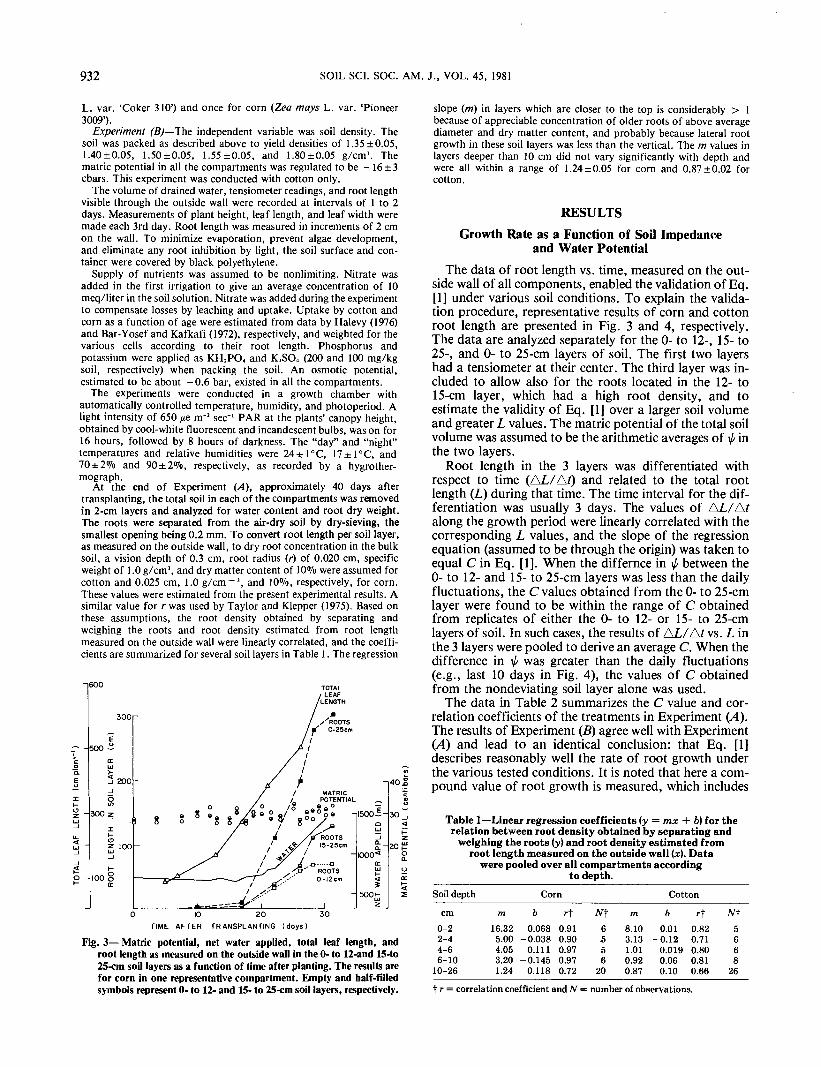
Fig. 3— Matric potential, net water applied, total leaf length, androot length as measured on the outside wall in the 0- to 12-and 15-to25-cm soil layers as a function of time after planting. The results arefor corn in one representative compartment. Empty and half-filledsymbols represent 0- to 12- and 15- to 25-cm soil layers, respectively.
slope (m) in layers which are closer to the top is considerably > 1because of appreciable concentration of older roots of above averagediameter and dry matter content, and probably because lateral rootgrowth in these soil layers was less than the vertical. The m values inlayers deeper than 10 cm did not vary significantly with depth andwere all within a range of 1.24±0.05 for corn and 0.87±0.02 forcotton.
RESULTSGrowth Rate as a Function of Soil Impedance
and Water PotentialThe data of root length vs. time, measured on the out-
side wall of all components, enabled the validation of Eq.[1] under various soil conditions. To explain the valida-tion procedure, representative results of corn and cottonroot length are presented in Fig. 3 and 4, respectively.The data are analyzed separately for the 0- to 12-, 15- to25-, and 0- to 25-cm layers of soil. The first two layershad a tensiometer at their center. The third layer was in-cluded to allow also for the roots located in the 12- to15-cm layer, which had a high root density, and toestimate the validity of Eq. [1] over a larger soil volumeand greater L values. The matric potential of the total soilvolume was assumed to be the arithmetic averages of i/< inthe two layers.
Root length in the 3 layers was differentiated withrespect to time (AL/AO and related to the total rootlength (L) during that time. The time interval for the dif-ferentiation was usually 3 days. The values of AL/Afalong the growth period were linearly correlated with thecorresponding L values, and the slope of the regressionequation (assumed to be through the origin) was taken toequal C in Eq. [1]. When the differnce in \l/ between the0- to 12- and 15- to 25-cm layers was less than the dailyfluctuations, the C values obtained from the 0- to 25-cmlayer were found to be within the range of C obtainedfrom replicates of either the 0- to 12- or 15- to 25-cmlayers of soil. In such cases, the results of AL/A/ vs. L inthe 3 layers were pooled to derive an average C. When thedifference in \f/ was greater than the daily fluctuations(e.g., last 10 days in Fig. 4), the values of C obtainedfrom the nondeviating soil layer alone was used.
The data in Table 2 summarizes the C value and cor-relation coefficients of the treatments in Experiment (.4).The results of Experiment (B) agree well with Experiment(A) and lead to an identical conclusion: that Eq. [1]describes reasonably well the rate of root growth underthe various tested conditions. It is noted that here a com-pound value of root growth is measured, which includes
Table 1—Linear regression coefficients (y = mx + b) for therelation between root density obtained by separating and
weighing the roots (y) and root density estimated fromroot length measured on the outside wall (x). Data
were pooled over all compartments accordingto depth.
Soil depthcm
0-22-44-66-10
10-26
m16.325.004.053.201.24
Corn6
0.068-0.038
0.111-0.145
0.118
rf0.910.900.970.970.72
JVT6556
20
m8.103.131.010.920.87
Cotton6
0.01-0.12
0.0190.060.10
rt0.820.710.800.810.66
N-f5668
26
t r = correlation coefficient and N = number of observations.

BAR-YOSEF & LAMBERT: ROOT GROWTH IN RESPONSE TO SOIL IMPEDANCE AND WATER POTENTIAL 933
2500
2000 S.
40 500 ->
1000 :
300
TIME AFTER TRANSPLANTING (doys)
Fig. 4 — Same as for Fig. 3 but for cotton. The deviation between the tensiometer readings in the two layers represents the worst deviation obtained.
frequency of branching and the elongation of thosebranches.
The results of C in Experiment (A) and Experiment (B)are shown in Fig. 5 which relates Cto the soil impedance.In Experiment (A), as water potential (t/0 varied, so didsoil impedance, since density was constant. According toTaylor et al. (1972), i/< per se has little effect on an in-dividual root elongation rate. The effect of \l/ on the com-pound value of elongation can be evaluated by compar-ing these data with the results in Experiment (B), obtain-ed under conditions of a uniform \J4~ 16 ±3 cbars) andvariable soil bulk density. The comparison indicates thatthe way by which a given soil impedance is obtained af-fects the specific growth rate C. At a given soil im-pedance, C was always lower when the matric potentialwas more negative. At impedances > 20 bars, roots con-tinued to grow under a matric potential of -16 cbars andbulk density of 1.85 g/cm3 but not under a matric poten-tial of -60 cbars and soil density of 1.45 g/cm3. Therelationships in Fig. 5 indicate that C increased when soilimpedance increased from 7 to a range between 13 and 17bars; C decreased with further increases in soil im-pedance. Unfortunately, C was not detemined for cottonTable 2—Specif ic corn and cotton root growth rate (C per day) as
obtained from a linear regression of AL/At on L' t at variousmatric potentials (*) in Experiment (A), assuming
_________ dL/dt = C-L' t and a constant *.Root growth rate
* cbars C per dayCorn
2 ± 17 ± 2
19 ± 329 ± 337 ±462 ± 4
2± 14 ± 1
10 ±323 ±340 ±562 ±5
0.070.280.150.100.110.03
Cotton0.060.090.140.060.030.015
0.970.970.960.850.940.94
0.970.980.930.960.890.95
5576
108
119
1810
78
* The correlation coefficient (r values) are significant at the 0.05 level orbetter.
•)•£' = average length.t N = number of observations.
in soil of 12 to 15 bars impedance, which seems to be acritical range. It is possible that, between 12 and 15 bars,C is greater than the maximum experimental value whichwas 0.15 day "'.
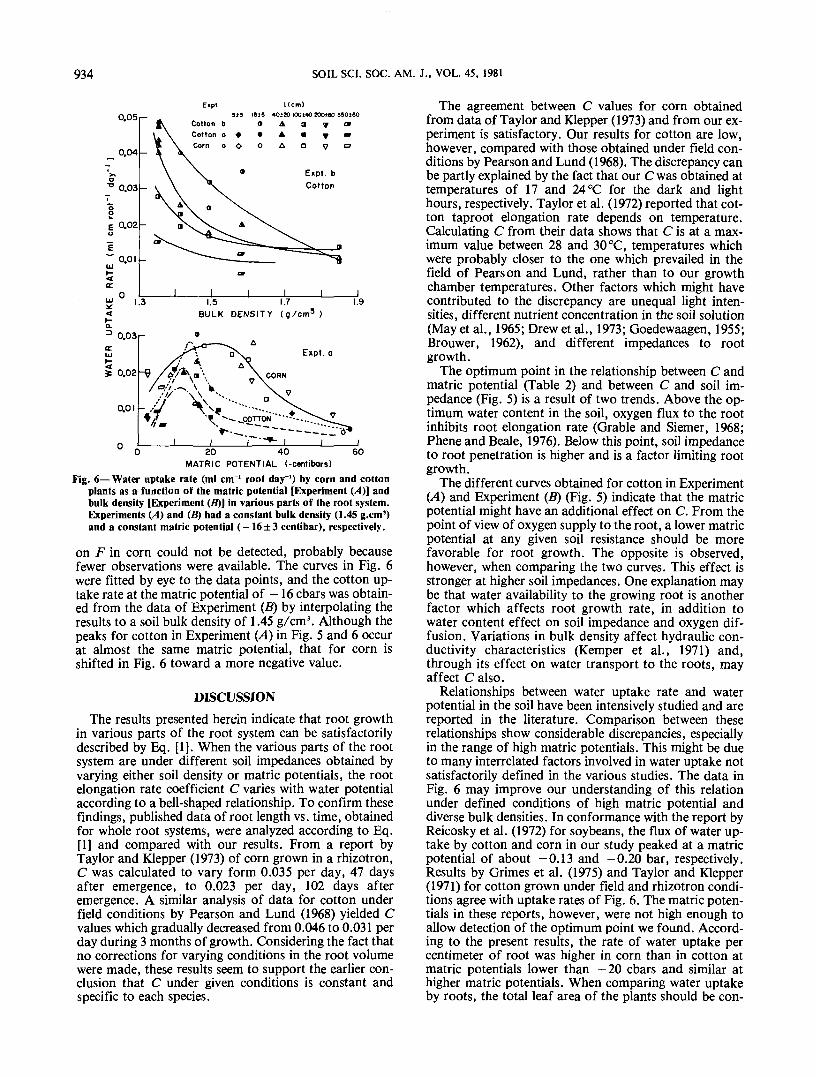
Water UptakeThe simultaneous data of soil water potential, dif-
ference between added and drained water, and rootlength, measured on the wall and extended into the soilvolume, all as a function of time (Fig. 3 and 4), enablethe calculation in each compartment of daily water up-take per unit root length (F). Data in Table 1 were usedto extend the observed root length into the soil, the coef-ficient in the 0- to 12-cm soil layer taken as the weightedaverage of the 2- to 4-, 4- to 6-, and 6- to 10-cm soillayers. The results of F vs. the matric potential at afixed bulk density and of Fvs. the bulk density at a givenmatric potential are shown in Fig. 6. To check whether Fin a given compartment was affected by root age or cor-respondingly by the total root length (L) in that compart-ment, all F values were grouped and analyzed accordingto L. Total root length had an appreciable effect on Fincotton, particularly at low bulk densities [Experiment(B)]. This indicates a drop in root efficiency with age dur-ing the 40 days of the experiment period. The effect of Lo.sr
0.2
0.1
o CORNO COTTON I Y Expt. 0£ COTTON zj• COTTON Expl. b
15 20 25PROBE RESISTANCE (bors)
30
Fig. 5— Corn and cotton root growth rate coefficient (O as a func-tion of soil probe resistance in various parts of the root system. Bulkdensity (1.45 g/cm1) and matric potentials (-16 ±3 centibars) wereheld constant in Experiments (A) and (B), respectively. Cotton ispresented for two replicates to indicate experimental variability.
934 SOIL SCI. SOC. AM. J., VOL. 45, 1981
0.051-Expl
Cotton
Kcm)5*3 15*5 40*20 I00t40 200*60 350*60
1.5 1.7BULK DENSITY (g/cm3 )
Expt. a
1.9
20 40MATRIC POTENTIAL (-centibars)
60
Fig. 6— Water uptake rate (ml cm"1 root day'1) by corn and cottonplants as a function of the matric potential [Experiment (A)] andbulk density [Experiment (/?)] in various parts of the root system.Experiments (A) and (B) had a constant bulk density (1.45 g.cm3)and a constant matric potential (-16 ±3 centibar), respectively.
on F in corn could not be detected, probably becausefewer observations were available. The curves in Fig. 6were fitted by eye to the data points, and the cotton up-take rate at the matric potential of -16 cbars was obtain-ed from the data of Experiment (B) by interpolating theresults to a soil bulk density of 1.45 g/cm3. Although thepeaks for cotton in Experiment (A) in Fig. 5 and 6 occurat almost the same matric potential, that for corn isshifted in Fig. 6 toward a more negative value.
DISCUSSIONThe results presented herein indicate that root growth
in various parts of the root system can be satisfactorilydescribed by Eq. [1]. When the various parts of the rootsystem are under different soil impedances obtained byvarying either soil density or matric potentials, the rootelongation rate coefficient C varies with water potentialaccording to a bell-shaped relationship. To confirm thesefindings, published data of root length vs. time, obtainedfor whole root systems, were analyzed according to Eq.[1] and compared with our results. From a report byTaylor and Klepper (1973) of corn grown in a rhizotron,C was calculated to vary form 0.035 per day, 47 daysafter emergence, to 0.023 per day, 102 days afteremergence. A similar analysis of data for cotton underfield conditions by Pearson and Lund (1968) yielded Cvalues which gradually decreased from 0.046 to 0.031 perday during 3 months of growth. Considering the fact thatno corrections for varying conditions in the root volumewere made, these results seem to support the earlier con-clusion that C under given conditions is constant andspecific to each species.
The agreement between C values for corn obtainedfrom data of Taylor and Klepper (1973) and from our ex-periment is satisfactory. Our results for cotton are low,however, compared with those obtained under field con-ditions by Pearson and Lund (1968). The discrepancy canbe partly explained by the fact that our C was obtained attemperatures of 17 and 24 °C for the dark and lighthours, respectively. Taylor et al. (1972) reported that cot-ton taproot elongation rate depends on temperature.Calculating C from their data shows that C is at a max-imum value between 28 and 30 °C, temperatures whichwere probably closer to the one which prevailed in thefield of Pearson and Lund, rather than to our growthchamber temperatures. Other factors which might havecontributed to the discrepancy are unequal light inten-sities, different nutrient concentration in the soil solution(May et al., 1965; Drew et al., 1973; Goedewaagen, 1955;Brouwer, 1962), and different impedances to rootgrowth.
The optimum point in the relationship between C andmatric potential (Table 2) and between C and soil im-pedance (Fig. 5) is a result of two trends. Above the op-timum water content in the soil, oxygen flux to the rootinhibits root elongation rate (Grable and Siemer, 1968;Phene and Beale, 1976). Below this point, soil impedanceto root penetration is higher and is a factor limiting rootgrowth.
The different curves obtained for cotton in Experiment(A) and Experiment (B) (Fig. 5) indicate that the matricpotential might have an additional effect on C. From thepoint of view of oxygen supply to the root, a lower matricpotential at any given soil resistance should be morefavorable for root growth. The opposite is observed,however, when comparing the two curves. This effect isstronger at higher soil impedances. One explanation maybe that water availability to the growing root is anotherfactor which affects root growth rate, in addition towater content effect on soil impedance and oxygen dif-fusion. Variations in bulk density affect hydraulic con-ductivity characteristics (Kemper et al., 1971) and,through its effect on water transport to the roots, mayaffect C also.
Relationships between water uptake rate and waterpotential in the soil have been intensively studied and arereported in the literature. Comparison between theserelationships show considerable discrepancies, especiallyin the range of high matric potentials. This might be dueto many interrelated factors involved in water uptake notsatisfactorily defined in the various studies. The data inFig. 6 may improve our understanding of this relationunder defined conditions of high matric potential anddiverse bulk densities. In conformance with the report byReicosky et al. (1972) for soybeans, the flux of water up-take by cotton and corn in our study peaked at a matricpotential of about -0.13 and -0.20 bar, respectively.Results by Grimes et al. (1975) and Taylor and Klepper(1971) for cotton grown under field and rhizotron condi-tions agree with uptake rates of Fig. 6. The matric poten-tials in these reports, however, were not high enough toallow detection of the optimum point we found. Accord-ing to the present results, the rate of water uptake percentimeter of root was higher in corn than in cotton atmatric potentials lower than —20 cbars and similar athigher matric potentials. When comparing water uptakeby roots, the total leaf area of the plants should be con-

BAR-YOSEF & LAMBERT: ROOT GROWTH IN RESPONSE TO SOIL IMPEDANCE AND WATER POTENTIAL 935
sidered. Measurements with an estimated standard errorof ±15% showed that the leaf area of the corn plant was240, 1,060, and 2,350 cm2 at 10, 20, and 30 days afterplanting, and 3,050 cm2 at the end of the experiment. Thecorresponding leaf areas for cotton under identical con-ditions [Experiment (A)] were 240, 460, 1,100, and1,800 cm2. This difference, which may not becharacteristic of field conditions, might explain the factthat the flux of water uptake in the field was reported tobe greater for cotton than for corn (Grimes et al., 1975).The complexity of such a comparison is demonstratedby the data (Fig. 6) of Experiment (B) which show thatwater uptake rate by cotton at a soil bulk density of 1.35g/cm3 and matric potential of - 16 cbars is higher thanthe maximum value obtained for corn in Experiment(A). The corresponding water uptake rate by corn in Ex-periment (B) was not determined.
Analyses of the effect of root age on water uptake rateshow that the uptake efficiency of cotton decreased withincreasing total root length. This appears to agree with aconclusion drawn by Taylor and Klepper (1973) for corngrown under noncontrolled conditions, although in thepresent experiment, the data obtained for corn do notallow such a conclusion.
The effect of soil bulk density on water uptake ratemay be attributed to its effect on soil hydraulic conduc-tivity. Kemper et al. (1971) show that increasing the soilbulk density from 1.10 to 1.60 g/cm3 at a constant matricpotential of -0.30 bar or higher results in a reduced un-saturated hydraulic conductivity. This trend may ex-plain the results in Fig. 6, which show a reduced flux ofwater uptake when the soil bulk density is increased.The soil bulk density effect on water uptake seems tovary with root age. Younger roots show a strongerdependency on soil bulk density than older roots 300 cmin length. The age effect is probably due to the fact thatthe relative importance of the root or soil resistance towater flow in the root is varying with time. In youngroots, the root resistance component is smaller than inolder roots (Taylor and Klepper, 1973) and hence varia-tions in soil resistance will influence water uptake morethan in old roots.