corine land cover 2000 – germany · corine land cover 2000 – germany final report dlr-dfd ii...
TRANSCRIPT

CORINE Land Cover 2000 – Germany
Final Report
by
Manfred Keil, Ralph Kiefl, Günter Strunz
Project Period: 1 May 2001 - 31 December 2004
THIS PROJECT WAS EXECUTED USING FINANCIAL SUPPORT BY DG REGIO AND THE GERMAN FEDERAL MINISTRY ON ENVIRONMENT, NATURE
CONSERVATION AND NUCLEAR SAFETY (BMU) ON BEHALF OF THE GERMAN FEDERAL ENVIRONMENTAL AGENCY (UBA)
July 2005
German Aerospace Center German Remote Sensing Data Center Oberpfaffenhofen 82234 Wessling


CORINE Land Cover 2000 – Germany
Final Report DLR-DFD I
TABLE OF CONTENTS
Summary 1
1 Introduction 3 1.1 Objectives 3 1.2 Initial conditions 3 1.3 Basic Documents of the Methodology 4 1.4 Organizational Project Structure 4 1.5 Progress of the Project 6
2 Methodology 9 2.1 Base Data 9
2.1.1 Primary Satellite Imagery 9 2.1.2 Vector Dataset CLC1990 11 2.1.3 Ancillary Data 11
2.2 Preprocessing 12 2.2.1 Selection Procedure and Quality Control of the Satellite Imagery of 2000 12 2.2.2 Geometric Correction of the Satellite Imagery of 1990 12 2.2.3 Geometric Correction of the Vector Dataset CLC1990 13
2.3 Interpretation and Mapping Procedure 13 2.3.1 Nomenclature of CORINE Land Cover 14 2.3.2 Adaptation of the CLC Nomenclature of 1990 and 2000 in Germany 15 2.3.3 Methodology for the Update Procedure – Compliance with Minimum Mapping Units and
Generalization 16 2.3.4 Digitization of Land Use Changes 16 2.3.5 Labelling of Technical Changes 19 2.3.6 Mapping of a Buffer Zone around the German Borders 20 2.3.7 Specific Characteristics of Mapping in the Wadden Sea Region 20 2.3.8 Field Surveys 21 2.3.9 Preparation of Metadata 22
2.4 Quality Assurance and Verification 23 2.4.1 Technical Control Procedure at DFD 24 2.4.2 Thematic Control Procedure at DFD 25 2.4.3 Verification by the Technical Team of ETC-TE 25 2.4.4 Validation 27
2.5 Data Integration and Dissemination 27 2.5.1 Data Integration 27 2.5.2 Final Acceptance 27 2.5.3 Data Dissemination 27
2.6 Workshop ‘CORINE Land Cover 2000’ 29
3 Results of Interpretation and Mapping 30 3.1 CLC-Products 30 3.2 Experiences during the Interpretation Procedure 31
3.2.1 Experiences during the Correction Procedure of Vector Dataset CLC1990 31 3.2.2 Experiences during the Mapping Procedure of the Vector Dataset CLC2000 33 3.2.3 Experiences during the Mapping Procedure of Land Use Changes 35
3.3 Examples of Land Use Changes 36 3.3.1 Land Use Changes in the Region of Leipzig 36 3.3.2 Land Use Changes in the Region of Berlin 37

CORINE Land Cover 2000 – Germany
Final Report DLR-DFD II
3.3.3 Land Use Changes in the Emsland Region, North-western Germany 39 3.3.4 Impacts of Storm Damages in Northern Black Forest 39 3.3.5 Land Use Changes in the Mining Areas of the Niederlausitz Region 40
4 Results of Data Analysis 42 4.1 CLC1990_rev 42 4.2 CLC2000 44 4.3 CLC_Changes 45
4.3.1 Land Use Conversions in CLC Level 3 46 4.3.2 Aggregated Land Use Conversions in CLC Level 1 48 4.3.3 Balances of Land Use Changes between 1990 and 2000 50 4.3.4 Relative Changes of the Main Categories 53
5 Conclusions and Lessons Learnt 55
6 References 56
Annex 1: Main Tasks and Responsible Persons 58
Annex 2: Parameter for Projections and Datum of CLC Germany 59
Annex 3: Priority Table 60
Annex 4: Adaptation of CLC Nomenclature 1990 / 2000 in Germany 61
Annex 5: Description of Vector Data 64
Annex 6: CLC2000 Metadata on Country Level for Germany 65
Annex 7: Example of CLC2000 Metadata on Working Unit Level 68
Annex 8: Matrix of Unusual Changes 71
Annex 9: Area Size and Percentage of CLC Classes for the Geometrically Corrected Dataset CLC1990 72

CORINE Land Cover 2000 – Germany
Final Report DLR-DFD III
List of Figures Figure 1: Organizational structure within the EU wide project 4 Figure 2: Tasks and project structure in the German CLC2000 project 5 Figure 3: Workflow and responsibilities in the German CLC2000 project 5 Figure 4: Coverage of lots and mapping units in Germany 7 Figure 5: Landsat coverage and mapping units of Germany 10 Figure 6: Example of the adjustment of CLC1990 vector data. 13 Figure 7: Legend of the CORINE land use classes in Germany 15 Figure 8: Examples of simple CLC changes (source: EEA and ETC, 2002) 17 Figure 9: Examples of complex CLC changes (source: EEA and ETC, 2002) 18 Figure 10: Schematic representation of the approach for the update of CORINE Land Cover 19 Figure 11: Example of a technical change associated with the increase of a commercial area 20 Figure 12: Example of fieldphoto and associated subset of Landsat7 imagery. 21 Figure 13: Field survey points of CLC2000 in Germany 22 Figure 14: Technical control procedures for CLC2000 vector data at DFD 24 Figure 15: Coverage of the working units checked on verification meetings 26 Figure 16: CLC2000 for Germany as an overlay of CLC1990 of the neighbouring countries 28 Figure 17: Example of the CLC products: Working unit TK100 Bremen 30 Figure 18: Example of the adaptation of the interpretation rules: ribbon-built village near
Papenburg 31 Figure 19: Improved satellite imagery for the interpretation procedure 33 Figure 20: Improved discrimination of arable land and pasture by the use of additional multi-
temporal Landsat imagery 34 Figure 21: The region of Leipzig in the map products of CLC1990 and CLC2000 (above) and
generalized transformation classes (below) 36 Figure 22: Landsat 7 imagery of August 2000 (above) and the map product CLC2000 (below) of
the Berlin region 37 Figure 23: Land use dynamics in the region of Berlin 38 Figure 24: Representation of a new built automobile proving ground in the Emsland region in the
products of CORINE Land Cover 39 Figure 25: Damaged areas due to windthrow in Northern Black Forest near Rastatt 40 Figure 26: Land use and land use changes in the Niederlausitz region 41

CORINE Land Cover 2000 – Germany
Final Report DLR-DFD IV
List of Tables Table 1: Tendering for the lots for interpretation and mapping in Germany 6 Table 2: Important dates during the project 8 Table 3: Spectral bands of sensors Landsat 5 TM and Landsat 7 ETM+ 9 Table 4: Landsat 7 scenes used for CLC2000 update in Germany 10 Table 5: Landsat 5 scenes used for primary assessment CLC1990 11 Table 6: Nomenclature of CORINE Land Cover classes in Europe 14 Table 7: Examples of attribute assignment according to the classification key 18 Table 8: CLC classes relevant for the German Wadden Sea region 20 Table 9: Items of the field survey data base 21 Table 10: Example of compact metadata sheet on working unit level 23 Table 11: Percentage of mapping units checked on verification meetings 26 Table 12: Number of polygons of CLC1990 und CLC1990_rev 32 Table 13: Changes of number of polygons and total area of main categories after the revision
process of CLC1990 32 Table 14: Number of polygons of CLC1990_rev and CLC2000 32 Table 15: Area and percentage of CLC main classes level 1 in the Old and New Federal States
and for Germany to the status 1990 42 Table 16: Area and percentage of CLC classes level 2 in the Old and New Federal States and
for Germany to the status 1990 42 Table 17: Area and percentage of CLC classes level 3 in the Old and New Federal States and
for Germany to the status 1990 43 Table 18: Area and percentage of main CLC classes level 1 in the Old and New Federal States
and for Germany to the status 2000 44 Table 19: Area and percentage of CLC classes level 2 in the Old and New Federal States and
for Germany to the status 2000 44 Table 20: Area and percentage of CLC classes level 3 in the Old and New Federal States and
for Germany to the status 2000 44 Table 21: Dominant land use changes between 1990 and 2000 in Germany 46 Table 22: Dominant land use changes between 1990 and 2000 in the Old Federal States 47 Table 23: Dominant land use changes between 1990 and 2000 in the New Federal States 47 Table 24: Changes of CLC classes level 1 between 1990 and 2000 in Germany 49 Table 25: Changes of CLC classes level 1 between 1990 and 2000 in the Old Federal States 49 Table 26: Changes of CLC classes level 1 between 1990 and 2000 in the New Federal States 49 Table 27: Balance of land use changes between 1990 und 2000 in Germany 51 Table 28: Balance of land use changes between 1990 and 2000 in the Old and the New Federal
States 52 Table 29: Percentage and relative change between 1990 and 2000 of selected classes in
Germany 53 Table 30: Percentage and relative change between 1990 and 2000 of selected classes in the
Old and the New Federal States 54

CORINE Land Cover 2000 – Germany
Final Report DLR-DFD 1
Summary This report summarizes the results of the project ‘CORINE Land Cover 2000 – Germany’, which was performed within the framework of the European-wide project CLC2000 and which generated up-to-date maps of land use and land cover and their changes within the last 10 years for Germany. It describes the project structure and organization, the underlying methodology and nomenclature, the processing steps for the generation of the maps, the final products of the project, and the data analysis of the results. The German project was integrated in the European-wide project “IMAGE 2000 & CORINE Land Cover 2000” with the European Environment Agency (EEA) being the responsible insti-tution for CLC2000 and the Joint Research Centre (JRC) of the European Commission being responsible for the sub-project IMAGE2000 and the pre-processing of the satellite images. In Germany the project was under the responsibility of the Federal Ministry on Environment, Nature Conservation and Nuclear Safety (BMU) and the Federal Environmental Agency (UBA). On behalf of the UBA the German Remote Sensing Data Center (DFD) of the Ger-man Aerospace Center (DLR) was mandated for the coordination and management of the project. Moreover, several companies were integrated in the German CLC2000 team, which were contracted for the interpretation of the satellite images. The monitoring of the national project development was performed by the project steering committee with members from BMU, UBA and DLR. The project started in May 2001 and ended with the delivery of the final products in Decem-ber 2004. The main tasks in the project were the selection of the appropriate satellite scenes, the pre-processing of the CLC1990 data, the mapping of land cover 2000 and its changes with respect to CLC1990, the validation and quality control of the data, the integration of the results for the complete coverage of Germany, and the delivery of the results. The selection of the appropriate scenes from Landsat 7 ETM+ satellite images was done in close cooperation with the JRC. The main criteria were the cloud coverage and the acquisi-tion date, which should be during the vegetation period. This resulted in the selection of 18 scenes from the year 2000, and 9 scenes from 1999 as well as 4 scenes from 2001. The ortho-rectification of these 31 scenes was done by JRC through a subcontract with Metria (Sweden). The pre-processing of the CLC1990 image and thematic data was performed by DLR. It in-cluded the transformation of the Landsat 5 TM satellite images and the results of the inter-pretation CLC1990 to the geometric reference IMAGE2000. This was necessary, because the Landsat 5 TM data, which were used for the first CLC mapping (CLC1990), were not or-tho-rectified. The transformation of the Landsat 5 TM data was done by an image-to-image co-registration via control points. About 25-50 points were applied per scene for the trans-formation of the CLC1990 satellite images. The geometric transformation of the vector data CLC1990 to the reference IMAGE2000 was performed on the basis of a rubber sheeting ap-proach, which uses so-called link vectors to determine the direction and the amount of the correction for each of the vector polygons. About 120 link vectors per map sheet were nec-essary to ensure the accuracy of the transformation. As result of these pre-processing steps the image data 1990 and the vector data 1990 were geometrically compatible to the geomet-ric reference of IMAGE2000. The interpretation and mapping for the generation of CLC2000 was done in cooperation with companies, which have been sub-contracted by DLR. The mapping area was sub-divided into 6 lots with the first lots covering the New Federal States in Germany. The contracted companies were EFTAS (3 lots), GAF AG (2 lots), and Infoterra GmbH in cooperation with Hugin GmbH and Delphi IMM GmbH (1 lot). The land cover classification key for the interpre-tation was compliant with the common European-wide CLC nomenclature, which consists of 44 classes, out of which 37 classes are relevant in Germany. Data integration and generation of the final products was performed by DLR. The results of the mapping are provided as 3 products: (1) the data set CLC2000, which represents the up-to-date status of land use and land cover in 2000, (2) the data set CLC_Change, which includes the changes between 2000 and 1990, and (3) CLC1990_rev, the revised status of land use and land cover in 1990.
CORINE Land Cover 2000 – Germany
Final Report DLR-DFD 2
Quality assurance and verification was performed at each project phase. Technical control procedures were implemented and applied to check e.g. for compliance with the minimum mapping units (25 ha and 5 ha, respectively) or for correct edge matching in adjacent map-ping units. Thematic control procedures included the visual checks of interpretation results as well as field checks performed by DLR and the involved companies. The verification of the CLC products was performed by the technical team of the European Topic Centre on Terres-trial Environment (ETC-TE) in 3 verification meetings in Germany in Oct. 2002, Nov. 2003 and Oct. 2004, where in total 151 map sheets were checked. The final acceptance of the products was performed in December 2004, where the final data set was accepted and ap-proved for publication. CLC2000 data dissemination started on 21 December 2004. The CLC2000 products for Ger-many can be ordered online (via FTP transfer) or off-line (on DVD) via the German CLC2000 website (http://www.corine.dfd.dlr.de). The data are available in several reference systems (Gauss-Krueger zone 3 and 4, UTM zone 32). The final products CLC2000, CLC_Change, and CLC1990_rev are provided as (1) vector data for complete Germany, additionally the products for each of the Federal States, and (2) raster data at various spatial resolutions (100 m, 250 m, 1 km) and different file formats. Moreover, for each of the 215 mapping units (map sheets 1:100.000) the respective metadata are included. The user workshop ‘CORINE Land Cover 2000 in Germany and Europe and its use for Envi-ronmental Applications’ was held in January 2004 in Berlin. 108 participants from 17 Euro-pean countries participated in the workshop to discuss the possible use of the CLC2000 data in various application fields. The presented pilot applications covered examples from trans-boundary air pollution, reporting on the water framework, as well as the regional and trans-portation planning. Furthermore, the user requirements for future updates of CLC2000 were discussed and recommendations are formulated. The workshop proceedings were published and are available as ‘UBA Texte’. This project report also includes a detailed statistical analysis of the CLC2000 results. It high-lights significant trends and changes of land use and land cover in Germany. This analysis was performed on a very detailed level for each of the 37 CLC classes as well as on an ag-gregated level for the 5 main CLC categories. Moreover, the differences between the Old and the New Federal States in Germany are analysed and compared. Finally, the report ends with the conclusions and lessons learnt in CLC2000 project.
CORINE Land Cover 2000 – Germany
Final Report DLR-DFD 3
1 Introduction 1.1 Objectives The characterisation of land use and land cover represents one of the basic spatial informa-tions concerning the description of the environmental conditions and the relevant factors. Fertilizing and plant protection substances reach arable land and meadows and affect the quality of water, soil and air. Mineral extraction sites and dump sites pollute predominantly the closer environment. Furthermore, large-area and transnational environmental effects on air and water are highly related to land use and different absorption and conversion charac-teristics of the respective ecological systems. On the other hand, the trends of surface seal-ing, e.g. in the suburban areas of the cities, are reflected in land use dynamics. In order to obtain comparable information bases for land use and land cover for the European environ-mental policy, the EU wide programme CORINE Land Cover was initiated in the middle of the 1980s (CORINE: ‘Coordinated Information on the Environment’). CORINE is funded by the European Union and the European Environment Agency, in cooperation with the member states. In this program, a European-wide harmonized classification key and a co-ordinated methodology were developed to map land use and land cover based on satellite imagery. The first inventory of CORINE Land Cover of Germany was coordinated by the Federal Sta-tistic Office of Germany (StBA) on behalf of the Federal Environmental Agency (UBA) and the Federal Ministry on Environment, Nature Conservation and Nuclear Safety (BMU) and was finished in 1996. It was based on data of the satellite Landsat 5 Thematic Mapper, ac-quired in the vegetation period of the years 1989 to 1992. Hence the primary survey is called CLC90 or CORINE Land Cover 1990, in the European context. From the agreed 44 land use categories in Europe, 37 categories are relevant for Germany. Land use information was derived as vector data by visual, GIS supported interpretation. The objective of the present project CORINE Land Cover 2000 was to update the CLC data of Germany for the reference year 2000 and to map the changes in comparison to 1990. The Federal Environmental Agency mandated the German Remote Sensing Data Center (DFD) of the German Aerospace Center (DLR) for that survey. In the first phase, the New Federal States should be mapped since it was assumed that due to the change of the political and economic system after the reunification the largest land use and land cover changes took place in the former GDR. The mapping procedures had to be compliant to the European-wide agreed specifications regarding the nomenclature and minimum mapping units, 25 hec-tars for new land use units and 5 hectares for change areas. Main data base for CORINE Land Cover 2000 were satellite images of the Landsat 7 Enhanced Thematic Mapper (ETM+) acquired in the years 1999 to 2001. German companies should be integrated via a limited call for tenders for the work packages of interpretation and mapping of land use changes. Thereby the interpretation should benefit as much as possible from existing experience ob-tained during the primary survey of CORINE Land Cover.
1.2 Initial conditions On the European level, the project I&CLC2000 was started for the update of the CORINE Land Cover data base to the reference year 2000. The ‘I’ represents the project component IMAGE2000, a subproject in the responsibility of the Joint Research Centre of the European Commission (JRC) in Ispra. In the frame of IMAGE2000 an ortho-rectified data base for the coverage of the involved European member states was generated using Landsat 7 ETM+ data from the vegetation periods of the years 1999 to 2001. The national project partners were involved in the selection procedure of the Landsat scenes. Besides the multi-spectral data of Landsat 7 ETM in a pixel spacing of 25 m by 25 m, the corresponding panchromatic band was provided in an enlarged resolution of 12.5 m by 12.5 m. The ortho-rectified data basis IMAGE2000 enabled a higher geometrical accuracy of derived land use products, since the Landsat 5 TM data base used in CORINE Land Cover 1990 was not ortho-rectified. Thus an additional image to image adjustment of the satellite images of 1990 as well as an adjustment of the primary vector data set CLC90 to the ortho-rectified Landsat data of 2000 was required. The adjustment represented a very important task in
CORINE Land Cover 2000 – Germany
Final Report DLR-DFD 4
order to differentiate effects of border shifts due to changes of land use and effects of purely geometrically shifts. The geometrical adaptation of the vector data CLC90 and of the satellite data of 1990 were performed within the national projects. As an additional reference data set, the Federal Environmental Agency (UBA) provided the digital topographical map 1:25000 (TK25) with full coverage of Germany in a status of update between 1997 and 1999.
1.3 Basic Documents of the Methodology Pilot surveys regarding the method for the CLC update and the mapping of changes had been performed in an accompanying study of the German primary assessment (Deggau et al. 1998). In addition, studies were performed on behalf of the EEA, especially at the Joint Research Centre in Ispra. In the ‘Technical Guides’ the agreed nomenclature and update methodology were described. The following documents were available at the beginning of the project in Germany:
• I&CL2000 Project Document of the Update of the CORINE Land Cover; EEA 2000 • Deggau, M., H. Stralla, A. Wirthmann: Klassifizierung von Satellitendaten (CORINE
Land Cover), Endbericht zum Forschungsprojekt UFOPLAN 291 91 055/00, Statisti-sches Bundesamt Wiesbaden, Dezember 1998.
• CD Publikation ‘Daten zur Bodenbedeckung für die Bundesrepublik Germany’, Statis-tisches Bundesamt; 1997
• CORINE Land Cover - Technical Guide (Red Book); EU; Brussels 1994 • CORINE Land Cover Technical Guide - Addendum 2000; BOSSARD et al, 2000 • Technical and Methodological Guide for Updating CORINE Land Cover Data Base;
CEC; Brussels 1997 • CORINE Land Cover update - I&CLC2000 project, Technical Guidelines, Final ver-
sion, EEA, August 2002
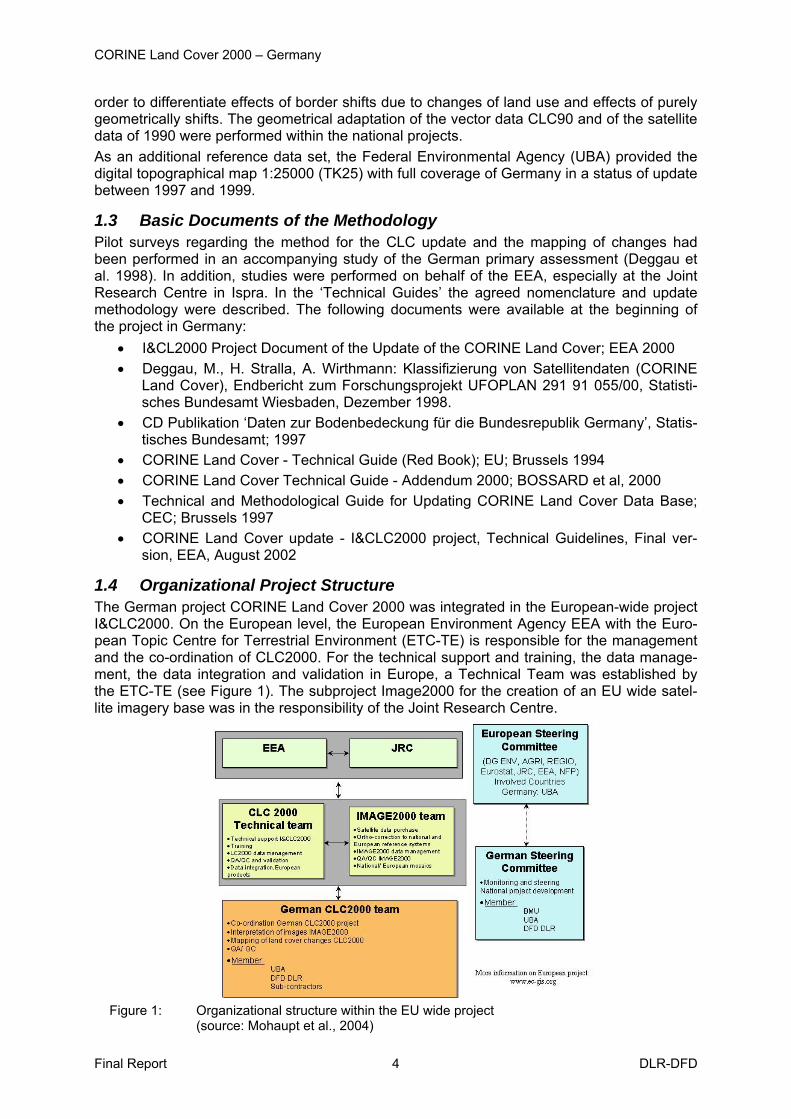
1.4 Organizational Project Structure The German project CORINE Land Cover 2000 was integrated in the European-wide project I&CLC2000. On the European level, the European Environment Agency EEA with the Euro-pean Topic Centre for Terrestrial Environment (ETC-TE) is responsible for the management and the co-ordination of CLC2000. For the technical support and training, the data manage-ment, the data integration and validation in Europe, a Technical Team was established by the ETC-TE (see Figure 1). The subproject Image2000 for the creation of an EU wide satel-lite imagery base was in the responsibility of the Joint Research Centre.
Figure 1: Organizational structure within the EU wide project
(source: Mohaupt et al., 2004)
CORINE Land Cover 2000 – Germany
Final Report DLR-DFD 5
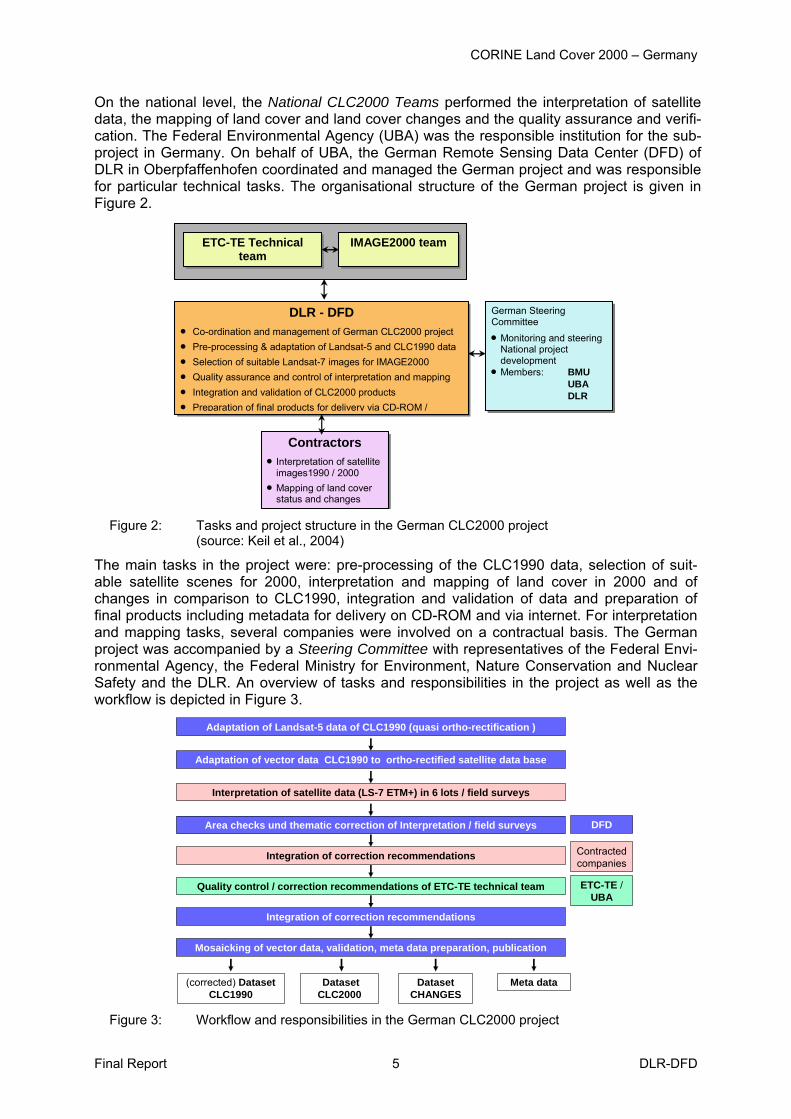
On the national level, the National CLC2000 Teams performed the interpretation of satellite data, the mapping of land cover and land cover changes and the quality assurance and verifi-cation. The Federal Environmental Agency (UBA) was the responsible institution for the sub-project in Germany. On behalf of UBA, the German Remote Sensing Data Center (DFD) of DLR in Oberpfaffenhofen coordinated and managed the German project and was responsible for particular technical tasks. The organisational structure of the German project is given in Figure 2.
ETC-TE Technical
team IMAGE2000 team
DLR - DFD• Co-ordination and management of German CLC2000 project • Pre-processing & adaptation of Landsat-5 and CLC1990 data • Selection of suitable Landsat-7 images for IMAGE2000 • Quality assurance and control of interpretation and mapping • Integration and validation of CLC2000 products • Preparation of final products for delivery via CD-ROM /
German Steering Committee • Monitoring and steering
National project development
• Members: BMU UBA DLR
Contractors• Interpretation of satellite
images1990 / 2000 • Mapping of land cover
status and changes Figure 2: Tasks and project structure in the German CLC2000 project
(source: Keil et al., 2004)
The main tasks in the project were: pre-processing of the CLC1990 data, selection of suit-able satellite scenes for 2000, interpretation and mapping of land cover in 2000 and of changes in comparison to CLC1990, integration and validation of data and preparation of final products including metadata for delivery on CD-ROM and via internet. For interpretation and mapping tasks, several companies were involved on a contractual basis. The German project was accompanied by a Steering Committee with representatives of the Federal Envi-ronmental Agency, the Federal Ministry for Environment, Nature Conservation and Nuclear Safety and the DLR. An overview of tasks and responsibilities in the project as well as the workflow is depicted in Figure 3.
Adaptation of vector data CLC1990 to ortho-rectified satellite data base
Interpretation of satellite data (LS-7 ETM+) in 6 lots / field surveys
Area checks und thematic correction of Interpretation / field surveys
Integration of correction recommendations Contractedcompanies
DFD
Integration of correction recommendations
Quality control / correction recommendations of ETC-TE technical team
Mosaicking of vector data, validation, meta data preparation, publication
(corrected) Dataset CLC1990
DatasetCHANGES
Dataset CLC2000
ETC-TE /UBA
Adaptation of Landsat-5 data of CLC1990 (quasi ortho-rectification )
Meta data
Figure 3: Workflow and responsibilities in the German CLC2000 project

CORINE Land Cover 2000 – Germany
Final Report DLR-DFD 6
1.5 Progress of the Project The project started on 1st May 2001. In the first phase of the project, various preprocessing steps were accomplished at DFD. The preprocessing included the acquisition of utilisable satellite data for 2000 in co-operation with the JRC, as well as the adaptation of the vector data of the primary assessment CLC90 and the associated satellite data to the new ortho-rectified Landsat 7 data base. These preprocessing steps were essential to enable a mean-ingful and reasonable accomplishment of the following tasks. For the tasks of interpretation and mapping, German companies, which could exhibit experi-ences from the primary assessment in Germany, were involved via a limited tender process. In phase A, three working areas (lots 1, 2 and 3) could be tendered in parallel. Lots 1 and 2 covered the New Federal States, lot 3 covered North-West Germany with the coastal regions of Lower Saxony and Schleswig-Holstein. In consequence of delays in the proportionate European Union funding, lots 4, 5 and 6 in the Old Federal States of Germany had to be ten-dered successively in the following phase B (see Table 1).
Table 1: Tendering for the lots for interpretation and mapping in Germany
Lot Date of Call for Tender
Contracted Company or Consortium
Date of Contracting
Lot 1 29 AUG 2001 GAF AG 22 OCT 2001
Lot 2 29 AUG 2001 Infoterra GmbH (in cooperation with Hugin GmbH und Delphi IMM GmbH)
22 OCT 2001
Lot 3 29 AUG 2001 EFTAS 22 OCT 2001
Lot 4 21 AUG 2002 EFTAS 9 OCT 2002
Lot 5 29 JUL 2003 EFTAS 15 SEP 2003
Lot 6 8 MAR 2004 GAF AG 29 APR 2004 The allocation of the lots and the coverage by the corresponding map sheets in scale 1:100.000 as mapping units are represented in Figure 4. In order to ensure a harmonized mapping of CORINE Land Cover in the regions of Germany and also in the European-wide context, a training for the co-ordinated interpretation and mapping was essential. For that, the participating company teams and co-workers in the DFD were trained in a harmonized interpretation at the beginning of the interpretation phase. Two training meetings at the DFD in Oberpfaffenhofen were led by members of the ETC-TE technical team (see Table 2). During the work in the lots, upcoming questions were dis-cussed on several status meetings with the company teams which gave the opportunity to coordinate the approach in detail. Several quality assurance procedures were established to guarantee a comparable, harmo-nized proceeding concerning the interpretation and mapping in the different lots. Accompany-ing field surveys were important components of the concept of quality assurance and were performed both by the companies and by the team of the DFD. Experiences gained during the field surveys improved the thematic accuracy of the interpretations in a significant way. The mapping products were transferred to DFD in several partial deliveries per lot for the technical and thematic control and returned with recommendations for corrections. In many regions, several iterations were necessary to produce consistent and comparable map prod-ucts. Phase A, covering the lots 1 to 3, was concluded with a status meeting at the UBA in Berlin at the 22nd of August 2002. Besides the participating companies, representatives of the us-ers of the Federal Environmental Agency (UBA) and the German Federal Agency for Nature Conservation (BfN) attended this meeting.

CORINE Land Cover 2000 – Germany
Final Report DLR-DFD 7
In August 2002 the call for tender for lot 4 was released, which was the beginning of phase B. But still numerous correction steps had to be performed, especially in lot 2. Due to these extensive corrections, a remarkable improvement of the CLC1990 data set could be achieved, which was essential for the derivation of a significant change layer (changes of the land cover between 1990 and 2000).
Figure 4: Coverage of lots and mapping units in Germany
On 18 April 2003 the ’Final Report - First Grant Agreement’ and the first data products were sent to ETC-TE and EEA. The products of the first partial delivery covered about 58 % of lots 1 and 2, and about 70 % of lot 3, which represent about 30 % of the coverage of Germany. The high effort for the correction of the CLC1990 data set which was not to be foreseen in the beginning of the project made an increase in funding necessary, which was granted in July 2003 by the Federal Ministry on Environment, Nature Conservation and Nuclear Safety.

CORINE Land Cover 2000 – Germany
Final Report DLR-DFD 8
The increased funding included also funds for the organisation and performance of a Euro-pean wide user workshop on CORINE Land Cover in Germany. From 20 to 21 January 2004, the workshop ‘CORINE Land Cover 2000 in Germany and Europe and its use for environmental applications’ was performed in Berlin with 108 partici-pants from 17 European countries (see chapter 2.6). The check of the two main products CLC2000 and CLC_Changes by the ETC-TE Technical Team was done on three verification meetings at DLR in Oberpfaffenhofen. Besides techni-cal checks of the polygons and checking of unusual changes, detailed thematic checks were done on sample areas covering about 8 % of the whole mapping area. Concerning the map products CLC2000, no major corrections were necessary for the most working units. But con-cerning the product CLC_Changes, extensive corrections had to be done in several regions, especially in the Southern New Federal States. These corrections were mainly necessary due to erroneous interpretations in the data set CLC1990. In November and December 2004, the integration of the six lots and the buffer zone near the German border was concluded. At 14th and 17th of December 2004, the vector data products CLC1990_rev, CLC2000 and CLC_Changes were delivered to the ETC-TE Technical Team for the final check, followed by the metadata at 20 December. At 21 December 2004, the German CLC products could be published on a password protected ftp server of DLR. From that date on, the CLC data can be ordered online via the internet address http://www.corine.dfd.dlr.de. Since end of April 2005, the German CLC products are available also on DVD. An overview of the most important dates in the project is shown Table 2.
Table 2: Important dates during the project
1 May 2001 Start of the project 22 Oct 2001 Contracting GAF AG (lot 1), Infoterra GmbH (lot 2) und EFTAS ( lot 3)
as subcontractors 25 Oct 2001 Kick-off meeting at DLR Oberpfaffenhofen 11. Dec 2001 Interpretation workshop (first training) with representatives of ETC-TE,
UBA and contracted companies at DFD in Oberpfaffenhofen 5 -7 Feb 2002 Training workshop with representatives of ETC-TE, UBA and subcon-
tractors at DFD in Oberpfaffenhofen 22 Aug 2002 Status meeting concluding phase A (lots 1-3) at UBA in Berlin 9 Oct 2002 Contracting EFTAS for lot 4 29-31Oct 2002 1st Verification at DFD in Oberpfaffenhofen 18 Apr 2003 1st partial delivery and report to ETC-TE and EEA as results of the First
Grant Agreement 15 Sep 2003 Contracting EFTAS for lot 5 28 – 29 Oct 2003 Participation at the Technical CLC2000 Workshop in Bruxelles 3 Nov 2003 Delivery of lots 1,2,3 (45% of the area of Germany ) to ETC-TE and
EEA 19-21 Nov 2003 2nd Verification Meeting at DFD in Oberpfaffenhofen 20-21 Jan 2004 Workshop ‘CORINE LAND COVER 2000 in Germany and Europe and
its use for environmental applications’ in Berlin 29 Apr 2004 Contracting GAF AG for lot 6 11-15 Oct 2004 3rd Verification Meeting at DFD in Oberpfaffenhofen 17 Dec 2004 Full delivery of CLC data products (final version) to ETC-TE 21 Dec 2004 Publication of the CLC data products in the internet
CORINE Land Cover 2000 – Germany
Final Report DLR-DFD 9
2 Methodology
2.1 Base Data
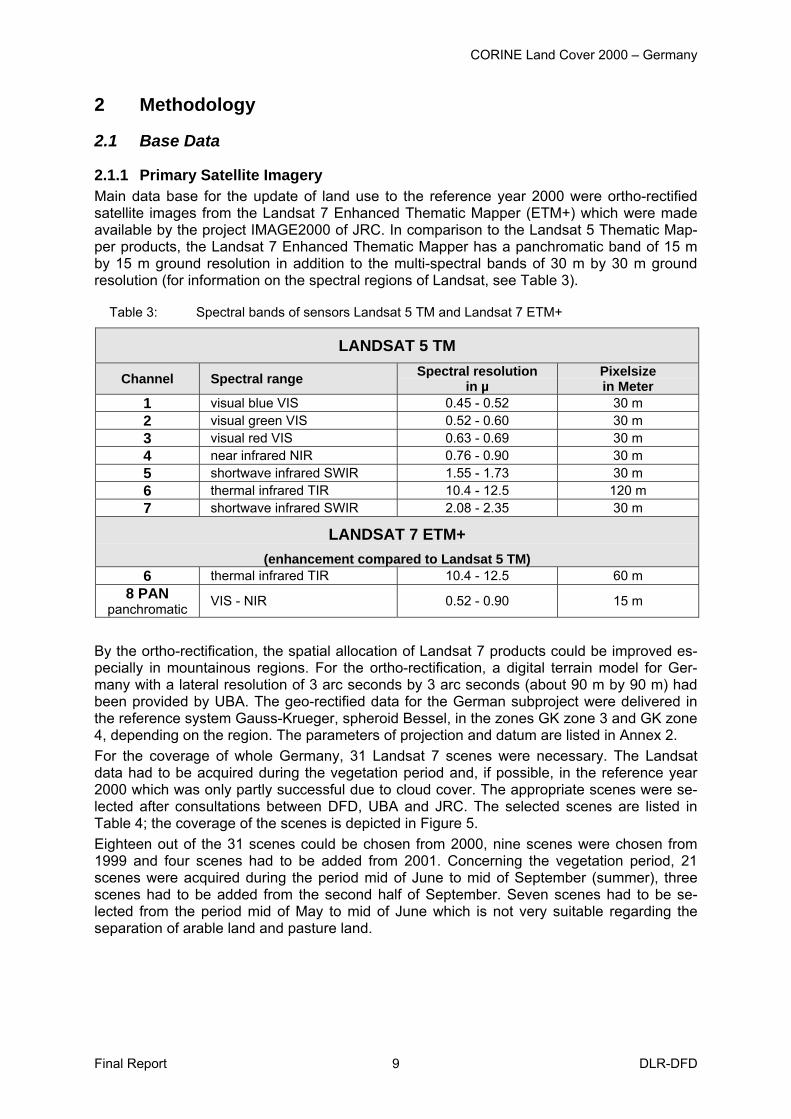
2.1.1 Primary Satellite Imagery Main data base for the update of land use to the reference year 2000 were ortho-rectified satellite images from the Landsat 7 Enhanced Thematic Mapper (ETM+) which were made available by the project IMAGE2000 of JRC. In comparison to the Landsat 5 Thematic Map-per products, the Landsat 7 Enhanced Thematic Mapper has a panchromatic band of 15 m by 15 m ground resolution in addition to the multi-spectral bands of 30 m by 30 m ground resolution (for information on the spectral regions of Landsat, see Table 3).
Table 3: Spectral bands of sensors Landsat 5 TM and Landsat 7 ETM+
LANDSAT 5 TM
Channel Spectral range Spectral resolution in µ
Pixelsize in Meter
1 visual blue VIS 0.45 - 0.52 30 m 2 visual green VIS 0.52 - 0.60 30 m 3 visual red VIS 0.63 - 0.69 30 m 4 near infrared NIR 0.76 - 0.90 30 m 5 shortwave infrared SWIR 1.55 - 1.73 30 m 6 thermal infrared TIR 10.4 - 12.5 120 m 7 shortwave infrared SWIR 2.08 - 2.35 30 m
LANDSAT 7 ETM+
(enhancement compared to Landsat 5 TM) 6 thermal infrared TIR 10.4 - 12.5 60 m
8 PAN panchromatic VIS - NIR 0.52 - 0.90 15 m
By the ortho-rectification, the spatial allocation of Landsat 7 products could be improved es-pecially in mountainous regions. For the ortho-rectification, a digital terrain model for Ger-many with a lateral resolution of 3 arc seconds by 3 arc seconds (about 90 m by 90 m) had been provided by UBA. The geo-rectified data for the German subproject were delivered in the reference system Gauss-Krueger, spheroid Bessel, in the zones GK zone 3 and GK zone 4, depending on the region. The parameters of projection and datum are listed in Annex 2. For the coverage of whole Germany, 31 Landsat 7 scenes were necessary. The Landsat data had to be acquired during the vegetation period and, if possible, in the reference year 2000 which was only partly successful due to cloud cover. The appropriate scenes were se-lected after consultations between DFD, UBA and JRC. The selected scenes are listed in Table 4; the coverage of the scenes is depicted in Figure 5. Eighteen out of the 31 scenes could be chosen from 2000, nine scenes were chosen from 1999 and four scenes had to be added from 2001. Concerning the vegetation period, 21 scenes were acquired during the period mid of June to mid of September (summer), three scenes had to be added from the second half of September. Seven scenes had to be se-lected from the period mid of May to mid of June which is not very suitable regarding the separation of arable land and pasture land.

CORINE Land Cover 2000 – Germany
Final Report DLR-DFD 10
Table 4: Landsat 7 scenes used for CLC2000 update in Germany
Path/Row LS-7 Acquisition Date
Region Path/Row LS-7 Acquisition Date
Region
192/023 24.09.2000 Stettin 194/027 18.06.2000 Bodensee 192/024 24.09.2000 Cottbus 195/022 09.06.2000 Lübeck 192/025 24.09.2000 Dresden-Süd 195/023 09.06.2000 Hamburg 192/026 26.08.2001 Straubing 195/024 09.06.2000 Goettingen 192/027 26.08.2001 Chiemsee 195/025 11.09.1999 Frankfurt 193/022 14.08.2000 Ruegen 195/026 15.08.2001 Stuttgart 193/023 14.08.2000 Neustrelitz 195/027 15.08.2001 Freiburg 193/024 13.09.1999 Dessau 196/022 15.05.2000 Neumuenster 193/025 13.09.1999 Hof 196/023 15.05.2000 Bremen 193/026 13.09.1999 Ingolstadt 196/024 15.05.2000 Dortmund 193/027 13.09.1999 Garmisch-Part. 196/025 05.07.2001 Koblenz 194/022 03.08.1999 Rostock 196/026 02.09.1999 Kaiserslautern 194/023 04.09.1999 Wittenberge 197/023 26.08.2000 Emden 194/024 04.09.1999 Harz 197/024 26.08.2000 Kleve 194/025 18.06.2000 Coburg 197/025 11.09.2000 Aachen 194/026 18.06.2000 Dinkelsbuehl 197/026 11.09.2000 Saarbruecken
Figure 5: Landsat coverage and mapping units of Germany
The first three digits name the path, the last two digits the row.
CORINE Land Cover 2000 – Germany
Final Report DLR-DFD 11
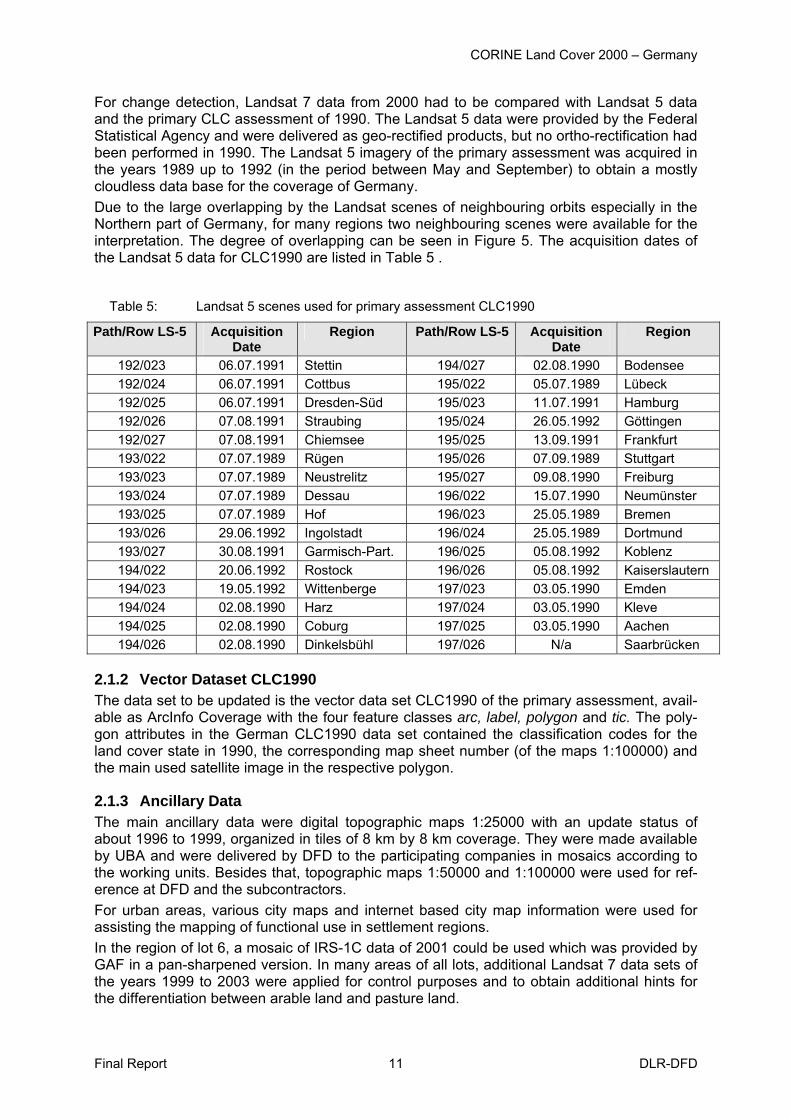
For change detection, Landsat 7 data from 2000 had to be compared with Landsat 5 data and the primary CLC assessment of 1990. The Landsat 5 data were provided by the Federal Statistical Agency and were delivered as geo-rectified products, but no ortho-rectification had been performed in 1990. The Landsat 5 imagery of the primary assessment was acquired in the years 1989 up to 1992 (in the period between May and September) to obtain a mostly cloudless data base for the coverage of Germany. Due to the large overlapping by the Landsat scenes of neighbouring orbits especially in the Northern part of Germany, for many regions two neighbouring scenes were available for the interpretation. The degree of overlapping can be seen in Figure 5. The acquisition dates of the Landsat 5 data for CLC1990 are listed in Table 5 .
Table 5: Landsat 5 scenes used for primary assessment CLC1990
Path/Row LS-5 Acquisition Date
Region Path/Row LS-5 Acquisition Date
Region
192/023 06.07.1991 Stettin 194/027 02.08.1990 Bodensee 192/024 06.07.1991 Cottbus 195/022 05.07.1989 Lübeck 192/025 06.07.1991 Dresden-Süd 195/023 11.07.1991 Hamburg 192/026 07.08.1991 Straubing 195/024 26.05.1992 Göttingen 192/027 07.08.1991 Chiemsee 195/025 13.09.1991 Frankfurt 193/022 07.07.1989 Rügen 195/026 07.09.1989 Stuttgart 193/023 07.07.1989 Neustrelitz 195/027 09.08.1990 Freiburg 193/024 07.07.1989 Dessau 196/022 15.07.1990 Neumünster 193/025 07.07.1989 Hof 196/023 25.05.1989 Bremen 193/026 29.06.1992 Ingolstadt 196/024 25.05.1989 Dortmund 193/027 30.08.1991 Garmisch-Part. 196/025 05.08.1992 Koblenz 194/022 20.06.1992 Rostock 196/026 05.08.1992 Kaiserslautern 194/023 19.05.1992 Wittenberge 197/023 03.05.1990 Emden 194/024 02.08.1990 Harz 197/024 03.05.1990 Kleve 194/025 02.08.1990 Coburg 197/025 03.05.1990 Aachen 194/026 02.08.1990 Dinkelsbühl 197/026 N/a Saarbrücken
2.1.2 Vector Dataset CLC1990 The data set to be updated is the vector data set CLC1990 of the primary assessment, avail-able as ArcInfo Coverage with the four feature classes arc, label, polygon and tic. The poly-gon attributes in the German CLC1990 data set contained the classification codes for the land cover state in 1990, the corresponding map sheet number (of the maps 1:100000) and the main used satellite image in the respective polygon.
2.1.3 Ancillary Data The main ancillary data were digital topographic maps 1:25000 with an update status of about 1996 to 1999, organized in tiles of 8 km by 8 km coverage. They were made available by UBA and were delivered by DFD to the participating companies in mosaics according to the working units. Besides that, topographic maps 1:50000 and 1:100000 were used for ref-erence at DFD and the subcontractors. For urban areas, various city maps and internet based city map information were used for assisting the mapping of functional use in settlement regions. In the region of lot 6, a mosaic of IRS-1C data of 2001 could be used which was provided by GAF in a pan-sharpened version. In many areas of all lots, additional Landsat 7 data sets of the years 1999 to 2003 were applied for control purposes and to obtain additional hints for the differentiation between arable land and pasture land.

CORINE Land Cover 2000 – Germany
Final Report DLR-DFD 12
In several regions, air photographs were used, e.g. as reference in the storm damaged forest areas of the Black Forest acquired after the winter storm ‘Lothar’ in December 1999. In addi-tion, several thematic maps were integrated in the interpretation. The primary satellite imagery and ancillary data are listed in the metadata sheets of the map units.
2.2 Preprocessing As a prerequisite for the mapping of the land cover situation in 2000 in comparison to 1990, the creation of co-registered satellite data of 2000 and 1990 and of a geometric adapted vec-tor data set CLC1990 was necessary. While the selection and preprocessing of the Landsat 7 data was done under the responsibility of JRC centrally for Europe, the geometric adapta-tion of the Landsat 5 data of 1990 and the CLC1990 vector data was task of the national teams. The national teams assisted also the selection and quality control of Landsat 7 data.
2.2.1 Selection Procedure and Quality Control of the Satellite Imagery of 2000 The selection of Landsat 7 data concerning coverage and cloud cover was done using quick-looks from EURIMAGE and USGS, other quicklook products were made available by the IMAGE2000 project (see http://www.envicat.com/projects/image2000/overview.html). It was possible to select 21 of 31 scenes covering Germany from the summer period mid June to mid September (see chapter 2.1.1, Primary Satellite Imagery). The Landsat 7 data products, ortho-rectified under the responsibility of JRC, were delivered in the reference system Gauss-Krueger, spheroid Bessel, in the zones GK zone 2 to GK zone 5, depending on the respective region. The resampled pixel size was 25 m by 25 m for the multispectral bands and 12.5 m by 12.5 m for the panchromatic band (see Annex 2 for used transformation parameter). For two scenes, a detailed quality analysis was performed with respect to the geometric accuracy, based on about 50 check points. The results for scene 193/23 (Berlin) were RMS errors of 13.7 m in x and 12.6 m in y, and maximal devia-tions of 45.4 m in x und 34.4 m in y. The checks of scene 193/27 (Munich) resulted in RMS errors of 8.2 m in x und 8.4 m in y, and maximal deviations of 21.8 m in x and 24.7 m in y. This fulfilled fully the requirements of the project. A special problem was detected for scene 192/22 in the North of Germany. The geo-location of the panchromatic band was accurate, but the multi-spectral bands showed geometric de-viations up to 8 pixel (about 200 m) in some parts of the scene. It was recognized that the multi-spectral bands of the scene were damaged in the Northern part over Denmark, which had influenced also the inner geometry in the Southern part over Germany. The rectification of scene 192/22 (the multi-spectral bands) was repeated by JRC and then given to DFD for further work. Some remaining shifts up to 3 to 4 pixel resulted in scene 192/22 in the very North-East of Germany. These shifts seemed to be a result of discrepancies between neighbouring ground control points over Germany and Poland because of different topographic maps. As the North-Eastern part of Germany was also covered by the neighbouring scene 193/22, the geometric adaptation of 1990 data and the interpretation could be done mainly by this scene.
2.2.2 Geometric Correction of the Satellite Imagery of 1990 As comparative data basis for the status 1990, georeferenced, but not ortho-rectified Landsat 5 images of the primary assessment were delivered by the Federal Statistical Agency. As the original Landsat 5 data were not available, the co-registration with the ortho-rectified Landsat 7 data was done by an image-to-image registration via control points. Between 25 and 51 control points were applied per scene for image-to-image registration using first order or sec-ond order transformations As results of co-registration, mean deviations (RMS) between 10.0 m to 28.2 m in x and 13.2 m to 40.1 m in y were achieved. This corresponds in general with an allocation accuracy of the co-registered Landsat 5 data of one or two pixel (of 25 m by 25 m) in relation to the ortho-rectified Landsat 7 data; in some cases, deviations around 3 or 4 pixels remained.

CORINE Land Cover 2000 – Germany
Final Report DLR-DFD 13
2.2.3 Geometric Correction of the Vector Dataset CLC1990 Unlike in the project CLC2000, the interpretation of CLC1990 was not based on ortho-rectified satellite imagery. Hence the CLC1990 vector data set had to be geometrically adapted to establish geometrical consistent data sets. The adjustment of the vector data CLC1990 to the satellite data base of Image2000 and 1990 was performed in the workstation version of ArcInfo. The Adjust module of ArcInfo is based on a (triangular) rubber sheeting method, which uses linear objects of the feature class link to determine the direction and amount of the adjustment of the vector data. An AML toolset in the Adjust environment of ArcInfo was used to create these links. The adjustment of the vector data was performed on blocks of 6 to 18 mapping units. Usually up to three different adjustment steps were necessary to obtain a sufficient geometric accu-racy. Besides the semi automatic approaches of Adjust and Limitadjust, in particular cases more precise manual corrections of single arcs were performed additionally. Figure 6 shows an example of the results of the geometric corrections of the vector data set.
Figure 6: Example of the adjustment of CLC1990 vector data.
CLC1990 polygons before the adjustment are depicted in yellow, polygons after the adjustment in red.
After the adjustment of the arcs, the topology was built and label errors, node errors and sliv-er polygons were corrected. Before merging the blocs to a complete data base, extensive edgematching processes were performed. To guarantee the thematic consistency of the ad-justed CLC1990 data base, a detailed check procedure was applied. The expenditure for the geometric adjustment of the CLC1990 vector data was substantially higher than estimated before the project start. Approximately 120 links per map sheet were set; in peculiar regions up to 250 links per map sheet were necessary, depending on regional conditions such as terrain undulations. For the CLC1990 vector data, an accuracy of two pixels on average could be achieved with a maximum of local deviation of 100 m.
2.3 Interpretation and Mapping Procedure As mentioned in chapters 1.4 and 1.5, interpretation and mapping for CLC2000 was done in Germany in cooperation with subcontractors. In order to get a consistent and harmonized data base in Germany and Europe, the procedures for interpretation and mapping had to be synchronized in detail, based on the nomenclature and the developed interpretation guide-lines (PERDIGAO et al., 1997; BOSSARD et al., 2000) and the data acquisition guidelines from the primary assessment in Germany (DEGGAU et al., 1998).

CORINE Land Cover 2000 – Germany
Final Report DLR-DFD 14
2.3.1 Nomenclature of CORINE Land Cover The nomenclature of CORINE Land Cover classes consists of three level, the highest level 1 is characterized by the five main classes ‘artificial surfaces’, ‘agricultural areas’, ‘forests and semi-natural areas’, ‘wetland’ and ‘water bodies’. On level 3, 44 classes were defined to characterize land cover in Europe, 37 of these classes are relevant for Germany. The classi-fication system for Europe is shown in Table 6. The three digit land use code is used for the class assignment in level 3.
Table 6: Nomenclature of CORINE Land Cover classes in Europe classes not relevant in Germany are shown in italics (source: Bossard et al., 2000)
CORINE Land Cover classes in Europe Level 1 Level 2 Level 3
111 Continuous urban fabric 11 Urban fabric 112 Discontinuous urban fabric 121 Industrial or commercial units 122 Road and rail networks and associated land 123 Port areas
12 Industrial, commercial and transport units
124 Airports 131 Mineral extraction sites 132 Dump sites
13 Mines, dumps and con-struction sites
133 Construction sites 141 Green urban areas
1 Artificial surfaces
14 Artificial non-agricultural vegetated areas 142 Sport and leisure facilities
211 Non-irrigated arable land 212 Permanently irrigated land
21 Arable land
213 Rice fields 221 Vineyards 222 Fruit trees and berry plantations
22 Permanent crops
223 Olive groves 23 Pastures 231 Pastures
241 Annual crops associated with permanent crops 242 Complex cultivation patterns
243 Land principally occupied by agriculture, with significant areas of natural vegetation
2 Agricultural areas
24 Heterogeneous agricul-tural areas
244 Agro-forestry areas 311 Broad-leaved forest 312 Coniferous forest
31 Forests
313 Mixed forest 321 Natural grasslands 322 Moors and heathland 323 Sclerophylous vegetation
32 Scrubs and/ or herba-ceous vegetation
324 Transitional woodland - shrub 331 Beaches, dunes, sands 332 Bare rocks 333 Sparsely vegetated areas 334 Burnt areas
3 Forest and semi-natural areas
33 Open spaces with little or no vegetation
335 Glaciers and perpetual snow 411 Inland marshes 41 Inland wetlands 412 Peat bogs 421 Salt marshes 422 Salines
4 Wetlands
42 Coastal wetlands
423 Intertidal flats 511 Water courses 51 Inland waters 512 Water bodies 521 Coastal lagoons 522 Estuaries
5 Water bodies
52 Marine waters
523 Sea and ocean

CORINE Land Cover 2000 – Germany
Final Report DLR-DFD 15
The interpretation instructions are given in the CORINE Land Cover Technical Guide - Ad-dendum 2000 (BOSSARD et al., 2000). Included are explanations how to assign and gener-alise land cover objects to CORINE Land Cover classes in special situations. Discussions of the application of the interpretation key are presented also in Annex 4 and Annex 14 of the primary assessment report for Germany (Deggau et al., 1998). Here, for example, the princi-ple of dominance for the heterogeneous agricultural areas 2.4.2 and 2.4.3 is discussed – for the assignment to the class 2.4.2, the partial classes of arable land and pasture land can cover between 25 % and 75 % of the polygon; if one of the partial classes cover more of 75 %, the polygon has to be associated to this dominant class. For the coloured presentation of CORINE LC classes, a representation was developed which can be found in Figure 7 for the 37 land cover classes in Germany.
Figure 7: Legend of the CORINE land use classes in Germany
2.3.2 Adaptation of the CLC Nomenclature of 1990 and 2000 in Germany During the progress of the primary assessment of CLC90 in Europe, an adaptation of inter-pretation and mapping instructions had taken place in order to enable a better characteriza-tion of typical landscape and settlement forms, e. g. for the former EU candidates in Eastern Central Europe. In order to ensure the comparability in Europe, also the German subproject had to use these adapted mapping instructions for CORINE Land Cover 2000. To avoid mapping changes due to different mapping instructions in 1990 and 2000, this made also an additional revision of the data base CLC1990 necessary (called CLC1990_rev). The relevant differences in instructions were discussed on the training meetings in Oberpfaf-fenhofen. Necessary adaptations for special situations were defined for the interpretation for CLC2000 and CLC1990_rev. In some cases compromise solutions had to be agreed upon, especially to keep the correction of CLC1990 manageable. One example of an adaptation of interpretation rules were rules concerning the mapping of ribbon-built villages: In the CLC1990 interpretation in Germany, parts of ribbon-built villages had to be grouped to one polygon if the distances between settled parts were below 100 m. According to the new nomenclature of CLC2000, a grouping has to be done for settlement parts if the distances are below 300 m (BOSSARD ET AL., 2000). This interpretation rule had been adapted on a European level to include more dispersed settlements in some re-

CORINE Land Cover 2000 – Germany
Final Report DLR-DFD 16
gions of Eastern Europe. This adaptation made it necessary also to re-interpret the settle-ment classes for CLC1990 to avoid artificial changes by differences in the interpretation rules. Similar adaptation rules were defined for grouping of small water bodies with distances below 300 m. Other adaptations concern complexes of mineral extraction sites and neighbouring artificial lakes, or the delineation of industrial, commercial and public areas (121) in relation to discontinuous urban fabric (112). An overview of the adaptations of interpretation rules is listed in annex 4. A large amount of corrections in the CLC1990 data set had to be performed in the context of the class 324, transitional woodland / shrub. Relating to (BOSSARD ET AL., 2000), this class has to be used for clear-cutting areas inside the forest, for reforestation areas, but also for heavily damaged forest areas if more than 50 % trees are damaged by storm break or have been extracted. During the primary assessment in Germany, reforestation areas were mostly not integrated in this class 324 as this status had been considered as a usual status in for-estry.
2.3.3 Methodology for the Update Procedure – Compliance with Minimum Map-ping Units and Generalization
As CORINE Land Cover aims at a complete coverage of the EU countries for objectives in European environmental, agriculture and regional politics, a mapping scale of 1:100000 was agreed and minimal mapping units were introduced for the delineation of land cover units and for the changed areas. The minimal mapping units are 25 ha for new land cover units (in 1990 and 2000) and 5 ha for changed areas. In addition, the polygons must have a minimal width of 100 m. In case of a new polygon, the minimal mapping units of 25 ha in size and of 100 m in width have to be fulfilled. Hence isolated change polygons, changed areas within a polygon having a size less than 25 ha were not to be mapped. According to the guidelines for CLC updates (EEA AND ETC, 2002, p. 18), changes between 5 ha and 25 ha are registered only in the case of shifts of already existing land cover borders. If the size of a polygon is reduced below 25 ha after land cover changes, this polygon has to be removed from the CLC2000 data set (EEA AND ETC, 2002, p. 18). A number of simple exemplary situations in change mapping are shown in Figure 8, more complex situations can be found in Figure 9. When not sufficient large polygon areas evolve by the change, a generalization of the land use situation is necessary. In order to select an adequate class description for the new poly-gon out of the neighbouring classes, these classes have to be evaluated by using a priority table which is supplemented in annex 3.
2.3.4 Digitization of Land Use Changes The mapping of CLC2000 and of the changes was first done in the map units 1:100000, fol-lowed by an edge alignment within the lots in responsibility of the contracted companies. The interpretation and mapping was done directly on the screen and not on plot products, in dif-ference to the primary assessment. This resulted in a better geometric consistency. The mapping of changes in the map units was done in several passes. The situation in 1990 and 2000 were compared using two windows with overlays of the old and new Landsat data and the vector data. In the beginning, the interpretation of CLC1990 had to be checked for consistency. Polygons connected with possible change were marked. In a further loop, the resulting areas had to be checked for the relevant minimum mapping units of 25 ha and 5 ha. For the new situation, new areas were marked, added, reduced or completely named by a new class attribute. This was done by creating new polygons with attributes appropriate to the status in 1990 (original), in 1990 (in a revised version), and in 2000. Thus, the original situation of delineation was also kept in the data base for a more efficient quality control. At this state, neighbouring polygons with the same attribute in the status of 1990 or 2000 were possible. The minimum mapping units were valid only for the seamless dataset, generated by the dissolve procedure in ArcInfo (merging of neighbouring

CORINE Land Cover 2000 – Germany
Final Report DLR-DFD 17
polygons with the same land cover class attribute). The responsible companies were asked to run the dissolve procedure for checking the minimum mapping units.
CLC90 CLC2000 CLC Changes
Figure 8: Examples of simple CLC changes (source: EEA and ETC, 2002)
222
243
211
311
112
211
222
243
211
311
112
231
211 211 231
1. Change of the CLC code: the polygon with code 211 has changed into 231
311 211
112
242
311 211
112
242
211 112
2. Area exchange between two polygons: 112 has increased, 211 decreased (change > 5 ha)
211 311
243
324
211 311
243
324311
3. Disappearance of a polygon: 311 has increased, 324 ceased (area became < 25 ha)
4. Appearance of a new polygon: a 311 was born inside 243 (area must be >25 ha)
Area > 5 ha
211 243
222
311
211
243
222
243 311
Area > 25 ha

CORINE Land Cover 2000 – Germany
Final Report DLR-DFD 18
Figure 9: Examples of complex CLC changes (source: EEA and ETC, 2002)
The main attributes in the vector data base were the class attributes in the original status of 1990 (NSK1), in the status of 1990 after correction or revision (NSK2) and in the new status of 2000 (NSK3), see Table 7. Besides these attributes, additional attributes were given to characterize the map number of the topographic map unit 1:100000, the Landsat 7 scene used primarily and other overlapping Landsat 7 scenes used in addition. Additional attributes were given for characterizing the status of interpretation, eventual changes, or misinterpreta-tions stated for 1990. The interpreter could insert remarks for the subsequent quality checks in a special attribute. A more detailed description of the data structure in the resulting vector data sets (polygon attribute table and arc attribute table) is given in annex 5.
Table 7: Examples of attribute assignment according to the classification key
ITEM NSK1 NSK2 NSK3
Interpretation status
Status in 1990, original
Status in 1990, after correction
Status in 2000
Example 1 133 122 122
Example 2 231 231 121
243
211
112
311 243
211
112
311 243-112 3 ha
211- 112 4 ha
311-112 13 ha
CLC90 CLC2000 CLC Changes
Example 1: Total increase of a polygon (> 5 ha) can include several contiguous elementary changes, some of them smaller than 5 ha. The example illustrates the growing of a settlement.
Example 2: Total decrease of a polygon (> 5 ha) can include several contiguous elementary changes, some of them smaller than 5 ha. The example illustrates the shrinking of a forest.
311-243 3 ha
311- 211 4 ha
311-112 13 ha
243
211
311
112 243
211
311
112

CORINE Land Cover 2000 – Germany
Final Report DLR-DFD 19
The methodology used for the update of CORINE land cover can be summarized as follows. By comparison of the satellite images of the reference period 1990 in relation to the satellite data of 2000, at first the vector data base of 1990 has to be corrected for possible misinter-pretations (output: CLC1990_rev); then the resultant changed areas have to be delineated (output: CLC_Changes), integrating supplementary reference data and field information. Re-garding the minimum mapping units, certain generalization procedures (according to chapter 2.3.3) are to be kept. Thus, the data base CLC2000 results as the output derived from the revised CLC1990 data base and the CLC_Changes data base - as the union of CLC1990 and CLC_Changes polygon layers (CLC2000 = CLC1990_rev + CLC_Changes). This ap-proach was highly recommended in the beginning of CLC2000 to ensure consistency be-tween the three data bases. The German national team followed this recommendation. The approach is depicted considering as example in Figure 10.
Further Reference Data
• topographic maps TK25• City maps• aerial photos
+
Landsat TM / 1989-1992 Landsat ETM / 1999-2001
rev CLC 1990 CLC Change CLC 2000
Further Reference Data
• topographic maps TK25• City maps• aerial photos
+
Landsat TM / 1989-1992 Landsat ETM / 1999-2001Landsat ETM / 1999-2001
rev CLC 1990 CLC Change CLC 2000
Figure 10: Schematic representation of the approach for the update of CORINE Land Cover
2.3.5 Labelling of Technical Changes Based on the applied methods for updating, necessary generalisations can produce results in change which are connected with false estimations concerning area changes. Such situa-tions can arise if a sub-area in the polygon had not yet reached the minimum mapping size of 25 ha in the old state, merged first with a neighbouring class, but became larger over 25 ha in the new state. The resultant change indicates an amount over 25 ha, but was maybe only 6 ha in reality. Another situation can arise if a polygon shrinks below 25 ha and has to be melted with the surrounding class. In both cases, the resultant change reflects not the real change of land cover, but is due to technical reasons and the necessary generalisations. In order to mark these polygons of overrated change or technical change, the additional at-tribute NRCH (‘no real change’) was created as a flag and set to 1 in this case (‘normal status’: NRCH=0). The flag can be used within evaluations of resulting area statistics. Typical situations for these technical changes were often connected with the increase of dis-continuous urban fabric (112) within agricultural areas (2xx) or with the increase of industrial, commercial and public units (121) in the surrounding of other artificial surfaces. An example of the latter case is shown in Figure 11: In 1990, the polygon of the industrial and commercial area (121) has a size of about 17 ha, below 25 ha, and is connected with class 112 (‘discon-

CORINE Land Cover 2000 – Germany
Final Report DLR-DFD 20
tinuous urban areas’). In 2000, the industrial and commercial area increases by 12ha to about 29ha, enough for a delineation of 121. In such cases of unusual changes, it was at-tempted to avoid technical changes with the flag NRCH=1 within the scope of interpretation. But in various cases the allocation of a change area could not be prevented.
Status in 1990 Status in 2000 Reference due to an online
city map
Figure 11: Example of a technical change associated with the increase of a commercial area The commercial area increases from a size of 17 ha in 1990 (still integrated in 112), to 29 ha, thus both partial polygons have to be designated with code 121 in 2000
2.3.6 Mapping of a Buffer Zone around the German Borders According to the mapping guidelines, each national team additionally had to map a buffer of at least 500 m around the national borders. Overlapping buffer zones guarantee the preven-tion of gaps between the national data sets and the seamless creation of the European wide data set. The thematic adjustment in the buffer zones and the creation of a seamless data base are tasks of the technical team of ETC-TE. The necessary geometric adjustment of CLC1990 (see chapter 2.2.3) caused sometimes offsets of the national boundaries of the German data set. This could result in gaps to the adjacent national data sets. Hence it was indispensable to map a buffer zone, which was performed by EFTAS (lots 4 and 5), GAF (lot 6) and DFD (lots 1, 2 and 3). The interpretation in the buffer zone was based - apart from satellite imagery and topographical maps – on the national CLC vector data sets of the neighbouring countries to facilitate the interpretation. CLC1990 vector data sets were provided by the national teams of Belgium, France, Austria and the Czech Republic. CLC2000 vector data were available for the Netherlands, Luxem-bourg and Poland. Due to the shortness of the common border, no additional data set was used for the mapping of the buffer zone to Denmark.
2.3.7 Specific Characteristics of Mapping in the Wadden Sea Region For the updating process in the German Wadden Sea region some specific characteristics had to be treated. The classes listed in Table 8 are relevant for this region, which is charac-terized by high land cover dynamics. In particular the region of intertidal flats (423) is highly affected by displacements of tideways (‘Priele’) and so called ‘Sandplaten’ (accumulations of sand above the mean sea level) due to storm surges and spring tides.
Table 8: CLC classes relevant for the German Wadden Sea region
331 Beaches, dunes, sand 421 Salt marshes 423 Intertidal flats 522 Estuaries 523 Sea and ocean
The data recording of the image base of the first inventory 1990 in this region took place dur-ing low tide. Hence the intertidal flats were not flooded and could be delineated based on the

CORINE Land Cover 2000 – Germany
Final Report DLR-DFD 21
Landsat 5 TM data. In contrast to that, the imagery of IMAGE2000 showed this region during high tide. Hence, another approach for the delineation of the intertidal flats was agreed. The responsible subcontractor EFTAS digitized the coastlines and waterways in the intertidal flats (‘Baljen’) based on the topographic map TK25 (scale 1:25000, status 1997/1998), which showed the situation during the average low tide, and integrated this information in the CLC2000 vector layer. Due to the different mapping approaches, numerous sliver polygons and polygons not compliant with the minimum mapping units and minimum width rules oc-curred after unioning the two vector layers CLC1990 and CLC2000. DFD performed the nec-essary postprocessing to remove these polygons and to exclude false change polygons.
2.3.8 Field Surveys Field surveys were performed by the subcontractors as well as by DFD to assist the interpre-tation process and to clarify questionable interpretations, when no other appropriate ancillary data was available. Moreover, DFD assessed the quality of the interpretations by means of ground truth. Exact positions and on-site findings of the field surveys were entered in an Excel data base. See Table 9 for the items in the data base. Additionally digital photographs were taken at the most locations and the direction of the photographs was documented. The time frame of the first project phase caused field surveys in the unfavourable winter half year. Hence the sig-nificance of the ground surveys varies depending on the weather conditions.
Table 9: Items of the field survey data base
NR TK100 Nr. Company Field survey Nr
Field-photo no (0) yes (1)
TK Photo Nr. Film Photo Nr. Direction
Date X_COORD Y_COORD NSK3_interpre-
tation
NSK3_ground
truth
Description / Com-ments
Further Comments
Ground truth played an important rule for the discrimination of different natural vegetation stages, e.g. on former open mining sites and in moorlands as well as for the discrimination of different land uses in agricultural areas. The fieldphoto and the associated subset of the sat-ellite imagery depicted in Figure 12 show the different stages of succession on a former brown coal extraction site.
Characteristic succession stages on regenerating brown coal extraction sites 131 Mineral extraction site 333 Sparsely vegetated areas 321 Natural grassland 324 Transitional woodland - shrub
Former open mining site Mücheln, in the south of Halle / Saale Direction of field photo: SE
Figure 12: Example of fieldphoto and associated subset of Landsat7 imagery.

CORINE Land Cover 2000 – Germany
Final Report DLR-DFD 22
The companies had different approaches for ground surveys. Lots 1, 3, 4 and 5 are more or less equally covered by survey points. In contrast to that, surveys in lots 2 and 6 were con-ducted only for particular working units. The subcontractors of these lots could benefit to a high extent from their local knowledge and experiences gathered in many regional projects. The distribution of the ground survey points is depicted in Figure 13.
Figure 13: Field survey points of CLC2000 in Germany
2.3.9 Preparation of Metadata Metadata documents, compliant with the guidelines both on country and on working unit level, were an integral part of the final data delivery to EEA. Metadata on country level includ-ing more general information were prepared for the national products CLC2000, CLC1990_rev and CLC_Change. A metadata sheet for the product CLC2000 is depicted in annex 6 as an example of the country level metadata. Furthermore DFD delivered metadata sheets on working unit level to EEA, with detailed in-formation on image processing, interpretation, pre- and postprocessing of the vector data,

CORINE Land Cover 2000 – Germany
Final Report DLR-DFD 23
responsible companies and persons, ancillary data and used software. A total of 215 meta-data sheets were prepared. Compact metadata documents were derived on working unit level from this detailed metadata. The compact metadata sheets with the most important information on used satellite and ancillary data are provided to the end users online and on the DVD ‘CORINE Land Cover 2000 – Daten zur Bodenbedeckung in Deutschland’ (see chapter 2.5.3). For an example of a detailed metadata sheet see annex 7, an example of a compact metadata sheet available online (via FTP transfer) and on DVD is depicted in Table 10.
Table 10: Example of compact metadata sheet on working unit level
Kartenblattnummer (number of working unit)
C7930
Kartenblattname (title of map sheet)
Augsburg
Los (lot number) Los6
Bearbeiter (company) GAF AG
IMAGE 2000 Daten, Landsat7 ETM+
Path Row Aufnahmezeitpunkt (MM/TT/JJJJ) (acquisition date)
193 26 09/13/1999
193 27 09/13/1999
Satellitendaten 1990, Landsat5 TM (satellite image 1990)
Path Row Aufnahmezeitpunkt (MM/TT/JJJJ) (acquisition date)
193 26 06/29/1992
193 27 08/30/1991
Zusatzdaten (ancillary data)
Datentyp / Datenquelle (data typ / source)
Titel (title)
Aufnahmedatum / Produktionsjahr (date of acquisition / production)
Maßstab (scale)
Karte (Map) Topographische Karte TK25, digital
Ca. 1997- 1999 1:25000
Karte (Map) Topographische Karte TK100, analog
2000 1:100000
Satellitenbild (satellite imagery)
LS7 ETM+ 193/026 05/13/2001
Satellitenbild (satellite imagery)
LS7 ETM+ 193/027 05/13/2001
IRS 1C/D 5m LISS/PAN Merge Mosaik
Euromaps Germany 1997-2001 1:25000
Stadtplan 9.Auflage (city map)
Falk-Stadtplan Augsburg 1998/1999 1:20000
2.4 Quality Assurance and Verification Quality assurance procedures were performed in each project phase. In a first step the suit-ability of the Landsat 7 satellite data was evaluated. After the ortho-rectification of the Land-sat 7 data in the IMAGE2000 subproject, the geometrical accuracy of test scenes of the im-age data base was determined. Also the coregistration of the Landsat 5 data of 1990 was
CORINE Land Cover 2000 – Germany
Final Report DLR-DFD 24
checked. In the phase of the geometrical adjustment of the vector data CLC1990, the geo-metrical accuracy was checked continuously for each map sheet. During the phase of interpretation and change mapping, the quality control was carried out in several steps. The interpretation work in the individual lots was based on the guidelines of CLC2000 and the adaptations which were agreed during the meeting with ETC-TE experts at the beginning of the project as well as on the accompanying field surveys (see chapter 2.3.8). The importance of quality control procedures for the specific lots by the subcontractors was pointed out in the description of work package ‘interpretation and mapping of changes’. The chief interpreters were responsible for the thematic controls. The technical control proce-dures including checks of compliance with the minimum mapping units and topology checks were performed by GIS specialists. After their controlling procedures, the subcontractors de-livered the results of the interpretation to the DFD in blocks of 9 to 15 TK100 sheets. This approach enabled the consideration of the recommendations of DFD for the interpretation of the adjacent mapping units. Previous to the second or final delivery of a lot the subcontractors had to integrate the rec-ommendations of DFD, merge the blocks of their lots and perform edge matching procedures within the lot and to adjacent lots.
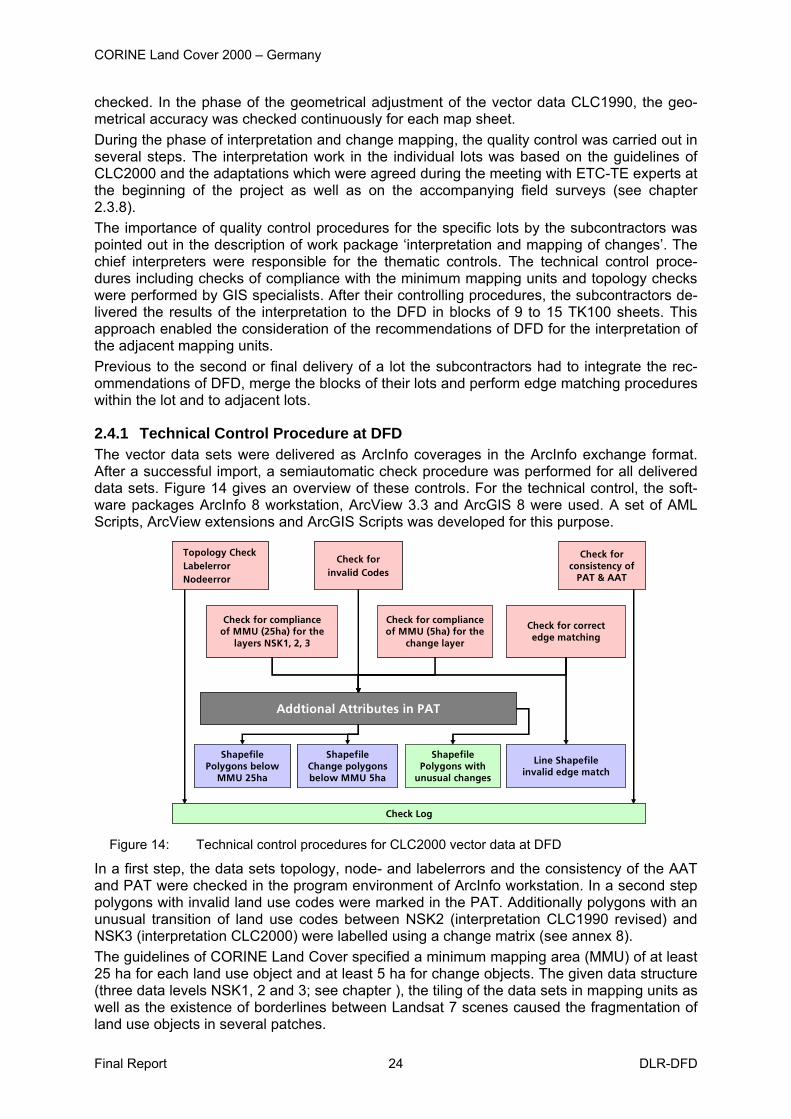
2.4.1 Technical Control Procedure at DFD The vector data sets were delivered as ArcInfo coverages in the ArcInfo exchange format. After a successful import, a semiautomatic check procedure was performed for all delivered data sets. Figure 14 gives an overview of these controls. For the technical control, the soft-ware packages ArcInfo 8 workstation, ArcView 3.3 and ArcGIS 8 were used. A set of AML Scripts, ArcView extensions and ArcGIS Scripts was developed for this purpose.
Check for complianceof MMU (25ha) for the
layers NSK1, 2, 3
Check for complianceof MMU (5ha) for the
change layer
Topology CheckLabelerrorNodeerror
Check for consistency of
PAT & AAT
Check for correctedge matching
Shapefile Polygons with
unusual changes
ShapefilePolygons below
MMU 25ha
ShapefileChange polygonsbelow MMU 5ha
Check forinvalid Codes
Line Shapefile invalid edge match
Check Log
Addtional Attributes in PAT
Figure 14: Technical control procedures for CLC2000 vector data at DFD
In a first step, the data sets topology, node- and labelerrors and the consistency of the AAT and PAT were checked in the program environment of ArcInfo workstation. In a second step polygons with invalid land use codes were marked in the PAT. Additionally polygons with an unusual transition of land use codes between NSK2 (interpretation CLC1990 revised) and NSK3 (interpretation CLC2000) were labelled using a change matrix (see annex 8). The guidelines of CORINE Land Cover specified a minimum mapping area (MMU) of at least 25 ha for each land use object and at least 5 ha for change objects. The given data structure (three data levels NSK1, 2 and 3; see chapter ), the tiling of the data sets in mapping units as well as the existence of borderlines between Landsat 7 scenes caused the fragmentation of land use objects in several patches.

CORINE Land Cover 2000 – Germany
Final Report DLR-DFD 25
Thus, the data set was dissolved to the attributes NSK1, NSK2 and NSK3 and a change layer was extracted and dissolved to the attributes NSK2 and NSK3. After that preprocess-ing, the polygons which were not compliant with the MMUs could be determined by a simple query in the GIS. The last procedure checked the edge match between neighbouring polygons in adjacent mapping units. The borderlines between the mapping units followed the sheet line system of the TK100 and thus they are artificial. Adjacent polygons which are divided by such an artifi-cial line must by definition have the same land use attributes (thematic edge match). Fur-thermore the nodes of adjacent polygons on an artificial borderline must snap to each other (geometrical edgematch). Polygons with an incorrect edgematch were marked. The results of the technical checking procedures were documented in the check log. Every incorrect polygon was marked by attributes and comments in the PAT. For each type of error and for polygons with unusual changes, an individual polygon shapefile was created. More-over, a shapefile of lines with an incorrect edgematch was derived. Depending on the amount of essential corrections due to the technical checks, a data set was refused and returned to the subcontractor or was accepted and forwarded to the the-matic control procedure.
2.4.2 Thematic Control Procedure at DFD After the first partial delivery to DFD and the technical control procedure, the interpretation of the layers CLC1990_rev (NSK2), CLC2000 (NSK3) and CLC_Change were checked visually map sheet by map sheet. Thereby the remarks by the interpreters and field checks were considered. For the thematic control procedures the image processing software ERDAS Imagine and the GIS software packages ArcInfo 8 und ArcView 3.3 were used. The visualisation of the change layer turned out to be very useful during the interpretation and check process. Ancillary data such as topographic and thematic maps, aerial photo-graphs, additional multitemporal satellite imagery as well as online information was applied for the thematic check. Proposed corrections were communicated to the subcontractors in the form of additional attributes in the PAT and derived polygon shapefiles. The image interpreters of the subcontractors accepted or refused and commented the pro-posed corrections by changing attributes and digitizing additional polygons. The second the-matic control was carried out after the second or final delivery to DFD and the technical check procedure. This second control concentrated on polygons with controversial interpreta-tions and regions with complex land use patterns. This approach was also applied on for further corrections, which became necessary due to proposed corrections by the ETC-TE technical team.
2.4.3 Verification by the Technical Team of ETC-TE The verification of the CLC products was performed by the technical team of ETC-TE on be-half of the EEA on three verification meetings in Germany. During the first two meetings approx. 60 % of the whole area of Germany could be covered, during the third meeting approx. 40 % (see Table 11). For the coverage of the map sheets checked on the three veri-fication meetings see Figure 15. The objective of the meetings was to check the results of the interpretation based on a verifi-cation plan. Systematic and unsystematic misinterpretations should be discussed and marked for corrections. The first verification meeting was held at the middle of the project duration, in order to ensure a homogenous interpretation in the following project phases. ETC-TE used the following approach for the verification: Two verification samples per map-ping unit (TK100) were selected out of a regular grid of 10 km by 10 km grid size. For the preselection, the regional distribution of land use classes and changes was considered. The technical team visually checked in detail the interpretations on this verification samples which covered approximately 8% to 10% of each mapping unit. Technical checks regarding valid codes, compliance of minimum mapping units and unrealistic changes were performed in each full map sheet.

CORINE Land Cover 2000 – Germany
Final Report DLR-DFD 26
Table 11: Percentage of mapping units checked on verification meetings
Meeting Date Percentage of lots Percentage of Germany Nr. 1 29.-31.Oct.2002 70% Lot 1
45% Lot 2, 70% Lot 3 (64% of Lots 1-3)
29%
Nr. 2 19.-21.Nov.2003 30% Lot 1 55% Lot 2 30% Lot 3 34% Lot 4 (36% of Lots 1-3)
31%
Nr. 3 11.-15.Oct.2004 66% Lot 4 Lot 5 Lot 6
40%
Figure 15: Coverage of the working units checked on verification meetings

CORINE Land Cover 2000 – Germany
Final Report DLR-DFD 27
The verification was based on Landsat imagery of 1990 and 2000 as well as on the same reference information on which the interpretation was based on, such as the topographic maps TK100 and TK25, thematic maps, city maps as well as information of field surveys and field photos. The aim to check all mapping units during the verification meetings could not be fully achieved within the intended time frame. By omitting individual map sheets, between 60 % and 80 % of the prepared regions could be covered (for more information see the verification reports of ETC-TT, Christensen et al., 2002, Jaffrain et al., 2003, Buttner et al., 2004). The technical team checked in total 151 map sheets, 113 were accepted, 22 were accepted with conditions and 16 were rejected, most of them due to errors in the change data set. The national team integrated the predominant majority of the recommendations for the correction.
2.4.4 Validation A validation of CLC2000 data was planned within the project for the assessment of the geo-metric and thematic accuracy. For such a validation, the guidelines concerning the minimum mapping units and the generalisation rules have to be considered. Well distributed validation areas and reference information are essential to achieve signifi-cant results of a validation. The data of the EU-Project LUCAS for Germany could fulfil the validation requirements. The technical team of ETC-TE performs a validation of the pan Eu-ropean data set of CLC2000 with LUCAS data. Hence an individual validation of the German data set was not performed.
2.5 Data Integration and Dissemination
2.5.1 Data Integration The software ArcInfo was used for the generation of a seamless data set of Germany (includ-ing the adjacent buffer). The data integration consisted in different steps of edgematching and reprojection processes. The area of the New Federal States (lots 1 and 2) was inter-preted and prepared in the projection Gauss-Kruger zone 4 while the system Gauss-Kruger zone 3 was used for the area of the Old Federal States (lots 3 to 6). First the lots 1 and 2 and lots 3 to 6 were edgematched and merged to two data sets. After the reprojection to Gauss-Kruger zone 3, both data sets were edgematched and merged to one data set. Final quality checks and corrections were performed on this data set. Afterwards unneeded items were dropped, the data set was dissolved and the final products CLC1990_rev, CLC2000 and CLC_Changes were derived. Also one single data set with the items CLC1990, CLC2000 and Changes was created and reprojected to Gauss-Kruger zone 4 and UTM32. The final product CLC2000 is depicted in Figure 16 on the next page.
2.5.2 Final Acceptance The final products were delivered to GISAT on 14th and 17th of December 2004. This delivery consisted in the vector data sets CLC2000, CLC1990_rev and CLC_Changes as well as the national metadata and the metadata of the mapping units. After the final control procedures by ETC-TE partner GISAT, the data sets were accepted and approved to publication.
2.5.3 Data Dissemination The German CLC products are disseminated as agreed with UBA, BMU and EEA and ac-cording to the document ‘Agreement between EEA and the participating Member State on a common policy for the use and the dissemination of I&CLC2000 products’. Therefore a web based ordering service was established. Users have data access online (via FTP transfer) or via delivery of the DVD ‘CORINE Land Cover 2000 – Daten zur Bodenbedeckung in Deutschland’. Non-commercial users can place their order on the online ordering form of the German CLC2000 website (http://www.corine.dfd.dlr.de). For service and delivery a handling fee of

CORINE Land Cover 2000 – Germany
Final Report DLR-DFD 28
30.00 EUR (plus VAT) is charged. The following products are available online and on DVD, which are provided in the reference systems Gauss-Kruger 3, Gauss-Kruger 4 and UTM32:
• Vector data sets with the items CLC1990_rev, CLC2000 and Changes; apart from the complete data set for Germany, additionally products for each German Federal State are provided
• Raster data sets of CLC2000 with different file formats and spatial resolution (100m x 100m, 250m x 250m and 1000m x 1000m)
• Compact metadata for the 215 mapping units (based on the TK100) Website and DVD provide detailed information on the German project and the data products as well as links to publications and the European project sites.
Figure 16: CLC2000 for Germany as an overlay of CLC1990 of the neighbouring countries (see Figure 7 for the legend)

CORINE Land Cover 2000 – Germany
Final Report DLR-DFD 29
2.6 Workshop ‘CORINE Land Cover 2000’ The Workshop ‘CORINE Land Cover 2000 in Germany and Europe and its use for Environ-mental Applications’, organized by BMU, UBA and DLR, was held from January the 20 – 21 January 2004 in Berlin. The aim of the workshop was to present and discuss the possibilities and limits of the use of the CORINE data in a broader user community. 108 participants from 17 European countries attended the workshop. Different examples of applications of CORINE data were presented, such as applications for air pollution control, protection of soil-, water and environmental systems, as well as the regional and transportation planning. It was emphasized, that European-wide harmonized land use data is an essential basis for the consistent implementation of international obligations both on national and European level. Furthermore, the user requirements for future updates of CORINE land cover were dis-cussed in detail. The contributions to the workshop as well as results and recommendations for future updates are compiled to the proceedings which are published in the series ‘UBA Texte’, 04/2004 (UBA, 2004).

CORINE Land Cover 2000 – Germany
Final Report DLR-DFD 30
3 Results of Interpretation and Mapping In the beginning of this chapter some examples of the vector data products of CORINE Land Cover are presented. Experiences, gained during the interpretation process, are summa-rized, followed by several examples of land cover change.
3.1 CLC-Products Three products result from the CORINE Land Cover data base: CLC2000 with the status of land cover in 2000, CLC_Change with the change polygons between 1990 and 2000, and the revised product CLC1990_rev with the status of land cover in 1990. CLC_Change con-tains the two attributes ‘status of land cover in 1990’ and ‘status of land cover in 2000’. All three products can be displayed as a complete data set for Germany as well as in single tiles, based on the mapping units. As an example, the three CLC products for map sheet C3118 Bremen and the corresponding satellite data sets of 1990 and 2000 are depicted in Figure 17. The change polygons are shown in the status 2000. See the illustration in the lower right or in Figure 7 for nomenclature and colour legend.
Landsat 5, 25. May 1989 Landsat 7, 15. May 2000
CLC1990 revised CLC2000
CLC change, status 2000 CLC legend for Germany
Figure 17: Example of the CLC products: Working unit TK100 Bremen
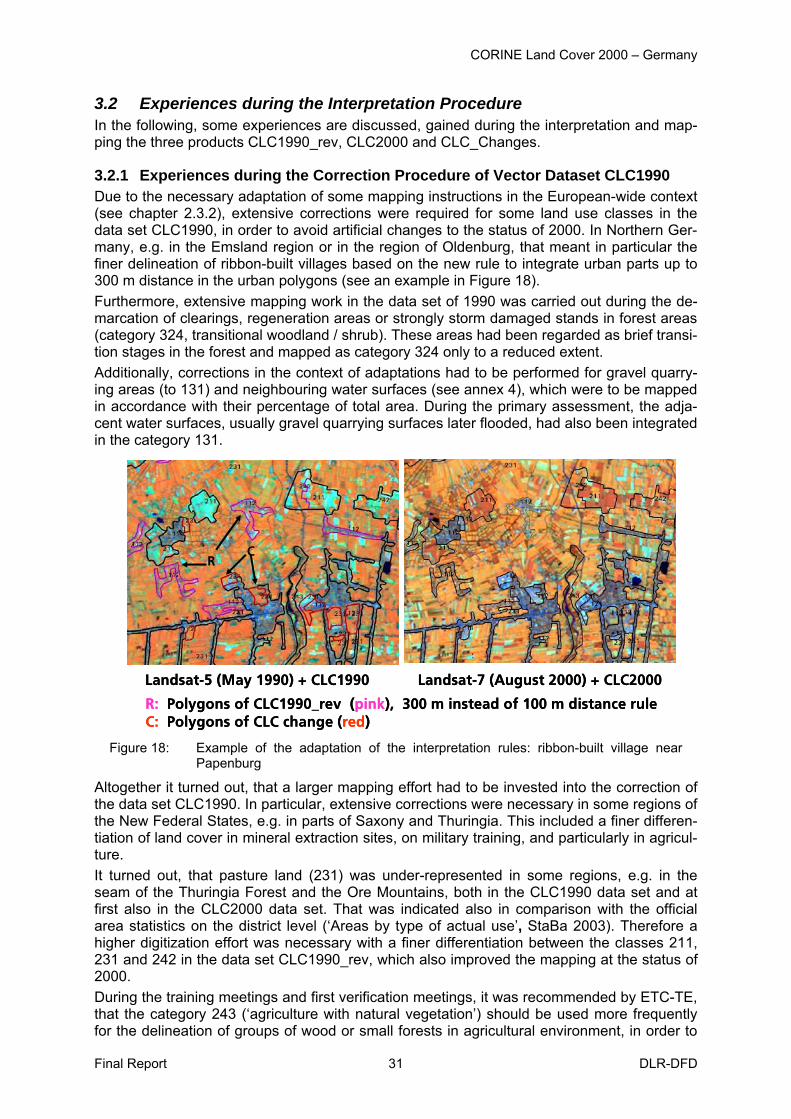
CORINE Land Cover 2000 – Germany
Final Report DLR-DFD 31
3.2 Experiences during the Interpretation Procedure In the following, some experiences are discussed, gained during the interpretation and map-ping the three products CLC1990_rev, CLC2000 and CLC_Changes.
3.2.1 Experiences during the Correction Procedure of Vector Dataset CLC1990 Due to the necessary adaptation of some mapping instructions in the European-wide context (see chapter 2.3.2), extensive corrections were required for some land use classes in the data set CLC1990, in order to avoid artificial changes to the status of 2000. In Northern Ger-many, e.g. in the Emsland region or in the region of Oldenburg, that meant in particular the finer delineation of ribbon-built villages based on the new rule to integrate urban parts up to 300 m distance in the urban polygons (see an example in Figure 18). Furthermore, extensive mapping work in the data set of 1990 was carried out during the de-marcation of clearings, regeneration areas or strongly storm damaged stands in forest areas (category 324, transitional woodland / shrub). These areas had been regarded as brief transi-tion stages in the forest and mapped as category 324 only to a reduced extent. Additionally, corrections in the context of adaptations had to be performed for gravel quarry-ing areas (to 131) and neighbouring water surfaces (see annex 4), which were to be mapped in accordance with their percentage of total area. During the primary assessment, the adja-cent water surfaces, usually gravel quarrying surfaces later flooded, had also been integrated in the category 131.
Landsat-5 (May 1990) + CLC1990 Landsat-7 (August 2000) + CLC2000
R: Polygons of CLC1990_rev (pink), 300 m instead of 100 m distance ruleC: Polygons of CLC change (red)
RC
Landsat-5 (May 1990) + CLC1990 Landsat-7 (August 2000) + CLC2000
R: Polygons of CLC1990_rev (pink), 300 m instead of 100 m distance ruleC: Polygons of CLC change (red)
RC
RC
Figure 18: Example of the adaptation of the interpretation rules: ribbon-built village near Papenburg
Altogether it turned out, that a larger mapping effort had to be invested into the correction of the data set CLC1990. In particular, extensive corrections were necessary in some regions of the New Federal States, e.g. in parts of Saxony and Thuringia. This included a finer differen-tiation of land cover in mineral extraction sites, on military training, and particularly in agricul-ture. It turned out, that pasture land (231) was under-represented in some regions, e.g. in the seam of the Thuringia Forest and the Ore Mountains, both in the CLC1990 data set and at first also in the CLC2000 data set. That was indicated also in comparison with the official area statistics on the district level (‘Areas by type of actual use’, StaBa 2003). Therefore a higher digitization effort was necessary with a finer differentiation between the classes 211, 231 and 242 in the data set CLC1990_rev, which also improved the mapping at the status of 2000. During the training meetings and first verification meetings, it was recommended by ETC-TE, that the category 243 (‘agriculture with natural vegetation’) should be used more frequently for the delineation of groups of wood or small forests in agricultural environment, in order to

CORINE Land Cover 2000 – Germany
Final Report DLR-DFD 32
be able to characterize higher structurally diversified agricultural areas with natural elements; this had been done only in a smaller extent during the primary assessment and had to be adjusted. The finer differentiation is evident also in the number of polygons of the revised data set CLC1990_rev in comparison to the original data set CLC1990. During the correction process of CLC1990, the number of polygons increased by 10482 polygons (8.2%). The calculations in Table 12 and Table 13 are based on dissolved data sets.
Table 12: Number of polygons of CLC1990 und CLC1990_rev
CLC1990 (without buffer) CLC1990_rev (without buffer)
Number of polygons Number of polygons Change in relation to CLC1990
128049 138531 8.2%
The proportional change for the 5 main classes is listed in Table 13, indicated is also the change of the percentage of the total area. A large increase of the number of polygons for the main categories 2 (agriculture), 1 (artificial surfaces) and 5 (water bodies) is also recog-nisable in the proportional area change.
Table 13: Changes of the number of polygons and of the total area in the main categories after the revision process of CLC1990
CLC Code CLC1990rev in relation to CLC1990
Main class Proportional change of number of polygons Proportional change of total area
1 6.5% 2.3%
2 12.7% -0.4%
3 4.4% 0.2%
4 -8.4% -2.8%
5 14.6% 0.4%
Total 8.2% 0.0%
In comparison to that, the number of polygons in the update CLC2000 increased by 2.3 % in relation to the revised data set CLC1990_rev (see Table 14). The main class ‘water bodies’ showed with 8% the highest relative increase in the number of polygons, followed by the main classes ‘artificial surfaces’ (5.6 %) and ‘agriculture’ (1.5 %). These calculations are based on dissolved data sets including the buffer area.
Table 14: Number of polygons of CLC1990_rev and CLC2000
CLC1990_rev (including buffer) CLC2000 (including buffer)
Number of polygons Number of polygons Change in relation to CLC1990_rev
140253 143486 2.3%
The figures listed in Table 12, Table 13 and Table 14 demonstrate the high effort with the correction of CLC1990. Moreover, it indicates the improvement of both data sets due to addi-tional differentiations in the vector data base.

CORINE Land Cover 2000 – Germany
Final Report DLR-DFD 33
3.2.2 Experiences during the Mapping Procedure of the Vector Dataset CLC2000 The enhanced satellite data base in the year 2000 enabled several improvements for the update of CLC, e.g. concerning the artificial surfaces. An improvement in the differentiation of agricultural areas could be achieved by an intensified use of multi-temporal satellite data.
Mapping of Built-Up Areas The improved quality in the Landsat 7 data with the additional panchromatic band enabled a better separation and discrimination of and within settlement areas. Thus, additional small villages (of size over 25 ha) could be detected in larger agricultural areas. In the case of low vegetation cover, these villages showed quite similar spectral behaviour and colours as the neighbouring arable areas in the data of 1990. Due to the better resolved structures in the Landsat 7 ETM, they could be detected and had to be delineated also for the revised CLC1990 data set in the extension of 1990. For the visual interpretation the panchromatic band was integrated in the RGB display (e.g. Red = Band 5, Green = Panchromatic band, Blue = Band 3). Thereby the panchromatic band substituted band ETM4, since the panchromatic band of the sensor ETM+ is characterized by a large spectral coverage in the near infrared. The enhanced textural information and bet-ter differentiation by the panchromatic band is visible in Figure 19. By the integration of the panchromatic band with better textural information, the separation of the urban fabric classes 111 and 112 from class 121 (industrial, commercial and public units) could also be improved. As a fine differentiation between those urban classes needs inten-sive use of additional reference information, the post-processing of these land use classes had to be limited to bigger and clear identifiable complexes of 121 (compare annex 4). The inspection of delineations inside settlement areas was facilitated by up-to-date reference information which could be extracted from online city maps. These internet maps helped in demarcation of allotments (parts of 142) in relation to loose, park-similar residential zones (to 112).
Figure 19: Improved satellite imagery for the interpretation procedure Comparison of Landsat 5 TM satellite imagery from 1990 (left), band combination 5,4,3 (RGB) and Landsat 7 ETM imagery, band combination 5, PAN, 3 (RGB). Depicted are subsets in the Southern Leipzig area.
Discrimination of Arable Land and Pasture During the delineation of arable land (211) and pasture land (231) and/or complex cultivation patterns (242) it turned out that quality of interpretation strongly depended on the time of sat-ellite image acquisition. Acquisitions from May or June proved as rather unfavourable. The

CORINE Land Cover 2000 – Germany
Final Report DLR-DFD 34
spectral development of meadows and pastures showed up to be strongly dependent on the growing and cutting state in this period and was very variable. On the other hand, the vege-tated areas of arable land in this period exhibited partial similar spectral characteristics. The summer scenes from July to the middle of September were more favourable. In autumn scenes, spectral overlapping was visible in areas where a larger weedage had developed on the harvested fields because the ploughing was done very late on these areas. Another difficulty was caused by the brief cultivation of fodder grasses or fodder clover as intermediate crops on otherwise arable land, which could hardly be differentiated from pas-ture land by mono-temporal satellite images. The reliability of interpretation security could be improved strongly for the demarcation of meadows and pastures by the use of multi-temporal images. A majority of the mapping re-gions was additionally covered by another satellite image (1990 and 2000) because of the overlap of neighbouring scenes. In Northern Germany, the overlap reaches 80 to 90 %. Fur-ther Landsat 7 images from the years 1999 to 2003 were available at the ‘Landsat 7 scientific data pool’ of DFD. These scenes gave additional decision support during quality control (see the example in Figure 20).
Landsat 7 ETM September 1999 Landsat 7 ETM August 2000
Figure 20: Improved discrimination of arable land and pasture by the use of additional multi-temporal Landsat imagery
Mapping of Hop Cultivation Areas In contrast to the primary assessment in Germany, hop plantations had to be mapped in the category permanent crops as 222 (’fruit trees and berry plantations’) (see annex 4) instead of integration in the category 211 (‘non-irrigated arable land’). Hence, these polygons had to be corrected in CLC1990_rev to avoid false changes. In order to limit misinterpretations, addi-tional information of distribution of the main hop producing regions on district level was in-cluded in the GIS. The main cultivation areas of the Hallertau region (South of Ingolstadt) and of Tettnang (North of Lindau / Lake Constance) were considered. As primary base of the delineation, a supervised classification of the hop areas was accomplished in the main area of the Hallertau on the basis of the Landsat scenes. Using this knowledge and the incom-plete hop signatures in the TK25, hop areas in 1990 and 2000 could be delineated from the available summer scenes. Hop areas below the minimum mapping size of 25 ha were inte-grated in the category 242.
Interpretation and Differentiation of Forest The dynamics within the forest areas of the CLC data set are in particular characterized by the effects of storm events like the winter storm Lothar in December 1999, and by the suc-ceeding forest activities. The storm damage areas had to be mapped in the category 324 – ‘transitional woodland / shrub’ (see annex 4). As agreed with ETC-TE, this category was

CORINE Land Cover 2000 – Germany
Final Report DLR-DFD 35
used also for areas with remaining coniferous forest cover below approx. 50 %, and for areas where thrown or cleared areas were dominant. As it was already mentioned, areas of class 324 had been mapped only to small extent in the primary assessment in Germany. That was corrected in the revision of CLC1990 as far as possible. Furthermore, finer differentiations in the class of mixed forest (313) were accomplished by the delineation of areas with dominant coniferous (312) and deciduous (311) within polygons of mixed forest.
Interpretation of Semi-Natural Areas and Wetlands Within the clarification process with the technical team of ETC-TE some differences became evident in the understanding of semi-natural classes and wetlands between the guidelines of ETC-TE and the approach of the German primary assessment. That meant respective cor-rections in the data sets CLC2000 and CLC1990_rev:
• Category 322 (moors and heath land) is not to be seen as an additional transition state of the development 333 - 321 - 324 as it was partly done in the primary as-sessment, but is to be used only if the heath land areas are in a climax stage.
• In areas of 322 in the highlands it was checked if these areas were better to charac-terise by 324 (transitional woodland / shrub) because of forest damages (e.g. by storms).
• Class 321 – ‘natural grassland’ had to be used more restrictively concerning the dis-crimination to class 231 – ‘pasture land’. A typical occurrence of 321 was found for grassland areas on military training sites or on limy soils as ecological habitat.
• In some regions, the mapping of abandoned land and the discrimination of 211, 231 and 321 was difficult. According to Bossard et al. (2000), fallowed land has to be mapped as 211 for the first three years after agricultural use. After 5 years of land set-aside, this area has to be mapped as 231.
• At the seam of the Alps, the discrimination of inland marshes (411) and peat bogs (412) had to be improved. Therefore form characteristics and neighbourhood informa-tion were used to assist the interpretation; in some areas botanic information was used.
3.2.3 Experiences during the Mapping Procedure of Land Use Changes As described in chapter 2.3.4, a combined approach was used for the mapping of changed areas. According to EEA and ETC-TE (2002), at least 5 ha in size must be achieved for changed areas, and new as well as old resulting areas must have a size of at least 25 ha. Due to the minimum mapping unit of 25 hectares, technical changes can occur, which do not represent a real change. In this cases an additional attribute NRCH=1 (‘no real change’) was assigned (see chapter 2.3.5). In particular technical changes, associated with artificial sur-faces and their development, were labelled. However, as discussed in chapter 2.3.5, techni-cal changes were avoided as far as possible by using more appropriate delineations and interpretations. Nevertheless, remaining technical changes were not removed from the data set CLC_Changes in order to retain the relation CLC1990_rev + Change = CLC2000. The non-consideration of isolated change polygons below 25 hectares in the change data set, seems to be more problematic. Isolated changes are island polygons within only one surrounding land use polygon. In this context many problems can be expected in future up-dates. Furthermore the different minimum mapping units made a high effort for an adequate generalization in many situations necessary. In different steps of corrections many false or not evident changes in agricultural areas were eliminated. These were often caused by constraints in the quality of the primary assessment due to the usage of unfavourable satellite data in 1990 for the discrimination of arable land

CORINE Land Cover 2000 – Germany
Final Report DLR-DFD 36
and pasture land. However, a complete revision of the agricultural area was not possible, since less coverage by satellite data and not sufficient reference data were available at the status of 1990. Also it was a matter of budget constraints.
3.3 Examples of Land Use Changes In the following chapter several examples are presented which represent various regional land use dynamics.
3.3.1 Land Use Changes in the Region of Leipzig The region of Leipzig is an urban region which was characterized by several transformation and development processes following the German reunification. Comparing the CLC pro-ducts CLC1990_rev and CLC2000 of Figure 21 (above), the suburban development of set-tlements (112) and land dedicated to industry, commercial and transportation infrastructure (12x) can be seen. Prominent is the enlargement of the airport (124) north-western of Leip-zig. These types of changes can be summarized in transformation class ‘urbanization’. A special characteristic in the Leipzig region is the direct neighbourhood of large lignite surface mines in the South, which were running up to 1990. After 1990, large portions of these min-eral extraction sites were converted to other land cover and land use, by recultivation or transformation to lakes surrounded by recreation areas (see KEIL et al., 2002; KEIL et al., 2003). The transformation classes in the illustration in Figure 21 (below) summarize various transitions of land use to process classes, following the definitions of FERANEC et al (2000).
Results of interpretation of CLC1990 (revised, on the left) and CLC2000 (on the right)
Figure 21: The region of Leipzig in the map products of CLC1990 and CLC2000 (above) and
generalized transformation classes (below) (source: Keil et al., 2002)

CORINE Land Cover 2000 – Germany
Final Report DLR-DFD 37
3.3.2 Land Use Changes in the Region of Berlin A satellite image of the Berlin region is depicted in Figure 22 (above), superimposed by the interpreted polygons. The colour coded vector data set CLC2000 is depicted in Figure 22 (below).
Figure 22: Landsat 7 imagery of August 2000 (above) and the map product CLC2000 (below) of the Berlin region See Figure 7 for legend; administrative boundaries are shown as overlay.
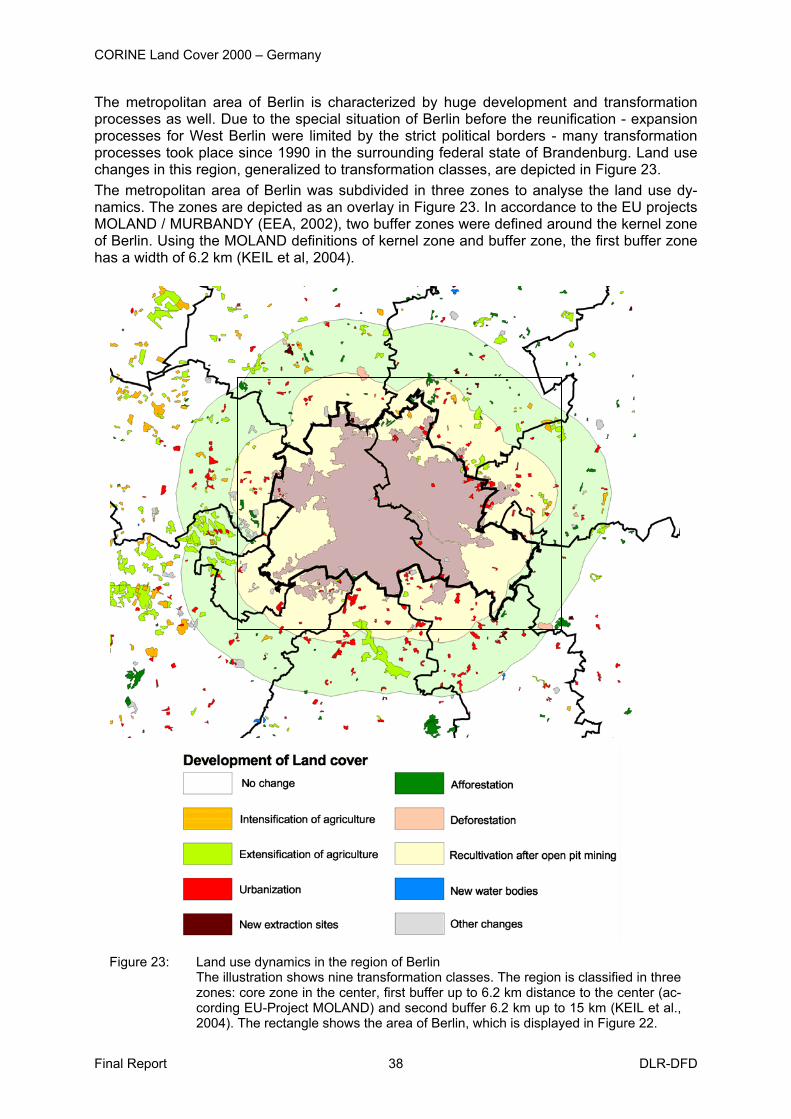
CORINE Land Cover 2000 – Germany
Final Report DLR-DFD 38
The metropolitan area of Berlin is characterized by huge development and transformation processes as well. Due to the special situation of Berlin before the reunification - expansion processes for West Berlin were limited by the strict political borders - many transformation processes took place since 1990 in the surrounding federal state of Brandenburg. Land use changes in this region, generalized to transformation classes, are depicted in Figure 23. The metropolitan area of Berlin was subdivided in three zones to analyse the land use dy-namics. The zones are depicted as an overlay in Figure 23. In accordance to the EU projects MOLAND / MURBANDY (EEA, 2002), two buffer zones were defined around the kernel zone of Berlin. Using the MOLAND definitions of kernel zone and buffer zone, the first buffer zone has a width of 6.2 km (KEIL et al, 2004).
Figure 23: Land use dynamics in the region of Berlin The illustration shows nine transformation classes. The region is classified in three zones: core zone in the center, first buffer up to 6.2 km distance to the center (ac-cording EU-Project MOLAND) and second buffer 6.2 km up to 15 km (KEIL et al., 2004). The rectangle shows the area of Berlin, which is displayed in Figure 22.

CORINE Land Cover 2000 – Germany
Final Report DLR-DFD 39
The urbanized areas showed an increase of 25.10 km² (2.20%) in the first buffer zone, and a similar absolute increase of 24.13 km² in the second buffer zone (1.48%). The already highly urbanized area in the kernel zone showed the least increment of 4.27 km² or 0.67%. Besides urbanization process, extensification of agriculture is an important process, espe-cially in the periphery of the Berlin region. On the one hand, the extensification consists in conversions from arable land (211) to pasture land (231) or heterogeneous agricultural areas (242 or 243), on the other hand in transformations of permanent crops (former fruit trees and berry plantations, 222) to arable land or pasture land. The latter process is evident especially in the West of Berlin.
3.3.3 Land Use Changes in the Emsland Region, North-western Germany A prominent example of land use changes is given by a new built automobile proving ground in the Emsland region, in the East of the city of Papenburg. This is shown in Figure 24 for the classes of CORINE Land Cover; the changes are depicted in the status 2000. This installa-tion was connected with a partial drainage of peat bog areas.
CLC1990 CLC2000
Landsat-7 ETM+, August 2000
Land use changes In the East of Papenburg, Emsland region
New automobile proving ground
CLC Changes
Landsat-5 TM, Mai 1990
CLC1990 CLC2000
Landsat-7 ETM+, August 2000
Land use changes In the East of Papenburg, Emsland region
New automobile proving ground
CLC Changes
Landsat-5 TM, Mai 1990
Figure 24: Representation of a new built automobile proving ground in the Emsland region in the products of CORINE Land Cover
3.3.4 Impacts of Storm Damages in Northern Black Forest On December 26 1999, winter storm Lothar hit South West Germany, Northern Switzerland and Eastern France. In Germany large forest areas in the northern part of Black Forest were devastated, in particular coniferous forest was damaged. Satellite images and CORINE Land Cover products of this region are depicted in Figure 25. In the Landsat 7 scene from 2001, ground vegetation and first reforestation stages on damaged areas are identifiable. In the data set CLC_Changes most damaged areas are mapped as the transition ‘coniferous forest’ to ‘transitional woodland - shrub’ (312 324).

CORINE Land Cover 2000 – Germany
Final Report DLR-DFD 40
Figure 25: Damaged areas due to windthrow in Northern Black Forest near Rastatt
Damaged areas are visible in satellite imagery (Landsat 7 from 2001) and in the CLC_Changes (lower right). New polygons with CLC code 324 – transitional woodland - shrub are represented in yellow.
3.3.5 Land Use Changes in the Mining Areas of the Niederlausitz Region The region Niederlausitz in Eastern Germany near the Polish border is one of the largest lignite opencast mining landscapes of Germany and characterized by high land use dynam-ics. Based on the working units Hoyerswerda and Niesky, changes between 1990 an 2000 reach a percentage of 12% of the total area (KIEFL et al, 2003). Land use polygons of CLC2000 and classified change areas are depicted in Figure 26. The opencast mining is the most important reason for the high dynamics. This is reflected in the large amount of recultivation areas and new water bodies. Furthermore, afforested areas have a high percentage and are associated with the abandonment of military training areas. Additionally, conversions in agricultural areas play an important role, in the most cases they are due to transitions between arable land and pasture land. Other change types are more or less irrelevant.

CORINE Land Cover 2000 – Germany
Final Report DLR-DFD 41
Restricted area
Brown coal mining area
Restricted area
Brown coal mining area
Restricted area
Brown coal mining area
Restricted area
Brown coal mining area
Figure 26: Land use and land use changes in the Niederlausitz region
About 12 percent of the total area of working units Hoyerswerda and Niesky has changed. Most changes are associated with lignite opencast mining and recultivations as well as with abandonment of military areas. See Figure 7 and Figure 21 for leg-ends. .

CORINE Land Cover 2000 – Germany
Final Report DLR-DFD 42
4 Results of Data Analysis In the following chapter the results of the statistical analysis of the CLC products will be pre-sented and discussed. Besides the presentation of the results for whole Germany, the results for the Old and New Federal States (including Berlin) will be analysed and compared. For the data analysis, the whole data set containing the layers CLC1990_rev and CLC2000 was combined with a data set of the administrative boundaries (level NUTS1) of Germany (Source: INFAS Geodaten, status 2002). All presented results were derived from the result-ing data base. Due to this approach for Germany an area of 357,564 km² was analysed, of which 248,583 km² (approximately 70%) account for the Old Federal States and 108,981 km² for the New federal States including Berlin.
4.1 CLC1990_rev Area and percentage of the CLC-classes for the status 1990 are listed in Table 15, Table 16 and Table 17 for the three levels of CLC. All values are derived from the corrected data set CLC1990_rev. For CLC Codes see the nomenclature in Table 6. The statistics of the geometric adapted but not thematically corrected data set CLC1990 are shown in Annex 9.
Table 15: Area and percentage of CLC main classes level 1 in the Old and New Federal States and for Germany to the status 1990
CLC Code Old Federal States New Federal States + Berlin
Germany
Area [km²] Percentage Area [km²] Percentage Area [km²] Percentage1 19647.87 7.90% 7729.73 7.09% 27377.60 7.66% 2 148266.91 59.64% 67970.99 62.37% 216237.91 60.48% 3 77462.47 31.16% 31351.10 28.77% 108813.57 30.43% 4 1383.40 0.56% 259.12 0.24% 1642.52 0.46% 5 1822.66 0.73% 1670.56 1.53% 3493.22 0.98%
Table 16: Area and percentage of CLC classes level 2 in the Old and New Federal States
and for Germany to the status 1990
CLC Code Old Federal States New Federal States + Berlin
Germany
Area [km²] Percentage Area [km²] Percentage Area [km²] Percentage 11 15861.98 6.38% 5634.87 5.17% 21496.85 6.01% 12 2288.07 0.92% 944.38 0.87% 3232.45 0.90% 13 625.48 0.25% 821.40 0.75% 1446.89 0.40% 14 872.34 0.35% 329.08 0.30% 1201.41 0.34% 21 84206.17 33.87% 55416.08 50.85% 139622.25 39.05% 22 2354.49 0.95% 426.10 0.39% 2780.59 0.78% 23 35757.72 14.38% 8638.79 7.93% 44396.51 12.42% 24 25948.53 10.44% 3490.02 3.20% 29438.55 8.23% 31 74447.08 29.95% 29706.36 27.26% 104153.44 29.13% 32 2521.63 1.01% 1446.70 1.33% 3968.33 1.11% 33 493.76 0.20% 198.03 0.18% 691.80 0.19% 41 1132.85 0.46% 259.12 0.24% 1391.97 0.39% 42 250.55 0.10% 0.00 0.00% 250.55 0.07% 51 1724.33 0.69% 1642.41 1.51% 3366.74 0.94% 52 98.33 0.04% 28.15 0.03% 126.48 0.04%

CORINE Land Cover 2000 – Germany
Final Report DLR-DFD 43
Table 17: Area and percentage of CLC classes level 3 in the Old and New Federal States and for Germany to the status 1990
CLC Code Old Federal States New Federal States + Berlin
Germany
Area [km²] Percentage Area [km²] Percentage Area [km²] Percentage111 148.23 0.06% 83.16 0.08% 231.39 0.06% 112 15713.75 6.32% 5551.71 5.09% 21265.46 5.95% 121 1773.26 0.71% 716.87 0.66% 2490.12 0.70% 122 114.88 0.05% 50.52 0.05% 165.40 0.05% 123 101.84 0.04% 7.89 0.01% 109.72 0.03% 124 298.10 0.12% 169.10 0.16% 467.20 0.13% 131 445.50 0.18% 754.16 0.69% 1199.66 0.34% 132 120.71 0.05% 52.09 0.05% 172.80 0.05% 133 59.27 0.02% 15.16 0.01% 74.43 0.02% 141 321.13 0.13% 102.26 0.09% 423.39 0.12% 142 551.21 0.22% 226.82 0.21% 778.03 0.22% 211 84206.17 33.87% 55416.08 50.85% 139622.25 39.05% 221 1289.32 0.52% 0.78 0.00% 1290.10 0.36% 222 1065.17 0.43% 425.32 0.39% 1490.49 0.42% 231 35757.72 14.38% 8638.79 7.93% 44396.51 12.42% 242 19865.53 7.99% 853.66 0.78% 20719.19 5.79% 243 6083.01 2.45% 2636.36 2.42% 8719.37 2.44% 311 18304.22 7.36% 5659.19 5.19% 23963.41 6.70% 312 35857.57 14.42% 20843.45 19.13% 56701.02 15.86% 313 20285.29 8.16% 3203.72 2.94% 23489.01 6.57% 321 1102.42 0.44% 869.76 0.80% 1972.18 0.55% 322 467.96 0.19% 98.28 0.09% 566.24 0.16% 324 951.25 0.38% 478.66 0.44% 1429.91 0.40% 331 62.76 0.03% 18.03 0.02% 80.79 0.02% 332 165.80 0.07% 0.34 0.00% 166.13 0.05% 333 264.90 0.11% 178.26 0.16% 443.16 0.12% 334 0.00 0.00% 1.40 0.00% 1.40 0.00% 335 0.30 0.00% 0.00 0.00% 0.30 0.00% 411 237.26 0.10% 254.77 0.23% 492.03 0.14% 412 895.59 0.36% 4.35 0.00% 899.94 0.25% 421 152.66 0.06% 0.00 0.00% 152.66 0.04% 423 97.89 0.04% 0.00 0.00% 97.89 0.03% 511 598.75 0.24% 135.68 0.12% 734.43 0.21% 512 1125.59 0.45% 1506.72 1.38% 2632.31 0.74% 521 2.21 0.00% 17.85 0.02% 20.06 0.01% 522 80.75 0.03% 0.00 0.00% 80.75 0.02% 523 15.37 0.01% 10.30 0.01% 25.67 0.01%
The largest categories of the nationwide data set are arable land (211) with a percentage of 39% of the total area, coniferous forest (312, approximately 16%) and Pastures (231, more than 12%). They were followed by the classes deciduous (311) and mixed forest (313). This order is quite similar for the Old and New Federal States, but the dimensions of the percent-ages are different. While the percentage of arable land amounts one third of the Old Federal States, more than 50% of the New Federal States are covered by this class. The percentage of pasture in the Old Federal States is nearly twice as high as in the New Federal States. While in 8% of the Old Federal States the class complex cultivation pattern (242) is mapped, this category is comparatively without relevance in the New Federal States. This is a strong indicator for the different structures of the agricultural area.

CORINE Land Cover 2000 – Germany
Final Report DLR-DFD 44
Furthermore the percentage of the class mixed forest (313) is nearly three times as high in the Old Federal States. Mineral extraction sites (131) have a four times higher percentage in the New Federal States, even when this category plays a minor role regarding the total area.
4.2 CLC2000 Area and percentage of the CLC-classes for the status 2000 are listed in Table 18, Table 19 und Table 20 for the three levels of CLC.
Table 18: Area and percentage of main CLC classes level 1 in the Old and New Federal States and for Germany to the status 2000
CLC Code Old Federal States New Federal States + Berlin
Germany
Area [km²] Percentage Area [km²] Percentage Area [km²] Percentage1 20856.76 8.39% 8108.63 7.44% 28965.38 8.10% 2 147033.32 59.15% 67146.00 61.61% 214179.33 59.90% 3 77424.31 31.15% 31691.10 29.08% 109115.41 30.52% 4 1365.33 0.55% 258.74 0.24% 1624.08 0.45% 5 1903.60 0.77% 1777.02 1.63% 3680.62 1.03%
Table 19: Area and percentage of CLC classes level 2 in the Old and New Federal States and for Germany to the status 2000
CLC Code Old Federal States New Federal States + Berlin
Germany
Area [km²] Percentage Area [km²] Percentage Area [km²] Percentage11 16514.16 6.64% 5935.96 5.45% 22450.12 6.28% 12 2616.91 1.05% 1210.41 1.11% 3827.32 1.07% 13 694.20 0.28% 603.06 0.55% 1297.26 0.36% 14 1031.49 0.41% 359.20 0.33% 1390.69 0.39% 21 82919.16 33.36% 54015.86 49.56% 136935.03 38.30% 22 2351.56 0.95% 171.43 0.16% 2522.99 0.71% 23 35920.17 14.45% 9493.32 8.71% 45413.48 12.70% 24 25842.43 10.40% 3465.40 3.18% 29307.83 8.20% 31 74066.31 29.80% 29919.63 27.45% 103985.94 29.08% 32 2902.96 1.17% 1507.25 1.38% 4410.20 1.23% 33 455.05 0.18% 264.22 0.24% 719.27 0.20% 41 1115.19 0.45% 258.74 0.24% 1373.93 0.38% 42 250.15 0.10% 0.00 0.00% 250.15 0.07% 51 1807.04 0.73% 1748.91 1.60% 3555.94 0.99% 52 96.56 0.04% 28.11 0.03% 124.67 0.03%
Table 20: Area and percentage of CLC classes level 3 in the Old and New Federal States
and for Germany to the status 2000
CLC Code Old Federal States New Federal States + Berlin
Germany
Area [km²] Percentage Area [km²] Percentage Area [km²] Percentage111 148.23 0.06% 83.55 0.08% 231.78 0.06% 112 16365.93 6.58% 5852.41 5.37% 22218.34 6.21% 121 2096.40 0.84% 973.27 0.89% 3069.67 0.86% 122 119.71 0.05% 53.44 0.05% 173.15 0.05% 123 102.34 0.04% 7.91 0.01% 110.25 0.03%

CORINE Land Cover 2000 – Germany
Final Report DLR-DFD 45
CLC Code Old Federal States New Federal States + Berlin
Germany
Area [km²] Percentage Area [km²] Percentage Area [km²] Percentage124 298.47 0.12% 175.78 0.16% 474.25 0.13% 131 528.05 0.21% 517.30 0.47% 1045.35 0.29% 132 120.29 0.05% 57.57 0.05% 177.86 0.05% 133 45.86 0.02% 28.19 0.03% 74.05 0.02% 141 323.63 0.13% 102.39 0.09% 426.02 0.12% 142 707.86 0.28% 256.81 0.24% 964.67 0.27% 211 82919.16 33.36% 54015.86 49.56% 136935.03 38.30% 221 1290.99 0.52% 0.61 0.00% 1291.59 0.36% 222 1060.57 0.43% 170.82 0.16% 1231.39 0.34% 231 35920.17 14.45% 9493.32 8.71% 45413.48 12.70% 242 19764.57 7.95% 860.80 0.79% 20625.37 5.77% 243 6077.87 2.45% 2604.59 2.39% 8682.46 2.43% 311 18324.86 7.37% 5690.29 5.22% 24015.15 6.72% 312 35353.47 14.22% 20983.72 19.25% 56337.19 15.76% 313 20387.99 8.20% 3245.62 2.98% 23633.60 6.61% 321 1116.92 0.45% 642.85 0.59% 1759.77 0.49% 322 467.64 0.19% 92.05 0.08% 559.69 0.16% 324 1318.40 0.53% 772.35 0.71% 2090.75 0.58% 331 63.43 0.03% 12.92 0.01% 76.34 0.02% 332 165.80 0.07% 0.34 0.00% 166.13 0.05% 333 225.52 0.09% 250.97 0.23% 476.49 0.13% 334 0.00 0.00% 0.00 0.00% 0.00 0.00% 335 0.30 0.00% 0.00 0.00% 0.30 0.00% 411 236.18 0.10% 253.79 0.23% 489.97 0.14% 412 879.01 0.35% 4.95 0.00% 883.96 0.25% 421 157.04 0.06% 0.00 0.00% 157.04 0.04% 423 93.11 0.04% 0.00 0.00% 93.11 0.03% 511 606.12 0.24% 135.68 0.12% 741.80 0.21% 512 1200.92 0.48% 1613.22 1.48% 2814.15 0.79% 521 2.21 0.00% 17.81 0.02% 20.02 0.01% 522 79.71 0.03% 0.00 0.00% 79.71 0.02% 523 14.64 0.01% 10.30 0.01% 24.94 0.01%
In general the statements made for CLC1990_rev are valid also for CLC2000, concerning the ranking of the classes and differences between the Old and the New Federal States. But attention should be paid to the fact that the difference of the percentages of the class mineral extraction sites (131) has decreased significantly, due to land cover changes in the New Fed-eral States.
4.3 CLC_Changes CLC changes were derived as difference areas between the two data bases CLC1990 rev and CLC2000 in accordance with the methodology described in chapter 2.3.4. Altogether 8,553 km² change area was mapped, which is 2.39% of the total area of Germany. More than 50% of the total change area are situated in the New Federal States (including Berlin), though the total area of the New Federal States amounts less than one third of the total area of Germany. Thus 4.1% of the area of the New Federal States (4,468 km²) have changed. In contrast to this, land use changes took place only on 1.64% of the area of the Old Federal States (4,085 km²).

CORINE Land Cover 2000 – Germany
Final Report DLR-DFD 46
4.3.1 Land Use Conversions in CLC Level 3 The dominating land use changes, which altogether represent more than 90% of the total change area, are listed for Germany (see to Table 21) as well as for the Old and the New Federal States (see Table 22 and Table 23). The transitions were classified in change classes, following an approach of FERANEC et al. (2000). The table rows are coloured ac-cording to the legend in Table 21. For the complete data set of Germany, 36 transitions provide 90% of all change areas. As expected, transitions from arable land (211) are the dominating changes. The transition from arable land (211) to pastures (231) has the highest percentage; the transition from arable land to complex cultivation patterns (242) is the third biggest transition class. Obviously a trend of extensification of agricultural areas is reflected. Also transitions in the opposite direc-tion took place (intensification of agricultural areas), although in smaller amount (fifth and tenth place). Important urbanization effects are represented by land use changes such as from arable land to discontinuous urban fabric (112) or to industrial or commercial units (121). Remarkable is the transition from coniferous forest (312) to transitional woodland - shrub (324), due to the damages caused by winter storms in many forests in the Southwest of Germany. However, afforestation (transitions from 324 to forest classes 313, 312 and 311) played also an impor-tant role.
Table 21: Dominant land use changes between 1990 and 2000 in Germany
Transition Germany Area [km²] Percentage Cumulative
Legend 211→231 1475.97 17.26% 17.26% Intensification of agriculture 211→112 692.29 8.09% 25.35% Extensification of agriculture 211→242 648.61 7.58% 32.93% Afforestation 312→324 570.63 6.67% 39.60% Deforestation 231→211 569.43 6.66% 46.26% Urbanisation / increase of sealing 242→231 470.26 5.50% 51.76% New extraction sites 211→121 418.25 4.89% 56.65% Recultivation after open pit mining 222→211 275.94 3.23% 59.88% New water bodies 321→324 247.27 2.89% 62.77% Other changes 242→211 239.48 2.80% 65.57%
324→313 219.02 2.56% 68.13% 211→131 160.94 1.88% 70.01% 131→333 151.72 1.77% 71.78% 324→312 139.87 1.64% 73.42% 231→242 138.84 1.62% 75.04% 211→142 138.66 1.62% 76.66% 231→112 128.20 1.50% 78.16% 242→112 109.14 1.28% 79.44% 333→321 96.39 1.13% 80.56% 131→324 95.72 1.12% 81.68% 131→512 88.14 1.03% 82.71% 313→324 83.56 0.98% 83.69% 211→312 81.00 0.95% 84.64% 324→311 62.91 0.74% 85.37% 211→512 51.70 0.60% 85.98% 211→133 41.63 0.49% 86.46% 131→211 40.34 0.47% 86.94%

CORINE Land Cover 2000 – Germany
Final Report DLR-DFD 47
Transition Germany Area [km²] Percentage Cumulative 211→222 39.43 0.46% 87.40% 333→324 37.22 0.44% 87.83% 312→131 36.54 0.43% 88.26% 231→121 35.65 0.42% 88.68% 242→121 34.95 0.41% 89.08% 321→312 29.63 0.35% 89.43% 231→142 27.58 0.32% 89.75% 112→121 26.79 0.31% 90.07% 311→324 23.65 0.28% 90.34%
By a more detailed analysis of the changes, the significant differences between the Old and the New Federal States are obvious (see Table 22 and Table 23). In the Old Federal States processes of extensification of agriculture and of urbanization showed the most effect. Both change classes represent more than one quarter of the total change area. The classes ‘de-forestation’ and ‘intensification of agriculture’ are the two next important change classes. In the new Federal States extensification of agriculture (over 40% of the total change area) is the dominant change class. The classes ‘urbanisation’, ‘intensification of agriculture’ and ‘afforestation’ show similar percentages of approximately 12%.
Table 22: Dominant land use changes between 1990 and 2000 in the Old Federal States (see Table 21 for legend)
Table 23: Dominant land use changes between 1990 and 2000 in the New Federal States (see Table 21 for legend)
Transition Old Federal States Transition New Federal States + Berlin Area [km²] Percentage Cumulative Area [km²] Percentage Cumulative
312→324 537.34 13.15% 13.15% 211→231 1172.00 26.23% 26.23% 211→242 460.77 11.28% 24.44% 231→211 448.07 10.03% 36.25% 211→112 418.63 10.25% 34.68% 222→211 273.84 6.13% 42.38% 211→231 303.97 7.44% 42.13% 211→112 273.66 6.12% 48.51% 242→231 265.04 6.49% 48.61% 321→324 238.57 5.34% 53.85% 242→211 224.38 5.49% 54.11% 211→121 217.17 4.86% 58.71% 211→121 201.08 4.92% 59.03% 242→231 205.22 4.59% 63.30% 324→313 188.49 4.61% 63.64% 211→242 187.83 4.20% 67.50% 231→211 121.36 2.97% 66.61% 131→333 151.13 3.38% 70.88% 211→142 118.32 2.90% 69.51% 131→324 89.08 1.99% 72.88% 231→112 115.46 2.83% 72.34% 324→312 82.87 1.85% 74.73% 242→112 106.20 2.60% 74.94% 211→312 78.57 1.76% 76.49% 231→242 96.82 2.37% 77.31% 131→512 73.63 1.65% 78.14% 211→131 88.90 2.18% 79.48% 211→131 72.04 1.61% 79.75% 313→324 78.56 1.92% 81.41% 333→321 64.48 1.44% 81.19% 324→312 57.00 1.40% 82.80% 231→242 42.02 0.94% 82.13% 324→311 43.19 1.06% 83.86% 211→222 33.70 0.75% 82.89% 242→121 34.02 0.83% 84.69% 312→324 33.29 0.74% 83.63% 211→512 33.26 0.81% 85.51% 333→324 32.54 0.73% 84.36% 333→321 31.91 0.78% 86.29% 324→313 30.52 0.68% 85.04% 231→121 30.89 0.76% 87.05% 321→312 26.41 0.59% 85.64% 131→211 22.50 0.55% 87.60% 312→131 24.20 0.54% 86.18% 211→133 22.36 0.55% 88.14% 131→321 20.81 0.47% 86.64%

CORINE Land Cover 2000 – Germany
Final Report DLR-DFD 48
Transition Old Federal States Transition New Federal States + Berlin Area [km²] Percentage Cumulative Area [km²] Percentage Cumulative
231→142 20.81 0.51% 88.65% 211→142 20.34 0.46% 87.10% 112→121 18.49 0.45% 89.11% 324→311 19.72 0.44% 87.54% 242→142 16.87 0.41% 89.52% 211→133 19.27 0.43% 87.97% 133→121 16.16 0.40% 89.91% 211→512 18.44 0.41% 88.38% 311→324 14.66 0.36% 90.27% 131→211 17.84 0.40% 88.78%
321→131 17.69 0.40% 89.18% 211→311 17.29 0.39% 89.56% 242→211 15.11 0.34% 89.90% 211→324 14.73 0.33% 90.23% 321→333 14.69 0.33% 90.56%
231→112 12.75 0.29% 90.85%
Examining the transitions between land use classes more detailed, the mentioned differ-ences can be proven further. While the loss of coniferous forest (312→324) is of almost no relevance in the New Federal States, this transition has the highest percentage of the total change area in the Old Federal States. This is, as already mentioned, caused by the winter storms Vivian, Wiebke and Lothar, which had the most impact on the coniferous forest stands of Black Forest, Hunsrueck and Soonwald. Supposably afforestation will be the most important change process in these regions in the near future. However, so far a predomi-nance of transitions to mixed forests in relation to transitions to pure coniferous or deciduous forests is recognisable. This could probably be interpreted as an effect of changed strategies in forestry. In contrast to that, the high percentages of transitions from sparsely vegetated areas (333) and natural grassland (321) to transitional woodland - shrub (324) as well as transitions to different forest classes (324→31x) in the New Federal States are mainly caused by affore-station effects on former military areas. Remarkable in the New Federal States are also tran-sitions of mineral extractions sites (131) to classes such as sparsely vegetated areas (333), transitional woodland - shrub (324), natural grassland (321) or water bodies (512). They indi-cate recultivation activities on former open mining surfaces. As mentioned before, transitions between agricultural classes play the most important role both in the Old and New Federal States. In the Old Federal States, exchanges between ar-able land (211), pastures (231) and complex cultivation patterns (242) took place in all direc-tions (with a clear predominance on the decreasing of arable land). In contrast to that, the transition from arable land (211) to pastures (231) is absolutely dominant (with more than 25% of the total change area) in the New Federal States, the transition in the opposite direc-tion is on the second place (10% of the total change area). Finally, the high percentage of the change from fruit trees and berries plantations (222) to arable land (211) has to be pointed out, which indicates the restructuring of numerous fruit growing farms.
4.3.2 Aggregated Land Use Conversions in CLC Level 1 Aggregated to CLC level 1, there are altogether 25 types of conversions, including internal transitions. Table 24 shows the statistics of the transition types for Germany. The three con-version types ‘internal conversions in agricultural class’ (2→2), ‘transition from agricultural area to artificial surfaces’ (2→1) and internal transitions within the class ‘forests and semi-natural areas’ (3→3) held over 86% of the total change area, whereby the first type plays the most important role.

CORINE Land Cover 2000 – Germany
Final Report DLR-DFD 49
Table 24: Changes of CLC classes level 1 between 1990 and 2000 in Germany
CLC1990 CLC2000 Germany Level1 Level1 Area [km²] Percentage Cumulative
2 2 3913.01 45.75% 45.75% 2 1 1910.79 22.34% 68.09% 3 3 1575.25 18.42% 86.50% 1 3 292.88 3.42% 89.93% 2 3 208.75 2.44% 92.37% 3 1 149.36 1.75% 94.12% 1 5 104.04 1.22% 95.33% 1 1 100.90 1.18% 96.51% 1 2 83.19 0.97% 97.48% 2 5 74.92 0.88% 98.36% 3 2 42.74 0.50% 98.86% 4 2 20.89 0.24% 99.10% 3 5 15.19 0.18% 99.28% 2 4 13.44 0.16% 99.44% 4 3 11.96 0.14% 99.58% 3 4 8.12 0.09% 99.67% 4 1 6.26 0.07% 99.75% 4 5 5.45 0.06% 99.81% 5 4 4.16 0.05% 99.86% 5 3 3.66 0.04% 99.90% 4 4 3.43 0.04% 99.94% 5 2 2.50 0.03% 99.97% 5 1 1.87 0.02% 99.99% 1 4 0.39 0.00% 100.00% 5 5 0.17 0.00% 100.00%
Comparing the statistics of the aggregated change types for the Old and the New Federal States (see Table 25 and Table 26), similar statements can be made. In both cases, internal conversions in agricultural class (2→2) represent the largest class. However, in the New Federal States this type is substantially more dominant (50% of the total change area). In the Old Federal States, the types ‘transition from agricultural area to artificial surfaces’ (2→1) and internal conversions within the class ‘forests and semi-natural areas’ (3→3) play a more important role than in the New Federal states. In the Old Federal States deforestation proc-esses are relevant for this transition type, while afforestation processes are relevant in the New Federal States (compare Table 22 and Table 23).
Table 25: Changes of CLC classes level 1 between 1990 and 2000 in the Old Federal States
Table 26: Changes of CLC classes level 1 between 1990 and 2000 in the New Federal States
CLC CLC Old Federal States CLC CLC New Federal States + Berlin 1990 Le-vel1
2000 Le-vel1
Area [km²] Percentage Cumulative 1990 Le-vel1
2000 Le-vel1
Area [km²] Percentage Cumulative
2 2 1503.80 36.81% 36.81% 2 2 2409.22 53.91% 53.91% 2 1 1236.38 30.27% 67.08% 2 1 674.41 15.09% 69.01% 3 3 986.00 24.14% 91.22% 3 3 589.24 13.19% 82.19% 1 1 67.77 1.66% 92.88% 1 3 279.81 6.26% 88.46% 3 1 59.07 1.45% 94.33% 2 3 186.83 4.18% 92.64%

CORINE Land Cover 2000 – Germany
Final Report DLR-DFD 50
CLC CLC Old Federal States CLC CLC New Federal States + Berlin 1990 Le-vel1
2000 Le-vel1
Area [km²] Percentage Cumulative 1990 Le-vel1
2000 Le-vel1
Area [km²] Percentage Cumulative
2 5 51.43 1.26% 95.59% 3 1 90.29 2.02% 94.66% 1 2 49.86 1.22% 96.81% 1 5 74.29 1.66% 96.32% 1 5 29.74 0.73% 97.53% 1 2 33.32 0.75% 97.07% 2 3 21.92 0.54% 98.07% 1 1 33.14 0.74% 97.81% 3 2 18.85 0.46% 98.53% 3 2 23.89 0.53% 98.34% 1 3 13.07 0.32% 98.85% 2 5 23.49 0.53% 98.87% 4 2 12.36 0.30% 99.15% 3 5 11.21 0.25% 99.12% 4 3 9.39 0.23% 99.38% 4 2 8.53 0.19% 99.31% 4 1 5.37 0.13% 99.52% 2 4 8.09 0.18% 99.49% 2 4 5.36 0.13% 99.65% 3 4 5.95 0.13% 99.62% 3 5 3.98 0.10% 99.74% 4 5 5.27 0.12% 99.74% 4 4 3.43 0.08% 99.83% 4 3 2.56 0.06% 99.80% 3 4 2.17 0.05% 99.88% 5 4 2.52 0.06% 99.85% 5 4 1.65 0.04% 99.92% 5 3 2.13 0.05% 99.90% 5 3 1.54 0.04% 99.96% 5 2 2.08 0.05% 99.95% 5 1 0.80 0.02% 99.98% 5 1 1.07 0.02% 99.97% 5 2 0.41 0.01% 99.99% 4 1 0.89 0.02% 99.99% 4 5 0.18 0.00% 99.99% 1 4 0.33 0.01% 100.00% 5 5 0.17 0.00% 100.00% 4 4 0.00 0.00% 100.00% 1 4 0.07 0.00% 100.00% 5 5 0.00 0.00% 100.00%
While other change types are rather irrelevant in the Old Federal States, in the New Federal States the transition of artificial surfaces to forests and semi-natural area (1→3) has to be mentioned. Such a conversion seems somewhat amazing at first sight, but can however eas-ily be explained with recultivation processes of open mining areas, which is a subclass of level 1 category 1.
4.3.3 Balances of Land Use Changes between 1990 and 2000 Land use dynamics between 1990 and 2000 can be summarized as balances of the land use changes. Based on the change statistics for each CLC class, the positive and negative land use changes were summarized. Out of it, absolute and relative net changes in relation to the status 1990 could be calculated. The balances for Germany are shown in Table 27 and for the Old and the New Federal Stat-es in Table 28. Pastures (231), discontinuous urban fabric (112), industrial or commercial units (121) and transitional woodland - shrub (324) have the largest positive absolute net changes for the complete data set of Germany. The class arable land (211) has the largest absolute net loss, followed by coniferous forest (312), fruit trees and berry plantations (222), natural grassland (321) and mineral extraction sites (131) Regarding the relative net change in relation to the total area of a class in CLC1990, the class transitional woodland - shrub (324) shows the highest increase, followed by sport and leisure facilities (142) and industrial or commercial units (121). The classes fruit trees and berry plantations (222), mineral extraction sites (131) and natural grassland (321) hold the largest relative losses.
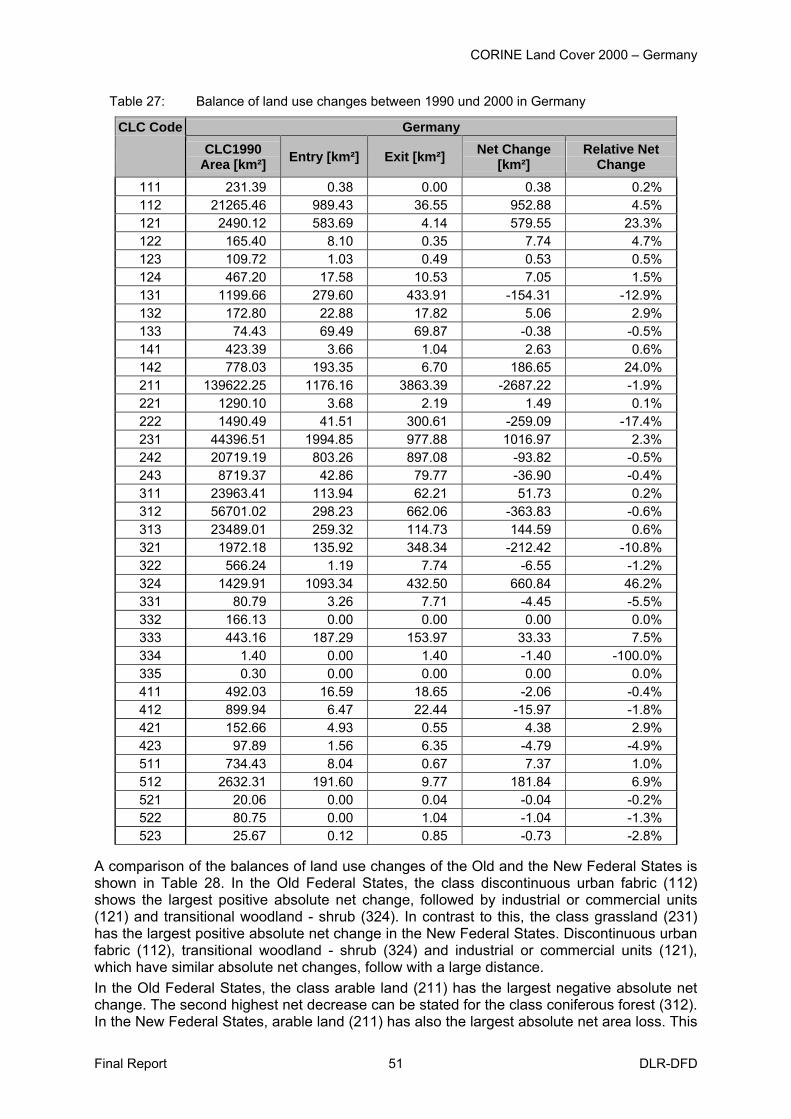
CORINE Land Cover 2000 – Germany
Final Report DLR-DFD 51
Table 27: Balance of land use changes between 1990 und 2000 in Germany
CLC Code Germany
CLC1990 Area [km²] Entry [km²] Exit [km²] Net Change
[km²] Relative Net
Change 111 231.39 0.38 0.00 0.38 0.2% 112 21265.46 989.43 36.55 952.88 4.5% 121 2490.12 583.69 4.14 579.55 23.3% 122 165.40 8.10 0.35 7.74 4.7% 123 109.72 1.03 0.49 0.53 0.5% 124 467.20 17.58 10.53 7.05 1.5% 131 1199.66 279.60 433.91 -154.31 -12.9% 132 172.80 22.88 17.82 5.06 2.9% 133 74.43 69.49 69.87 -0.38 -0.5% 141 423.39 3.66 1.04 2.63 0.6% 142 778.03 193.35 6.70 186.65 24.0% 211 139622.25 1176.16 3863.39 -2687.22 -1.9% 221 1290.10 3.68 2.19 1.49 0.1% 222 1490.49 41.51 300.61 -259.09 -17.4% 231 44396.51 1994.85 977.88 1016.97 2.3% 242 20719.19 803.26 897.08 -93.82 -0.5% 243 8719.37 42.86 79.77 -36.90 -0.4% 311 23963.41 113.94 62.21 51.73 0.2% 312 56701.02 298.23 662.06 -363.83 -0.6% 313 23489.01 259.32 114.73 144.59 0.6% 321 1972.18 135.92 348.34 -212.42 -10.8% 322 566.24 1.19 7.74 -6.55 -1.2% 324 1429.91 1093.34 432.50 660.84 46.2% 331 80.79 3.26 7.71 -4.45 -5.5% 332 166.13 0.00 0.00 0.00 0.0% 333 443.16 187.29 153.97 33.33 7.5% 334 1.40 0.00 1.40 -1.40 -100.0% 335 0.30 0.00 0.00 0.00 0.0% 411 492.03 16.59 18.65 -2.06 -0.4% 412 899.94 6.47 22.44 -15.97 -1.8% 421 152.66 4.93 0.55 4.38 2.9% 423 97.89 1.56 6.35 -4.79 -4.9% 511 734.43 8.04 0.67 7.37 1.0% 512 2632.31 191.60 9.77 181.84 6.9% 521 20.06 0.00 0.04 -0.04 -0.2% 522 80.75 0.00 1.04 -1.04 -1.3% 523 25.67 0.12 0.85 -0.73 -2.8%
A comparison of the balances of land use changes of the Old and the New Federal States is shown in Table 28. In the Old Federal States, the class discontinuous urban fabric (112) shows the largest positive absolute net change, followed by industrial or commercial units (121) and transitional woodland - shrub (324). In contrast to this, the class grassland (231) has the largest positive absolute net change in the New Federal States. Discontinuous urban fabric (112), transitional woodland - shrub (324) and industrial or commercial units (121), which have similar absolute net changes, follow with a large distance. In the Old Federal States, the class arable land (211) has the largest negative absolute net change. The second highest net decrease can be stated for the class coniferous forest (312). In the New Federal States, arable land (211) has also the largest absolute net area loss. This

CORINE Land Cover 2000 – Germany
Final Report DLR-DFD 52
decrease outweighs even the area loss of arable land in the Old Federal States. Additionally, the absolute as well as the relative area balances of the classes fruit trees and berry planta-tions (222), mineral extraction sites (131) and natural grassland (321) are highly negative in the New Federal States. The class transitional woodland - shrub (324) shows the largest positive relative net change in the Old Federal States, followed by the class sport and leisure facilities (142). It can be assumed, that this increase is mainly caused by the construction of numerous golf courses. Furthermore, industrial or commercial units (121) and mineral extractions sites (131) have comparatively high relative increases. The latter is quite remarkable, since the development of the class mineral extraction sites (131) in the Old and the New Federal States represent diametrically opposed trends. Constructions sites (133) show the highest positive relative net change in the new Federal States, which could possibly be caused by higher construction activities in certain regions of the New Federal States after the German reunion. The very high increase of industrial or commercial units (121) may also be associated with that.
Table 28: Balance of land use changes between 1990 and 2000 in the Old and the New Federal States
CLC-Code CLC1990
Area [km²]Entry [km²]
Exit [km²]
Net Change
[km²]
Relative Net
Change
CLC1990 Area [km²]
Entry [km²]
Exit [km²]
Net Change
[km²]
Relative Net
Change111 148,23 0,00 0,00 0,00 0,0% 83,16 0,38 0,00 0,38 0,5%112 15.713,75 672,92 20,74 652,17 4,2% 5.551,71 316,51 15,81 300,71 5,4%121 1.773,26 325,25 2,11 323,14 18,2% 716,87 258,44 2,03 256,41 35,8%122 114,88 5,12 0,29 4,83 4,2% 50,52 2,98 0,06 2,91 5,8%123 101,84 1,00 0,49 0,50 0,5% 7,89 0,03 0,00 0,03 0,4%124 298,10 6,30 5,93 0,37 0,1% 169,10 11,28 4,60 6,69 4,0%131 445,50 140,83 58,28 82,55 18,5% 754,16 138,77 375,63 -236,86 -31,4%132 120,71 12,63 13,05 -0,42 -0,4% 52,09 10,25 4,77 5,48 10,5%133 59,27 42,58 55,99 -13,41 -22,6% 15,16 26,91 13,88 13,03 85,9%141 321,13 3,25 0,76 2,50 0,8% 102,26 0,41 0,28 0,13 0,1%142 551,21 159,53 2,87 156,65 28,4% 226,82 33,82 3,83 29,99 13,2%211 84.206,17 399,73 1.686,74 -1.287,01 -1,5% 55.416,08 776,43 2.176,65 -1.400,22 -2,5%221 1.289,32 3,52 1,86 1,66 0,1% 0,78 0,16 0,33 -0,17 -22,3%222 1.065,17 7,28 11,87 -4,59 -0,4% 425,32 34,24 288,74 -254,50 -59,8%231 35.757,72 588,98 426,53 162,44 0,5% 8.638,79 1.405,87 551,34 854,53 9,9%242 19.865,53 569,19 670,15 -100,96 -0,5% 853,66 234,07 226,93 7,14 0,8%243 6.083,01 16,58 21,72 -5,14 -0,1% 2.636,36 26,28 58,05 -31,76 -1,2%311 18.304,22 55,79 35,15 20,64 0,1% 5.659,19 58,15 27,05 31,10 0,5%312 35.857,57 68,19 572,30 -504,10 -1,4% 20.843,45 230,04 89,76 140,28 0,7%313 20.285,29 201,79 99,09 102,70 0,5% 3.203,72 57,53 15,64 41,89 1,3%321 1.102,42 37,16 22,66 14,49 1,3% 869,76 98,76 325,67 -226,91 -26,1%322 467,96 1,09 1,42 -0,32 -0,1% 98,28 0,10 6,32 -6,22 -6,3%324 951,25 658,98 291,83 367,15 38,6% 478,66 434,35 140,67 293,68 61,4%331 62,76 3,26 2,60 0,66 1,1% 18,03 0,00 5,11 -5,11 -28,4%332 165,80 0,00 0,00 0,00 0,0% 0,34 0,00 0,00 0,00 0,0%333 264,90 5,64 45,02 -39,38 -14,9% 178,26 181,65 108,94 72,71 40,8%334 0,00 0,00 0,00 0,00 0,0% 1,40 0,00 1,40 -1,40 -100,0%335 0,30 0,00 0,00 0,00 0,0% 0,00 0,00 0,00 0,00 0,0%411 237,26 0,52 1,61 -1,09 -0,5% 254,77 16,06 17,04 -0,98 -0,4%412 895,59 5,66 22,23 -16,58 -1,9% 4,35 0,82 0,21 0,60 13,9%421 152,66 4,93 0,55 4,38 2,9% 0,00 0,00 0,00 0,00 0,0%423 97,89 1,56 6,35 -4,79 -4,9% 0,00 0,00 0,00 0,00 0,0%511 598,75 8,04 0,67 7,37 1,2% 135,68 0,00 0,00 0,00 0,0%512 1.125,59 77,34 2,00 75,34 6,7% 1.506,72 114,26 7,76 106,50 7,1%521 2,21 0,00 0,00 0,00 0,0% 17,85 0,00 0,04 -0,04 -0,2%522 80,75 0,00 1,04 -1,04 -1,3% 0,00 0,00 0,00 0,00 0,0%523 15,37 0,12 0,85 -0,73 -4,7% 10,30 0,00 0,00 0,00 0,0%
Old Federal States New Federal States + Berlin

CORINE Land Cover 2000 – Germany
Final Report DLR-DFD 53
Transitional woodland - shrub (324) and sparsely vegetated areas (333) also show high posi-tive relative net changes. Possible reasons for this dynamics were already discussed. It is a consequence of land cover conversions on former military areas and recultivations of former open mining pits. The increase of water bodies (512) could also possibly be interpreted as an effect of the recultivation. Finally, the high relative net change (+10%) of the class pastures (231) in the New Federal States has to be pointed out. This class already was the third largest land use unit in 1990.
4.3.4 Relative Changes of the Main Categories Statistics, concerning percentages of total area and relative changes from 1990 to 2000, for the main classes and selected subclasses for complete Germany and the Old and New Fed-eral States are shown in Table 29 and Table 30. The percentages of the main classes ‘artifi-cial surface’, ‘forest and semi-natural area’ and ‘water bodies’ increased. The percentages of ‘agricultural areas’ and ‘wetlands’ declined. Against the trends of their main classes, the per-centage of the subclass mineral extraction sites decreased and the percentage of the sub-class pasture increased. In order to approximate the estimates of arable land and pasture land in comparison to other surveys, e.g. area statistics, it was necessary to integrate the contributions of the heteroge-neous classes 242 and 243 in subclasses of the main classes ‘agricultural areas’ and ‘forest and semi-natural areas’. Hence, the simple assumption was made, that in the heterogeneous class 242 an overall contribution of 50 % arable land and 50 % pasture land was assumed. Additionally, for the class 243 an overall contribution of one third arable land, one third pas-ture land and one third woodland was assumed, thus one third forested areas of class 243 are regarded in the category ‘forest and transitional woodland - shrub’ (see Table 29).
Table 29: Percentage and relative change between 1990 and 2000 of selected classes in Germany
Category Germany CLC1990 rev CLC2000 relative change
Artificial Surfaces (1xx) 7.66% 8.10% 5.80% Urban Fabric, Industrial- and Commercial Units (11x + 121) 6.71% 7.14% 6.39%
Mineral Extraction Sites (131) 0.34% 0.29% -12.86% Agricultural Areas (2xx) 60.48% 59.90% -0.95% Arable Land (211 + 0,33*243 + 0,5*242) 42.75% 41.98% -1.80% Pastures (231 + 0,33*243 + 0,5*242) 16.12% 16.39% 1.66% Forest and Semi-natural Area (3xx) 30.43% 30.52% 0.28% Forest and Transitional Woodland-Scrub (31x + 324 + 0,33*243) 30.33% 30.47% 0.44%
Wetland (4xx) 0.46% 0.45% -1.12% Water Bodies (5xx) 0.98% 1.03% 5.36%
Comparing the statistics for the main classes and selected subclasses for the Old and the New Federal States (see Table 30), the following statements can be made:
• The main class artificial surface and in particular the subclass urban fabric, industrial- and commercial units hold a higher percentage in the Old Federal States both in 1990 and 2000. However the growth rate for the subclass urban fabric, industrial- and commercial units is clearly higher in the new Federal States.
• The percentage of mineral extraction sites is substantially higher in the New Federal States both in 1990 and 2000, but has decreased here by nearly one third, in com-parison to an increase of 18% in the Old Federal States.

CORINE Land Cover 2000 – Germany
Final Report DLR-DFD 54
• The percentage of agricultural areas is slightly higher in the New Federal States, and decreases both in the Old and the New Federal States. However the structure of the agricultural areas has significant differences. The percentage of pastures in the Old Federal States is about twice as high with a very slight increase. In the New Federal States, the percentage of pastures has increased heavily.
• The percentage of the class forest and transitional woodland - shrub extended by one third of the area of 243 (land principally occupied by agriculture, with significant areas of natural vegetation) is slightly higher in the Old Federal States. In the New Federal States, the percentage of this class has increased slightly.
• The percentage of wetlands is as twice as high, but has a higher decrease in the Old Federal States.
• The percentage of water bodies is more as twice as high and has a higher increase in the New Federal States, which is - amongst others - an effect of the recultivation processes of open mining areas.
Table 30: Percentage and relative change between 1990 and 2000 of selected classes in the Old and the New Federal States
Category Old Federal States New Federal States + Berlin CLC1990
rev CLC2000 relative
change CLC1990
rev CLC2000 relative
change Artificial Surfaces (1xx) 7.90% 8.39% 6.15% 7.09% 7.44% 4.90% Urban Fabric, Industrial- and Commercial Units (11x + 121) 7.09% 7.49% 5.53% 5.83% 6.34% 8.78%
Mineral Extraction Sites (131) 0.18% 0.21% 18.53% 0.69% 0.47% -31.41% Agricultural Areas (2xx) 59.64% 59.15% -0.83% 62.37% 61.61% -1.21% Arable Land (211 + 0,33*243 + 0,5*242) 38.68% 38.14% -1.39% 52.04% 50.75% -2.48%
Pastures (231 + 0,33*243 + 0,5*242) 19.19% 19.23% 0.23% 9.12% 9.89% 8.53%
Forest and Semi-natural Area (3xx) 31.16% 31.15% -0.05% 28.77% 29.08% 1.08%
Forest and Transitional Woodland-Scrub (31x + 324 + 0,33*243)
31.14% 31.13% -0.02% 28.50% 28.95% 1.60%
Wetland (4xx) 0.56% 0.55% -1.31% 0.24% 0.24% -0.14% Water Bodies (5xx) 0.73% 0.77% 4.44% 1.53% 1.63% 6.37%
As a final remark to the statistical analysis, it can be stated that the different regional devel-opment trends of Old and New Federal States are represented in the CORINE Land Cover data.

CORINE Land Cover 2000 – Germany
Final Report DLR-DFD 55
5 Conclusions and Lessons Learnt In the German project ‘CORINE Land Cover 2000’ an updated survey of land cover and land use was provided for Germany according to a European-wide co-ordinated classification key, which was applied in 30 European states up to now. Thus a comparable data base on land cover in Europe was developed, which forms a basis of evaluation in many tasks of environ-mental and regional policy. During the update of land cover and land use based on satellite data, the integration of re-gional expertise proved to be very important, significant was also the experience with the CLC nomenclature of the companies involved. By the improved data basis of the ortho-rectified Landsat 7 data and the geometrical adjust-ment of the data of 1990 the quality of mapping could be strongly improved in relation to the primary survey. In order to derive significant data products regarding the changes, partially extensive corrections of the data set CLC1990 were necessary, which was not to be fore-seen to this extent at the beginning of the project. In addition, an adjustment of several map-ping instructions became necessary in the European context in relation to the German pri-mary assessment. This led to further correction steps in the data set of 1990 (e.g. regarding the delineation of ribbon-built villages). The qualitatively better data of the Landsat 7 with the additional panchromatic band made it possible to include many improvements also in the data record CLC1990_rev. The intensive use of multi-temporal and multi-seasonal data sets helped during the often difficult delinea-tion of the agricultural classes (arable land, meadows and pastures, complex structures of allotments). That was possible by the integration of overlapping neighbouring scenes and by using additional satellite data sets. Various examples and the discussion of the statistical analysis showed that many trends in the development of land use and land cover are reflected in the CORINE Land Cover classes. It was pointed out that the results can not be compared directly with statistical regis-trations because of the performed generalisation in the CLC interpretation. As consequence of the different minimal mapping units of 25 hectares in the data sets of CLC1990 and CLC2000 and of 5 hectares for the changes, often a generalization of mapping was necessary. The two different minimum mapping units led in some situations to problem-atic conversions and thus caused technical changes (with an auxiliary attribute marked), which did not correspond to real changes. More influence on the estimation of land cover trends and their statistics will have new developed polygons with sizes between 5 ha and 25 ha (isolated polygons), which were not included by the mapping guidelines of EEA. During the CLC user workshops in Berlin in January 2004, the use of the CLC inventory be-came obvious in particular in the trans-national context, for modelling in water catchments or modelling of air pollution. On the other hand, the requirements for improved products (con-cerning thematic as well as spatial resolution) became evident for a number of national or supra-regional objectives. These requirements were summarized in a table in the proceed-ings of the workshop. Primarily the demand for higher dissolved products of artificial surfaces turned out, minimum mapping sizes between 1 and 5 hectares were discussed. Connected with this is a finer thematic subdivision regarding the sealing degree, at least with a further sealing stage between 20 and 50 %. This enhanced mapping should be done then as a re-fined CORINE Land Cover survey of level 4 or 5.

CORINE Land Cover 2000 – Germany
Final Report DLR-DFD 56
6 References BLASCHKE, T. (2000): Objektextraktion und regelbasierte Klassifikation von Fernerkun-
dungsdaten: Neue Möglichkeiten für GIS-Anwender und Planer. Tagungsband 5. Sym-posium Computergestützte Raumplanung - CORP2000, 16.-18.2.2000, Wien. http://213.47.127.15/corp/archiv/papers/2000/CORP2000_blaschke.pdf
BOSSARD, M., FERANEC, J. and OTAHEL, J. (2000): CORINE Land Cover Technical Guide – Addendum 2000. Technical Report 40, EEA, Copenhagen.
BÜTTNER, G. & FERANEC, J. (2004): CLC2000 3rd Verification in Germany. Verification Mission Report 52/2004. ETC-TE, Barcelona, Spain.
CHRISTENSEN, S., JAFFRAIN, F., FERANEC, J. & BÜTTNER, G. (2002): CLC2000 Verifi-cation Mission Report GERMANY (Oberpfaffenhofen – Munich), 29th – 31st October 2002. Verification Mission Report 01/2002. ETC-TE, Barcelona, Spain.
DEGGAU, M., H. STRALLA, A. WIRTHMANN (1998): Klassifizierung von Satellitendaten (CORINE Land Cover), Endbericht zum Forschungsprojekt UFOPLAN 291 91 055/00, Statistisches Bundesamt, Wiesbaden, Dezember 1998.
DE KOK, R., T. WEVER, R. FOCKELMANN (2003): Analysis of Urban Structure and Devel-opment Applying Procedures for Automatic Mapping of Large Area Data. In: Carstens, J. (Ed.): Proceedings of the ISPRS WG VII / 4 Symposium. Remote Sensing of Urban Areas 2003, pp. 41-45.
EU (1994): CORINE Land Cover - Technical Guide (Red Book); EU, Brussels.
EEA and ETC-TE (2002): CORINE Land Cover update I&CLC2000 project. Technical Guide-lines. Final Version. EEA, Copenhagen.
EEA (2002): Towards an urban atlas - Assessment of spatial data on 25 European cities and urban areas. European Environmental Agency, Environmental issue report No. 30, Co-penhagen.
ESCH, TH., A. ROTH, G. STRUNZ & S. DECH (2003): Object-oriented classification of Landsat 7 data for regional planning purposes. In: Carstens, J. (Ed.): Proceedings of the ISPRS WG VII / 4 Symposium. Remote Sensing of Urban Areas 2003, pp. 50-55.
FERANEC, J., SURI, M., OTAHEL, J., CEBECAUER, T., KOLAR, J., SOUKUP, T., ZDENK-OVA, D., WASZMUTH, J., VAJDEA, V., VIJDEA, A., NITICA, C. (2000): Inventory of major landscape changes in the Czech Republic, Hungary, Romania and Slovak Re-public 1970s – 1990s. International Journal of Applied Earth Observation and Geoin-formation, 2, pp. 129-139.
HEYMANN, Y., STEENMANS, CH., CROISSILLE, G., BOSSARD, M. (1994): CORINE Land Cover. Technical Guide. Luxembourg (Office for Official Publications of the European Communities).
JAFFRAIN, G., J. FERANEC, G. BÜTTNER, S. CHRISTENSEN & E.EVRARD (2002): CLC2000 Training Report, Germany, 5th February 02 – 8th February 02. Training Mis-sion Report 01/2002. ETC-TE, Barcelona, Spain.
JAFFRAIN, G., MARI, L. (2003): CLC2000 2nd Verification in Germany. Verification Mission Report 30/2003. ETC-TE, Barcelona, Spain.
KEIL, M., MOHAUPT-JAHR, B., KIEFL, R., STRUNZ, G. (2002): Das Projekt CORINE Land Cover 2000 in Deutschland. In: S. Dech et al. (Hrsg.): Tagungsband 19. DFD-Nutzerseminar, 15. - 16. Oktober 2002, S. 95-104.
KEIL, M., MOHAUPT-JAHR, B., KIEFL, R., STRUNZ, G. (2003): Update of the CORINE Land Cover Base in Germany. In: Carstens, J. (Ed.): Proceedings of the ISPRS WG VII / 4 Symposium. Remote Sensing of Urban Areas 2003, pp. 72-77.

CORINE Land Cover 2000 – Germany
Final Report DLR-DFD 57
KEIL, M., KIEFL, R., STRUNZ, G., MEHL, H., MOHAUPT-JAHR, B. (2004): Examples and experiences of the update interpretation process for CLC2000 in Germany. Proceed-ings CORINE Land Cover Workshop, 20-21 January 2004, Berlin. UBA-Texte 04/04, pp. 52-61.
KIEFL, R., KEIL, M., STRUNZ, G., MEHL, H., MOHAUPT-JAHR, B. (2003): CORINE Land Cover 2000 - Stand des Teilprojektes in Deutschland. In: J. Strobl, T. Blaschke, G. Griesebner (Hrsg.): Angewandte Geographische Informationsverarbeitung XV, Beiträ-ge zum AGIT-Symposium Salzburg 2003, Wichmann Verlag, Heidelberg, S. 202-207.
KLEESCHULTE, S., BÜTTNER, G. (2004): Coordination and technical implementation of CLC2000. In: Workshop CORINE Land Cover 2000 in Germany and Europe and its use for environmental applications, 20-21 January 2004, Berlin, UBA Texte 04/04, pp. 46-51.
MEINEL, G. & J. HENNERSDORF (2002): Classification Systems of Land Cover and Land Use and Their Challenges for Picture Processing of Remote Sensing Data. Proceed-ings of the third International Symposium Remote Sensing of Urban Areas, 11-13 June 2002, Istanbul, pp. 472-479.
MOHAUPT-JAHR, B., KEIL, M. (2004): The CLC2000 project in Germany and environmental application of land use information. Proceedings CORINE Land Cover Workshop, 20-21 January 2004, Berlin, UBA-Texte 04/04, pp. 37-45.
PERDIGÃO, V., ANNONI, A. (1997): Technical and Methodological Guide for Updating CORINE Land Cover Data Base. Luxembourg (JRC and EEA).
STABA (2003): Statistische Ämter des Bundes (StaBa) und der Länder (Hrsg.): Statistik re-gional, Daten für die Kreise und kreisfreien Städte Deutschlands. CD-ROM, Ausgabe 2002, Wiesbaden.
STEENMANS, C., GHEORGHE, A. (2004): European perspective on the joint I&CLC2000 project. In: Workshop CORINE Land Cover 2000 in Germany and Europe and its use for environmental applications, 20-21 January 2004, Berlin, UBA Texte 04/04, pp. 31-36.
STEINNOCHER, K. (1997): Texturanalyse zur Detektion von Siedlungsgebieten in hochauf-lösenden panchromatischen Satellitenbilddaten. In: Dollinger, F. & Strobl, J. (Hrsg.): Angewandte Geographische Informationsverarbeitung IX, Salzburger Geographische Materialien, Bd. 26, S. 143-152.
UBA (2004): Workshop CORINE Land Cover 2000 in Germany and Europe and its use for environmental applications, 20-21 January 2004, Berlin, Proceedings, UBA Texte 04/04.

CORINE Land Cover 2000 – Germany
Final Report DLR-DFD 58
Annex 1: Main Tasks and Responsible Persons
No Task Subtask Position / expertise Responsible(s) 1 IMAGE2000 (input provided by national team) 1.1 Internal quality control of
ortho-correction, improving IMAGE90 data, selecting ancillary satellite data
Image processing experts Manfred Keil Ralph Kiefl
2 Geometric Adaptation of CLC1990 2.1 Adaptation of CLC1990 to
ortho-rectified IMAGE2000 GIS experts Ralph Kiefl
Nadine Schmidt Frank Wojciechowski Brigitte Jöhl
2.2 Quality control Leading GIS expert Ralph Kiefl 3 Mapping land cover and land cover changes 3.1 Revision / Correction
CLC1990, interpretation of CLC2000 and changes, field checks
Leading photo interpreters
Photo interpreters
Regine Richter (GAF) Susanne Meirich (ITD) Carsten Haub (EFTAS)
Andrea Blümel (GAF) Karin Eichler (GAF) Monika Kuba (GAF) Claudius Heibl (GAF) Elke Krätzschmar (HUGIN) Matthias Wollmann (HUGIN) D. Heinrich (HUGIN) Stefan Gläßer (HUGIN) Dirk Lindemann (EFTAS) Claudia Lücke (EFTAS)
3.2 Database integration (corrected CLC1990, CLC2000, CLC_Changes)
Leading GIS expert Ralph Kiefl
4 Quality control / quality assurance, metadata 4.1 Thematic QC / QA of
interpretation sheets Project manager / photo interpreter
Leading photo interpreters
Manfred Keil Uta Heiden
Regine Richter (GAF) Susanne Meirich (ITD) Carsten Haub (EFTAS)
4.2 Technical QC / QA of data bases
GIS experts Ralph Kiefl
Horst Ringenberg (GAF) Regin Lippold (Delphi IMM) Georg Altrogge (EFTAS)
4.3 Metadata Photo interpreters
Project manager GIS experts
See 3.1
Manfred Keil Uta Heiden Ralph Kiefl
4.4 Final acceptance Project manager Manfred Keil
Regine Richter (GAF) Hanjo Kahapka (ITD) Carsten Haub (EFTAS)
5 Product generation and data dissemination 5.1 Product generation Leading GIS expert Ralph Kiefl 5.2 Data dissemination Project manager /
Leading GIS expert Manfred Keil Ralph Kiefl
6 Management 6.1 National project coordination Coordinator Birgit Mohaupt-Jahr (UBA) 6.2 National project management Project manager Manfred Keil 6.3 National Steering Committee Steering Committee
members Birgit Mohaupt-Jahr (UBA) Hartmut Streuff (BMU) Günter Strunz (DLR)

CORINE Land Cover 2000 – Germany
Final Report DLR-DFD 59
Annex 2: Parameter for Projections and Datum of CLC Germany GK3: Projection TRANSVERSE Datum USER_DEFINED 586.000 87.000 409.000 -0.5200 -0.1500 2.8200 1.0090 (equal to Potsdam / Rauenberg in ERDAS Imagine) Zunits NO Units METERS Spheroid BESSEL Xshift 0.0000000000 Yshift 0.0000000000 Parameters 1.00000000 /* scale factor at central meridian 9 0 0.000 /* longitude of central meridian 0 0 0.000 /* latitude of origin 3500000.00000 /* false easting (meters) 0.00000 /* false northing (meters) GK4: Projection TRANSVERSE Datum USER_DEFINED 586.000 87.000 409.000 -0.5200 -0.1500 2.8200 1.0090 (equal to Potsdam / Rauenberg in ERDAS Imagine) Zunits NO Units METERS Spheroid BESSEL Xshift 0.0000000000 Yshift 0.0000000000 Parameters 1.00000000 /* scale factor at central meridian 12 0 0.000 /* longitude of central meridian 0 0 0.000 /* latitude of origin 4500000.00000 /* false easting (meters) 0.00000 /* false northing (meters) UTM32: Projection UTM Zone 32 Datum WGS84 Zunits NO Units METERS Spheroid WGS84 Xshift 0.0000000000 Yshift 0.0000000000 Parameters 0.99960000000 /* scale factor at central meridian 9 0 0.000 /* longitude of central meridian 0 0 0.000 /* latitude of origin 500000.00000 /* false easting (meters) 0.00000 /* false northing (meters)

CORINE Land Cover 2000 – Germany
Final Report DLR-DFD 60
Annex 3: Priority Table
111
112
121
122
123
124
131
132
133
141
142
211
212
213
221
222
223
231
241
242
243
244
311
312
313
321
322
323
324
331
332
333
334
335
411
412
421
422
423
111
11
11
11
11
11
33
33
33
32
23
44
44
44
44
44
44
45
55
55
112
11
11
11
11
11
33
33
33
32
23
44
44
44
44
44
44
45
55
55
121
33
11
12
22
44
66
66
66
65
56
77
77
77
77
77
77
78
88
88
122
22
11
13
33
33
44
44
44
44
44
44
44
44
44
44
44
45
55
55
123
33
11
12
22
44
55
55
55
55
55
55
55
55
55
55
55
56
66
66
124
33
11
14
44
22
66
66
66
56
56
66
66
66
66
66
66
67
77
77
131
33
22
33
11
44
77
77
77
77
77
77
77
77
77
77
77
76
68
88
132
33
22
33
31
44
77
77
77
77
77
77
77
77
77
77
77
76
68
88
133
11
11
11
22
22
33
33
33
33
33
33
33
33
33
33
33
33
33
33
141
32
33
33
33
31
77
77
77
77
75
54
44
44
44
77
77
77
77
77
142
32
33
33
33
31
55
55
55
55
55
55
55
55
55
55
55
55
55
55
211
55
55
55
55
55
51
14
44
32
22
26
66
66
66
66
66
66
66
66
212
55
55
55
55
55
51
14
44
32
22
26
66
66
66
66
66
66
66
66
213
55
55
55
55
55
51
14
44
32
22
26
66
66
66
66
66
66
66
66
221
44
55
55
55
55
53
33
11
32
22
25
55
44
44
44
44
66
66
66
222
55
66
66
66
66
63
33
11
32
22
24
44
65
55
66
66
77
77
77
223
55
66
66
66
66
63
33
11
32
22
24
44
65
55
66
66
77
77
77
231
65
66
65
66
64
42
22
33
31
11
17
77
46
66
55
55
84
44
77
241
32
33
33
33
33
31
11
11
11
11
13
33
33
33
33
33
44
44
44
242
32
33
33
33
33
31
11
11
11
11
13
33
33
33
33
33
44
44
44
243
43
44
44
44
44
42
22
22
22
11
13
33
33
33
33
33
33
33
33
244
43
44
44
44
44
42
22
22
22
11
13
33
44
44
44
44
55
55
55
311
77
77
77
77
73
37
77
76
67
66
33
21
54
44
55
55
86
66
88
312
77
77
77
77
73
37
77
76
67
66
33
21
54
44
55
55
86
66
88
313
77
77
77
77
73
37
77
76
67
66
23
11
54
44
55
55
86
66
88
321
88
88
88
88
83
37
77
77
75
66
26
44
41
11
33
33
84
44
94
322
66
66
66
66
63
35
55
44
45
55
24
33
32
11
33
33
82
24
74
323
66
66
66
66
63
35
55
44
45
55
24
33
32
11
33
33
82
24
74
324
66
66
66
66
63
35
55
44
45
55
24
11
11
11
22
22
83
34
74
331
66
66
66
66
63
35
55
55
55
55
25
44
42
23
31
11
14
42
42
332
55
55
55
33
34
44
44
34
44
44
24
33
32
22
21
11
14
44
44
333
66
66
66
66
63
35
55
55
54
55
25
33
32
22
21
11
14
44
44
334
77
77
77
77
74
45
66
54
45
55
33
22
22
22
21
11
86
26
66
335
88
88
88
88
88
58
88
88
88
88
88
66
64
57
61
11
74
45
55
411
77
77
77
77
77
76
66
66
65
66
26
44
44
44
44
44
53
12
22
412
77
77
77
77
77
76
66
66
65
66
26
44
44
44
44
44
53
12
22
421
88
88
88
88
88
87
77
77
74
77
47
77
74
66
65
55
88
33
11
422
66
56
66
66
66
66
66
66
66
66
66
66
66
66
66
66
77
23
11
423
66
66
56
66
66
66
66
66
66
66
66
66
66
66
66
66
77
44
11
511
55
55
55
55
55
55
55
55
55
55
45
55
55
55
52
55
66
44
33
351
25
55
55
52
55
44
55
55
55
55
53
55
55
55
55
35
56
63
33
33
521
55
55
45
55
55
55
55
55
55
55
35
55
55
55
55
55
66
44
33
352
26
66
65
66
66
55
66
66
66
66
63
66
66
66
66
66
67
74
43
33
523
66
66
56
66
65
56
66
66
66
66
36
66
66
66
66
66
77
44
33
3
code
s of
nei
ghbo
urin
g po
lygo
n >
25 h
aunit<25ha
Remark: 1 is the highest priority, larger numbers indicate lower priority (source: EEA and ETC-TE, 2002)

CORINE Land Cover 2000 – Germany
Final Report DLR-DFD 61
Annex 4: Adaptation of CLC Nomenclature 1990 / 2000 in Germany Based on documents of the 2nd training meeting at DLR Oberpfaffenhofen, February, 5th – February, 7th 2002 and further discussions with technical team of ETC-TE
Objects Definition in German CLC1990 in (StBA, 1996)
Definition for CLC2000 (BOSSARD et al, 2000) and outlines for use in
Germany
Residential discontinuous urban fabric
Ribbon-built villages 112 / 2xx
Ribbon-built villages (‘Straßendörfer’ and ‘Hufendörfer’) in a width of 100 m are registered if the gaps between the buildings are below 100m (StBA, 1996)
Small discontinuous urban fabric areas less than 25 ha are grouped together, if the distance between each of them is less than 300 m in order to reach 25 ha. The exterior contour line leans on road network (BOSSARD ET AL., 2000) If equal / similar extension in 1990: use polygon of 2000 and assign 112 in 1990 as well If increased polygon area (change): Indicate change by polygons to 1990 status (if extension > 25 ha in 1990). If extension in 1990 below 25 ha: keep old assignment but mark by a flag (NRCH=1) that no real change in full extent happened to CLC2000.
University areas / hospitals etc. 112 / 121
Function of living is dominant, uni-versity areas and military living buildings and administration build-ings are included in 112. Military objects with non-residential use are in class 121. (StBA, 1996)
Hospitals, universities, schools are included in 121 (BOSSARD et al, 2000). Delineate obvious big complex areas of universities / hospitals stable in 1990 / 2000 to 121 (detailed differentiation not possible), focus on changes.
Large blocks of flats, with green spaces be-tween 111 / 112
Typical for 112: one-family houses and ribbon buildings; large blocks with large green between buildings in 112, with small green in 111, no-tice sealing value 80% (StBA, 1996)
Large blocks of flats, where green spaces, parking areas and adventure playgrounds cover significant surface area, to 112 (BOSSARD et al, 2000)
Road and rail networks and associated land
Road and rail net-works 122 / 121
122 consists mainly of: railway sta-tions and marshalling yards, motor way crossings, parking areas (no info on priorities) (StBA, 1996)
Railways have a higher priority than urban fabric does, roads have a lower priority (BOSSARD et al, 2000)

CORINE Land Cover 2000 – Germany
Final Report DLR-DFD 62
Objects Definition in German CLC1990 in (StBA, 1996)
Definition for CLC2000 (BOSSARD et al, 2000) and outlines for use in
Germany
Airports
Sport airports will be classified as 124, if airport infrastructure (fortified runways, passenger terminals, halls, etc.) is visible (BOSSARD et al, 2000)
Sport airports 124 / 142
Sport airports with asphalted run-ways in 124; without asphalted run-ways, when they can be detected in the satellite imagery (StBA, 1996)
Small airfields are to be classified as 142, if airport infrastructure is not visible (BOSSARD et al, 2000)
Sport and leisure facility
Allotment gardens 142 / 242
Allotment gardens: Camping, sports fields, sport stadium, leisure parks, public parks out of urban ar-eas, as well as allotment gardens, in 142 (StBA, 1996)
Allotment gardens: Contribution due to major use (142 if mainly leisure facility, 242 if mainly used for vegetable / fruit production) (BOSSARD et al, 2000)
Mineral extraction sites
Mineral extraction sites / artificial lakes 131 / 512
Artificial lakes by extraction („Bag-gerseen“) are completely registered as mineral extraction sites if on the biggest part of the area an active extraction of gravel or sand can be recognized (no limitation in size) (StBA, 1996)
In CLC2000, delineate and assign min-eral extraction sites and artificial lakes due to their area portions (BOS-SARD et al, 2000) Adapt in 1990. Remain assignment to 131 in CLC1990, unless water domi-nates (~ 80 - 90%).
Non-irrigated arable land / Fruit trees and berry plantations / Vineyards
Hop plantations 211 / 222
Hop plantations are registered as arable land (StBA, 1996)
Hop plantations: To be integrated in 222 if > 25 ha (BOSSARD ET AL., 2000). To be checked which additional informa-tion available.
Nursery gardens of fruit trees and shrubs
Nursery gardens if detectable as fruit trees nurseries: 222, if uncertain / mixed: 211 (BOSSARD et al, 2000).
Nursery gardens of wine and fruit trees 222 / 221 / 211
wine-growing nurseries
If detectable as wine-growing nurser-ies: 221, if uncertain / mixed: 211 (BOS-SARD et al, 2000)

CORINE Land Cover 2000 – Germany
Final Report DLR-DFD 63
Objects Definition in German CLC1990 in (StBA, 1996)
Definition for CLC2000 (BOSSARD et al, 2000) and outlines for use in
Germany
Transitional woodland and shrub
Transitional wood-land, shrub 324
Transitional Woodland 324 was used not in transient states in for-estry, but mainly for shrub areas with single trees or tree groups to be find on: - Uncultivated former vineyards - Military training areas - Fallow land of former track sys-
tems, industrial areas, extraction sites, deposits
- Woodland areas near the timber-line with high portions of shrub
- Areas strongly affected by forest decline (totally tree-less areas were mainly assigned to 322) (StBA, 1996)
Transitional woodland / shrub for - Clear cuts in forest areas, - Young plantations, - Heavily damaged forests by wind,
snow-brake or acid rains and other pol-lution with more than 50% dead trees (BOSSARD et al, 2000)
In CLC2000: Delineate large forest ar-eas heavily destructed (e.g. by storm) as 324. Integrate large young reforestation and afforestation in 324, especially on former non-forest areas (former military areas). Prefer 324 instead of 322 for mixed vegetation cover. In CLC90: Integrate status also in CLC1990, especially for large areas and for transient states of former non-forest areas (e.g. former military areas).
Water bodies
Groups of small lakes 512
Water body 512 if > 25 ha and mostly width > 100 m (StBA, 1996)
Groups of small lakes: if >75% of the polygon is free water, distance < 300 m , combine to 512 (BOSSARD et al, 2000)
Sea and Ocean / Islands
Groups of small islands 523
No comments on islands in (StBA, 1996)
Groups of small islands: if >75% of the polygon is land, distance < 300 m (BOSSARD et al, 2000), otherwise 523
StBA (1996): Statistisches Bundesamt, CLC Datenerhebungsanleitung, 1.9.1996.
BOSSARD et al (2000): EEA, Corine land cover technical guide Addendum 2000, May 2000.

CORINE Land Cover 2000 – Germany
Final Report DLR-DFD 64
Annex 5: Description of Vector Data Structure of the Arc Attribute Table (AAT) Name Type Width Description FNODE# Bin 4 ID of from-node TNODE Bin 4 ID of to-nodes LPOLY# Bin 4 ID of left polygon RPOLY# Bin 4 ID of right polygon LENGTH Float 8 Length of arc segment in m COVER_# Bin 4 Arc auto-Id COVER_ID Integer 4 Arc user-Id LS Integer 1 Type of arc:
1. border between land use classes 2. Sheet line of TK100 3. Administrative boundary of Germany (incl. buffer)
Structure of the Polygon Attribute Table (PAT) Name Type Width Description Area Float 8 Area in m² Perimeter Float 8 Perimeter in m Cover_# Bin 4 Polygon auto-Id Cover_ID Bin 4 Polygon user-Id TKNR Character 6 Code of map sheet TK100 (e.g.
C4310) CODE1990 Integer 3 Land use code 1990 CODE2000 Integer 3 Land use code 2000 CHANGE Character 8 For land use change polygons this field
contains a string following the scheme Code1990 Code2000
NRCH Integer 1 Changed areas without a real change get the value 1. On the one hand this could mark a polygon having a change due to generalisation for maintaining the minimum mapping units. At the other hand it could label a poly-gon which had a share of the new land cover already in 1990, but did not fulfil the minimum mapping unit of 25 ha in 1990.

CORINE Land Cover 2000 – Germany
Final Report DLR-DFD 65
Annex 6: CLC2000 Metadata on Country Level for Germany 1 LITERATURE, REPORTS
1.1 List of literature.
EEA and ETC-TE (2002): CORINE Land Cover update I&CLC2000 project. Technical Guidelines. Final Version. EEA, Denmark. BOSSARD, M., FERANEC, J. and OTAHEL, J. (2000): CORINE Land Cover Technical Guide – Addendum 2000. Technical Report 40, EEA, Denmark. JAFFRAIN, G., J.FERANEC, G. BÜTTNER, S. CHRISTEN-SEN & E.EVRARD (2002): CLC2000 Training Report, Ger-many, 5th February 02 – 8th February 02. Training Mission Report 01/2002. ETC-TE, Barcelona, Spain. CHRISTENSEN, S., JAFFRAIN, F., FERANEC, J. & BÜTT-NER, G. (2002): CLC2000 Verification Mission Report GERMANY (Oberpfaffenhofen – Munich), 29th – 31st October 2002. Verification Mission Report 01/2002. ETC-TE, Barce-lona, Spain. JAFFRAIN, G., MARI, L. (2003): CLC2000 2nd Verification in Germany. Verification Mission Report 30/2003. ETC-TE, Barcelona, Spain. BÜTTNER, G. & FERANEC, J. (2004): CLC2000 3rd Verifi-cation in Germany. Verification Mission Report 52/2004. ETC-TE, Barcelona, Spain. KEIL, M., MOHAUPT-JAHR, B., KIEFL, R., STRUNZ, G. (2003): Update of the CORINE Land Cover Base in Ger-many. Proceedings Fourth International Symposium ‘Re-mote Sensing of Urban Areas’, 27-29 June 2003, Regensburg (Germany). MOHAUPT-JAHR, B., KEIL, M. (2004): The CLC2000 pro-ject in Germany and environmental application of land use information. Proceedings CORINE Land Cover Workshop, 20-21 January 2004, Berlin, p. 37-45. UBA-Texte 04/04, Berlin. KEIL, M., KIEFL, R., STRUNZ, G., MEHL, H., MOHAUPT-JAHR, B. (2004): Examples and experiences of the update interpretation process for CLC2000 in Germany. Proceed-ings CORINE Land Cover Workshop, 20-21 January 2004, Berlin, p. 52-61. UBA-Texte 04/04, Berlin.
2. NATIONAL PROJECT DESCRIPTION
2.1 General Info (Objectives, Goals, National Specifics, Comments For User)
The overall aim of CORINE land cover in Germany was to produce an updated data base for the year 2000 (+/- 1 year) and to deduce the changes between 2000 and the primary assessment of 1990. Besides the data sets CLC2000 and CLC_Changes a re-vised CLC1990 data set was produces for Germany. The data base has to fulfil the EU wide specifications defined by the technical team to guarantee a maximum consistency in Europe. The CLC products are to assist national and EU wide planning and modelling tasks for environmental protec-tion and sustainable land management.
2.2 Project Organisation, Organisation Chart
DLR Oberpfaffenhofen German Remote Sensing Data Center (DFD) D-82230 Wessling

CORINE Land Cover 2000 – Germany
Final Report DLR-DFD 66
on behalf of the Federal Environmental Agency (UBA), D-14191 Berlin.
2.3 Funding European Union, Federal Environmental Agency (UBA) – Federal Ministry for the Environment, Nature Conservation and Nuclear Safety (BMU)
2.4 National Team – List of Subcontrac-tors
EFTAS, D-48145 Münster GAF AG, D-80634 München Infoterra GmbH, D-88090 Immenstaad,
in cooperation with - Delphi IMM, D-14469 Potsdam - Hugin GmbH, D-07743 Jena
2.5 Validation Team European Topic Center for Terrestrial Environment
2.6 Time Schedule June 2001 – December 2004
2.7 Hardware PC, UNIX WS
2.8 Software ArcInfo, ArcView, ERDAS Imagine
3 IMAGE 2000 (Image2000 team)
Image Identification Dataset Title <Path/row/set/type combination>
Acquisition Date, Path, Row, Set, Type, Scene coords
Ortho-rectification Method, Who, GCP number, RMSEx, RMSEy, overall RMSEp
Image enhancement Used SW, Who, Filtering, Merging, Composition
Quality control Procedure description, Who, Date, Results, External geome-try quality
4. DATA DESCRIPTION
4.1 Metadata Reference
4.1.1. National identifier for the Dataset CLC2000_METADATA_DE
4.1.2. Contact
DLR Oberpfaffenhofen, German Remote Sensing Data Center (DFD) D-82230 Wessling http://corine.dfd.dlr.de
4.1.3. Last Metadata Update Date 12/21/2004
4.2 General Information
4.2.1. Dataset Title CLC2000 (CORINE Land Cover 2000) of Germany
4.2.2. Abstract Describing Dataset
The Land Cover data set CLC2000 contains land cover data for Germany in the year 2000 (+/- 1 year) and is mainly based on satellite data of Landsat 7 ETM+. The data base was created as an update of the CLC1990 data base of Germany. The data sets have to fulfil the standards of the EU concerning CORINE Land Cover (in thematic and geo-metric conditions). The EU CLC2000 data base will be an instrument in implementing and monitoring EU environ-mental policies.
4.2.3. Dataset Topic Category Land Cover, Land Use, CORINE, CLC2000, I&CLC2000, change detection, monitoring, 1:100000, 37 land cover classes
4.2.4. Spatial Data Format ArcInfo export files e00
4.2.5. Dataset Scale 1:100000
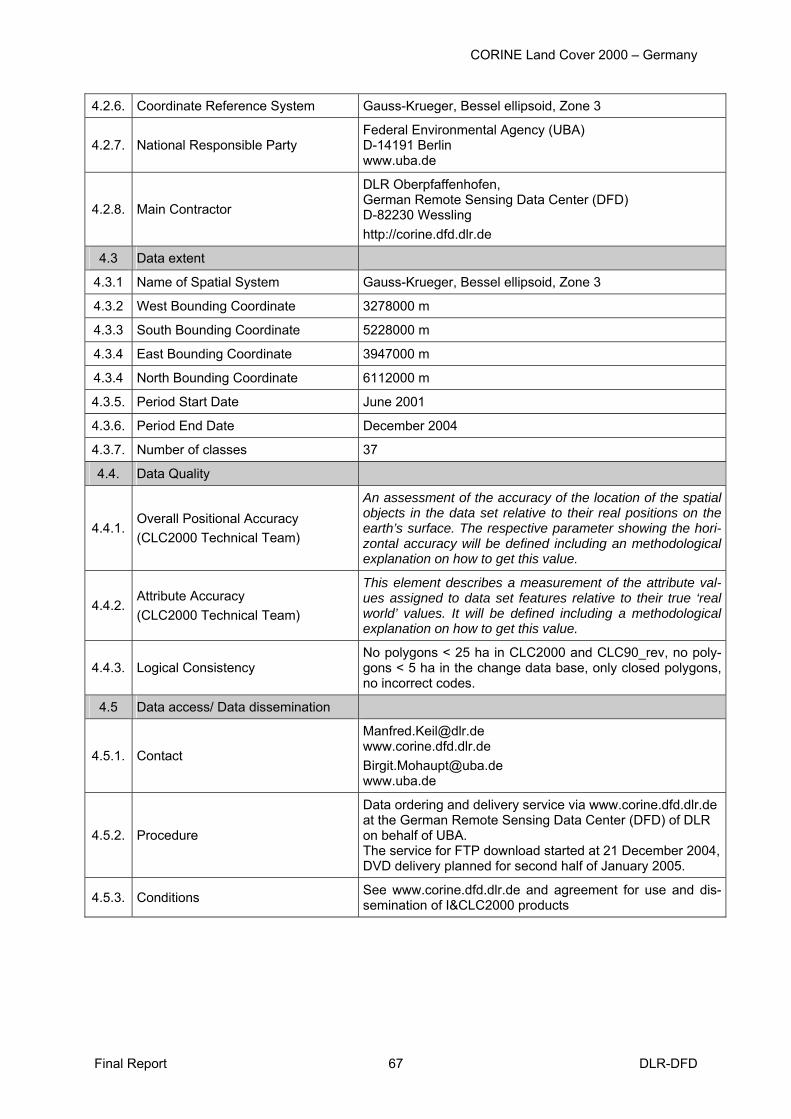
CORINE Land Cover 2000 – Germany
Final Report DLR-DFD 67
4.2.6. Coordinate Reference System Gauss-Krueger, Bessel ellipsoid, Zone 3
4.2.7. National Responsible Party Federal Environmental Agency (UBA) D-14191 Berlin www.uba.de
4.2.8. Main Contractor
DLR Oberpfaffenhofen, German Remote Sensing Data Center (DFD) D-82230 Wessling http://corine.dfd.dlr.de
4.3 Data extent
4.3.1 Name of Spatial System Gauss-Krueger, Bessel ellipsoid, Zone 3
4.3.2 West Bounding Coordinate 3278000 m
4.3.3 South Bounding Coordinate 5228000 m
4.3.4 East Bounding Coordinate 3947000 m
4.3.4 North Bounding Coordinate 6112000 m
4.3.5. Period Start Date June 2001
4.3.6. Period End Date December 2004
4.3.7. Number of classes 37
4.4. Data Quality
4.4.1. Overall Positional Accuracy (CLC2000 Technical Team)
An assessment of the accuracy of the location of the spatial objects in the data set relative to their real positions on the earth’s surface. The respective parameter showing the hori-zontal accuracy will be defined including an methodological explanation on how to get this value.
4.4.2. Attribute Accuracy (CLC2000 Technical Team)
This element describes a measurement of the attribute val-ues assigned to data set features relative to their true ‘real world’ values. It will be defined including a methodological explanation on how to get this value.
4.4.3. Logical Consistency No polygons < 25 ha in CLC2000 and CLC90_rev, no poly-gons < 5 ha in the change data base, only closed polygons, no incorrect codes.
4.5 Data access/ Data dissemination
4.5.1. Contact
[email protected] www.corine.dfd.dlr.de [email protected] www.uba.de
4.5.2. Procedure
Data ordering and delivery service via www.corine.dfd.dlr.de at the German Remote Sensing Data Center (DFD) of DLR on behalf of UBA. The service for FTP download started at 21 December 2004, DVD delivery planned for second half of January 2005.
4.5.3. Conditions See www.corine.dfd.dlr.de and agreement for use and dis-semination of I&CLC2000 products

CORINE Land Cover 2000 – Germany
Final Report DLR-DFD 68
Annex 7: Example of CLC2000 Metadata on Working Unit Level
Title of working unit: C3118
A: GENERAL INFORMATION
Contractor: Federal Environmental Agency (UBA), Dept. II 4.4, AS Spandau
Contracted: German Aerospace Center (DLR), German Remote Sens-ing Data Center (DFD)
Address: Bismarckplatz 1, D-14193 Berlin
Address: Oberpfaffenhofen, Postfach 1116, D-82230 Wessling
Phone: +49 (0)30 8903 3751 Phone: +49 (0)8153 28 1377
Fax: +49 (0)30 8903 2130 Fax: +49 (0)8153 28 1445
Responsible: Birgit Mohaupt-Jahr Project leader:
Manfred Keil
E-mail: [email protected] E-mail: [email protected]
1. IMAGE2000 data used Landsat ETM or other scene(s)
Satellite & Sensor
Path- Row Date (m/d/y) Remark (e.g. clouds)
Landsat7 ETM+ 196 23 05/15/2000
Landsat7 ETM+ 195 23 06/09/2000
2. Topographic maps used (indicate in remark if digital) Scale Sheet id Title/Name Year of
production Year of last revision
Remark
1:100000 C3118 Top Map 100 2000 2000
1:25000 _ Top Map 25 digital
1997-1999 digital
3. Other ancillary data used (thematic data, satellite images, aerial photos, city maps, vegetation maps) Id Data source/type Title
(if relevant) Date of pro-duction (m/d/y)
Scale (spatial detail)
Remark
Satellite Image LS7 ETM+ 196/023
07/05/2001
City Map City Map of Bremen
Satellite Image LS7 ETM+ 196/023
04/03/2002
4. Photointerpreter(s) interpretation Name Affiliation Phone E-mail
start (m/d/y)
end (m/d/y) no. of days
Claudia Lücke EFTAS, D-48145 Münster
+49-251-1330715
carsten.haub@ eftas.com
01/08/2002

CORINE Land Cover 2000 – Germany
Final Report DLR-DFD 69
B: DATA PREPARATION 1. Checking and systematic correction of IMAGE90 data (optional)
Landsat ETM or any other satellite scenes used (e.g. SPOT) Satellite &
Sensor path- row Date
(m/d/y) Max. systematic
geom. error (m)
(optional) Checked & corrected
(name)
(optional) Date
(m/d/y)
(optional)Refer-
ence data
Landsat5 TM 196 23 05/25/1989 < 50 m Landsat5 TM 195 23 07/11/1991 < 50 m 2. Checking and systematic correction of CLC90 data
Date (m/d/y) Corrections Type of correction Checked andcorrected by Start end
Remarks
Systematic correction
Ralph Kiefl 12/05/2001 Errors > 100 m corrected by rubber sheeting
Geometrical errors
Local correction Ralph Kiefl 12/05/2001 Errors > 100 m corrected by rubber sheeting
Logical coherence* Ralph Kiefl 12/05/2001 ok Thematic errors Semantic accuracy** and exhaustiveness***
Carsten Haub 09/06/2002 differentiations in bogs 412
* = compliance with internal rules of CLC (100 m, 25 ha) according to Technical Guidelines and Addendum **= interpretation according to CLC nomenclature; *** = details are appropriate
3. Verification and acceptance on national level
Date (m/d/y)
Accepted by Signature Remark
10/22/2002 Manfred Keil additional 112 due to adaptation of nomenclature
C: INTERPRETATION OF CHANGES AND CREATION OF CLC2000 1. Photo-interpretation and internal quality control
Date of submission
(m/d/y)
Control made by
Date of con-trol
(m/d/y)
Remark (errors, corrections, etc.)
06/04/2002 Carsten Haub 09/06/2002 survey of ribbon-built villages, 412 2. Field checking (if carried out )
Date (m/d/y)
Itinerary (main settlements crossed on the
working unit)
Problems checked and main conclusions
01/15/2002 in general
3. Border matching with neighbour working units or countries working unit /Country
Controlled and corrected by
Date (m/d/y) Remark
neighbouring map units
Claudia Lücke 03/04/2002

CORINE Land Cover 2000 – Germany
Final Report DLR-DFD 70
D: FINAL TECHNICAL QUALITY CONTROL 1. Control of topology, unnecessary boundaries, 25 ha limit, invalid codes and invalid
changes Date
(m/d/y) Controlled by Remark
CLC2000 12/10/2004 Ralph Kiefl CLC Changes
12/10/2004 Ralph Kiefl
CLC90 12/10/2004 Ralph Kiefl 2. Verification and acceptance Date
(m/d/y) Name Signature Remark
National level 10/22/2002 Manfred Keil CLC2000 technical team
10/31/2002 S. Christensen, G. Jaffrain, J. Feranec, G. Buettner
See verification mission report no. 1
E: SOFTWARE / HARDWARE Work phase Software used Hardware used Systematic geometric correction of IM-AGE90
Erdas IMAGINE_8.5 UNIX WS
Systematic geometric correction of CLC90
ArcInfo8.2 UNIX WS
Topological and thematic corrections of CLC90
ArcView 3.2, ArcInfo 8.1 PC
Interpretation of changes ArcView 3.2, ArcInfo 8.1 PC Creation of CLC2000 ArcView 3.2, ArcInfo 8.1 PC Technical quality control ArcInfo 8.3, ArcView 3.3 (PC) PC, UNIX WS Database integration (border matching) ArcInfo 8.3 PC, UNIX WS

CORINE Land Cover 2000 – Germany
Final Report DLR-DFD 71
Annex 8: Matrix of Unusual Changes
Remark: Value 1 marks unusual transitions
111
112
121
122
123
124
131
132
133
141
142
211
221
222
231
242
243
311
312
313
321
322
324
331
332
333
334
335
411
412
421
423
511
512
521
522
523
111
11
11
11
11
11
11
11
11
11
11
11
11
11
11
11
11
11
11
112
11
11
11
11
11
11
11
11
11
11
11
11
11
11
11
11
11
112
11
11
11
11
11
11
11
11
11
11
11
11
11
11
11
11
11
11
122
11
11
11
11
11
11
11
11
11
11
11
11
11
11
11
11
11
112
31
11
11
11
11
11
11
11
11
11
11
11
11
11
11
11
11
11
124
11
11
11
11
11
11
11
11
11
11
11
11
11
11
11
11
11
113
11
11
11
11
11
11
11
11
132
11
11
11
11
11
11
11
11
11
11
11
11
133
11
11
11
11
11
11
11
11
11
11
11
11
114
11
11
11
11
11
11
11
11
11
11
11
11
11
11
11
114
21
11
11
11
11
11
11
11
11
11
11
11
11
11
11
121
11
11
11
11
11
11
11
11
221
11
11
11
11
11
11
11
11
11
11
11
11
11
11
11
11
11
222
11
11
11
11
11
11
11
11
11
11
11
123
11
11
11
11
11
11
11
11
242
11
11
11
11
11
11
11
124
31
11
11
11
11
11
311
11
11
11
11
11
11
11
11
11
312
11
11
11
11
11
11
11
11
11
313
11
11
11
11
11
11
11
11
11
321
11
11
11
11
11
11
11
322
11
11
11
11
11
11
11
11
11
11
11
11
11
11
11
11
11
132
41
11
11
11
11
11
133
11
11
11
11
11
11
11
11
11
11
11
11
11
11
11
332
11
11
11
11
11
11
11
11
11
11
11
11
11
11
11
11
333
11
11
11
11
11
11
133
41
11
11
11
11
335
11
11
11
11
11
11
11
11
11
11
11
11
11
11
11
11
11
411
11
11
11
11
11
11
11
11
141
21
11
11
11
11
11
11
11
11
421
11
11
11
11
11
11
11
11
11
11
11
11
11
11
423
11
11
11
11
11
11
11
11
11
11
11
11
11
11
151
11
11
11
11
11
11
11
11
11
11
11
11
11
11
11
11
11
11
151
21
11
11
11
11
11
11
11
11
11
11
11
11
11
11
11
11
11
152
11
11
11
11
11
11
11
11
11
11
11
11
11
11
11
11
11
152
21
11
11
11
11
11
11
11
11
11
11
11
11
11
11
11
11
152
31
11
11
11
11
11
11
11
11
11
11
11
11
11
11
11
11
11
1

CORINE Land Cover 2000 – Germany
Final Report DLR-DFD 72
Annex 9: Area Size and Percentage of CLC Classes for the Geomet-rically Corrected Dataset CLC1990 The following table lists the area and the percentage of CLC classes level 3 of the German geometric but not thematic corrected vector data set CLC1990. Intertidal flats and large ar-eas of sea and ocean are included; hence the total area is 387,105 km².
Code Land cover Area [km²] Percentage111 Continuous urban fabric 224 0.06% 112 Discontinuous urban fabric 20856 5.39% 121 Industrial or commercial units 2342 0.61% 122 Road and rail networks and associated land 162 0.04% 123 Port areas 113 0.03% 124 Airports 480 0.12% 131 Mineral extraction sites 1282 0.33% 132 Dump sites 169 0.04% 133 Construction sites 68 0.02% 141 Green urban areas 336 0.09% 142 Sport and leisure facilities 747 0.19% 211 Non-irrigated arable land 143009 36.94% 221 Vineyards 1278 0.33% 222 Fruit trees and berry plantations 1305 0.34% 231 Pastures 43326 11.19% 242 Complex cultivation patterns 20591 5.32%
243 Land principally occupied by agriculture, with significant areas of natural vegetation 7520 1.94%
311 Broad-leaved forest 23701 6.12% 312 Coniferous forest 57342 14.81% 313 Mixed forest 23653 6.11% 321 Natural grasslands 1969 0.51% 322 Moors and heathland 1055 0.27% 324 Transitional woodland - shrub 307 0.08% 331 Beaches, dunes, sands 229 0.06% 332 Bare rocks 164 0.04% 333 Sparsely vegetated areas 320 0.08% 334 Burnt areas 0 0.00% 335 Glaciers and perpetual snow 0 0.00% 411 Inland marshes 500 0.13% 412 Peat bogs 1056 0.27% 421 Salt marshes 162 0.04% 423 Intertidal flats 2782 0.72% 511 Water courses 636 0.16% 512 Water bodies 3024 0.78% 521 Coastal lagoons 1110 0.29% 522 Estuaries 261 0.07% 523 Sea and ocean 25025 6.46% Total 387105 100.00%