consumer willingness to pay for vehicle attributes:...
TRANSCRIPT

Consumer Willingness to Pay for Vehicle Attributes: What Do We know?
David Greene, U. TennesseeAnushah Hossain, Julia Hofmann, Robert Beach, RTI Int.
Gloria Helfand, USEPA
Funding for this project was provided by the US EPA.
The content of this presentation does not necessarily reflect the views of the US EPA, the University of Tennessee or RTI International.

Research Objectives: Estimate values of vehicle attributes to improve public policy making. Describe the state of knowledge (developed econometrically).
• Value the direct or indirect trade-offs between fuel economy or greenhouse gas emissions and other vehicle attributes.
• Understand how consumers value fuel economy improvements to inform cost/benefit analysis of regulations.
• What can we learn from the recent econometric literature?• Central tendencies• Uncertainty• Heterogeneity
• Estimate WTP for as many vehicle attributes as possible.
• Try to avoid confirmation bias.
2

Our analysis closely followed Van Houtven’s(2008) meta-analysis paradigm.
• Methods• Data Collection: Literature Search and evaluation.• Estimating WTP: Method, metrics• Checking for errors
• Overview of characteristics of studies & WTP Estimates
• Meta-analysis• ANOVA: What causes variation in estimates for an attribute?• Fuel cost & performance: Seeking consensus.
• Insights from studies comparing alternative models
• Concluding observations
3
Van Houten, G., “Methods for the Meta-Analysis of Willingness-to-Pay Data”, Pharmacoeconomics, 2008: 26(110: 901-910.

Estimating Willingness to Pay (WTP) from Existing Studies
• Many researchers have used data on people’s vehicle purchases and stated preferences to estimate relationships between vehicle attributes and vehicle choices or sales.• Stated Preference: designed choice experiments, simplified
choice problems.• Revealed Preference: based on consumer behavior in markets• Discrete choice: the probability of purchasing a vehicle
depends on its attributes and those of consumers. Survey or market sales.
• Hedonic price: the price of a vehicle depends on its attributes.
• Authors infrequently calculate and publish WTP estimates, but it is usually possible to produce estimates from the coefficients of attributes and price.
4

Our literature search focused on recent U.S. studies.
Typesofliterature: 1)peerreviewedpublications,2)greyliteraturefromacademic/researchinstitutionsà Initialpool of160papers.
Searchengines: GoogleScholar,Econlit,ScienceDirect
Samplejournals: EnergyEconomics,Econometrica,AmericanEconomicReview,TransportationResearch(PartsA-E),ResourceandEnergyEconomics,ReviewofEconomics&Statistics,TransportationResearchBoard
PublicationYears:1995-2015
Region: primarilyUS
Searchterms:willingnesstopay,WTP,demand,statedpreference,revealedpreference,vehiclecharacteristics,vehicleattributes,automobile,design,fuel,choice
5
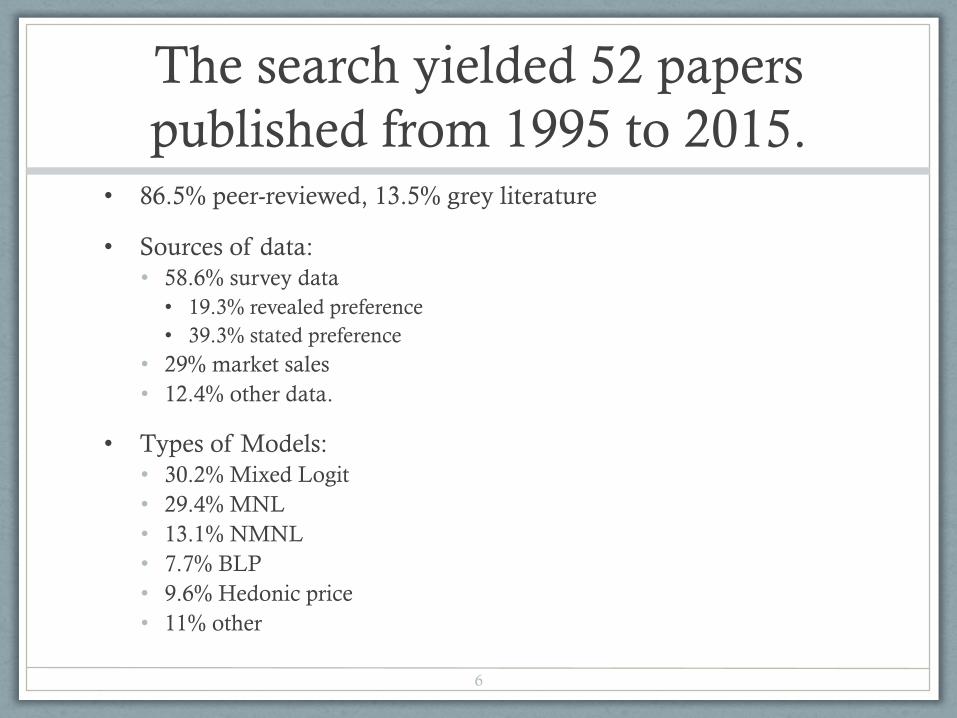
The search yielded 52 papers published from 1995 to 2015.
• 86.5% peer-reviewed, 13.5% grey literature
• Sources of data:• 58.6% survey data• 19.3% revealed preference• 39.3% stated preference
• 29% market sales • 12.4% other data.
• Types of Models:• 30.2% Mixed Logit• 29.4% MNL • 13.1% NMNL • 7.7% BLP • 9.6% Hedonic price • 11% other
6

We estimated 786 WTP values for 146 attributes in 15 classes.
16571
46
4932
19101
51417
84122
5344
0 20 40 60 80 100 120 140 160 180
Vehicle classSize
SafetyReliability
RangePrestige
PollutionPerformance
Non-fuel op costsModel avail.
IncentivesFuel type
Fuel costsFuel availability
Comfort
7

In theory, estimating WTP is straightforward. In practice…not so much.
• Functional forms can be complex:• Price often divided by income• Attributes frequently interacted with other variables.• Attributes measured in varying units
• Descriptive statistics for attributes and interacted variables sometimes missing or incomplete
• Units sometimes uncertain
• Coefficient estimates are random variables and so WTP is a ratio of random variables.
• We estimated WTP conditional on the mean or median value of the price coefficient.
8

We took steps to find and correct errors in our calculations.
• When uncertain of units or interpretations we queried authors.
• Each paper’s calculations are contained in a separate spreadsheet to facilitate checking our work.
• All spreadsheets were sent to lead authors for comments or corrections (obviously voluntary).
• Outlier analysis• Histograms of WTP distributions• Outlier if >3s from trimmed sample
9

The variance of WTP estimates was very large for almost all attributes.
• Out of 35 attributes (table 4):• Mean of trimmed sample > 1s.d. for 22
• Mean of trimmed sample > 2 s.d. for 9
10

We used ANOVA of the Full Sample to analyze relationships between ALL study attributes and WTP
estimates. (Units nested in Grouping)(Bold = 0.01 level; Italic = 0.1 level)
1. Data type: market data, stated preference (SP) survey, revealed preference (RP) survey, SP & RP, literature review
2. Statistical model: the method of Berry et al. (1995) (BLP), mixed logit, multinomial logit (MNL), nested MNL, hedonic, other
3. Interaction variable: none, vehicle type, income, demographic
4. Sample region: U.S., CA, ME, MD+VA+TN, CO, WA, Canada, Austin TX
5. Metric: Units of measurement nested within attribute Group
6. Assumed endogeneity of price: yes, no
7. Authors’ preferred form: yes, no
8. Choice level: fuel type, make-model, powertrain, vehicle class
9. Journal Rank: Top 25, 26-100, 100-300, >300, unranked or gray literature
10. Date: midpoint year of data set used in estimation minus 1970
11

The Full Sample ANOVA model was significant at the 0.0001 level but its adjusted R2 was only 0.20.
Remaining variation may be due to:
1. Decisions we made in estimating WTP.
2. Researchers’ decisions about which variables to include in the model and which to exclude.
3. Correlations among variables included in the estimated model and excluded or unobserved variables.
4. Choices of functional forms for variables, interactions and distributions of random coefficients.
5. Decisions about estimation methods, such as choices of instrumental variables in models assuming endogeneity.
12

Three studies that present results from multiple models using the same data illustrate how
important modelers’ choices can be.
• Haaf et al. (2014) selected models based on objective metrics:• Price coefficients varied from -0.19 to -1.56 (BLP).• Alternative metrics for size changed the sign on fuel cost.
• Klier and Linn (2012) show results for 14 models:• Tested choice of IVs, hp/wt vs. hp & wt, error structures• WTP for 0.01 hp/lb: $303, $264, $303, $283, $52, $51, $8
• Petrin (2002) compared 4 estimation methods, obtaining coefficients for Miles/$ of 0.18, 0.05, -0.54 & -15.97, the latter being the only statistically significant estimate.
13

Interactions with different household attributes can produce very different WTP estimates that probably
do not reflect genuine preference heterogeneity.
14

We used the Stata™ random effects method for the meta-analysis of WTP for fuel cost savings. All p-values strongly rejected homogeneity.
WTP for $0.01/mi Reduction in Fuel Cost: All Models
N.B.: Because we could not estimate true standard errors, the C.I. are not trueconfidence intervals but only indicators of uncertainty.
15
As a reference point, a light-duty vehicle that travels 115,000 discounted (6%/yr) lifetime miles would value a $0.01/mile reduction in fuel cost at $1,150.

WTP estimates also vary by data type and model type. In fixed coefficient models revealed preference data indicate about half as
much WTP as stated preference experiments.
WTP for $0.01/mi Reduction in Fuel Cost: Fixed Coefficient Models
WTP for $0.01/mi Reduction in Fuel Cost: Random Coefficient Models
N.B.: Because we could not estimate true standard errors, the C.I. are not trueconfidence intervals but only indicators of uncertainty.
16

Estimates of WTP for a one second reduction in 0-60 mph time vary much less across data and model types.
WTP for a 1 Second Reduction in 0-60 mph: Comparing Model Types
WTP for a 1 Second Reduction in 0-60 mph: Comparing Data Types
17

What do we know about WTP for vehicle attributes?
• The literature has produced a very wide range of estimates for most attributes.
• For some attributes, there are large differences depending on data and estimation methods.
• Choices made by researchers strongly influence results.
• Central tendency estimates or estimates from any model must be used with appreciation of the uncertainty.
18

How can we make progress?
• We urge researchers to routinely report WTP estimates, along with relevant statistics and data necessary for their calculation (e.g. covariances).
• Choose theoretically valid functional forms for variables. (e.g., fuel cost/mile, 1/range).
• Identify and assess the validity of variables included to represent omitted or inadequately measured factors.
• Continue estimating random utility models but also explore alternative models of consumer choice.
19

Thank you.
20

Backup slide.
21

Power or acceleration was the third most frequently included attribute. We converted three such
measures to WTP for a reduction of 1s 0-60 mph.
22

Fuel cost was the most common attribute after purchase price. For the meta-analysis we converted
most to WTP for a reduction of $0.01/mile.
23