determinants of individuals' willingness to pay for
TRANSCRIPT

Environment and Planning A 1998, volume 30, pages 577 - 594
Determinants of individuals' willingness to pay for perceived reductions in environmental health risks: a case study of bathing water quality
S Georgioulf, I H Langford CSERGE, University of East Anglia, Norwich, Norfolk NR4 7TJ, UK, and University College London, London, UK; e-mail: [email protected]
I J Bateman, R K Turner CSERGE and School of Environmental Sciences, University of East Anglia, Norwich, Norfolk NR4 7TJ, UK; e-mail: [email protected], [email protected] Received 18 July 1996; in revised form 21 November 1996
Abstract. A contingent valuation (CV) study was undertaken to investigate individuals' stated willingness to pay (WTP) to reduce perceived risks of illness from the quality of bathing water at two beaches in East Anglia, United Kingdom. One beach, Great Yarmouth, failed to meet the EC (European Community) Bathing Water Quality Directive standard, whereas the other at Lowestoft passed. The analysis focuses on determinants of individuals' WTP, including measures of risk perception and attitudes to health not usually measured in CV studies. A conceptual model is then presented which sets the valuation of individual preferences in the context of personal worldviews, and external cultural, societal, and environmental factors which may influence, directly or indirectly, an individual's stated WTP.
Introduction The contingent valuation (CV) method is a survey technique that has been used to elicit information about individuals' (or households) preferences for many environmental goods and services. In this study the CV method is used to examine the determinants of preferences with regard to risk and willingness to pay (WTP) to reduce perceived risks of illness from the quality of bathing water.
With the large increase in recreation and tourism to coastal areas the issue of bathing-water quality became increasingly important in the late 1980s. As a result of this the British government in 1987 sanctioned a programme costing approximately £1.4 billion, to ensure that the UK's beaches complied with the 1976 E C (European Community) Directive on Bathing Water (CEC, 1976). In 1991 the E C introduced the Urban Waste Water Treatment Directive, which requires the cessation of dumping of sewage sludge at sea by 1998, and requires secondary treatment of sewage before discharge, for towns with a population greater than 10000. In addition the E C has proposed amendments to the 1976 Bathing Water Directive, and these amendments have been the subject of a recent House of Lords Select Committee on European Communities Repor t (1994). The capital costs of achieving compliance with the two existing Directives will exceed £9 billion (1993/94 £) and estimates of the additional cost of the amendment to the Bathing Water Directive have been put at £1 billion. Given these huge costs and the public debate over water price rises and controls, the question arises as to whether such spending constitutes value for money or if some alternative use of the money would be more beneficial. There will always be a trade-off between environmental improvements and customers' willingness to accept price increases. This means we have to decide upon an acceptable health risk and/or pollution-control level. We must decide on how safe is safe enough, and whether such
If Address for correspondence: Centre for Social and Economic Research on the Global Environment, University of East Anglia, Norwich, Norfolk NR4 7TJ, UK; e-mail: [email protected].

578 S Georgiou, I H Langford, I J Bateman, R K Turner
environmental and health standards should be established by means of economic principles or on precautionary or critical-load grounds (Ramchandani and Pearce, 1992), as is currently practised in the United Kingdom.
In economics, it is assumed that the objective of society is to maximise human welfare. As welfare to the economist is a state of human perception, then economics places great emphasis on how individuals perceive their welfare and hence on the concept of preference. Economic theory asserts that there exists a utility function which represents preferences. The aim of the individual is thus to attain the highest level of utility. This is the axiom of utility maximisation. Looking at pollution-control and acceptable health risk policy from an economic perspective therefore requires that rational policy decisions regarding resource allocation be based on an informed assessment of the utility (or benefits) of controlling pollution and/or health risks.
In estimating such benefits, the focus of economic analysis of individual behaviour is with the trade-offs used to infer the values for health-risk reductions. Hence the value of health-risk reductions is measured by how much of another good a person will give up to get the reduction. Economic assigned values then are expressed in terms of individual WTP and willingness to accept compensation (WTA).
The CV method is one benefit estimation technique used to elicit WTP and WTA. The CV method requires that individuals express their preferences by answering questions about hypothetical choices. The very nature of this methodology has therefore meant that CV has been subject to criticism from both economists and psychologists, whose growing research focus has been on the problem of preference elicitation. Much of this research has focused on the validity of CV. Validity refers to the degree to which CV evaluation correctly indicates the 'true' value of the asset under investigation, bias being a common cause of low validity. These biases result from a number of design issues and questionnaire effects, for example, elicitation and payment scenario effects (Bateman and Langford, 1995; Bateman et al, 1995) etc., such that stated WTP may not capture preferences exactly. Relatively little work, however, has been carried out in economic appraisal and the CV literature on how such preferences are determined and constructed in the first place. Traditional explanations of preferences and WTP or WTA in CV studies look at individual factors as a starting point. Such factors include use of the asset, income, education, knowledge, and other socioeconomic variables.
In determining environmental and health-risk preferences and WTP, the work of cognitive psychologists such as Slovic et al (1981), and economists such as Jones-Lee (1985) and Viscusi (1992), has suggested the importance of additional factors—for example, the way people think and feel about health risks, and what determines their attitudes toward health and risk. In this paper, we examine the results of a CV study which was undertaken to look at some of these issues, in particular attitudes to health and risk in the context of perceived public health risks from bathing waters. Novel use is made of standard questions from the health and psychology literature, such as Health Locus of Control questions (Wallston et al, 1978), as well as those from the psychometric literature on risk perceptions (Slovic et al, 1981). We discuss these in more detail later.
We develop estimates of the economic value of the benefits from reducing the perceived risks of illness arising from the quality of bathing water, in particular focusing on the perceived risk reductions afforded by current EC legislation. We acknowledge that in reality compliance with such standards may not reduce actual risks.
The empirical analysis explores whether traditional explanations of preferences, such as income, are adequate to explain WTP. In the light of the analysis we present an extension to the basic CV model beyond the usual individual and immediate influences and show how these factors may enter the valuation process.

A case study of bathing water quality 579
In the following section we detail the background to the case study, after which we discuss the survey design and structure of the questionnaire. This is followed by a results section which includes discussion and interpretation of specific issues raised in the questionnaire. This mixture of results and interpretation is necessary because of the diversity of potential influences on WTP which have been investigated. In the discussion section we therefore focus on bringing together an overall picture of the factors we found associated with WTP, and attempt to develop an extended model of quantifiable influences determining individual preferences in CV studies.
The economic benefits of perceived health-risk reductions from achieving the EC bathing water standard Sewage discharged into the marine environment is one of the main sources of pollution affecting the quality of bathing waters, and has a number of damaging consequences, one of which is that it contains a number of microbiological agents which can cause disease, illness, and infections.
As a result of these public health risks from sewage-contaminated coastal waters the EC assesses and sets standards covering the sanitary quality of waters used for recreational purposes according to the EC Directive on the Quality of Bathing Waters (CEC, 1976). Numerical quality standards are specified at either Mandatory or Guideline values for a range of physiochemical, bacteriological, and aesthetic criteria. These standards do not have any basis in epidemiological research.
The United Kingdom bases compliance on the EC mandatory faecal and total coliform standard. It is the responsibility of the Environment Agency to monitor the quality of bathing waters. Results of monitoring are published by the Department of Environment and the Environment Agency, and are posted by the local authority at the beach site.
In order to estimate the economic benefits of perceived health-risk reductions from achieving the EC Bathing Water Directive standard a pilot contingent valuation survey was carried out among randomly selected individuals at two beaches in two coastal towns in East Anglia—Great Yarmouth Pier beach and Lowestoft beach. At the time of the survey, one of these beaches (Lowestoft) passed the EC Bathing Water Directive standard, whereas the other (Great Yarmouth) failed. The main reason for choosing such beaches was so that we had two valuation scenarios, based on a gain or loss of welfare from the respondents initial position, and thus resulting in two different measures of the economic value of health-risk reductions from achieving the current EC Bathing Water Directive standard. The Great Yarmouth sample gave a measure based on the WTP for a gain—the compensating surplus, whereas the Lowestoft sample gave a measure based on the WTP to avoid a loss—the equivalent surplus. According to standard economic theory these two measures should be the same for identical goods and for the same change in provision of the good (Bateman and Turner, 1993).(1) However, in this study, although the good was the same in both scenarios, the changes in provision were not (as they were based on levels of gain and loss which were not necessarily the same). We thus had no prior expectations regarding the relationship between the two measures. The payment vehicle used in the survey was an increase in water rates, which we acknowledge may not be the most appropriate, especially if visitors to the beach are from outside the charging area. However, given that in the past the costs of achieving the EC bathing water standards have been financed by increases in water rates, then it is probably more appropriate than the use of say an entrance fee to the beach. An open-ended elicitation method was used because of the (1) Note that competing ideas such as prospect and reference dependent utility theory suggest that measures of unit loss may exceed measures of unit gain.

580 S Georgiou, I H Langford, I J Bateman, R K Turner
lack of previous valuation estimates necessary for the use of the dichotomous choice method. In addition, the present study represents a pilot for a further larger scale study planned for 1996-97.
Survey design and data Depending on which beach the interview was undertaken we used two types of questionnaire. These were exactly the same except for the valuation questions section (which differed only in respect of the WTP measure), and comprised of six sections in total: identification and introductory information; visitation and behaviour questions; risk questions; valuation scenario and questions; health locus of control questions; and socioeconomic questions.
The visitation and behaviour questions were used to find out basic information on the respondents' visit to the site, as well as their swimming activity.
The risk questions looked at how risky respondents thought various activities (including sea bathing), products, or technologies were, and how unacceptable they felt the current risk from each of these were to people in the United Kingdom. The basis for these questions can be found in the psychometric literature on risk perceptions, for example, Slovic et al (1981).
The valuation scenario and questions were preceded by information about sewage contamination of bathing water and the subsequent possible health risk from bathing; the EC Bathing water standards; and the actual quality of the water at the particular beach. In particular, the questionnaire stated that:
"As a result of sewage discharged into the sea there are a number of public health risks from sea bathing. Polluted seawater can cause a variety of minor illnesses such as stomach upsets, diarrhoea, coughs and colds, skin and eye infections, and possibly more serious illnesses in some cases.
The European Commission sets standards on acceptable sea water quality with respect to human health. Bathing waters are judged to either pass or fail the Standard. Those which pass the Standard are given Government approval and deemed to be safe to swim in.
Each year we all have to pay for the treatment of sewage. This payment is mainly made through taxes and water rates. The treatment carried out helps to ensure that the EC bathing water standards are complied with. However not all beaches pass the bathing water standard. One of the purposes of this study is to determine how much people value the safety to their health of bathing waters which have passed the EC Standard".
The list of possible illnesses arising from bathing in sewage polluted seawater was adapted from United Nations Environment Programme (UNEP, 1991), and was deliberately conservative, as including illnesses for which there are only anecdotal data could bias responses to the WTP questions.
Some questions were then asked in order to gauge how important it was to the respondent that the beach they were at should pass the EC standard, and also how risky they felt that the quality of seawater at the beach was to their personal health.
Respondents at Great Yarmouth (Lowestoft) were then told that the bathing water at that beach currently failed (passed) the EC standard. They were told that the water authorities could ensure that the bathing water improves to a level where it would pass the EC standard (did not fall below the EC standard in the future), but that this may require an increase in water rates to pay for sewage treatment. After a reminder that they already currently pay towards sewage treatment in the United Kingdom and that there are alternative beaches to which they could go, respondents were asked to vote on a referendum of whether or not water rates should be increased so as to ensure that the

A case study of bathing water quality 581
bathing water at the beach passed the EC standard (did not fall below the EC standard). Those who voted in favour of an increase in water rates were then asked to state the maximum amount of money that they would be willing to pay per year in the form of higher water rates to ensure that the bathing water at the beach passed the EC standard (did not fall below the EC standard). Depending then on which beach the respondent was at implies a different measure of WTP—one based on an improvement or gain (Great Yarmouth), and thus equal to compensating surplus, and one based on avoiding a deterioration or loss (Lowestoft), and thus equal to equivalent surplus.
The health locus of control questions are standard questions from the health and psychology literature (Wallston et al, 1978), which are used to see if and how expectancies with regard to the factors determining individual's health, affect or determine WTP for health improvements. The use of this tool is novel in a CV study.
Last, the socioeconomic questions focused on characteristics such as income, level of education, and membership of various clubs or organisations. Full details of the survey questions are available in Georgiou et al (1996a).
Results Data collection was carried out by in-person interviews, with each interview lasting approximately twenty-five minutes. The survey was conducted over the period 14 June 1995 to 30 August 1995. Total sample size was 400, of which 197 interviews were carried out at Great Yarmouth and 203 at Lowestoft.
We examine here some of the important findings regarding potential influences on individual WTP and discuss the possible interpretation of each analysis we present.
Sample characteristics First, we must examine the structure of our two samples. The socioeconomic characteristics of the Great Yarmouth and Lowestoft samples are shown in table 1. There were no statistically significant differences between respondents at the two sites. In addition, we tested for any interviewer effect on survey respondents but found no evidence to support this.
As shown in table 2, composition of respondents between the two sites was quite different with regard to their use of the sites as shown in table 2. The main group of respondents in the Great Yarmouth sample were holidaymakers, whereas at Lowestoft
Table 1. Socioeconomic characteristics.
Characteristic Great Yarmouth Lowestoft
Mean income (£) 10000-14999 10000-14999 Median income (£) 10 000 -14 999 10 000 -14 999 Education (mean age of leaving full-time education) 16.32 16.60 Employment (% of sample currently employed) 68.02 67.98 Household residents (mean number of people in household) 3.28
Table 2. Type of respondent.
Type of respondent Great Yarmoutha Lowestoft3
3.38
Holidaymaker 66.5 32.3 Day-tripper 21.8 42.8 Local resident 10.7 23.9 Other 1.0 1.0 a % of site sample.

582 S Georgiou, I H Langford, I J Bateman, R K Turner
the composition was more evenly distributed. This difference in composition has implications, as we shall see, regarding the level of knowledge of respondents to each site.
Water quality awareness If we now turn to the respondents subjective rating of water quality at each site, this was based on a scale from —3 (Very Poor) to +3 (Very Good), and the mean and median scores for each site are shown in table 3.
Table 3. Water quality rating.
Rating Great Yarmouth Lowestoft
Mean 0.458 1.495 Median 1 2
It is indicated in table 3 that, in general, respondents perceptions were broadly in line with actual quality, as mean and median rating for Lowestoft, which passes the EC standard, are greater than for Yarmouth, which fails the standard. T-tests and M a n n -Whitney U tests indicate that both mean and median ratings differ significantly between the two sites (a = 5%).
It is interesting, however, to compare the water quality rating with actual knowledge of respondents as to whether or not each beach passes the EC standard. This is shown in table 4, in which answers are separated for each beach and also for each type of respondent (we exclude the 'other' category of respondent type because of the small numbers involved). Note that the percentages of respondents giving the 'correct answer' are shown in bold.
Table 4. Knowledge—does beach pass EC standard?
Does beach pass standard?
Yes (%) No (%) Do not know (%) Sample number
Great Yarmouth
all holiday-sample makers
12.24 9.16 12.24 6.87 75.51 83.97
196 131
day-trippers
18.60 9.30
72.09 43
local residents
20.00 50.00 30.00 20
Lowestoft
all sample
60.89 3.47
35.64 202
holiday-makers
46.15 4.62
49.23 65
day-trippers
65.12 3.49
31.40 86
local residents
71.43 2.04
26.53 49
By examining table 4, we can be seen that there is a much greater awareness of whether the beach passes the standard or not for the respondents who visit Lowestoft. Conversely at Great Yarmouth the vast majority of respondents were unaware of whether the beach had passed the EC standard, and as many incorrectly stated that it had passed as stated it had failed. As is to be expected, the knowledge of local residents as to the correct response is better at both sites compared with the other respondents.
Why is there such a big difference between knowledge at the two beaches? One hypothesis is that it is precisely because respondents know that Lowestoft passes the standard that they choose to go there, whereas those who choose to go to Great Yarmouth do so because they do not know it fails. Such a hypothesis is supported by the figures seen in table 5, which shows the numbers of respondents who stated that a member of their family had suffered an illness as a result of bathing in the sea. The table is divided into the various types of respondent as well as the beach that the respondent was at. We can see that for the whole sample (as well as the

A case study of bathing water quality 583
holidaymakers subsample) there is a statistically significant relationship (a = 5%) between which beach was visited and whether any member of the respondent 's family had ever suffered any illness as a result of sea bathing. This table in conjunction with table 4 thus suggests that people who have a family member who has been ill from sea bathing choose to go to a beach which they know is clean.
With regard to previous personal (rather than family) experience of illness, there was no statistically significant difference between the numbers of respondents at the two beaches who stated that they had suffered an illness as a result of bathing in the sea. The figure for each beach is around 6%.
Table 5. Previous experience of illness in family.
Experience All sample Holidaymakers
of illness Gt Y L Gt Y L
Day-trippers
Gt Y L
Local residents
Gt Y L
No (%) 93.85 87.25 95.38 83.08 88.37 90.70 95.00 87.76 Yes (%) 6.15 12.75 4.62 16.92 11.63 9.30 5.00 12.24 r (probability) 0.025 0.004 0.679 0.366 Sample number 195 204 130 65 43 86 20 49
Gt Y, Great Yarmouth; L, Lowestoft.
Risk perception and behaviour Respondents ' mean and median risk ratings for the eight risk items investigated are shown in table 6. Bathing water is rated at about the same level of risk as nuclear power and driving. The most risky item is considered to be smoking, whereas the least risky is food additives.
Analysis of the data underlying table 6 showed that the difference in mean risk scores across the two beaches is statistically insignificant (a = 5%) for all of the above items except nuclear power.
In table 7 (see over) we show respondents ' mean and median unacceptability of risk ratings for the eight items investigated.
As we can see from tables 6 and 7 the order of 'riskiness' of items does not necessarily carry over to the order of unacceptability of risks. Bathing-water risks are considered to be the fourth most unacceptable risk to people in the United Kingdom for the items in the table, ahead of food additives, nuclear power, driving, and sunbathing. The most unacceptable risk was considered to be smoking and the least was food additives, thus keeping the same ranking as for the rating of risks in
Table 6. How risky do you think the following activities, products, technologies are to people in the United Kingdom (rating from 1 = very low risk, 5 = very high risk)?
Risk type Mean rating Median rating
Food additives Air pollution Smoking AIDS Nuclear power Bathing-water quality Driving Sunbathing
2.59 3.70 4.40 3.66 3.16 3.16 3.13 3.34
2 4 5 4 3 3 3 3
AIDS, acquired immunodeficiency syndrome.

584 S Georgiou, I H Langford, I J Bateman, R K Turner
Table 7. How acceptable do you feel the current risk is for each of the following items to people in the United Kingdom (rating from 1 = acceptable, 5 = not acceptable)?
Risk type Mean rating Median rating
Food additives Air pollution Smoking AIDS Nuclear power Bathing water quality Driving Sunbathing
AIDS, acquired
2.54 3.69 4.02 3.79 3.26 3.41 2.82 2.75
immunodeficiency syndrome.
2 4 5 4 3 3 3 3
table 6. The difference in mean unacceptability scores across the two beaches was statistically insignificant (a = 5%) for all of the above items except for air pollution, smoking, and nuclear power.
We need to ask whether the above information on water-quality perceptions, knowledge, previous illness, and risks, has any bearing or not on respondents actual behaviour with respect to going into the water at the beaches.
One-way analysis of variance and chi-squared analysis highlighted statistically significant (a < 5%) relationships between going into the water at the beach, and the respondents perception of water quality and their stated belief that the water passed the EC standard or not, as shown in tables 8 and 9. Both relationships were positive (higher rating of perception of water quality for those going in the water; higher belief that water passes the EC standard among those going in). The other factors (previous illness, and risks) were insignificant.
Table 8. The relationship between going into the water and perception of water quality.
Has respondent been in water? Summary
mean
No 0.832 Yes 1.170 Total 0.987
Note: Analysis of variance probability > F =
of rating of perceived water quality
standard deviation
1.779 1.590 1.701
0.048.
frequency
214 182 396
Table 9. The relationship between going into the water and belief that the beach passes standard or not.
Does beach pass the EC standard? Has respondent been in the water
no (%) yes (%) total (%)
the EC
No or do not know (%) 58.73 41.27 100 Yes (%) 46.62 53.38 100 Total (%) 54.25 45.75 100 Note: Pearson chi-squared (1) = 5.51; probability = 0.019.

A case study of bathing water quality 585
The valuation questions Turning now to the economic benefits of health-risk reductions from achieving the EC Bathing Water Directive standard; we summarise in table 10 the responses given to the referendum and maximum WTP questions. The percentage of respondents who voted 'yes' to the referendum question about whether water rates should be increased so as to ensure that the bathing water at the beach they were at passed the EC standard (did not fall below the EC standard) is given for Great Yarmouth (Lowestoft) for each respondent type. In addition the confidence intervals are shown.
As can be seen from table 10 fewer respondents are in favour of the increase in water rates at Great Yarmouth, whereas the majority are in favour at Lowestoft (full samples). Holidaymakers tend to be more in favour of the increase at both beaches and local residents least in favour at both beaches. This may be because holidaymakers assume that any water rates increase would not affect them if they lived and paid rates outside of the charging area (that is, holidaymakers are free riding). The percentages in favour of the water rates increase (the payment principle) are low in comparison to other UK CV studies, where rates of 80% acceptance have been found for referendum questions of this type. A possible reason for the lower rate of acceptance in this study is the fact that respondents were affected by knowledge that they would already have to pay anyway, as investment to meet standards was already included in water rate rises scheduled for the period up to 2000. The actual reasons given by those refusing to pay are indicated in table 11. Clearly the main reason is a rejection of the payment vehicle (reason 1 and 2) which accounts for nearly 80% of refusals.
The mean WTP and 95% confidence intervals as well as the median are also shown in table 10 for the question "what is the maximum amount of money that you would be willing to pay per year in the form of higher water rates to ensure that the bathing water at this beach passes the EC standard (does not fall below the EC standard)"
Table 10. Summary of referendum and willingness to pay (WTP) questions, 95% confidence intervals in brackets.
Benefit measure
Referendum— Yes (%)
Mean WTP (£)
Median WTP (£)
Table 11. Reasons
Reason
1 Pay too much
Great Yarmouth
all sample
40.31 (33.38: 47.53) 12.64 (9.00: 16.28) 0.00
given by
holiday-makers
46.56 (37.81: 55.48) 14.16 (9.66: 18.65) 0.00
day-trippers
30.23 (17.18: 46.10) 10.24 (2.01: 18.46 0.00
local residents
25.00 (8.64: 49.09)
9.33 (-2.23:
20.81) 0.00
Lowestoft
all sample
50.00 (42.94: 57.05) 14.32
ril.18: 17.45) 4.75
those refusing to pay for cleanup.
tax already 2 Fat cat syndromea
3 Rarely visit 4 Cannot afford 5 Someone else should pa> i
Percentage stating
56.91 21.28 11.70 4.26 5.32
holiday-makers
53.85 (41.01: 66.28) 14.49 (9.20: 19.77) 5.00
day-trippers
48.84 (37.91: 59.85) 14.53 (9.55: 19.51) 4.50
local residents
46.94 (32.54: 61.70) 13.50 (6.45: 20.38)
0.00
a Fat cat syndrome refers to the current controversy surrounding UK privatised water-utility company profits and directors pay.
586 S Georgiou, I H Langford, I J Bateman, R K Turner
for Great Yarmouth (Lowestoft) for each respondent type. The mean and median WTP values include zero WTP values for those respondents who voted against the referendum question (and thus are assumed to have a zero WTP). The mean WTP at each beach is broadly similar and indeed the difference in means and medians is not statistically significant with the use of t-test and Mann-Whitney U tests (a = 5%). As was mentioned earlier, such a finding is consistent with economic theory for equal changes in provision of goods which are the same (though in this particular case it was unknown if equal changes in provision were being considered).
It should be noted that the above WTP figures do not imply that, with approximately sixty bathing beaches per Environment Agency region, that beach-going water-charge payers would be willing to pay sixty times the figures shown in table 10. In fact, respondents were also questioned about cleanup of all beaches, but the WTP amounts were found to be similar to those above for the single beach (see Georgiou et al, 1966b). This apparent insensitivity to scope is known as 'embedding' (Kahneman and Knetsch, 1992), and is the subject of other ongoing work by the authors.
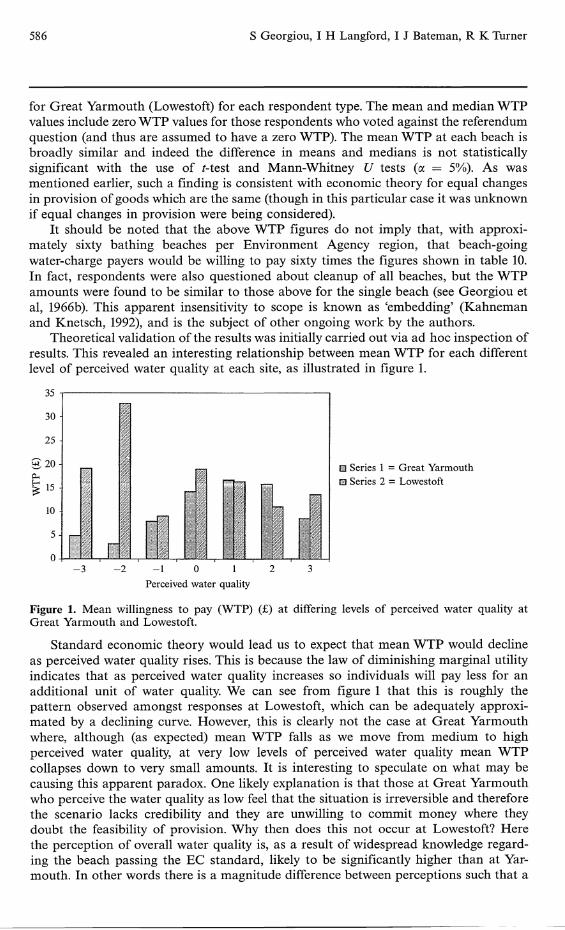
Theoretical validation of the results was initially carried out via ad hoc inspection of results. This revealed an interesting relationship between mean WTP for each different level of perceived water quality at each site, as illustrated in figure 1.
Perceived water quality
Figure 1. Mean willingness to pay (WTP) (£) at differing levels of perceived water quality at Great Yarmouth and Lowestoft.
Standard economic theory would lead us to expect that mean WTP would decline as perceived water quality rises. This is because the law of diminishing marginal utility indicates that as perceived water quality increases so individuals will pay less for an additional unit of water quality. We can see from figure 1 that this is roughly the pattern observed amongst responses at Lowestoft, which can be adequately approximated by a declining curve. However, this is clearly not the case at Great Yarmouth where, although (as expected) mean WTP falls as we move from medium to high perceived water quality, at very low levels of perceived water quality mean WTP collapses down to very small amounts. It is interesting to speculate on what may be causing this apparent paradox. One likely explanation is that those at Great Yarmouth who perceive the water quality as low feel that the situation is irreversible and therefore the scenario lacks credibility and they are unwilling to commit money where they doubt the feasibility of provision. Why then does this not occur at Lowestoft? Here the perception of overall water quality is, as a result of widespread knowledge regarding the beach passing the EC standard, likely to be significantly higher than at Yarmouth. In other words there is a magnitude difference between perceptions such that a

A case study of bathing water quality 587
medium perceived quality score at Lowestoft is, in absolute terms, substantially above a medium perceived quality score at Great Yarmouth.
Bid-function analysis Though ad hoc inspections can reveal interesting relationships, formal theoretical validation was achieved through statistical investigation of the bid functions underlying the WTP responses. Here a full range of explanatory variables were investigated. Functional form was a priori, uncertain (although linear forms were theoretically undesirable)(2). Detailed analysis of functional form by the use of Box Cox procedure (Maddala, 1989) was carried out and a semilog (dependent) form was found to perform most efficiently.
Given the clear differences between respondent subsamples (locals, day-trippers, and holidaymakers) at each beach, analysis of bid functions for all interviewees (even disaggregated across the two beaches) appeared to have dubious validity. Analysis of such functions confirmed these expectations and produced weak and uninformative models. Statistical investigations consequently focused upon estimation of individual bid functions for each respondent subsample at each beach.
Great Yarmouth In table 12 we show the statistically significant (a < 5%) explanatory variables in the regression model explaining the WTP responses of holidaymakers at Great Yarmouth.
The overall explanatory power of the model is reasonable compared with other open-ended models of this type (where R2 values of less than 10% have been found, for example, Bateman et al, 1993). The "Employment" (EMPLOY) dummy variable is positive as expected, indicating that those employed are willing to pay more than those unemployed (because they have higher income). A variable coefficient which was
Table 12. Bid function for sample of holidaymakers at Great Yarmouth (dependent variable is In WTP).
Explanatory variable Coefficient /-statistic Remarks
AWARE (1 = yes, 0 = no)
IMPBEA (1 = not very, 6 = very)
INWAT (1 = yes, 0 = no)
2.3689 2.482
2.4226 3.379
-1.9559 -2.212
2.028
2.905
-2.095
-4.533
Knowledge and behaviour
Attitude towards risk and health
Use (but negative because of cognitive dissonance or true ignorance)
Perceptions, irredeemable quality
Income
Use (but negative because of cognitive dissonance or true ignorance)
PERWQ 0.5839 ( — 3 = very poor, +3 = very good) EMPLOY 3.0256 (1 = yes, 0 = no)
SWIM -2.0306 (1 = yes, 0 = no)
Constant -16.5461
TV = 120 Adjusted R2 = 0.183
Note: explanatory variables are defined in the text.
(2) Linear forms predict constant rather than declining marginal WTP. Furthermore the use of In (WTP) as the dependent variable prevents the prediction of negative values.

588 S Georgiou, I H Langford, I J Bateman, R K Turner
initially thought incorrectly signed was that on the variable indicating if the respondent had "Been in the water" (INWAT) at the beach in the past three days. It was thought a priori that those who have been in the water would have a higher WTP as they use the water and would thus presumably want it to be clean. The coefficient as can be seen in table 12 is in fact negative indicating a lower WTP. However, if one considers the fact that Great Yarmouth does not pass the EC standard, then those who go swimming there are in fact swimming in what is considered to be polluted water. This must mean they either do not know or do not care about the water quality and so are not willing to pay as much. We argue that cognitive dissonance may be at work here, that is, those who go in the water reinforce their view that the water must be alright (which they believe because they have gone in) by not thinking it necessary to pay for any cleanup (which would contradict their belief about it being alright). Interestingly, the coefficient on the variable "Activity = swimming" (SWIM), which indicates respondents who stated that swimming was one of the three main activities that they and their family undertook, was also negative, contrary to prior expectations. Again we believe this is for the same reasons as those given for the negative coefficient on IN WAT, that is, true ignorance or cognitive dissonance. In addition to these variables, we found a significantly positive relationship between WTP and, whether the respondent was knowledgeable about bathing-water health risks, as indicated by the coefficient on the variable "Aware of the health risks of sea bathing" (AWARE), as well as on the degree of importance placed by the respondent on whether the beach should pass the EC standard, as indicated by the coefficient on the variable "Importance of beach passing std" (IMPBEA). The final variable which was significant was the respondents rating of "Perceived water quality at the beach" (PERWQ). The coefficient here was positive, contrary to prior expectations, and indicated that the higher the respondent perceived water quality, then the more they were willing to pay. However, on consideration of the earlier result that the relationship between mean WTP and perceived water quality follows an inverted 'U' at Great Yarmouth, then the positive coefficient here reflects the overall upward trend found in the earlier results.
The statistically significant (a < 5%) explanatory variables in the regression model are shown in table 13 explaining the WTP responses of day-trippers at Great Yarmouth.
The explanatory power of this model is very high, though we have only thirty-seven observations. As one would expect among the explanatory variables, the coefficient on "Number of visits to the beach in the past year" (VISPYR) is positive, which indicates
Table 13. Bid function for day-tripper sample at Great Yarmouth (dependent variable is In WTP).
Explanatory variable
VISPYR
ENJBEA
PASSTD (1 = stated—'no', 0 =
POWHLC
INCOME
Constant
TV = 37 Adjusted R2 = 0.569
other)
Coefficient
0.5074
-0.1128
-4.4820
-0.2185
0.4900
3.7373
f-statistic
5.352
-4.397
-2.296
-2.698
1.999
1.446
Remarks
Use
Quality good so no need to pay
Knowledge and/or irredeemable
External or hierarchical health attitudes, others responsible
Income
Note: explanatory variables are defined in the text.

A case study of bathing water quality 589
that the greater the number of visits the higher the WTP, as is the one on INCOME which indicates that as income increases so does WTP. The variable "Powerful other Health Locus of Control" (POWHLC) is a measure, constructed from the Health Locus of Control questions, which indicates the extent to which a respondent believes that the factors which determine their health are powerful factors over which they have little control, for example, the government. The higher the value of this variable the more a person thinks that powerful others determine their health. A priori, we are unsure of the sign of the coefficient on this variable. Those who think they have little control over their health, that is, that it is in the hands of powerful other factors, may think that cleanup is not their responsibility and as such they should not be expected to pay for it (and will thus have a lower WTP). On the other hand they could also think that, as their health is determined by powerful others, then a payment to such bodies will make the difference between them being ill or not. In fact the coefficient on the variable is negative indicating that the more one thinks they have little control over ones health the lower is their WTP. The final two variables "% Enjoyment of day due to beach" (ENJBEA) and "Has beach passed std" (PASSTD) both have negative coefficients. The first of these looks at the respondents response to the question "what percentage of the overall enjoyment of the day (of the questionnaire) was due to them being at the beach, as opposed to somewhere else?". The negative coefficient indicates that the more their enjoyment is a result of being at the beach the lower is their WTP. Presumably this is because those enjoying themselves more think that the overall quality of the beach (which includes water quality) is better and so see less reason to pay towards improvement. The variable PASSTD is a dummy indicating those respondents who correctly stated that the beach had not passed the EC standard. The negative coefficient suggests perversely that such respondents are willing to pay less. One possible explanation for this is that they are not willing to pay as much because they think the water quality is irredeemable and thus not worth paying for (compare this with the explanation for the coefficient on perceived water quality in the previous regression).
The last regression model for Great Yarmouth looks at the WTP responses of local residents. In table 14 we show the statistically significant (a < 5%) explanatory variables in this model.
In this model we can see that just one variable provides 22% of the explanatory power. However, as in the previous regression model, there are very few observations, such that we cannot read too much into this model. The model does, however, suggest that respondents who stated that they had previously suffered an illness as a result of bathing in sea water were willing to pay more for cleanup.
Table 14. Bid function for local resident sample at Great Yarmouth (dependent variable is In WTP).
Explanatory variable Coefficient ^-statistic Remarks
PERSUF 5.50944 2.457 Prior experience
(1 = yes, 0 = no)
Constant -5.4799 -5.237
N = 19 Adjusted R2 = 0.219 Note: PERSUF—personally suffered any illness from sea bathing.

590 S Georgiou, I H Langford, I J Bateman, R K Turner
Lowestoft We now turn to the split sample models for Lowestoft. First of all we examine the W T P responses for holidaymakers. The statistically significant (a < 5%) explanatory variables in this model are shown in table 15.
In this model the coefficient on "Education" (EDUC) is positively signed. The coefficient on the variable INWAT is positive. This compares with the negative coefficient found for this variable in the Great Yarmouth sample models (see above). It was hypothesised in the Great Yarmouth cases that the negative coefficient was because of the bathing water failing the EC standard and the resulting cognitive dissonance of respondents. In the case of Lowestoft, the bathing water passes the EC standard and so the respondents no longer suffer from cognitive dissonance, 46% of holidaymakers believed the beach had passed the EC standard (correctly) as opposed to only 9% at Great Yarmouth (see table 4). Thus, respondents who go in the water at this beach are willing to pay more to ensure that the quality does not fall below the EC standard, as one would expect. The other significant explanatory variable is the one indicating respondents who had stated that members of their family had been ill as a result of swimming in the sea ["Family ever suffered any illness from sea bathing" (FAMSUF)]. The coefficient here was positive.
In table 16 are shown the statistically significant (a < 5%) explanatory variables in the regression model, which explain the W T P responses of day-trippers at Lowestoft.
The two significant explanatory variables in this analysis were both positive, which indicates that W T P was higher for those respondents who visited the beach more often (VISPYR), and W T P was also higher among sports club members as their income
Table 15. Bid function for holidaymaker sample at Lowestoft (dependent variable is In WTP).
Explanatory variable Coefficient ^-statistic Remarks
INWAT (1 = yes, 0 = no)
2.8344
FAMSUF 3.6626 (1 = yes, 0 = no)
EDUC 0.5716
(age at which left full-time education)
Constant -13.2597
TV = 60 Adjusted R2 = 0.1958 Note: explanatory variables are defined in the text.
2.438 Use (positive, as no cognitive dissonance, high knowledge that water is clean)
2.461 Prior experience of family (family = self)
2.127 Education
-2.943
Table 16. Bid function for day-trip sample at Lowestoft (dependent variable is In WTP).
Explanatory variable Coefficient f-statistic Remarks
VISPYR
MEMSPC*INCOME
Constant
N = IS Adjusted R2 = 0.1795
Note: explanatory variables are defined in the text.
0.2048
0.7725
•3.3972
2.865
3.255
-5.195
Use
Interaction, income

A case study of bathing water quality 591
increased (as shown by the interaction term between "Member of sports club" (MEMSPC) and INCOME).
The last regression model explains the WTP responses of local residents at Lowestoft. The statistically significant (a < 5%) explanatory variables are shown in table 17.
The significant explanatory variables here included INCOME, which was correctly signed positive, and "Mean unacceptability of all risks score" (MNUNAC) which was also positively signed. This second variable gives the mean score given to the unacceptability of risk questions. The coefficient indicates that the more unacceptable the respondent thought that all the risks they were questioned about were to people in the United Kingdom, then the more they were willing to pay to ensure that the beach passed the standard. Risk aversion of respondents would explain this motive, but note that it is the perceived unacceptability of risk rather than actual perceived riskiness which is important. In other words, people are willing to pay more to ensure the beach passes the standard if they think risks are unacceptable, irrespective of whether they perceived that the actual risks are large or small. Previous risk valuation work has tended to focus on actual perceived riskiness versus objective riskiness as being of importance (Jones-Lee, 1985; Viscusi, 1992). This finding indicated that attitudes to risk are also important. The variable IN WAT has a negative coefficient, which indicates that those respondents who have been in the water are willing to pay less. This compares with the positive coefficient found for holidaymakers in Lowestoft (table 15). Why should the sign of this variable change when we consider local residents rather than holidaymakers? One possible explanation is that local residents know the beach is clean, but accept this as the status quo, and hence see no reason to pay to maintain this status quo. Holidaymakers, on the other hand, may have chosen to visit Lowestoft because it is clean, and hence wish to preserve this feature, that is, they have made an effort in expenditure to visit Lowestoft and hence, perhaps perversely, have a greater stake in maintaining its status in financial terms. In other words, holidaymakers may perceive the quality of bathing water at Lowestoft as a good which they have chosen to purchase, whereas local residents perceive it as a right allied to their residence for which they should not have to pay. However, this interpretation is highly speculative, but more research is planned on this issue. The last variable is ENJBEA, whose coefficient is positive. This compares with the negative coefficient found on this variable for day-trippers at Great Yarmouth. In this case the positive coefficient may be because those respondents who enjoy the day more as a result of being at the beach think the
Table 17. Bid function for local resident sample at Lowestoft (dependent variable is In WTP).
Explanatory variable
ENJBEA
INWAT (1 = yes, 0 = no)
INCOME
MNUNAC (1 = acceptable, 6 =
Constant
not acceptable)
Coefficient
0.0864
-3.3215
0.9706
2.9151
-19.7216
r-statistic
2.862
-2.287
2.541
3.120
-5.047
Remarks
Use
Use (negative because of local residents knowing beach is clean)
Income
Risk attitudes
TV = 43 Adjusted R2 = 0.3104 Note: explanatory variables are defined in the text.

592 S Georgiou, I H Langford, I J Bateman, R K Turner
quality of the beach (including water quality) is good and so are willing to pay more to avoid a loss of quality. Again this is a speculative suggestion and more work is required.
Discussion and conclusions We can see from the bid-function analysis that the interpretation of explanatory factors is not straightforward. It appears that, though standard individual factors such as income, education, etc, are important, other factors must also be taken into account. These include perception of and attitude to risk (as indicated by the various models where riskiness, etc, was found to be significant), and the health attitudes of individuals (as indicated by the Health Locus of Control measures). Such factors extend the range of variables considered to be important in determining stated preferences in CV studies. As shown in the previous section, interpretation of these factors may prove complex. However, we would argue strongly that future CV studies need to address the issues raised in this preliminary study, and this is part of the evolutionary process of the theoretical and methodological basis of the method as a tool for measuring environmental and health preferences.
In particular the models strongly suggest that at least two important factors often overlooked in CV studies may in fact be of significant importance. First is the loca-tional context of the survey. It has been recognised (Brown and Slovic, 1988) that contextual factors are important in the determination of WTP. Brown and Slovic argue that the valuation context may affect how objects are perceived, the beliefs that become relevant, the utility experienced, and the value assigned. The second factor concerns the personal context (or social relationship) of the respondent, for example, whether they are a holidaymaker, day-tripper, or local resident. Here group membership clearly proxied a variety of motivations as valuation differences.
These diverse influences upon WTP suggest that simplistic models of preference formation are inadequate bases for CV studies. Rather an extended model of how individuals form preferences is required. Figure 2 provides such a conceptual framework. Here, in addition to the individual factors usually associated with WTP, we propose an extended set of individual factors and other, external influences. These extended individual factors may include attitudes and beliefs on risks and health in general, and be related to the respondents 'worldview', including perception of self, environment, and the future (Langford and McDonald, 1997). External influences may be divided up into contextual factors, which could include the characteristics of an
Individual factors Use Income Socioeconomic etc
- • Preferences
Extended individual factors
t Worldviews ^ _ Personal constructs of self, environment, and the future Risk attitudes and behaviour Health attitudes and behaviour
CV literature — Payment scenarios Loss aversion etc
External <^-influences *
t
WTP
Contextual factors For example, characteristics of home area, local environment, etc
Cultural influences Cultural theory: cultural types ethnographic differences, etc
- • Social relations Family Work Leisure
Figure 2. Extending the contingent valuation (CV) model beyond individual and immediate influences. WTP, willingness to pay.

A case study of bathing water quality 593
individuals local environment, or the locations they choose to visit, and cultural factors. Cultural factors may be seen in ethnographic terms, or be based on theoretical considerations of cultural stereotype (cultural theory) for which there is at least limited evidence of empirical investigation (Dake, 1991; Marris et al, 1996; Sjoberg, 1995). In addition, social relations, via family, work, and leisure may play an important par t in determining preferences. Through social relations we are extending the idea that, for example, membership of an aquatic sports club may increase an individuals W T P for water quality. We hypothesise that membership may also influence or frame the individuals worldview and/or be a result of this via his or her cultural background, and hence influence preferences in a much more subtle and holistic way than simple cause and effect. We believe that investigation of factors such as these is vital to the development of CV and other stated preference techniques as methods of analysis.
Acknowledgements. The Centre for Social and Economic Research on the Global Environment is a designated research centre of the UK Economic and Social Research Council. This research was funded by ESRC Grant Number L320223014. The authors are grateful to two anonymous referees for their comments on earlier drafts of this paper. Any errors remain the responsibility of the authors.
References Bateman I, Langford I H, 1995, "Design effects in contingent valuation studies: mental account
and temporal ordering effects", Global Environmental Change WP-95-02, Centre for Social and Economic Research on the Global Environment, University of East Anglia, Norwich, Norfolk and University College London, London
Bateman I J, Langford I H, Turner R K, Willis K G, Garrod G D, 1995, "Elicitation and truncation effects in contingent valuation studies" Ecological Economics 12 161 -179
Bateman I J, Langford I H, Willis K G, Turner R K, Garrod G D, 1993, "The impacts of changing willingness to pay question format in contingent valuation studies: an analysis of open-ended, iterative bidding and dichotomous choice formats", Global Environmental Change, WP-93-05, Centre for Social and Economic Research on the Global Environment, University of East Anglia, Norwich, Norfolk and University College London, London
Bateman I J, Turner R K, 1993, "Valuation of the environment, methods and techniques: the contingent valuation method", in Sustainable Economics and Management: Principles and Practice Ed. R K Turner (Belhaven Press, London) pp 120 -191
Brown T, Slovic P, 1988, "Effects of context on economic measures of values", in Amenity Resource Valuation: Integrating Economics with Other Disciplines Eds G L Peterson, B L Driver, R Gregory, Venture State College, PA, pp 23-30
CEC, 1976, "Council directive of 8 December 1975 concerning the quality of bathing water", 76/160/EEC, Commission of the European Communities OfficialJournal of the European Communities number L 31/1, 5 February 1976
Dake K, 1991, "Orienting dispositions in the perception of risk"Journaloj* Cross-CulturalPsychology 22 61-82
Georgiou S, Langford I, Bateman I, Turner K, 1996a, "Determinants of individuals willingness to pay for reductions in environmental health risks: a case study of bathing water quality", CSERGE WP GEC 96-14, Centre for Social and Economic Research on the Global Environment, University of East Anglia, Norwich, Norfolk and University College London, London
Georgiou S, Langford I, Bateman I, Turner K, 1996b, "Willingness to pay for improved coastal bathing water quality: a contingent valuation study", report submitted to House of Lords European Communities Committee, Centre for Social and Economic Research on the Global Environment, University of East Anglia, Norwich, Norfolk and University College London, London
House of Lords Select Committee on the European Communities, 1994 Bathing Water 1st Report (session 1994-95) HL Paper 6-1 (The Stationery Office, London)
Jones-Lee M J, 1985 The Economics of Safety and Physical Risk (Basil Blackwell, Oxford) Kahneman D, Knetsch J L, 1992, "Valuing public goods: the purchase of moral satisfaction"
Journal of Environmental Economics and Management 22 pp 57 - 70

594 S Georgiou, I H Langford, I J Bateman, R K Turner
Langford I H, McDonald A-L, 1997, "Risk perception, health and environmental change: a conceptual model", CSERGE GEC Working Paper, University of East Anglia, Norwich, Norfolk, in the press
Maddala G S, 1989 Introduction to Econometrics (Macmillan, New York) Marris C, O'RiordanT, Langford 1,1996,"Integrating sociological approaches to public perceptions
of environmental risks: detailed results from a questionnaire survey", CSERGE Working Paper GEC 96-07, University of East Anglia, Norwich, Norfolk
Ramchandani R, Pearce D W, 1992, "Alternative approaches to setting effluent quality standards: precautionary, critical load, and cost benefit approaches", CSERGE Working Paper WM 92-04, University College London, London
Sjoberg L, 1995, "Explaining risk perception: an empirical and quantitative evaluation of cultural theory" RHIZIKONRisk Research Reports, Report No. 22 Center for Risk Research, Stockholm School of Economics, Stockholm
Slovic P, Fischoff B, Lichtenstein S, 1981, "Perceived risk: psychological factors and social implications", in The Assessment and Perception of Risk Ed. F Warner Proceedings of the Royal Society 376 17 - 3 4
UNEP, 1991 Epidemiological Studies Related to Environmental Quality Criteria for Bathing Waters MAP Technical Report No. 53, Mediterranean Action Plan, United Nations Environment Programme, Athens
Viscusi W K, 1992 Fatal Tradeoffs (Oxford University Press, New York) Wallston K A, Wallston B S, DeVellis R, 1978, "Development of the multidimensional health locus
of control scales" Health Education Monographs 6 160 -170
p © 1998 a Pion publication printed in Great Britain