consumer and retail industry update - harris … 2013 consumer and retail industry update 1 of 16...
TRANSCRIPT

www.harriswilliams.com
Member FINRA/SIPC
Consumer and Retail
Industry Update July 2013
July 2013
Consumer and Retail
Industry Update
1 of 16
GROUP OVERVIEW
Harris Williams & Co. is a leading
advisor to the consumer market.
Our significant experience covers a
broad range of end markets,
industries, and business models.
This particular report focuses on
trends and metrics in the following
areas:
• Catalog & Direct Marketing
• Consumer Durables
• Consumer Electronics
• E-tailing
• Footwear, Apparel, &
Accessories
• Home Furnishings
• Household Goods
• Infant & Juvenile Products
• Jewelry, Gifts, & Collectibles
• Lawn, Garden, & Pet Products
and Services
• Leisure & Outdoor Products
• Personal Care Products
• Specialty and Mass Merchant
Retailing
CONTACTS
John Neuner | Managing Director
+1 (804) 915-0125
Ryan Budlong | Director
+1 (612) 359-2722
Brent Spiller | Director
+1 (804) 915-0183
Corey Benjamin | Vice President
+1 (804) 932-1342
Matt Conaty | Vice President
+1 (415) 217-3423
www.harriswilliams.com
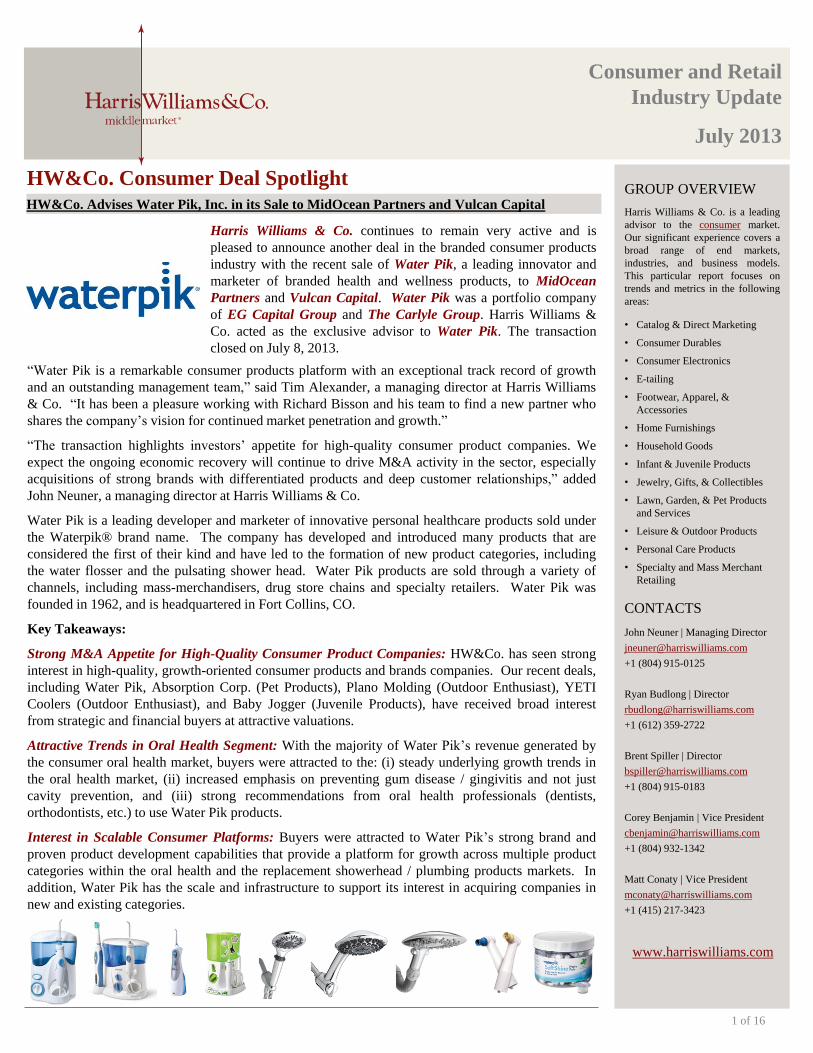
HW&Co. Consumer Deal Spotlight
HW&Co. Advises Water Pik, Inc. in its Sale to MidOcean Partners and Vulcan Capital
Harris Williams & Co. continues to remain very active and is
pleased to announce another deal in the branded consumer products
industry with the recent sale of Water Pik, a leading innovator and
marketer of branded health and wellness products, to MidOcean
Partners and Vulcan Capital. Water Pik was a portfolio company
of EG Capital Group and The Carlyle Group. Harris Williams &
Co. acted as the exclusive advisor to Water Pik. The transaction
closed on July 8, 2013.
“Water Pik is a remarkable consumer products platform with an exceptional track record of growth
and an outstanding management team,” said Tim Alexander, a managing director at Harris Williams
& Co. “It has been a pleasure working with Richard Bisson and his team to find a new partner who
shares the company’s vision for continued market penetration and growth.”
“The transaction highlights investors’ appetite for high-quality consumer product companies. We
expect the ongoing economic recovery will continue to drive M&A activity in the sector, especially
acquisitions of strong brands with differentiated products and deep customer relationships,” added
John Neuner, a managing director at Harris Williams & Co.
Water Pik is a leading developer and marketer of innovative personal healthcare products sold under
the Waterpik® brand name. The company has developed and introduced many products that are
considered the first of their kind and have led to the formation of new product categories, including
the water flosser and the pulsating shower head. Water Pik products are sold through a variety of
channels, including mass-merchandisers, drug store chains and specialty retailers. Water Pik was
founded in 1962, and is headquartered in Fort Collins, CO.
Key Takeaways:
Strong M&A Appetite for High-Quality Consumer Product Companies: HW&Co. has seen strong
interest in high-quality, growth-oriented consumer products and brands companies. Our recent deals,
including Water Pik, Absorption Corp. (Pet Products), Plano Molding (Outdoor Enthusiast), YETI
Coolers (Outdoor Enthusiast), and Baby Jogger (Juvenile Products), have received broad interest
from strategic and financial buyers at attractive valuations.
Attractive Trends in Oral Health Segment: With the majority of Water Pik’s revenue generated by
the consumer oral health market, buyers were attracted to the: (i) steady underlying growth trends in
the oral health market, (ii) increased emphasis on preventing gum disease / gingivitis and not just
cavity prevention, and (iii) strong recommendations from oral health professionals (dentists,
orthodontists, etc.) to use Water Pik products.
Interest in Scalable Consumer Platforms: Buyers were attracted to Water Pik’s strong brand and
proven product development capabilities that provide a platform for growth across multiple product
categories within the oral health and the replacement showerhead / plumbing products markets. In
addition, Water Pik has the scale and infrastructure to support its interest in acquiring companies in
new and existing categories.
July 2013
Discount Stores & Mass Merchants
Apparel & Footwear Retail
S&P 500
Department Chains
Recreational & Leisure Products
Personal Care Products
Apparel & Footwear
Consumer & Retail Index
Catalog & Specialty Distribution
Internet Retail
Specialty & Other Retail
Automotive Products
Furniture & Furnishings Retailers
Household Products
Home & Office Furniture & Furnishings
(20.0%) (10.0%) 0.0% 10.0% 20.0% 30.0% 40.0% 50.0% 60.0%
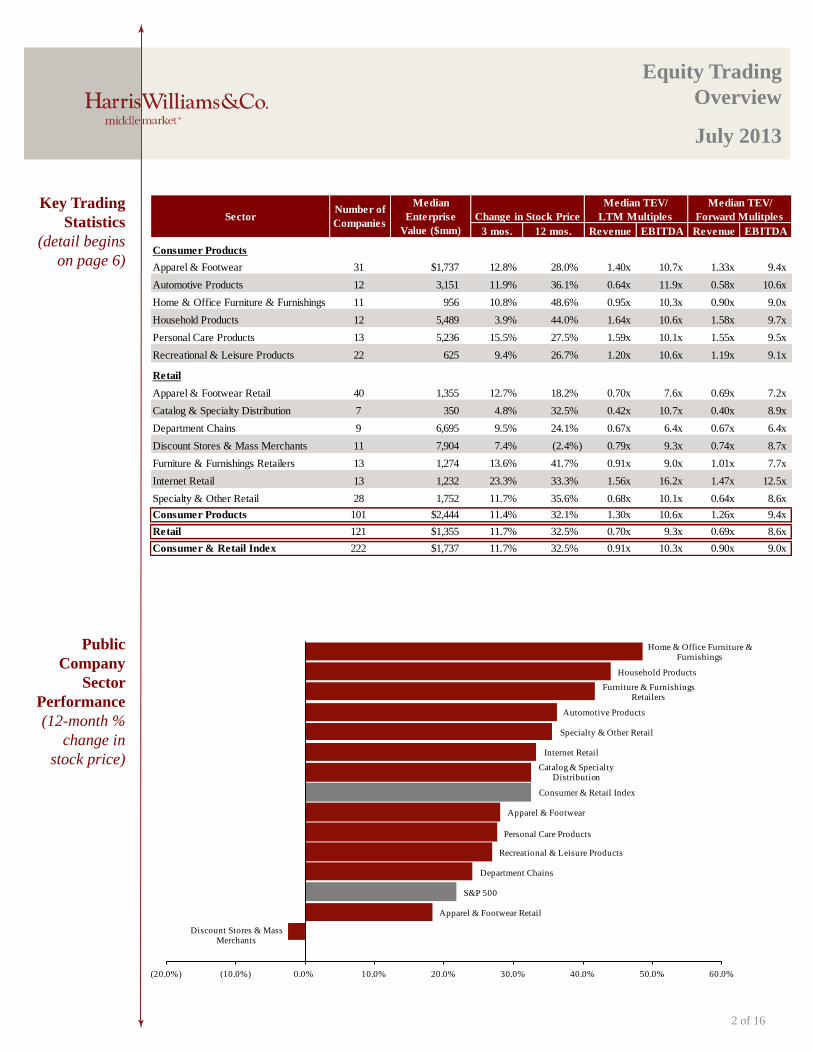
Equity Trading
Overview
Key Trading
Statistics
(detail begins
on page 6)
Public
Company
Sector
Performance
(12-month %
change in
stock price)
2 of 16
Change in Stock Price
3 mos. 12 mos. Revenue EBITDA Revenue EBITDA
Consumer Products
Apparel & Footwear 31 $1,737 12.8% 28.0% 1.40x 10.7x 1.33x 9.4x
Automotive Products 12 3,151 11.9% 36.1% 0.64x 11.9x 0.58x 10.6x
Home & Office Furniture & Furnishings 11 956 10.8% 48.6% 0.95x 10.3x 0.90x 9.0x
Household Products 12 5,489 3.9% 44.0% 1.64x 10.6x 1.58x 9.7x
Personal Care Products 13 5,236 15.5% 27.5% 1.59x 10.1x 1.55x 9.5x
Recreational & Leisure Products 22 625 9.4% 26.7% 1.20x 10.6x 1.19x 9.1x
Retail
Apparel & Footwear Retail 40 1,355 12.7% 18.2% 0.70x 7.6x 0.69x 7.2x
Catalog & Specialty Distribution 7 350 4.8% 32.5% 0.42x 10.7x 0.40x 8.9x
Department Chains 9 6,695 9.5% 24.1% 0.67x 6.4x 0.67x 6.4x
Discount Stores & Mass Merchants 11 7,904 7.4% (2.4%) 0.79x 9.3x 0.74x 8.7x
Furniture & Furnishings Retailers 13 1,274 13.6% 41.7% 0.91x 9.0x 1.01x 7.7x
Internet Retail 13 1,232 23.3% 33.3% 1.56x 16.2x 1.47x 12.5x
Specialty & Other Retail 28 1,752 11.7% 35.6% 0.68x 10.1x 0.64x 8.6x
Consumer Products 101 $2,444 11.4% 32.1% 1.30x 10.6x 1.26x 9.4x
Retail 121 $1,355 11.7% 32.5% 0.70x 9.3x 0.69x 8.6x
Consumer & Retail Index 222 $1,737 11.7% 32.5% 0.91x 10.3x 0.90x 9.0x
SectorNumber of
Companies
Median
Enterprise
Value ($mm)
Median TEV/
Forward Mulitples
Median TEV/
LTM Multiples

July 2013
80.0%
91.5%
114.6%
Close Date Filing Date Issuer Ticker
Transaction
Type
Gross Proceeds
($mm) Use of Funds
06/26/13 05/13/13 Five Below Inc FIVE Follow-On $248.4 General Corp. Purp.
06/12/13 06/12/13 Coty Inc COTY IPO 1,000.0 General Corp. Purp.
06/12/13 05/29/13 Bright Horizons Family BFAM Follow-On 323.1 General Corp. Purp.
06/06/13 06/06/13 Jarden Corp JAH Convertible 265.2 General. Corp. Purp. /
Working Capital
06/05/13 06/03/13 KAR Auction Services Inc KAR Follow-On 366.6 General Corp. Purp.
05/15/13 05/13/13 Shutterfly Inc SFLY Convertible 300.0 General. Corp. Purp. /
Working Capital
05/14/13 04/26/13 Restoration Hardware Hldg Inc RH Follow-On 498.7 General Corp. Purp.
05/06/13 03/28/11 Hertz Global Holdings Inc HTZ Follow-On 1,232.6 General Corp. Purp.
05/09/13 05/09/13 Claire's Inc CLRS Convertible 100.0 Repayment of Indebtedness
03/27/13 03/25/13 Dollar General Corp DG Follow-On 1,750.9 General. Corp. Purp. /
Working Capital
03/27/13 03/07/13 Tumi Holdings Inc TUMI Follow-On 246.0 General Corp. Purp.
03/26/13 03/26/13 Francesca's Holdings Corp FRAN Follow-On 211.9 General Corp. Purp.
03/12/13 03/12/13 Iconix Brand Group Inc ICON Convertible 400.0 General. Corp. Purp. /
Working Capital
02/20/13 02/19/13 Michael Kors Holdings Ltd KORS Follow-On 1,537.5 General Corp. Purp.
Recent Equity
Offerings
Equity Markets
Overview
Consumer
and Retail
Industry Stock
Performance
3 of 16
50
75
100
125
150
175
200
225
250
Jul-09 Jan-10 Jul-10 Jan-11 Jul-11 Jan-12 Jul-12 Jan-13 Jul-13
Ind
ex
Dow Jones Retail Index Dow Jones U.S. Consumer Goods Index S&P 500 Index

July 2013
10.9x11.2x
10.2x
9.7x
9.3x
9.8x
10.8x
11.3x
11.1x
11.3x11.5x
11.9x
9.1x
9.7x
9.3x9.2x
8.8x8.5x 8.6x
9.1x
11.1x
10.7x11.0x
11.2x
0.0x
2.0x
4.0x
6.0x
8.0x
10.0x
12.0x
Med
ian
Tra
din
g M
ult
iple
s
Consumer Products Retail
Aggregate Number Transaction Multiples
Value ($bn) of Deals EV / Revenue EV / EBITDA
$25.8 450 0.95x 8.6x
Announced Target Buyer
7/1/2013 Penguin Brands, Inc. Assets Implus Corporation
7/1/2013 Steinway Musical Instruments Inc. Kohlberg & Company, L.L.C.
6/28/2013 Royal Auto Glass, Inc. ABRA, Inc.
6/27/2013 Mindware Holdings, Inc. Oriental Trading Company, Inc.
6/24/2013 Battlefield Collection Inc. Alleson Athletic, Inc.
6/18/2013 Wally's Wine & Spirits Southwest Wine & Spirits, LLC
6/17/2013 Orchard Supply Hardware Stores Lowe's Companies Inc.
6/14/2013 Portico Brand Group Hilco Consumer Capital
6/14/2013 Kukdong Apparel Inc. Kukdong Corp.
6/13/2013 The Bargain! Shop Holdings Inc. BlackRock Kelso Capital Corporation
11.0x 10.3x
8.9x 8.4x
10.7x 10.0x
9.4x
0.00x
0.25x
0.50x
0.75x
1.00x
1.25x
1.50x
1.75x
0.0x
2.0x
4.0x
6.0x
8.0x
10.0x
12.0x
14.0x
16.0x
2007 2008 2009 2010 2011 2012 2013 YTD
EV
/ LT
M S
ale
s Mu
ltiple_
_EV
/ L
TM
EB
ITD
A M
ult
iple
__
EV / LTM EBITDA EV / LTM Sales
$79.7
$22.1 $28.6 $29.7
$40.3 $38.3
$8.5
0
50
100
150
200
250
300
350
400
450
$0
$20
$40
$60
$80
$100
$120
2007 2008 2009 2010 2011 2012 2013 YTD
Nu
mb
er o
f Tra
nsa
ctio
ns_
_
Ag
greg
ate
Tra
nsa
cti
on
Valu
e (
$ in
bil
lio
ns)
Aggregate Deal Value # of Deals
81
73
97
111
72
31
37
53
73
35
53 5459
71
48
28
59
53
76
18
0
20
40
60
80
100
120
2004 2005 2006 2007 2008 2009 2010 2011 2012 2013 YTD
Nu
mb
er o
f In
ves
tmen
ts'
Number of Investments Number of Exits
49
37
6572 72
6156 56 55
63
47
63 66
98
127
77
57
11
10
4
6 9
510 13 13
12
10
18 14
20
23
16
13
0
20
40
60
80
100
120
140
160
2Q09 3Q09 4Q09 1Q10 2Q10 3Q10 4Q10 1Q11 2Q11 3Q11 4Q11 1Q12 2Q12 3Q12 4Q12 1Q13 2Q13
Nu
mb
er o
f T
ra
nsa
cti
on
s__
PEG Acquirer Strategic Acquirer
Announced Consumer Transactions Median Consumer Transaction Multiples
Consumer Private Equity Investments and Exits Median LTM Trading Multiples
Last 10 Deals Announced Quarterly Consumer M&A Activity
LTM Deal Statistics
Note: Transactions based on publicly available information
M&A
Overview
Announced
Consumer
and Retail
M&A
Consumer and
Retail M&A
Trends
Median LTM
Trading
Multiples and
Announced
Private Equity
M&A Activity
4 of 16
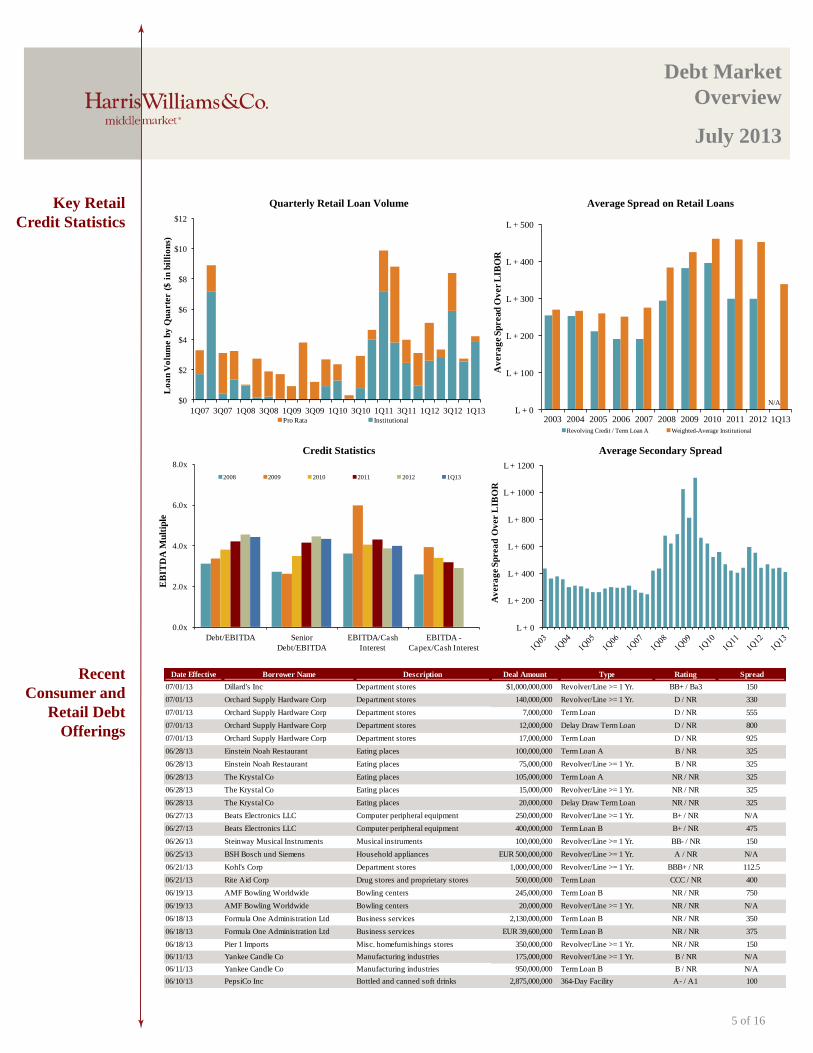
July 2013
0.0x
2.0x
4.0x
6.0x
8.0x
Debt/EBITDA Senior
Debt/EBITDA
EBITDA/Cash
Interest
EBITDA -
Capex/Cash Interest
EB
ITD
A M
ult
iple
2008 2009 2010 2011 2012 1Q13
L + 0
L + 200
L + 400
L + 600
L + 800
L + 1000
L + 1200
Av
era
ge S
prea
d O
ver L
IBO
R
N/A
L + 0
L + 100
L + 200
L + 300
L + 400
L + 500
2003 2004 2005 2006 2007 2008 2009 2010 2011 2012 1Q13
Av
era
ge
Sp
read
Ov
er
LIB
OR
__
Revolving Credit / Term Loan A Weighted-Average Institutional
$0
$2
$4
$6
$8
$10
$12
1Q07 3Q07 1Q08 3Q08 1Q09 3Q09 1Q10 3Q10 1Q11 3Q11 1Q12 3Q12 1Q13
Lo
an
Vo
lum
e b
y Q
ua
rte
r (
$ i
n b
illi
on
s)_
__
Pro Rata Institutional
Key Retail
Credit Statistics
Recent
Consumer and
Retail Debt
Offerings
Average Secondary Spread
Average Spread on Retail Loans
Credit Statistics
Quarterly Retail Loan Volume
Debt Market
Overview
5 of 16
Date Effective Borrower Name Description Deal Amount Type Rating Spread
07/01/13 Dillard's Inc Department stores $1,000,000,000 Revolver/Line >= 1 Yr. BB+ / Ba3 150
07/01/13 Orchard Supply Hardware Corp Department stores 140,000,000 Revolver/Line >= 1 Yr. D / NR 330
07/01/13 Orchard Supply Hardware Corp Department stores 7,000,000 Term Loan D / NR 555
07/01/13 Orchard Supply Hardware Corp Department stores 12,000,000 Delay Draw Term Loan D / NR 800
07/01/13 Orchard Supply Hardware Corp Department stores 17,000,000 Term Loan D / NR 925
06/28/13 Einstein Noah Restaurant Eating places 100,000,000 Term Loan A B / NR 325
06/28/13 Einstein Noah Restaurant Eating places 75,000,000 Revolver/Line >= 1 Yr. B / NR 325
06/28/13 The Krystal Co Eating places 105,000,000 Term Loan A NR / NR 325
06/28/13 The Krystal Co Eating places 15,000,000 Revolver/Line >= 1 Yr. NR / NR 325
06/28/13 The Krystal Co Eating places 20,000,000 Delay Draw Term Loan NR / NR 325
06/27/13 Beats Electronics LLC Computer peripheral equipment 250,000,000 Revolver/Line >= 1 Yr. B+ / NR N/A
06/27/13 Beats Electronics LLC Computer peripheral equipment 400,000,000 Term Loan B B+ / NR 475
06/26/13 Steinway Musical Instruments Musical instruments 100,000,000 Revolver/Line >= 1 Yr. BB- / NR 150
06/25/13 BSH Bosch und Siemens Household appliances EUR 500,000,000 Revolver/Line >= 1 Yr. A / NR N/A
06/21/13 Kohl's Corp Department stores 1,000,000,000 Revolver/Line >= 1 Yr. BBB+ / NR 112.5
06/21/13 Rite Aid Corp Drug stores and proprietary stores 500,000,000 Term Loan CCC / NR 400
06/19/13 AMF Bowling Worldwide Bowling centers 245,000,000 Term Loan B NR / NR 750
06/19/13 AMF Bowling Worldwide Bowling centers 20,000,000 Revolver/Line >= 1 Yr. NR / NR N/A
06/18/13 Formula One Administration Ltd Business services 2,130,000,000 Term Loan B NR / NR 350
06/18/13 Formula One Administration Ltd Business services EUR 39,600,000 Term Loan B NR / NR 375
06/18/13 Pier 1 Imports Misc. homefurnishings stores 350,000,000 Revolver/Line >= 1 Yr. NR / NR 150
06/11/13 Yankee Candle Co Manufacturing industries 175,000,000 Revolver/Line >= 1 Yr. B / NR N/A
06/11/13 Yankee Candle Co Manufacturing industries 950,000,000 Term Loan B B / NR N/A
06/10/13 PepsiCo Inc Bottled and canned soft drinks 2,875,000,000 364-Day Facility A- / A1 100
Consumer and Retail
Industry Update
July 2013
6 of 16
Price at As a % of Market Cash & Enterprise LTM P/E
($ in millions, except per share data) Ticker 7/5/13 52-wk High Cap Debt Equiv. Value (EV) Revenue EBITDA 1 Year 3 Years Gross EBITDA Multiple Revenue EBITDA Revenue EBITDA
Consumer Products
Apparel & Footwear
Carter's, Inc. CRI $74.00 98.1% $4,384 $186 $398 $4,173 $2,421 $339 10.4% 13.8% 40.7% 14.0% 26.1x 1.72x 12.3x 1.56x 11.0x
Cherokee Inc. CHKE 13.10 85.7% 110 16 1 125 27 12 3.5% (5.3%) NM 45.1% 17.5x 4.61x 10.2x 4.37x NA
Coach, Inc. COH 57.45 90.8% 16,143 23 928 15,237 5,008 1,708 7.9% 13.4% 72.9% 34.1% 15.5x 3.04x 8.9x 2.83x 8.3x
Columbia Sportswear Company COLM 66.54 100.0% 2,281 0 375 1,907 1,685 181 (0.5%) 9.8% 42.8% 10.7% 21.5x 1.13x 10.6x 1.13x 11.6x
Crocs, Inc. CROX 17.06 91.7% 1,503 10 233 1,281 1,163 183 11.2% 19.7% 54.1% 15.8% 11.7x 1.10x 7.0x 1.00x 6.0x
Deckers Outdoor Corp. DECK 52.01 86.3% 1,792 10 65 1,737 1,432 220 0.9% 19.7% 44.9% 15.4% 15.5x 1.21x 7.9x 1.13x 7.7x
Delta Apparel Inc. DLA 15.96 89.5% 130 113 0 242 492 23 0.0% 6.9% 22.0% 4.6% 13.6x 0.49x 10.7x 0.48x 8.2x
G-III Apparel Group, Ltd. GIII 47.89 91.6% 969 95 21 1,044 1,443 119 14.2% 19.4% 32.9% 8.2% 16.7x 0.72x 8.8x 0.65x 7.9x
Gildemeister AG GIL 17.09 84.2% 997 12 173 837 2,062 159 16.0% 22.7% 45.1% 7.7% 12.9x 0.41x 5.3x NA NA
Hanesbrands Inc. HBI 52.52 99.3% 5,176 1,625 69 6,732 4,498 611 1.6% 4.3% 33.2% 13.6% 17.2x 1.50x 11.0x 1.46x 10.3x
Iconix Brand Group, Inc. ICON 30.49 97.7% 1,690 1,224 315 2,599 370 235 1.2% 13.5% NM 63.4% 18.4x 7.02x 11.1x 5.94x 9.4x
The Jones Group Inc. JNY 14.64 96.0% 1,173 1,019 45 2,147 3,871 201 2.9% 5.2% 35.5% 5.2% NM 0.55x 10.7x 0.55x 8.0x
Fifth & Pacific Companies, Inc. FNP 23.17 99.2% 2,779 439 7 3,211 1,560 43 3.6% (17.0%) 55.7% 2.8% NM 2.06x NM 1.75x 22.2x
Maidenform Brands, Inc. MFB 17.72 67.2% 413 68 47 433 574 49 (4.4%) 5.1% 30.3% 8.5% 15.6x 0.75x 8.9x 0.74x 7.6x
Nike Inc. NKE 63.64 96.3% 56,891 1,388 5,965 52,314 25,313 3,697 4.9% 10.0% 43.6% 14.6% 23.7x 2.07x 14.2x 1.90x 12.8x
Oxford Industries Inc. OXM 64.88 96.8% 1,063 165 28 1,200 859 96 9.9% 17.3% 54.7% 11.1% 40.0x 1.40x 12.6x 1.24x 10.3x
Perry Ellis International Inc. PERY 20.49 88.0% 307 182 46 444 966 59 0.9% 8.6% 32.9% 6.1% 19.1x 0.46x 7.6x 0.44x 6.7x
PVH Corp. PVH 126.86 98.7% 10,283 4,476 746 14,012 6,526 972 9.7% 38.4% 52.8% 14.9% 30.1x 2.15x 14.4x 1.68x 11.6x
Ralph Lauren Corporation RL 174.03 90.6% 15,819 305 1,298 14,826 6,945 1,390 1.2% 11.7% 59.8% 20.0% 21.8x 2.13x 10.7x 2.01x 10.2x
Quiksilver Inc. ZQK 6.95 85.4% 1,163 814 48 1,929 1,961 98 (1.5%) 0.3% 48.1% 5.0% NM 0.98x 19.6x 0.97x 12.0x
Rocky Brands, Inc. RCKY 15.35 93.5% 115 20 2 134 229 20 (5.0%) (1.0%) 35.4% 8.7% 12.8x 0.58x 6.7x 0.53x NA
Skechers USA Inc. SKX 24.73 98.4% 1,251 140 265 1,127 1,668 83 12.1% 1.7% 43.5% 5.0% NM 0.68x 13.5x 0.60x 7.9x
Steven Madden, Ltd. SHOO 49.89 99.7% 2,305 0 176 2,129 1,240 202 16.0% 32.9% 37.3% 16.3% 18.3x 1.72x 10.5x 1.58x 9.2x
Summer Infant, Inc. SUMR 3.09 82.8% 55 67 3 120 243 9 0.3% 14.4% 32.0% 3.7% NM 0.49x 13.3x 0.49x 8.2x
True Religion Apparel, Inc. TRLG 31.66 99.0% 810 0 194 616 481 85 11.2% 14.0% 63.2% 17.7% 22.2x 1.28x 7.2x 1.17x 6.4x
Tumi Holdings, Inc. TUMI 24.23 89.8% 1,644 33 28 1,650 421 88 22.5% NA 57.2% 21.0% 36.6x 3.91x 18.7x 3.34x 14.5x
Under Armour, Inc. UA 61.22 93.4% 6,432 60 256 6,237 1,922 242 24.5% 29.5% 47.9% 12.6% NM 3.24x 25.8x 2.66x 18.9x
V.F. Corporation VFC 196.28 99.3% 21,497 2,014 300 23,211 10,935 1,783 8.7% 14.7% 47.1% 16.3% 19.2x 2.12x 13.0x 1.98x 11.7x
Vera Bradley, Inc. VRA 21.76 70.2% 884 5 8 880 547 117 14.8% 21.8% 56.9% 21.3% 13.5x 1.61x 7.5x 1.50x 6.6x
Weyco Group Inc. WEYS 25.95 100.0% 280 38 21 298 292 29 3.7% 8.7% 39.3% 9.9% 15.4x 1.02x 10.3x 0.98x NA
Wolverine World Wide Inc. WWW 55.55 99.5% 2,787 1,258 82 3,964 1,964 222 40.2% 20.2% 39.0% 11.3% 34.8x 2.02x 17.9x 1.43x 13.9x
Mean 92.2% $5,262 $510 $392 $5,380 $2,875 $428 7.8% 12.5% 44.9% 15.0% 20.4x 1.75x 11.6x 1.60x 10.3x
Median 93.5% $1,503 $95 $69 $1,737 $1,443 $159 4.9% 13.5% 43.6% 12.6% 18.3x 1.40x 10.7x 1.33x 9.4x
Automotive Products
America's Car-Mart Inc. CRMT $44.15 87.3% $399 $101 $0 $500 $465 $56 8.0% 11.1% 27.9% 12.2% 13.1x 1.08x 8.9x 0.96x 8.0x
Asbury Automotive Group, Inc. ABG 41.94 95.3% 1,307 1,002 0 2,309 4,796 217 14.9% 11.4% 16.4% 4.5% 14.6x 0.48x 10.7x 0.45x 9.9x
AutoNation Inc. AN 46.14 94.3% 5,598 4,498 46 10,050 16,108 766 13.6% 13.2% 15.8% 4.8% 17.4x 0.62x 13.1x 0.58x 12.2x
AutoZone, Inc. AZO 428.52 98.4% 15,221 4,001 155 19,067 8,816 1,920 3.9% 7.2% 51.8% 21.8% 16.5x 2.16x 9.9x 2.01x 9.0x
CarMax Inc. KMX 47.33 96.9% 10,609 6,718 725 16,602 11,811 871 13.9% 13.2% 15.6% 7.4% 23.8x 1.41x 19.1x 1.30x 17.4x
Group 1 Automotive Inc. GPI 66.12 95.2% 1,537 1,861 18 3,380 7,775 282 22.7% 18.3% 14.9% 3.6% 16.2x 0.43x 12.0x 0.38x 10.5x
EV / LTM EV / 2013ERevenue Growth LTM MarginsLast Twelve Months (LTM)

Consumer and Retail
Industry Update
July 2013
7 of 16
Price at As a % of Market Cash & Enterprise LTM P/E
($ in millions, except per share data) Ticker 7/5/13 52-wk High Cap Debt Equiv. Value (EV) Revenue EBITDA 1 Year 3 Years Gross EBITDA Multiple Revenue EBITDA Revenue EBITDA
Automotive Products (Cont.)
Lithia Motors Inc. LAD $57.09 99.9% $1,465 $817 $15 $2,268 $3,481 $175 24.9% 23.9% 16.1% 5.0% 17.3x 0.65x 13.0x 0.58x 11.6x
Monro Muffler Brake Inc. MNRO 50.01 98.7% 1,569 192 1 1,759 732 101 6.6% 9.0% 38.0% 13.8% 38.0x 2.40x 17.4x 2.03x 13.7x
O'Reilly Automotive Inc. ORLY 115.75 99.7% 12,787 1,096 205 13,677 6,238 1,158 5.1% 7.9% 50.2% 18.6% 23.3x 2.19x 11.8x 2.03x 10.8x
Penske Automotive Group, Inc. PAG 31.89 92.9% 2,880 3,061 32 5,909 13,407 431 16.1% 11.1% 15.3% 3.2% 14.4x 0.44x 13.7x 0.41x 12.7x
Pep Boys - Manny, Moe & Jack PBY 11.85 93.3% 630 350 56 924 2,102 114 1.3% 3.0% 28.3% 5.4% 40.9x 0.44x 8.1x 0.43x 6.4x
Sonic Automotive Inc. SAH 21.70 85.1% 1,149 1,777 4 2,922 8,522 289 11.7% 11.1% 14.6% 3.4% 13.4x 0.34x 10.1x 0.32x 9.8x
Mean 94.7% $4,596 $2,123 $105 $6,614 $7,021 $532 11.9% 11.7% 25.4% 8.6% 20.7x 1.05x 12.3x 0.96x 11.0x
Median 95.3% $1,553 $1,436 $25 $3,151 $7,006 $285 12.7% 11.1% 16.3% 5.2% 16.9x 0.64x 11.9x 0.58x 10.6x
Home & Office Furniture & Furnishings
Furniture Brands International Inc. FBN $4.17 32.7% $34 $117 $10 $140 $1,040 ($28) (5.2%) (4.4%) 21.6% NM NM 0.13x NM 0.13x NM
Herman Miller Inc. MLHR 28.13 97.3% 1,640 250 94 1,796 1,775 154 2.9% 10.4% 34.1% 8.7% 24.3x 1.01x 11.7x 0.94x 8.8x
HNI Corp. HNI 38.28 99.4% 1,740 199 38 1,901 2,001 133 6.3% 8.0% 34.5% 6.7% 34.8x 0.95x 14.3x 0.90x 11.9x
Hooker Furniture Corp. HOFT 17.20 93.9% 184 0 29 156 223 17 3.3% 3.2% 24.9% 7.7% 19.0x 0.70x 9.0x 0.65x 8.7x
Kimball International, Inc. KBAL.B 10.72 80.9% 320 2 90 232 1,175 60 3.5% 2.1% 18.9% 5.1% 21.8x 0.20x 3.9x 0.19x NA
Knoll Inc. KNL 14.75 78.9% 692 193 13 872 891 99 (0.7%) 6.3% 33.1% 11.1% 14.2x 0.98x 8.8x 0.96x 9.2x
Leggett & Platt, Incorporated LEG 31.27 91.2% 4,468 1,155 449 5,174 3,710 459 0.6% 5.6% 20.5% 12.4% 18.3x 1.39x 11.3x 1.34x 9.9x
Libbey Inc. LBY 25.51 99.7% 536 466 46 956 824 133 (0.3%) 2.5% 24.1% 16.2% NM 1.16x 7.2x 1.12x 6.6x
Steelcase Inc. SCS 14.94 95.8% 1,851 288 147 1,992 2,861 213 2.7% 7.7% 31.1% 7.4% 49.8x 0.70x 9.3x 0.66x 7.8x
Tempur Sealy International Inc. TPX 44.49 87.2% 2,685 2,000 92 4,593 1,409 269 (4.6%) 15.8% 49.5% 19.1% 43.9x 3.26x 17.1x 1.62x 9.7x
The Dixie Group, Inc. DXYN 8.60 91.7% 109 87 0 196 279 12 4.5% 10.6% 24.4% 4.4% NM 0.70x 16.1x 0.64x NA
Mean 86.2% $1,296 $433 $92 $1,637 $1,472 $138 1.2% 6.2% 28.8% 9.9% 28.3x 1.02x 10.9x 0.83x 9.1x
Median 91.7% $692 $199 $46 $956 $1,175 $133 2.7% 6.3% 24.9% 8.2% 23.0x 0.95x 10.3x 0.90x 9.0x
Household Products
Central Garden & Pet Company CENT $7.09 56.2% $342 $594 $29 $907 $1,722 $111 5.6% 3.4% 30.0% 6.5% 17.7x 0.53x 8.1x 0.52x 7.8x
Helen of Troy Limited HELE 40.61 98.0% 1,299 262 13 1,548 1,288 183 9.0% 25.8% 40.2% 14.2% 11.2x 1.20x 8.4x 1.19x 8.1x
iRobot Corporation IRBT 40.39 98.2% 1,142 0 137 1,004 445 49 (2.7%) 9.7% 43.0% 11.1% 45.9x 2.26x 20.3x 1.98x 16.7x
Jarden Corp. JAH 44.45 90.2% 5,001 3,866 580 8,288 6,781 729 1.3% 9.2% 28.9% 10.7% 24.7x 1.22x 11.4x 1.17x 9.4x
Newell Rubbermaid Inc. NWL 26.12 91.7% 7,536 2,113 174 9,474 5,893 898 0.9% 1.2% 37.6% 15.2% 19.9x 1.61x 10.6x 1.64x 10.1x
Prestige Brands Holdings, Inc. PBH 30.16 85.7% 1,543 971 16 2,498 624 208 41.4% 28.7% 55.7% 33.3% 23.7x 4.01x 12.0x 3.99x 11.4x
Snap-on Inc. SNA 92.07 98.7% 5,365 979 209 6,135 3,112 611 2.6% 8.2% 49.0% 19.6% 17.1x 1.97x 10.0x 1.98x 9.4x
Stanley Black & Decker, Inc. SWK 79.07 95.0% 12,803 4,872 578 17,096 10,252 1,613 7.9% 35.9% 36.5% 15.7% 30.5x 1.67x 10.6x 1.53x 9.9x
The Clorox Company CLX 83.82 93.0% 11,036 2,561 423 13,174 5,617 1,141 3.8% 1.9% 42.5% 20.3% 19.7x 2.35x 11.5x 2.29x 11.0x
Toro Co. TTC 47.25 95.7% 2,717 224 80 2,861 1,993 283 0.4% 8.1% 35.6% 14.2% 18.8x 1.44x 10.1x 1.36x 9.7x
Tupperware Brands Corporation TUP 80.22 94.1% 4,243 748 147 4,843 2,607 449 0.7% 5.5% 66.8% 17.2% 23.2x 1.86x 10.8x 1.76x 9.8x
Whirlpool Corp. WHR 114.50 85.4% 9,065 2,452 750 10,767 18,043 1,641 (3.1%) 0.4% 16.2% 9.1% 16.3x 0.60x 6.6x 0.58x 5.8x
Mean 90.2% $5,174 $1,637 $261 $6,550 $4,865 $660 5.7% 11.5% 40.2% 15.6% 22.4x 1.72x 10.9x 1.66x 9.9x
Median 93.6% $4,622 $975 $161 $5,489 $2,859 $530 2.0% 8.1% 38.9% 14.7% 19.8x 1.64x 10.6x 1.58x 9.7x
Personal Care Products
All for One Steeb AG XTRA:A1OS $15.10 89.3% $73 $32 $14 $91 $170 $14 43.9% 36.9% 21.8% 8.5% 20.7x 0.53x 6.3x NA NA
Avon Products Inc. AVP 21.00 85.6% 9,095 3,251 1,009 11,337 11,427 1,518 1.7% 3.0% 61.4% 13.3% NM 0.99x 7.5x 1.06x 9.6x
Revenue GrowthLast Twelve Months (LTM) LTM Margins EV / LTM EV / 2013E

Consumer and Retail
Industry Update
July 2013
8 of 16
Price at As a % of Market Cash & Enterprise LTM P/E
($ in millions, except per share data) Ticker 7/5/13 52-wk High Cap Debt Equiv. Value (EV) Revenue EBITDA 1 Year 3 Years Gross EBITDA Multiple Revenue EBITDA Revenue EBITDA
Personal Care Products (Cont.)
Elizabeth Arden, Inc. RDEN $47.30 95.1% $1,383 $366 $39 $1,710 $1,342 $158 9.5% 7.3% 50.2% 11.8% 29.1x 1.27x 10.8x 1.19x 9.4x
The Estée Lauder Companies Inc. EL 67.93 93.4% 26,348 1,349 1,439 26,258 10,026 1,831 5.3% 9.5% 80.2% 18.3% 27.4x 2.62x 14.3x 2.46x 12.7x
Herbalife Ltd. HLF 48.39 85.8% 4,982 977 722 5,236 4,232 753 16.8% 20.5% 47.4% 17.8% 11.3x 1.24x 7.0x 1.10x 6.5x
Kimberly-Clark Corporation KMB 97.39 91.4% 37,457 7,028 1,109 43,376 21,140 4,174 0.4% 2.8% 34.2% 19.7% 21.2x 2.05x 10.4x 2.02x 10.4x
Medifast Inc. MED 27.02 81.2% 373 1 69 305 364 44 16.3% 23.0% 75.2% 12.1% 20.9x 0.84x 6.9x 0.77x 5.9x
Nu Skin Enterprises Inc. NUS 63.71 99.2% 3,721 195 334 3,583 2,258 384 24.7% 17.3% 83.7% 17.0% 17.3x 1.59x 9.3x 1.38x 8.0x
Procter & Gamble Co. PG 78.34 94.9% 214,712 32,223 5,876 241,059 83,724 19,700 (0.2%) 2.3% 50.4% 23.5% 19.8x 2.88x 12.2x 2.81x 12.2x
Revlon, Inc. REV 24.79 99.4% 1,298 1,281 121 2,458 1,427 244 3.5% 3.2% 64.5% 17.1% 36.8x 1.72x 10.1x 1.71x 8.3x
Sally Beauty Holdings Inc. SBH 31.55 99.8% 5,357 1,638 62 6,933 3,573 571 4.2% 8.8% 49.6% 16.0% 22.2x 1.94x 12.1x 1.83x 10.6x
Ulta Salon, Cosmetics & Fragrance, Inc. ULTA 100.23 96.8% 6,391 0 293 6,098 2,329 382 24.9% 22.3% 35.1% 16.4% 35.9x 2.62x 16.0x 2.18x 12.8x
USANA Health Sciences Inc. USNA 73.99 97.0% 998 0 71 927 664 113 12.0% 13.1% 82.1% 17.0% 15.3x 1.40x 8.2x 1.28x 7.7x
Mean 93.0% $24,014 $3,719 $858 $26,875 $10,975 $2,299 12.5% 13.1% 56.6% 16.0% 23.2x 1.67x 10.1x 1.65x 9.5x
Median 94.9% $4,982 $977 $293 $5,236 $2,329 $384 9.5% 9.5% 50.4% 17.0% 21.0x 1.59x 10.1x 1.55x 9.5x
Recreational & Leisure Products
Arctic Cat Inc. ACAT $48.33 98.9% $639 $0 $113 $526 $672 $73 14.7% 14.2% 22.5% 10.8% 16.7x 0.78x 7.2x 0.70x 6.5x
Black Diamond, Inc. BDE 9.54 89.7% 303 41 4 341 180 7 17.8% 23.9% 38.9% 4.0% NM 1.89x 47.2x 1.48x 24.1x
Brunswick Corporation BC 33.72 90.2% 3,050 575 277 3,348 3,753 399 3.0% 9.2% 25.8% 10.6% 20.2x 0.89x 8.4x 0.84x 7.8x
Callaway Golf Co. ELY 6.77 92.7% 481 187 28 640 837 (39) (5.6%) (5.2%) 35.0% NM NM 0.76x NM 0.75x 27.0x
Columbia Sportswear Company COLM 66.54 100.0% 2,281 0 375 1,907 1,685 181 (0.5%) 9.8% 42.8% 10.7% 21.5x 1.13x 10.6x 1.13x 11.6x
Escalade Inc. ESCA 6.26 97.8% 84 22 4 102 149 16 8.8% 8.6% 30.1% 10.4% NM 0.69x 6.6x NA NA
Harley-Davidson, Inc. HOG 55.25 92.3% 12,399 5,295 808 16,886 5,722 1,262 3.7% 7.5% 38.6% 22.0% 18.6x 2.95x 13.4x 3.14x 11.7x
Hasbro Inc. HAS 46.61 95.2% 6,030 1,556 1,091 6,496 4,104 763 (3.7%) (0.1%) 50.8% 18.6% 18.5x 1.58x 8.5x 1.58x 8.2x
JAKKS Pacific, Inc. JAKK 11.29 67.6% 247 154 166 235 671 11 (1.1%) (4.6%) 30.0% 1.7% NM 0.35x 21.1x 0.34x 4.5x
Johnson Outdoors Inc. JOUT 25.13 100.0% 249 61 40 269 423 36 3.4% 5.2% 40.6% 8.5% 16.6x 0.64x 7.5x 0.59x 3.6x
LeapFrog Enterprises Inc. LF 10.57 86.1% 720 0 190 530 592 80 21.5% 14.7% 42.0% 13.5% 8.0x 0.90x 6.6x 0.84x 5.9x
Life Time Fitness Inc. LTM 50.99 97.3% 2,115 699 14 2,800 1,149 339 10.3% 10.6% 45.5% 29.5% 18.8x 2.44x 8.3x 2.26x 7.8x
Marine Products Corp. MPX 8.65 100.0% 330 0 8 322 155 9 32.7% 45.3% 17.6% 5.8% 46.7x 2.07x 36.0x 1.83x NA
Mattel, Inc. MAT 45.69 94.2% 15,781 1,655 1,260 16,177 6,488 1,386 3.9% 5.5% 53.6% 21.4% 19.9x 2.49x 11.7x 2.35x 10.7x
Nautilus Inc. NLS 9.41 99.1% 292 0 29 263 202 17 10.1% 3.7% 48.5% 8.5% 21.9x 1.30x 15.4x 1.19x 11.5x
Navarre Corp. NAVR 2.74 92.6% 154 24 0 178 485 10 0.9% (0.7%) 10.5% 2.1% NM 0.37x 17.2x 0.33x 9.1x
Polaris Industries, Inc. PII 96.67 98.7% 6,645 106 381 6,371 3,319 563 17.7% 26.7% 29.6% 17.0% 20.9x 1.92x 11.3x 1.68x 9.9x
Pool Corp. POOL 53.99 98.4% 2,515 282 13 2,784 1,962 166 6.5% 8.6% 28.9% 8.4% 31.6x 1.42x 16.8x 1.34x 15.1x
Quiksilver Inc. ZQK 6.95 85.4% 1,163 814 48 1,929 1,961 98 (1.5%) 0.3% 48.1% 5.0% NM 0.98x 19.6x 0.97x 12.0x
Smith & Wesson Holding Corporation SWHC 10.25 91.1% 660 46 97 609 588 150 42.6% 18.0% 37.3% 25.5% 8.4x 1.04x 4.1x 0.99x 4.0x
Steinway Musical Instruments Inc. LVB 35.43 99.2% 442 68 62 448 353 42 0.4% 5.0% 33.3% 12.0% 28.6x 1.27x 10.6x 1.24x NA
Sturm, Ruger & Co. Inc. RGR 47.94 79.8% 926 0 46 881 535 139 46.4% 24.8% 37.0% 25.9% 12.0x 1.64x 6.3x 1.56x 6.2x
Mean 93.0% $2,614 $527 $230 $2,911 $1,636 $259 10.6% 10.5% 35.8% 12.9% 20.5x 1.34x 14.0x 1.29x 10.4x
Median 94.7% $690 $64 $55 $625 $672 $89 5.2% 8.6% 37.1% 10.7% 19.3x 1.20x 10.6x 1.19x 9.1x
Revenue Growth LTM Margins EV / LTM EV / 2013ELast Twelve Months (LTM)
Consumer and Retail
Industry Update
July 2013
9 of 16
Price at As a % of Market Cash & Enterprise LTM P/E
($ in millions, except per share data) Ticker 7/5/13 52-wk High Cap Debt Equiv. Value (EV) Revenue EBITDA 1 Year 3 Years Gross EBITDA Multiple Revenue EBITDA Revenue EBITDA
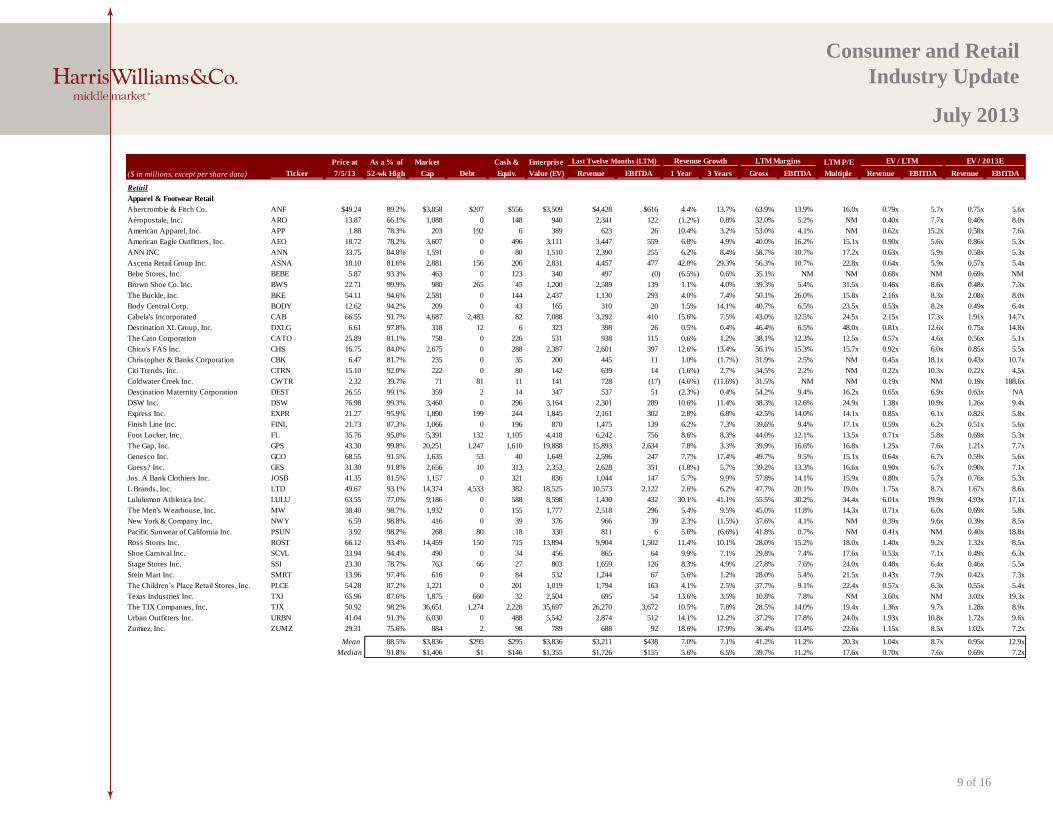
Retail
Apparel & Footwear Retail
Abercrombie & Fitch Co. ANF $49.24 89.2% $3,858 $207 $556 $3,509 $4,428 $616 4.4% 13.7% 63.9% 13.9% 16.0x 0.79x 5.7x 0.75x 5.6x
Aéropostale, Inc. ARO 13.87 66.1% 1,088 0 148 940 2,341 122 (1.2%) 0.8% 32.0% 5.2% NM 0.40x 7.7x 0.40x 8.0x
American Apparel, Inc. APP 1.88 78.3% 203 192 6 389 623 26 10.4% 3.2% 53.0% 4.1% NM 0.62x 15.2x 0.58x 7.6x
American Eagle Outfitters, Inc. AEO 18.72 78.2% 3,607 0 496 3,111 3,447 559 6.8% 4.9% 40.0% 16.2% 15.1x 0.90x 5.6x 0.86x 5.3x
ANN INC ANN 33.75 84.8% 1,591 0 80 1,510 2,390 255 6.2% 8.4% 58.7% 10.7% 17.2x 0.63x 5.9x 0.58x 5.3x
Ascena Retail Group Inc. ASNA 18.10 81.6% 2,881 156 206 2,831 4,457 477 42.0% 29.3% 56.3% 10.7% 22.8x 0.64x 5.9x 0.57x 5.4x
Bebe Stores, Inc. BEBE 5.87 93.3% 463 0 123 340 497 (0) (6.5%) 0.6% 35.1% NM NM 0.68x NM 0.69x NM
Brown Shoe Co. Inc. BWS 22.71 99.9% 980 265 45 1,200 2,589 139 1.1% 4.0% 39.3% 5.4% 31.5x 0.46x 8.6x 0.48x 7.3x
The Buckle, Inc. BKE 54.11 94.6% 2,581 0 144 2,437 1,130 293 4.0% 7.4% 50.1% 26.0% 15.8x 2.16x 8.3x 2.08x 8.0x
Body Central Corp. BODY 12.62 94.2% 209 0 43 165 310 20 1.5% 14.1% 40.7% 6.5% 23.5x 0.53x 8.2x 0.49x 6.4x
Cabela's Incorporated CAB 66.55 91.7% 4,687 2,483 82 7,088 3,292 410 15.6% 7.5% 43.0% 12.5% 24.5x 2.15x 17.3x 1.91x 14.7x
Destination XL Group, Inc. DXLG 6.61 97.8% 318 12 6 323 398 26 0.5% 0.4% 46.4% 6.5% 48.0x 0.81x 12.6x 0.75x 14.8x
The Cato Corporation CATO 25.89 81.1% 758 0 226 531 938 115 0.6% 1.2% 38.1% 12.3% 12.5x 0.57x 4.6x 0.56x 5.1x
Chico's FAS Inc. CHS 16.75 84.0% 2,675 0 288 2,387 2,601 397 12.6% 13.4% 56.1% 15.3% 15.7x 0.92x 6.0x 0.85x 5.5x
Christopher & Banks Corporation CBK 6.47 81.7% 235 0 35 200 445 11 1.0% (1.7%) 31.9% 2.5% NM 0.45x 18.1x 0.43x 10.7x
Citi Trends, Inc. CTRN 15.10 92.0% 222 0 80 142 639 14 (1.6%) 2.7% 34.5% 2.2% NM 0.22x 10.3x 0.22x 4.5x
Coldwater Creek Inc. CWTR 2.32 39.7% 71 81 11 141 728 (17) (4.6%) (11.6%) 31.5% NM NM 0.19x NM 0.19x 188.6x
Destination Maternity Corporation DEST 26.55 99.1% 359 2 14 347 537 51 (2.3%) 0.4% 54.2% 9.4% 16.2x 0.65x 6.9x 0.63x NA
DSW Inc. DSW 76.98 99.3% 3,460 0 296 3,164 2,301 289 10.6% 11.4% 38.3% 12.6% 24.9x 1.38x 10.9x 1.26x 9.4x
Express Inc. EXPR 21.27 95.9% 1,890 199 244 1,845 2,161 302 2.8% 6.8% 42.5% 14.0% 14.1x 0.85x 6.1x 0.82x 5.8x
Finish Line Inc. FINL 21.73 87.3% 1,066 0 196 870 1,475 139 6.2% 7.3% 39.6% 9.4% 17.1x 0.59x 6.2x 0.51x 5.6x
Foot Locker, Inc. FL 35.76 95.0% 5,391 132 1,105 4,418 6,242 756 8.6% 8.3% 44.0% 12.1% 13.5x 0.71x 5.8x 0.69x 5.3x
The Gap, Inc. GPS 43.30 99.8% 20,251 1,247 1,610 19,888 15,893 2,634 7.8% 3.3% 39.9% 16.6% 16.8x 1.25x 7.6x 1.21x 7.7x
Genesco Inc. GCO 68.55 91.5% 1,635 53 40 1,649 2,596 247 7.7% 17.4% 49.7% 9.5% 15.1x 0.64x 6.7x 0.59x 5.6x
Guess? Inc. GES 31.30 91.8% 2,656 10 313 2,353 2,628 351 (1.8%) 5.7% 39.2% 13.3% 16.6x 0.90x 6.7x 0.90x 7.1x
Jos. A Bank Clothiers Inc. JOSB 41.35 81.5% 1,157 0 321 836 1,044 147 5.7% 9.9% 57.8% 14.1% 15.9x 0.80x 5.7x 0.76x 5.3x
L Brands, Inc. LTD 49.67 93.1% 14,374 4,533 382 18,525 10,573 2,122 2.6% 6.2% 47.7% 20.1% 19.0x 1.75x 8.7x 1.67x 8.6x
Lululemon Athletica Inc. LULU 63.55 77.0% 9,186 0 588 8,598 1,430 432 30.1% 41.1% 55.5% 30.2% 34.4x 6.01x 19.9x 4.93x 17.1x
The Men's Wearhouse, Inc. MW 38.40 98.7% 1,932 0 155 1,777 2,518 296 5.4% 9.5% 45.0% 11.8% 14.3x 0.71x 6.0x 0.69x 5.8x
New York & Company Inc. NWY 6.59 98.8% 416 0 39 376 966 39 2.3% (1.5%) 37.6% 4.1% NM 0.39x 9.6x 0.39x 8.5x
Pacific Sunwear of California Inc. PSUN 3.92 98.2% 268 80 18 330 811 6 5.6% (6.6%) 41.8% 0.7% NM 0.41x NM 0.40x 18.8x
Ross Stores Inc. ROST 66.12 93.4% 14,459 150 715 13,894 9,904 1,502 11.4% 10.1% 28.0% 15.2% 18.0x 1.40x 9.2x 1.32x 8.5x
Shoe Carnival Inc. SCVL 23.94 94.4% 490 0 34 456 865 64 9.9% 7.1% 29.8% 7.4% 17.6x 0.53x 7.1x 0.49x 6.3x
Stage Stores Inc. SSI 23.30 78.7% 763 66 27 803 1,659 126 8.3% 4.9% 27.8% 7.6% 24.0x 0.48x 6.4x 0.46x 5.5x
Stein Mart Inc. SMRT 13.96 97.4% 616 0 84 532 1,244 67 5.6% 1.2% 28.0% 5.4% 21.5x 0.43x 7.9x 0.42x 7.3x
The Children’s Place Retail Stores, Inc. PLCE 54.28 87.2% 1,221 0 201 1,019 1,794 163 4.1% 2.5% 37.7% 9.1% 22.4x 0.57x 6.3x 0.55x 5.4x
Texas Industries Inc. TXI 65.96 87.6% 1,875 660 32 2,504 695 54 13.6% 3.5% 10.8% 7.8% NM 3.60x NM 3.02x 19.3x
The TJX Companies, Inc. TJX 50.92 98.2% 36,651 1,274 2,228 35,697 26,270 3,672 10.5% 7.8% 28.5% 14.0% 19.4x 1.36x 9.7x 1.28x 8.9x
Urban Outfitters Inc. URBN 41.04 91.3% 6,030 0 488 5,542 2,874 512 14.1% 12.2% 37.2% 17.8% 24.0x 1.93x 10.8x 1.72x 9.6x
Zumiez, Inc. ZUMZ 29.31 75.6% 884 2 98 789 688 92 18.6% 17.9% 36.4% 13.4% 22.6x 1.15x 8.5x 1.02x 7.2x
Mean 88.5% $3,836 $295 $295 $3,836 $3,211 $438 7.0% 7.1% 41.2% 11.2% 20.3x 1.04x 8.7x 0.95x 12.9x
Median 91.8% $1,406 $1 $146 $1,355 $1,726 $155 5.6% 6.5% 39.7% 11.2% 17.6x 0.70x 7.6x 0.69x 7.2x
EV / LTM EV / 2013ELast Twelve Months (LTM) Revenue Growth LTM Margins
Consumer and Retail
Industry Update
July 2013
10 of 16
Price at As a % of Market Cash & Enterprise LTM P/E
($ in millions, except per share data) Ticker 7/5/13 52-wk High Cap Debt Equiv. Value (EV) Revenue EBITDA 1 Year 3 Years Gross EBITDA Multiple Revenue EBITDA Revenue EBITDA
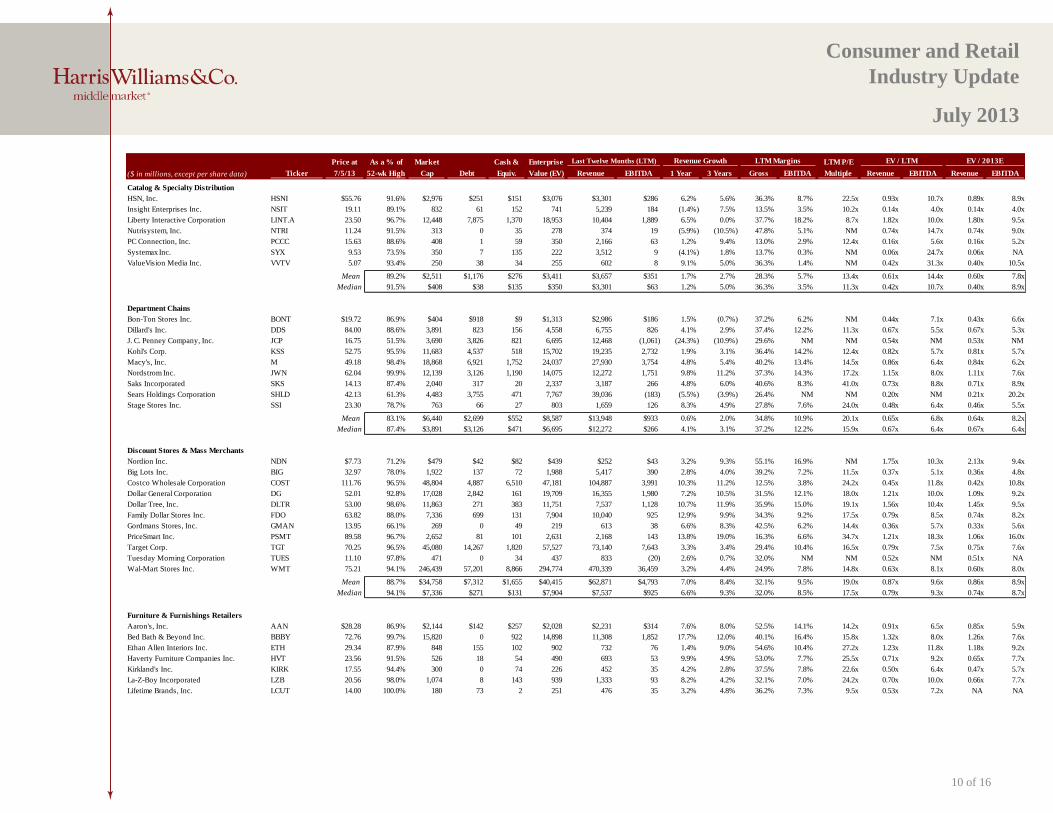
Catalog & Specialty Distribution
HSN, Inc. HSNI $55.76 91.6% $2,976 $251 $151 $3,076 $3,301 $286 6.2% 5.6% 36.3% 8.7% 22.5x 0.93x 10.7x 0.89x 8.9x
Insight Enterprises Inc. NSIT 19.11 89.1% 832 61 152 741 5,239 184 (1.4%) 7.5% 13.5% 3.5% 10.2x 0.14x 4.0x 0.14x 4.0x
Liberty Interactive Corporation LINT.A 23.50 96.7% 12,448 7,875 1,370 18,953 10,404 1,889 6.5% 0.0% 37.7% 18.2% 8.7x 1.82x 10.0x 1.80x 9.5x
Nutrisystem, Inc. NTRI 11.24 91.5% 313 0 35 278 374 19 (5.9%) (10.5%) 47.8% 5.1% NM 0.74x 14.7x 0.74x 9.0x
PC Connection, Inc. PCCC 15.63 88.6% 408 1 59 350 2,166 63 1.2% 9.4% 13.0% 2.9% 12.4x 0.16x 5.6x 0.16x 5.2x
Systemax Inc. SYX 9.53 73.5% 350 7 135 222 3,512 9 (4.1%) 1.8% 13.7% 0.3% NM 0.06x 24.7x 0.06x NA
ValueVision Media Inc. VVTV 5.07 93.4% 250 38 34 255 602 8 9.1% 5.0% 36.3% 1.4% NM 0.42x 31.3x 0.40x 10.5x
Mean 89.2% $2,511 $1,176 $276 $3,411 $3,657 $351 1.7% 2.7% 28.3% 5.7% 13.4x 0.61x 14.4x 0.60x 7.8x
Median 91.5% $408 $38 $135 $350 $3,301 $63 1.2% 5.0% 36.3% 3.5% 11.3x 0.42x 10.7x 0.40x 8.9x
Department Chains
Bon-Ton Stores Inc. BONT $19.72 86.9% $404 $918 $9 $1,313 $2,986 $186 1.5% (0.7%) 37.2% 6.2% NM 0.44x 7.1x 0.43x 6.6x
Dillard's Inc. DDS 84.00 88.6% 3,891 823 156 4,558 6,755 826 4.1% 2.9% 37.4% 12.2% 11.3x 0.67x 5.5x 0.67x 5.3x
J. C. Penney Company, Inc. JCP 16.75 51.5% 3,690 3,826 821 6,695 12,468 (1,061) (24.3%) (10.9%) 29.6% NM NM 0.54x NM 0.53x NM
Kohl's Corp. KSS 52.75 95.5% 11,683 4,537 518 15,702 19,235 2,732 1.9% 3.1% 36.4% 14.2% 12.4x 0.82x 5.7x 0.81x 5.7x
Macy's, Inc. M 49.18 98.4% 18,868 6,921 1,752 24,037 27,930 3,754 4.8% 5.4% 40.2% 13.4% 14.5x 0.86x 6.4x 0.84x 6.2x
Nordstrom Inc. JWN 62.04 99.9% 12,139 3,126 1,190 14,075 12,272 1,751 9.8% 11.2% 37.3% 14.3% 17.2x 1.15x 8.0x 1.11x 7.6x
Saks Incorporated SKS 14.13 87.4% 2,040 317 20 2,337 3,187 266 4.8% 6.0% 40.6% 8.3% 41.0x 0.73x 8.8x 0.71x 8.9x
Sears Holdings Corporation SHLD 42.13 61.3% 4,483 3,755 471 7,767 39,036 (183) (5.5%) (3.9%) 26.4% NM NM 0.20x NM 0.21x 20.2x
Stage Stores Inc. SSI 23.30 78.7% 763 66 27 803 1,659 126 8.3% 4.9% 27.8% 7.6% 24.0x 0.48x 6.4x 0.46x 5.5x
Mean 83.1% $6,440 $2,699 $552 $8,587 $13,948 $933 0.6% 2.0% 34.8% 10.9% 20.1x 0.65x 6.8x 0.64x 8.2x
Median 87.4% $3,891 $3,126 $471 $6,695 $12,272 $266 4.1% 3.1% 37.2% 12.2% 15.9x 0.67x 6.4x 0.67x 6.4x
Discount Stores & Mass Merchants
Nordion Inc. NDN $7.73 71.2% $479 $42 $82 $439 $252 $43 3.2% 9.3% 55.1% 16.9% NM 1.75x 10.3x 2.13x 9.4x
Big Lots Inc. BIG 32.97 78.0% 1,922 137 72 1,988 5,417 390 2.8% 4.0% 39.2% 7.2% 11.5x 0.37x 5.1x 0.36x 4.8x
Costco Wholesale Corporation COST 111.76 96.5% 48,804 4,887 6,510 47,181 104,887 3,991 10.3% 11.2% 12.5% 3.8% 24.2x 0.45x 11.8x 0.42x 10.8x
Dollar General Corporation DG 52.01 92.8% 17,028 2,842 161 19,709 16,355 1,980 7.2% 10.5% 31.5% 12.1% 18.0x 1.21x 10.0x 1.09x 9.2x
Dollar Tree, Inc. DLTR 53.00 98.6% 11,863 271 383 11,751 7,537 1,128 10.7% 11.9% 35.9% 15.0% 19.1x 1.56x 10.4x 1.45x 9.5x
Family Dollar Stores Inc. FDO 63.82 88.0% 7,336 699 131 7,904 10,040 925 12.9% 9.9% 34.3% 9.2% 17.5x 0.79x 8.5x 0.74x 8.2x
Gordmans Stores, Inc. GMAN 13.95 66.1% 269 0 49 219 613 38 6.6% 8.3% 42.5% 6.2% 14.4x 0.36x 5.7x 0.33x 5.6x
PriceSmart Inc. PSMT 89.58 96.7% 2,652 81 101 2,631 2,168 143 13.8% 19.0% 16.3% 6.6% 34.7x 1.21x 18.3x 1.06x 16.0x
Target Corp. TGT 70.25 96.5% 45,080 14,267 1,820 57,527 73,140 7,643 3.3% 3.4% 29.4% 10.4% 16.5x 0.79x 7.5x 0.75x 7.6x
Tuesday Morning Corporation TUES 11.10 97.8% 471 0 34 437 833 (20) 2.6% 0.7% 32.0% NM NM 0.52x NM 0.51x NA
Wal-Mart Stores Inc. WMT 75.21 94.1% 246,439 57,201 8,866 294,774 470,339 36,459 3.2% 4.4% 24.9% 7.8% 14.8x 0.63x 8.1x 0.60x 8.0x
Mean 88.7% $34,758 $7,312 $1,655 $40,415 $62,871 $4,793 7.0% 8.4% 32.1% 9.5% 19.0x 0.87x 9.6x 0.86x 8.9x
Median 94.1% $7,336 $271 $131 $7,904 $7,537 $925 6.6% 9.3% 32.0% 8.5% 17.5x 0.79x 9.3x 0.74x 8.7x
Furniture & Furnishings Retailers
Aaron's, Inc. AAN $28.28 86.9% $2,144 $142 $257 $2,028 $2,231 $314 7.6% 8.0% 52.5% 14.1% 14.2x 0.91x 6.5x 0.85x 5.9x
Bed Bath & Beyond Inc. BBBY 72.76 99.7% 15,820 0 922 14,898 11,308 1,852 17.7% 12.0% 40.1% 16.4% 15.8x 1.32x 8.0x 1.26x 7.6x
Ethan Allen Interiors Inc. ETH 29.34 87.9% 848 155 102 902 732 76 1.4% 9.0% 54.6% 10.4% 27.2x 1.23x 11.8x 1.18x 9.2x
Haverty Furniture Companies Inc. HVT 23.56 91.5% 526 18 54 490 693 53 9.9% 4.9% 53.0% 7.7% 25.5x 0.71x 9.2x 0.65x 7.7x
Kirkland's Inc. KIRK 17.55 94.4% 300 0 74 226 452 35 4.2% 2.8% 37.5% 7.8% 22.6x 0.50x 6.4x 0.47x 5.7x
La-Z-Boy Incorporated LZB 20.56 98.0% 1,074 8 143 939 1,333 93 8.2% 4.2% 32.1% 7.0% 24.2x 0.70x 10.0x 0.66x 7.7x
Lifetime Brands, Inc. LCUT 14.00 100.0% 180 73 2 251 476 35 3.2% 4.8% 36.2% 7.3% 9.5x 0.53x 7.2x NA NA
Last Twelve Months (LTM) LTM Margins EV / LTM EV / 2013ERevenue Growth

Consumer and Retail
Industry Update
July 2013
11 of 16
Price at As a % of Market Cash & Enterprise LTM P/E
($ in millions, except per share data) Ticker 7/5/13 52-wk High Cap Debt Equiv. Value (EV) Revenue EBITDA 1 Year 3 Years Gross EBITDA Multiple Revenue EBITDA Revenue EBITDA
Furniture & Furnishings Retailers (Cont.)
Pier 1 Imports, Inc. PIR $23.61 93.4% $2,462 $10 $242 $2,229 $1,739 $245 11.4% 9.7% 59.6% 14.1% 19.1x 1.28x 9.1x 1.19x 8.1x
Rent-A-Center, Inc. RCII 38.39 96.9% 2,220 641 82 2,779 3,067 384 3.1% 3.8% 69.3% 12.5% 12.7x 0.91x 7.2x 0.85x 6.9x
Select Comfort Corporation SCSS 25.46 74.1% 1,417 0 143 1,274 931 143 14.6% 18.3% 64.0% 15.4% 18.2x 1.37x 8.9x 1.24x 8.6x
The Sherwin-Williams Company SHW 182.48 93.8% 18,826 1,704 614 19,916 9,565 1,158 5.7% 10.4% 44.5% 12.1% 29.5x 2.08x 17.2x 1.79x 13.1x
Tuesday Morning Corporation TUES 11.10 97.8% 471 0 34 437 833 (20) 2.6% 0.7% 32.0% NM NM 0.52x NM 0.51x NA
Williams-Sonoma Inc. WSM 57.62 99.9% 5,600 5 253 5,353 4,113 571 9.2% 8.6% 39.3% 13.9% 21.8x 1.30x 9.4x 1.23x 8.8x
Mean 93.4% $3,991 $212 $225 $3,979 $2,883 $380 7.6% 7.5% 47.3% 11.6% 20.0x 1.03x 9.3x 0.99x 8.1x
Median 94.4% $1,417 $10 $143 $1,274 $1,333 $143 7.6% 8.0% 44.5% 12.3% 20.5x 0.91x 9.0x 1.01x 7.7x
Internet Retail
1-800-Flowers.com Inc. FLWS $6.50 98.5% $415 $18 $17 $416 $746 $45 3.8% 3.4% 41.4% 6.0% 27.1x 0.56x 9.3x 0.54x 8.5x
Amazon.com Inc. AMZN 285.88 99.8% 130,145 3,040 7,895 125,290 63,978 2,710 24.5% 33.7% 25.4% 4.2% NM 1.96x 46.2x 1.59x 23.5x
Blue Nile Inc. NILE 38.46 88.3% 477 1 41 437 414 14 18.0% 9.7% 18.7% 3.5% NM 1.05x 30.2x 0.94x 17.8x
eBay Inc. EBAY 53.85 92.8% 69,886 4,516 9,402 65,000 14,543 4,310 17.4% 17.8% 69.8% 29.6% 26.1x 4.47x 15.1x 3.84x 11.3x
IAC/InterActiveCorp IACI 47.59 85.6% 3,984 580 680 3,885 2,903 451 29.6% 27.7% 64.7% 15.5% 22.9x 1.34x 8.6x 1.18x 5.9x
Netflix, Inc. NFLX 225.10 90.5% 13,156 700 1,026 12,830 3,763 130 12.1% 28.6% 27.5% 3.5% NM 3.41x 98.7x 2.83x 36.6x
Orbitz Worldwide, Inc. OWW 9.50 99.8% 1,002 450 220 1,232 792 106 2.6% 2.5% 80.7% 13.4% NM 1.56x 11.6x 1.47x 8.4x
Overstock.com Inc. OSTK 25.65 83.3% 607 0 82 525 1,149 32 9.3% 6.3% 18.3% 2.8% 31.3x 0.46x 16.2x 0.42x 11.7x
PetMed Express, Inc. PETS 13.07 90.1% 259 0 34 226 228 28 (4.4%) (1.5%) 33.9% 12.3% 15.2x 0.99x 8.0x 0.98x 7.9x
priceline.com Incorporated PCLN 855.16 99.9% 44,109 1,462 5,182 40,390 5,526 1,983 20.6% 31.0% 78.7% 35.9% 29.6x 7.31x 20.4x 5.91x 15.8x
Shutterfly, Inc. SFLY 57.44 99.0% 2,181 0 164 2,017 666 83 31.3% 37.5% 54.0% 12.5% NM 3.03x 24.2x 2.55x 13.4x
Stamps.com Inc. STMP 41.77 99.9% 645 0 47 598 119 29 11.6% 12.9% 76.4% 24.7% 22.9x 5.01x 20.3x 4.52x 16.9x
U.S. Auto Parts Network, Inc. PRTS 1.12 24.0% 37 12 1 48 282 5 (13.9%) 13.5% 30.1% 1.9% NM 0.17x 9.2x 0.19x NA
Mean 88.6% $20,531 $829 $1,907 $19,453 $7,316 $764 12.5% 17.2% 47.7% 12.8% 25.0x 2.41x 24.5x 2.07x 14.8x
Median 92.8% $1,002 $18 $164 $1,232 $792 $83 12.1% 13.5% 41.4% 12.3% 26.1x 1.56x 16.2x 1.47x 12.5x
Specialty & Other Retail
Barnes & Noble, Inc. BKS $17.68 74.6% $1,038 $77 $160 $954 $6,839 $12 (4.1%) 5.6% 24.6% 0.2% NM 0.14x 81.7x 0.15x 5.1x
Best Buy Co., Inc. BBY 29.73 99.4% 10,104 1,686 908 10,882 48,191 1,921 10.0% (1.5%) 23.2% 4.0% NM 0.23x 5.7x 0.25x 4.8x
Big 5 Sporting Goods Corp. BGFV 21.29 94.3% 459 36 5 490 968 57 7.6% 2.3% 32.6% 5.9% 20.8x 0.51x 8.6x 0.48x 7.2x
Books-A-Million Inc. BAMM 2.50 77.6% 38 59 9 88 495 22 3.4% (0.8%) 28.9% 4.4% NM 0.18x 4.0x NA NA
Build-A-Bear Workshop Inc. BBW 6.22 87.5% 102 0 41 61 389 12 (1.5%) (0.9%) 40.4% 3.2% NM 0.16x 4.9x 0.16x 3.6x
Conns Inc. CONN 53.60 97.1% 1,915 294 4 2,205 915 118 14.2% 3.2% 46.2% 12.9% 29.3x 2.41x 18.7x 1.90x 10.8x
CVS Caremark Corporation CVS 58.64 96.6% 71,798 9,664 1,556 79,906 123,098 9,355 9.7% 7.5% 18.7% 7.6% 18.2x 0.65x 8.5x 0.63x 8.0x
Dick's Sporting Goods Inc. DKS 49.80 91.8% 6,236 16 114 6,138 5,888 656 9.5% 9.4% 31.5% 11.1% 20.9x 1.04x 9.4x 0.96x 8.3x
Fossil Group, Inc. FOSL 106.82 92.7% 6,267 153 241 6,179 2,949 579 12.6% 22.1% 56.2% 19.6% 18.1x 2.10x 10.7x 1.92x 10.1x
hhgregg, Inc. HGG 15.50 87.5% 484 0 49 435 2,475 84 (0.7%) 17.3% 29.0% 3.4% 21.0x 0.18x 5.2x 0.17x 4.9x
Hibbett Sports, Inc. HIBB 55.38 87.4% 1,439 3 103 1,339 826 129 8.4% 10.0% 36.5% 15.6% 20.3x 1.62x 10.4x 1.50x 9.4x
Lowe's Companies Inc. LOW 42.78 97.6% 45,878 9,073 1,199 53,752 50,456 5,279 (1.4%) 1.8% 34.3% 10.5% 24.5x 1.07x 10.2x 1.02x 9.4x
Lumber Liquidators Holdings, Inc. LL 81.50 89.6% 2,239 0 73 2,166 856 101 20.5% 14.4% 38.8% 11.8% NM 2.53x 21.5x 2.23x 17.7x
Marinemax Inc. HZO 11.70 82.5% 282 141 30 393 548 10 7.7% (1.3%) 25.1% 1.8% NM 0.72x 39.0x 0.64x 14.5x
Movado Group, Inc. MOV 35.95 91.9% 917 0 141 776 512 61 6.2% 12.3% 54.5% 12.0% 15.8x 1.52x 12.7x 1.35x NA
Office Depot, Inc. ODP 4.14 67.9% 1,196 654 549 1,300 10,541 236 (7.4%) (4.2%) 30.5% 2.2% NM 0.12x 5.5x 0.13x 4.0x
PetSmart, Inc. PETM 68.43 94.1% 7,070 526 262 7,333 6,839 902 9.4% 8.2% 30.6% 13.2% 18.6x 1.07x 8.1x 1.03x 7.9x
Last Twelve Months (LTM) Revenue Growth LTM Margins EV / LTM EV / 2013E

Consumer and Retail
Industry Update
July 2013
12 of 16
Price at As a % of Market Cash & Enterprise LTM P/E
($ in millions, except per share data) Ticker 7/5/13 52-wk High Cap Debt Equiv. Value (EV) Revenue EBITDA 1 Year 3 Years Gross EBITDA Multiple Revenue EBITDA Revenue EBITDA
Specialty & Other Retail (Cont.)
RadioShack Corp. RSH $3.13 73.1% $312 $712 $435 $589 $4,194 $24 (1.9%) (0.6%) 35.9% 0.6% NM 0.14x 24.4x 0.16x 14.5x
Regis Corp. RGS 16.97 86.6% 961 269 180 1,049 2,197 169 0.5% (2.8%) 38.0% 7.7% NM 0.48x 6.2x 0.52x 8.8x
Rite Aid Corporation RAD 2.77 86.3% 2,520 5,912 109 8,322 25,217 1,278 (3.7%) (0.4%) 29.3% 5.1% 11.4x 0.33x 6.5x 0.33x 7.2x
Staples, Inc. SPLS 15.98 96.1% 10,609 1,968 1,435 11,142 24,170 1,971 (1.4%) (0.5%) 26.5% 8.2% NM 0.46x 5.7x 0.47x 5.8x
Steiner Leisure Ltd. STNR 54.33 98.5% 797 132 72 858 825 82 12.7% 16.7% 22.4% 10.0% 15.8x 1.04x 10.4x 0.99x 9.9x
The Home Depot, Inc. HD 78.29 96.0% 114,366 12,792 4,337 122,821 76,070 9,990 6.6% 4.4% 34.6% 13.1% 24.9x 1.61x 12.3x 1.57x 11.3x
Tiffany & Co. TIF 73.44 90.4% 9,369 974 465 9,879 3,871 881 4.6% 11.1% 56.8% 22.8% 22.5x 2.55x 11.2x 2.40x 10.6x
Tractor Supply Company TSCO 118.81 100.0% 8,292 106 57 8,341 4,730 530 7.1% 13.1% 33.5% 11.2% 30.6x 1.76x 15.7x 1.58x 13.7x
Vitamin Shoppe, Inc. VSI 44.04 66.8% 1,318 0 31 1,287 982 130 10.6% 12.3% 44.0% 13.2% 21.0x 1.31x 9.9x 1.13x 8.4x
Walgreen Co. WAG 44.25 86.3% 41,816 6,366 3,007 45,175 71,349 4,621 (1.6%) 2.5% 29.1% 6.5% 19.4x 0.63x 9.8x 0.60x 7.8x
Zale Corporation ZLC 8.75 88.8% 285 466 26 725 1,878 65 2.2% 4.9% 51.8% 3.5% NM 0.39x 11.1x 0.38x 11.0x
Mean 88.5% $12,432 $1,860 $557 $13,735 $17,081 $1,403 5.0% 5.9% 35.1% 8.6% 20.8x 0.96x 13.9x 0.91x 9.0x
Median 90.0% $1,677 $211 $128 $1,752 $3,410 $149 6.4% 4.6% 33.1% 7.9% 20.8x 0.68x 10.1x 0.64x 8.6x
Last Twelve Months (LTM) Revenue Growth LTM Margins EV / LTM EV / 2013E
July 2013
M&A
Detail
Recent North
American
Consumer
M&A
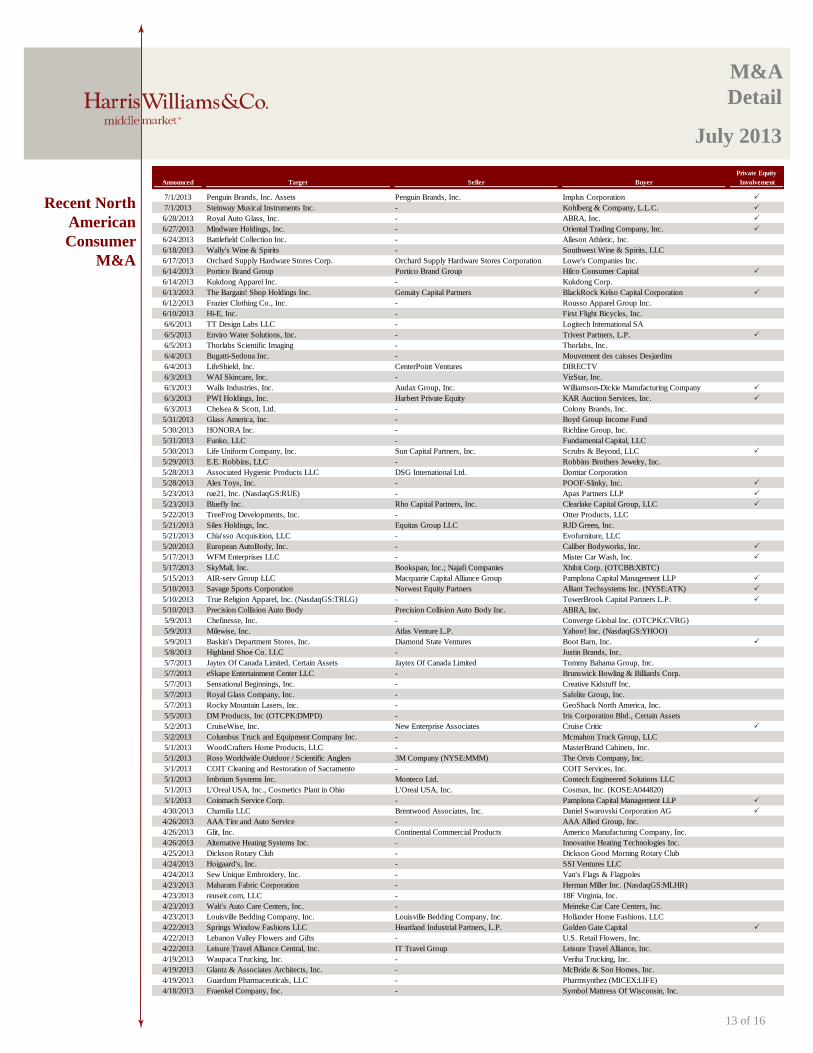
13 of 16
Private Equity
Announced Target Seller Buyer Involvement
7/1/2013 Penguin Brands, Inc. Assets Penguin Brands, Inc. Implus Corporation P
7/1/2013 Steinway Musical Instruments Inc. - Kohlberg & Company, L.L.C. P
6/28/2013 Royal Auto Glass, Inc. - ABRA, Inc. P
6/27/2013 Mindware Holdings, Inc. - Oriental Trading Company, Inc. P
6/24/2013 Battlefield Collection Inc. - Alleson Athletic, Inc.
6/18/2013 Wally's Wine & Spirits - Southwest Wine & Spirits, LLC
6/17/2013 Orchard Supply Hardware Stores Corp. Orchard Supply Hardware Stores Corporation Lowe's Companies Inc.
6/14/2013 Portico Brand Group Portico Brand Group Hilco Consumer Capital P
6/14/2013 Kukdong Apparel Inc. - Kukdong Corp.
6/13/2013 The Bargain! Shop Holdings Inc. Genuity Capital Partners BlackRock Kelso Capital Corporation P
6/12/2013 Frazier Clothing Co., Inc. - Rousso Apparel Group Inc.
6/10/2013 Hi-E, Inc. - First Flight Bicycles, Inc.
6/6/2013 TT Design Labs LLC - Logitech International SA
6/5/2013 Enviro Water Solutions, Inc. - Trivest Partners, L.P. P
6/5/2013 Thorlabs Scientific Imaging - Thorlabs, Inc.
6/4/2013 Bugatti-Sedona Inc. - Mouvement des caisses Desjardins
6/4/2013 LifeShield, Inc. CenterPoint Ventures DIRECTV
6/3/2013 WAI Skincare, Inc. - VizStar, Inc.
6/3/2013 Walls Industries, Inc. Audax Group, Inc. Williamson-Dickie Manufacturing Company P
6/3/2013 PWI Holdings, Inc. Harbert Private Equity KAR Auction Services, Inc. P
6/3/2013 Chelsea & Scott, Ltd. - Colony Brands, Inc.
5/31/2013 Glass America, Inc. - Boyd Group Income Fund
5/30/2013 HONORA Inc. - Richline Group, Inc.
5/31/2013 Funko, LLC - Fundamental Capital, LLC
5/30/2013 Life Uniform Company, Inc. Sun Capital Partners, Inc. Scrubs & Beyond, LLC P
5/29/2013 E.E. Robbins, LLC - Robbins Brothers Jewelry, Inc.
5/28/2013 Associated Hygienic Products LLC DSG International Ltd. Domtar Corporation
5/28/2013 Alex Toys, Inc. - POOF-Slinky, Inc. P
5/23/2013 rue21, Inc. (NasdaqGS:RUE) - Apax Partners LLP P
5/23/2013 Bluefly Inc. Rho Capital Partners, Inc. Clearlake Capital Group, LLC P
5/22/2013 TreeFrog Developments, Inc. - Otter Products, LLC
5/21/2013 Silex Holdings, Inc. Equitas Group LLC RJD Green, Inc.
5/21/2013 Chia'sso Acquisition, LLC - Evofurniture, LLC
5/20/2013 European AutoBody, Inc. - Caliber Bodyworks, Inc. P
5/17/2013 WFM Enterprises LLC - Mister Car Wash, Inc. P
5/17/2013 SkyMall, Inc. Bookspan, Inc.; Najafi Companies Xhibit Corp. (OTCBB:XBTC)
5/15/2013 AIR-serv Group LLC Macquarie Capital Alliance Group Pamplona Capital Management LLP P
5/10/2013 Savage Sports Corporation Norwest Equity Partners Alliant Techsystems Inc. (NYSE:ATK) P
5/10/2013 True Religion Apparel, Inc. (NasdaqGS:TRLG) - TowerBrook Capital Partners L.P. P
5/10/2013 Precision Collision Auto Body Precision Collision Auto Body Inc. ABRA, Inc.
5/9/2013 Chefinesse, Inc. - Converge Global Inc. (OTCPK:CVRG)
5/9/2013 Milewise, Inc. Atlas Venture L.P. Yahoo! Inc. (NasdaqGS:YHOO)
5/9/2013 Baskin's Department Stores, Inc. Diamond State Ventures Boot Barn, Inc. P
5/8/2013 Highland Shoe Co. LLC - Justin Brands, Inc.
5/7/2013 Jaytex Of Canada Limited, Certain Assets Jaytex Of Canada Limited Tommy Bahama Group, Inc.
5/7/2013 eSkape Entertainment Center LLC - Brunswick Bowling & Billiards Corp.
5/7/2013 Sensational Beginnings, Inc. - Creative Kidstuff Inc.
5/7/2013 Royal Glass Company, Inc. - Safelite Group, Inc.
5/7/2013 Rocky Mountain Lasers, Inc. - GeoShack North America, Inc.
5/5/2013 DM Products, Inc (OTCPK:DMPD) - Iris Corporation Bhd., Certain Assets
5/2/2013 CruiseWise, Inc. New Enterprise Associates Cruise Critic P
5/2/2013 Columbus Truck and Equipment Company Inc. - Mcmahon Truck Group, LLC
5/1/2013 WoodCrafters Home Products, LLC - MasterBrand Cabinets, Inc.
5/1/2013 Ross Worldwide Outdoor / Scientific Anglers 3M Company (NYSE:MMM) The Orvis Company, Inc.
5/1/2013 COIT Cleaning and Restoration of Sacramento - COIT Services, Inc.
5/1/2013 Imbrium Systems Inc. Monteco Ltd. Contech Engineered Solutions LLC
5/1/2013 L'Oreal USA, Inc., Cosmetics Plant in Ohio L'Oreal USA, Inc. Cosmax, Inc. (KOSE:A044820)
5/1/2013 Coinmach Service Corp. - Pamplona Capital Management LLP P
4/30/2013 Chamilia LLC Brentwood Associates, Inc. Daniel Swarovski Corporation AG P
4/26/2013 AAA Tire and Auto Service - AAA Allied Group, Inc.
4/26/2013 Glit, Inc. Continental Commercial Products Americo Manufacturing Company, Inc.
4/26/2013 Alternative Heating Systems Inc. - Innovative Heating Technologies Inc.
4/25/2013 Dickson Rotary Club - Dickson Good Morning Rotary Club
4/24/2013 Hoigaard's, Inc. - SSI Ventures LLC
4/24/2013 Sew Unique Embroidery, Inc. - Van's Flags & Flagpoles
4/23/2013 Maharam Fabric Corporation - Herman Miller Inc. (NasdaqGS:MLHR)
4/23/2013 reuseit.com, LLC - 18F Virginia, Inc.
4/23/2013 Walt's Auto Care Centers, Inc. - Meineke Car Care Centers, Inc.
4/23/2013 Louisville Bedding Company, Inc. Louisville Bedding Company, Inc. Hollander Home Fashions, LLC
4/22/2013 Springs Window Fashions LLC Heartland Industrial Partners, L.P. Golden Gate Capital P
4/22/2013 Lebanon Valley Flowers and Gifts - U.S. Retail Flowers, Inc.
4/22/2013 Leisure Travel Alliance Central, Inc. IT Travel Group Leisure Travel Alliance, Inc.
4/19/2013 Waupaca Trucking, Inc. - Veriha Trucking, Inc.
4/19/2013 Glantz & Associates Architects, Inc. - McBride & Son Homes, Inc.
4/19/2013 Guardum Pharmaceuticals, LLC - Pharmsynthez (MICEX:LIFE)
4/18/2013 Fraenkel Company, Inc. - Symbol Mattress Of Wisconsin, Inc.
July 2013
M&A
Detail
Recent North
American
Consumer
M&A
(continued)
14 of 16
Private Equity
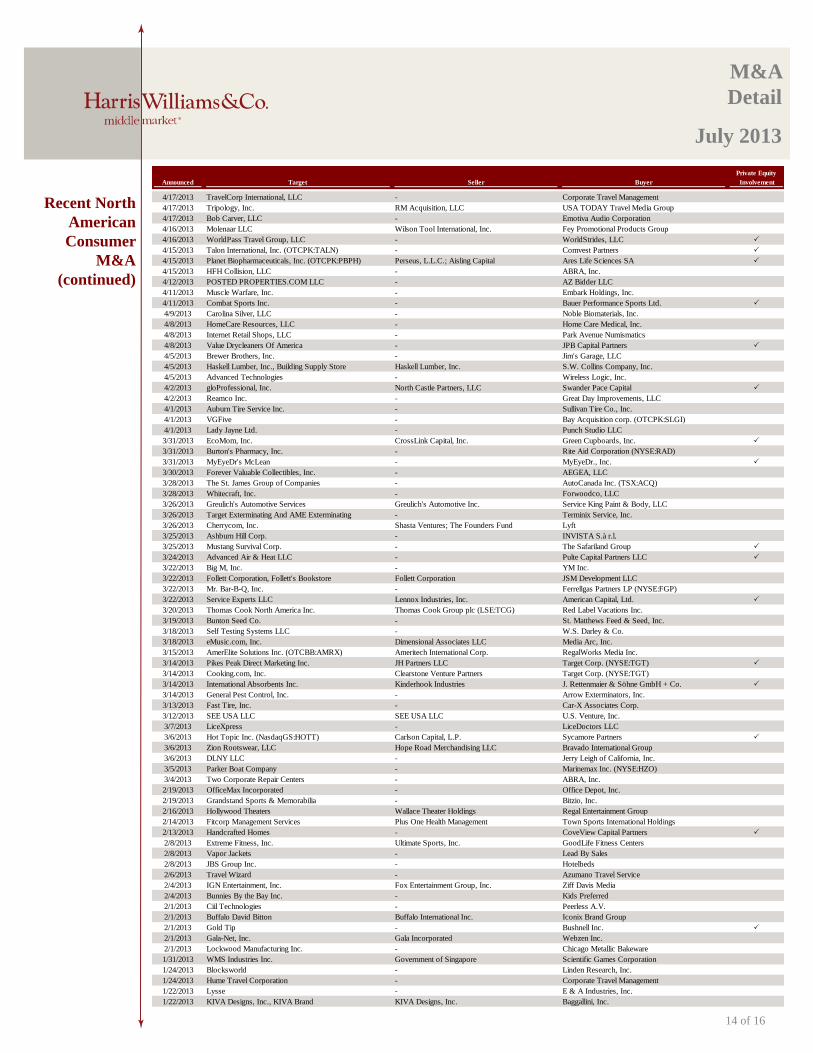
Announced Target Seller Buyer Involvement
4/17/2013 TravelCorp International, LLC - Corporate Travel Management
4/17/2013 Tripology, Inc. RM Acquisition, LLC USA TODAY Travel Media Group
4/17/2013 Bob Carver, LLC - Emotiva Audio Corporation
4/16/2013 Molenaar LLC Wilson Tool International, Inc. Fey Promotional Products Group
4/16/2013 WorldPass Travel Group, LLC - WorldStrides, LLC P
4/15/2013 Talon International, Inc. (OTCPK:TALN) - Comvest Partners P
4/15/2013 Planet Biopharmaceuticals, Inc. (OTCPK:PBPH) Perseus, L.L.C.; Aisling Capital Ares Life Sciences SA P
4/15/2013 HFH Collision, LLC - ABRA, Inc.
4/12/2013 POSTED PROPERTIES.COM LLC - AZ Bidder LLC
4/11/2013 Muscle Warfare, Inc. - Embark Holdings, Inc.
4/11/2013 Combat Sports Inc. - Bauer Performance Sports Ltd. P
4/9/2013 Carolina Silver, LLC - Noble Biomaterials, Inc.
4/8/2013 HomeCare Resources, LLC - Home Care Medical, Inc.
4/8/2013 Internet Retail Shops, LLC - Park Avenue Numismatics
4/8/2013 Value Drycleaners Of America - JPB Capital Partners P
4/5/2013 Brewer Brothers, Inc. - Jim's Garage, LLC
4/5/2013 Haskell Lumber, Inc., Building Supply Store Haskell Lumber, Inc. S.W. Collins Company, Inc.
4/5/2013 Advanced Technologies - Wireless Logic, Inc.
4/2/2013 gloProfessional, Inc. North Castle Partners, LLC Swander Pace Capital P
4/2/2013 Reamco Inc. - Great Day Improvements, LLC
4/1/2013 Auburn Tire Service Inc. - Sullivan Tire Co., Inc.
4/1/2013 VGFive - Bay Acquisition corp. (OTCPK:SLGI)
4/1/2013 Lady Jayne Ltd. - Punch Studio LLC
3/31/2013 EcoMom, Inc. CrossLink Capital, Inc. Green Cupboards, Inc. P
3/31/2013 Burton's Pharmacy, Inc. - Rite Aid Corporation (NYSE:RAD)
3/31/2013 MyEyeDr's McLean - MyEyeDr., Inc. P
3/30/2013 Forever Valuable Collectibles, Inc. - AEGEA, LLC
3/28/2013 The St. James Group of Companies - AutoCanada Inc. (TSX:ACQ)
3/28/2013 Whitecraft, Inc. - Forwoodco, LLC
3/26/2013 Greulich's Automotive Services Greulich's Automotive Inc. Service King Paint & Body, LLC
3/26/2013 Target Exterminating And AME Exterminating - Terminix Service, Inc.
3/26/2013 Cherrycom, Inc. Shasta Ventures; The Founders Fund Lyft
3/25/2013 Ashburn Hill Corp. - INVISTA S.à r.l.
3/25/2013 Mustang Survival Corp. - The Safariland Group P
3/24/2013 Advanced Air & Heat LLC - Pulte Capital Partners LLC P
3/22/2013 Big M, Inc. - YM Inc.
3/22/2013 Follett Corporation, Follett's Bookstore Follett Corporation JSM Development LLC
3/22/2013 Mr. Bar-B-Q, Inc. - Ferrellgas Partners LP (NYSE:FGP)
3/22/2013 Service Experts LLC Lennox Industries, Inc. American Capital, Ltd. P
3/20/2013 Thomas Cook North America Inc. Thomas Cook Group plc (LSE:TCG) Red Label Vacations Inc.
3/19/2013 Bunton Seed Co. - St. Matthews Feed & Seed, Inc.
3/18/2013 Self Testing Systems LLC - W.S. Darley & Co.
3/18/2013 eMusic.com, Inc. Dimensional Associates LLC Media Arc, Inc.
3/15/2013 AmerElite Solutions Inc. (OTCBB:AMRX) Ameritech International Corp. RegalWorks Media Inc.
3/14/2013 Pikes Peak Direct Marketing Inc. JH Partners LLC Target Corp. (NYSE:TGT) P
3/14/2013 Cooking.com, Inc. Clearstone Venture Partners Target Corp. (NYSE:TGT)
3/14/2013 International Absorbents Inc. Kinderhook Industries J. Rettenmaier & Söhne GmbH + Co. P
3/14/2013 General Pest Control, Inc. - Arrow Exterminators, Inc.
3/13/2013 Fast Tire, Inc. - Car-X Associates Corp.
3/12/2013 SEE USA LLC SEE USA LLC U.S. Venture, Inc.
3/7/2013 LiceXpress - LiceDoctors LLC
3/6/2013 Hot Topic Inc. (NasdaqGS:HOTT) Carlson Capital, L.P. Sycamore Partners P
3/6/2013 Zion Rootswear, LLC Hope Road Merchandising LLC Bravado International Group
3/6/2013 DLNY LLC - Jerry Leigh of California, Inc.
3/5/2013 Parker Boat Company - Marinemax Inc. (NYSE:HZO)
3/4/2013 Two Corporate Repair Centers - ABRA, Inc.
2/19/2013 OfficeMax Incorporated - Office Depot, Inc.
2/19/2013 Grandstand Sports & Memorabilia - Bitzio, Inc.
2/16/2013 Hollywood Theaters Wallace Theater Holdings Regal Entertainment Group
2/14/2013 Fitcorp Management Services Plus One Health Management Town Sports International Holdings
2/13/2013 Handcrafted Homes - CoveView Capital Partners P
2/8/2013 Extreme Fitness, Inc. Ultimate Sports, Inc. GoodLife Fitness Centers
2/8/2013 Vapor Jackets - Lead By Sales
2/8/2013 JBS Group Inc. - Hotelbeds
2/6/2013 Travel Wizard - Azumano Travel Service
2/4/2013 IGN Entertainment, Inc. Fox Entertainment Group, Inc. Ziff Davis Media
2/4/2013 Bunnies By the Bay Inc. - Kids Preferred
2/1/2013 Ciil Technologies - Peerless A.V.
2/1/2013 Buffalo David Bitton Buffalo International Inc. Iconix Brand Group
2/1/2013 Gold Tip - Bushnell Inc. P
2/1/2013 Gala-Net, Inc. Gala Incorporated Webzen Inc.
2/1/2013 Lockwood Manufacturing Inc. - Chicago Metallic Bakeware
1/31/2013 WMS Industries Inc. Government of Singapore Scientific Games Corporation
1/24/2013 Blocksworld - Linden Research, Inc.
1/24/2013 Hume Travel Corporation - Corporate Travel Management
1/22/2013 Lysse - E & A Industries, Inc.
1/22/2013 KIVA Designs, Inc., KIVA Brand KIVA Designs, Inc. Baggallini, Inc.
July 2013
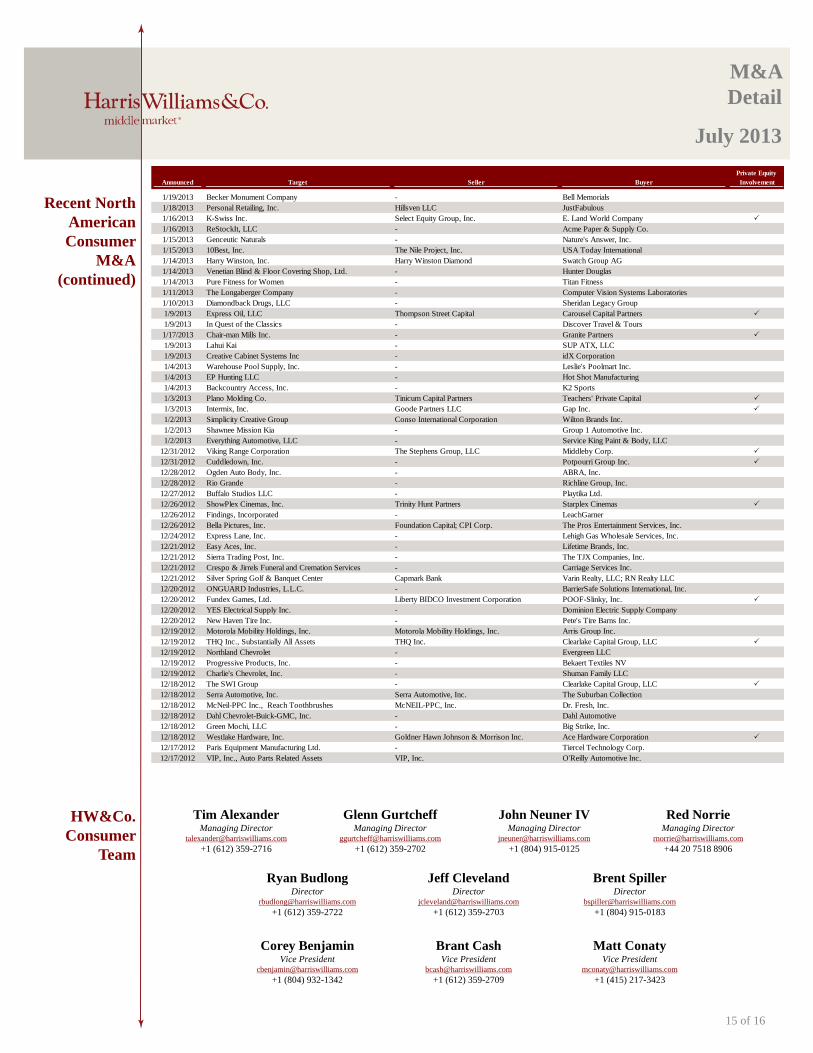
John Neuner IV Managing Director
+1 (804) 915-0125
Tim Alexander Managing Director
+1 (612) 359-2716
Glenn Gurtcheff Managing Director
+1 (612) 359-2702
Jeff Cleveland Director
+1 (612) 359-2703
Corey Benjamin Vice President
+1 (804) 932-1342
HW&Co.
Consumer
Team
Recent North
American
Consumer
M&A
(continued)
M&A
Detail
15 of 16
Brent Spiller Director
+1 (804) 915-0183
Brant Cash Vice President
+1 (612) 359-2709
Matt Conaty Vice President
+1 (415) 217-3423
Ryan Budlong Director
+1 (612) 359-2722
Red Norrie Managing Director
+44 20 7518 8906
Private Equity
Announced Target Seller Buyer Involvement
1/19/2013 Becker Monument Company - Bell Memorials
1/18/2013 Personal Retailing, Inc. Hillsven LLC JustFabulous
1/16/2013 K-Swiss Inc. Select Equity Group, Inc. E. Land World Company P
1/16/2013 ReStockIt, LLC - Acme Paper & Supply Co.
1/15/2013 Genceutic Naturals - Nature's Answer, Inc.
1/15/2013 10Best, Inc. The Nile Project, Inc. USA Today International
1/14/2013 Harry Winston, Inc. Harry Winston Diamond Swatch Group AG
1/14/2013 Venetian Blind & Floor Covering Shop, Ltd. - Hunter Douglas
1/14/2013 Pure Fitness for Women - Titan Fitness
1/11/2013 The Longaberger Company - Computer Vision Systems Laboratories
1/10/2013 Diamondback Drugs, LLC - Sheridan Legacy Group
1/9/2013 Express Oil, LLC Thompson Street Capital Carousel Capital Partners P
1/9/2013 In Quest of the Classics - Discover Travel & Tours
1/17/2013 Chair-man Mills Inc. - Granite Partners P
1/9/2013 Lahui Kai - SUP ATX, LLC
1/9/2013 Creative Cabinet Systems Inc - idX Corporation
1/4/2013 Warehouse Pool Supply, Inc. - Leslie's Poolmart Inc.
1/4/2013 EP Hunting LLC - Hot Shot Manufacturing
1/4/2013 Backcountry Access, Inc. - K2 Sports
1/3/2013 Plano Molding Co. Tinicum Capital Partners Teachers' Private Capital P
1/3/2013 Intermix, Inc. Goode Partners LLC Gap Inc. P
1/2/2013 Simplicity Creative Group Conso International Corporation Wilton Brands Inc.
1/2/2013 Shawnee Mission Kia - Group 1 Automotive Inc.
1/2/2013 Everything Automotive, LLC - Service King Paint & Body, LLC
12/31/2012 Viking Range Corporation The Stephens Group, LLC Middleby Corp. P
12/31/2012 Cuddledown, Inc. - Potpourri Group Inc. P
12/28/2012 Ogden Auto Body, Inc. - ABRA, Inc.
12/28/2012 Rio Grande - Richline Group, Inc.
12/27/2012 Buffalo Studios LLC - Playtika Ltd.
12/26/2012 ShowPlex Cinemas, Inc. Trinity Hunt Partners Starplex Cinemas P
12/26/2012 Findings, Incorporated - LeachGarner
12/26/2012 Bella Pictures, Inc. Foundation Capital; CPI Corp. The Pros Entertainment Services, Inc.
12/24/2012 Express Lane, Inc. - Lehigh Gas Wholesale Services, Inc.
12/21/2012 Easy Aces, Inc. - Lifetime Brands, Inc.
12/21/2012 Sierra Trading Post, Inc. - The TJX Companies, Inc.
12/21/2012 Crespo & Jirrels Funeral and Cremation Services - Carriage Services Inc.
12/21/2012 Silver Spring Golf & Banquet Center Capmark Bank Varin Realty, LLC; RN Realty LLC
12/20/2012 ONGUARD Industries, L.L.C. - BarrierSafe Solutions International, Inc.
12/20/2012 Fundex Games, Ltd. Liberty BIDCO Investment Corporation POOF-Slinky, Inc. P
12/20/2012 YES Electrical Supply Inc. - Dominion Electric Supply Company
12/20/2012 New Haven Tire Inc. - Pete's Tire Barns Inc.
12/19/2012 Motorola Mobility Holdings, Inc. Motorola Mobility Holdings, Inc. Arris Group Inc.
12/19/2012 THQ Inc., Substantially All Assets THQ Inc. Clearlake Capital Group, LLC P
12/19/2012 Northland Chevrolet - Evergreen LLC
12/19/2012 Progressive Products, Inc. - Bekaert Textiles NV
12/19/2012 Charlie's Chevrolet, Inc. - Shuman Family LLC
12/18/2012 The SWI Group - Clearlake Capital Group, LLC P
12/18/2012 Serra Automotive, Inc. Serra Automotive, Inc. The Suburban Collection
12/18/2012 McNeil-PPC Inc., Reach Toothbrushes McNEIL-PPC, Inc. Dr. Fresh, Inc.
12/18/2012 Dahl Chevrolet-Buick-GMC, Inc. - Dahl Automotive
12/18/2012 Green Mochi, LLC - Big Strike, Inc.
12/18/2012 Westlake Hardware, Inc. Goldner Hawn Johnson & Morrison Inc. Ace Hardware Corporation P
12/17/2012 Paris Equipment Manufacturing Ltd. - Tiercel Technology Corp.
12/17/2012 VIP, Inc., Auto Parts Related Assets VIP, Inc. O'Reilly Automotive Inc.

July 2013
Sources:
Capital IQ.
Thomson Financial.
S&P.
Reuters.
Harris Williams & Co. (www.harriswilliams.com) is a preeminent middle market investment bank focused on the
advisory needs of clients worldwide. The firm has deep industry knowledge, global transaction expertise, and an
unwavering commitment to excellence. Harris Williams & Co. provides sell-side and acquisition advisory, restructuring
advisory, board advisory, private placements, and capital markets advisory services.
Investment banking services are provided by Harris Williams LLC and Harris Williams & Co. Ltd. Harris Williams &
Co. is a trade name under which Harris Williams LLC and Harris Williams & Co. Ltd conduct business. Harris Williams
LLC is a registered broker-dealer and member of FINRA and SIPC. Harris Williams & Co. Ltd is a private limited
company incorporated under English law having its registered office at 5th floor, 6 St. Andrew Street, London EC4A
3AE, UK, registered with the Registrar of Companies for England and Wales under company number 7078852. Directors:
Mr. Christopher Williams, Mr. Ned Valentine, Mr. Paul Poggi and Mr. Thierry Monjauze, authorised and regulated by
the Financial Conduct Authority.
THIS REPORT MAY CONTAIN REFERENCES TO REGISTERED TRADEMARKS, SERVICE MARKS
AND COPYRIGHTS OWNED BY THIRD-PARTY INFORMATION PROVIDERS. NONE OF THE THIRD-
PARTY INFORMATION PROVIDERS IS ENDORSING THE OFFERING OF, AND SHALL NOT IN ANY
WAY BE DEEMED AN ISSUER OR UNDERWRITER OF, THE SECURITIES, FINANCIAL INSTRUMENTS
OR OTHER INVESTMENTS DISCUSSED IN THIS REPORT, AND SHALL NOT HAVE ANY LIABILITY
OR RESPONSIBILITY FOR ANY STATEMENTS MADE IN THE REPORT OR FOR ANY FINANCIAL
STATEMENTS, FINANCIAL PROJECTIONS OR OTHER FINANCIAL INFORMATION CONTAINED OR
ATTACHED AS AN EXHIBIT TO THE REPORT. FOR MORE INFORMATION ABOUT THE MATERIALS
PROVIDED BY SUCH THIRD PARTIES, PLEASE CONTACT US AT +1-804-648-0072.
The information and views contained in this report were prepared by Harris Williams & Co. (“Harris Williams”). It is
not a research report, as such term is defined by applicable law and regulations, and is provided for informational
purposes only. It is not to be construed as an offer to buy or sell or a solicitation of an offer to buy or sell any financial
instruments or to participate in any particular trading strategy. The information contained herein is believed by Harris
Williams to be reliable but Harris Williams makes no representation as to the accuracy or completeness of such
information. Harris Williams and/or its affiliates may be market makers or specialists in, act as advisers or lenders to,
have positions in and effect transactions in securities of companies mentioned herein and also may provide, may have
provided, or may seek to provide investment banking services for those companies. In addition, Harris Williams and/or
its affiliates or their respective officers, directors and employees may hold long or short positions in the securities,
options thereon or other related financial products of companies discussed herein. Opinions, estimates and projections
in this report constitute Harris Williams’ judgment and are subject to change without notice. The financial instruments
discussed in this report may not be suitable for all investors, and investors must make their own investment decisions
using their own independent advisors as they believe necessary and based upon their specific financial situations and
investment objectives. Also, past performance is not necessarily indicative of future results. No part of this material may
be copied or duplicated in any form or by any means, or redistributed, without Harris Williams’ prior written consent.
Copyright © 2013 Harris Williams & Co., all rights reserved.
Consumer and Retail
Industry Update
16 of 16