consumer and retail | harris williams & co. consumer update 2 consumer and retail industry...
TRANSCRIPT

www.harriswilliams.de
Harris Williams & Co. Ltd is a private limited company authorised and regulated by the Financial Conduct Authority, incorporated under English law with its registered office at 5th Floor, 6 St. Andrew Street,London EC4A 3AE, UK, registered with the Registrar of Companies for England and Wales under company number 7078852. Directors: Mr. Ned Valentine, Mr. Paul Poggi, Mr. Thierry Monjauze and Mr. Aadil Khan.
Harris Williams & Co. Ltd Niederlassung Frankfurt (German branch) is registered in the Commercial Register (Handelsregister) of the Local Court (Amtsgericht) of Frankfurt am Main, Germany, under registrationnumber HRB 96687, having its business address at Bockenheimer Landstrasse 33-35, 60325 Frankfurt am Main, Germany. Permanent Representative (Ständiger Vertreter) of the Branch Niederlassung: Mr. JefferyH. Perkins.
CONSUMER AND RETAIL
INDUSTRY UPDATE │ JUNE 2017

PAGE |
www.harriswilliams.de
241 248 277 252 286 294 318 284 338 363 340 344 313 284 269 225 196
795 763 742 740
990 951 832788
975 970 1039 1008 1019803 771
529 595
23%25%
27%25%
22% 24%
28% 26%26% 27% 25% 25%
23%26% 26%
30%
25%
Q1 Q2 Q3 Q4 Q1 Q2 Q3 Q4 1Q 2Q 3Q Q4 1Q 2Q 3Q 4Q 1Q
2013 2014 2015 2016 2017
PE Non-PE PE Backed Deals as % of M&A
HARRIS WILLIAMS & CO. CONSUMER UPDATE
1
GROUP OVERVIEW
Harris Williams & Co. is a leadingadvisor to the Consumer market. Oursignificant experience covers a broadrange of end markets, industries, andbusiness models. This particular reportfocuses on trends and metrics in thefollowing areas:
Consumer Durables
Consumer Electronics
Consumer Services
Footwear, Apparel, and Accessories
Franchise Platforms
Internet Retail
Home Furnishings
Household Goods
Infant and Juvenile Products
Jewelry, Gifts, and Collectibles
Omni / Multi-Channel Brands
Outdoor and Lifestyle
Personal Care Products
Pet Care
Specialty and Mass Merchant Retailing
CONTACTS
North America
John NeunerManaging [email protected]+1 (804) 915-0125
Ryan BudlongManaging Director [email protected] +1 (415) 217-3409
Brent SpillerManaging [email protected]+1 (804) 915-0183
Corey [email protected]+1 (804) 932-1342
Zach EnglandVice [email protected]+1 (415) 217-3429
Beau PierceVice [email protected]+1 (804) 887-6113
Europe
Edward ArkusManaging [email protected]+44 207 518 8905
Will [email protected]+44 207 518 8906
CONSUMER AND RETAIL
INDUSTRY UPDATE │ JUNE 2017
The consumer sector continued to evolve during the past quarter as brands, retailers,and e-commerce companies continue to adapt to shifts in consumer preferences andbuying habits. Over the past three months, we have continued to see this play out inboth M&A activity and valuations. The traditional brick and mortar retailers continue toventure outside of historical business lines and acquire additional e-commerce DNA withdeals announced by the likes of Walmart, PetSmart, and Target among others. At thesame time, traditional e-commerce companies are pursuing brick and mortar strategiesto either solve perceived last mile issues or better control the overall consumer and brandexperience (e.g. Amazon’s purchase of Whole Foods). These channel changes as wellas the continued evolution of consumer tastes have created opportunities acrossmultiple segments within products, food, restaurant, and consumer services categories.During Q2 17, Harris Williams closed six consumer deals with companies that arebenefitting from evolution in the consumer market.
As highlighted in the chart below, consumer deal volume in 2017 has been lower thanthe same period the prior year. While Q2 data has not been fully compiled, the list ofclosed deals to date and our conversations with potential buyers (both strategic andfinancial) would indicate volume will remain at a comparable level to Q1. This lowervolume coupled with ample capital from strategic and financial buyers continues tocreate an environment that is favoring sellers. While some aggregated data showvaluations may have moderated, our experience is that for well positioned, growingconsumer companies that are capitalizing on the evolving consumer landscapecontinue to draw aggressive valuations and extremely favorable contract terms.
Consumer M&A Activity1
Company A
has been
acquired by
an infant and juvenile brand
Closed, not publicly
announced
has been acquired by
a portfolio company of
The Soup & Infant Feeding Business of
has been acquired by
has partnered with
a subsidiary of
has been acquired by
a portfolio company of
has been acquired by
a partnership of
PizzaRev
Founders &
Fast-casual pizza concept,
offering highly customizable
and high-quality pizzas
I&J brand that ignites
imagination and a sense of
wonder in all children
Leading full service
automotive maintenance
provider
Manufacturer of soups,
broths, gravies and
infant feeding products
Developer, manufacturer
and marketer of children’s
footwear
Manufacturer of a wide
range of pet products to a
diverse base of retailers

PAGE |
HARRIS WILLIAMS & CO. CONSUMER UPDATE
2
CONSUMER AND RETAIL
INDUSTRY UPDATE │ JUNE 2017
Given the imbalance in supply and demand referenced above, buyers across all segments (strategic/financial/patientcapital, domestic/international) have been very active – and increasingly proactive – in targeting assets of interest. Sellersin this market increasingly have options to be able to evaluate who the right partners are for the next chapter in thecompany’s growth. The fact that sellers are not required to compromise on value is reflected in the exit activity amongstprivate equity groups. As seen in the chart below, sales to financial buyers have swung back to be on par with strategicbuyers as they have become every bit as (if not more) competitive with strategic buyers on most assets in this market.
0
20
40
60
80
100
120
140
160
180
200
Q1 Q2 Q3 Q4 Q1 Q2 Q3 Q4 Q1 Q2 Q3 Q4 Q1 Q2 Q3 Q4 Q1 Q2 Q3 Q4 1Q 2Q 3Q Q4 1Q 2Q 3Q 4Q 1Q
2010 2011 2012 2013 2014 2015 2016 2017
Corporate Acquisition IPO Secondary Buyout
Private Equity Exits by Quarter
The ultimate driver of activity and change in the consumer space is the end consumer themselves. The past 3 monthscontinue to reflect the themes in the sector that have been building for several quarters/years – more disposable incomedriving aspirational purchases (ie. higher price point products), investing in health and wellness for themselves, their kids andtheir pets (this trend plays out in a variety of categories from fitness, product, food, etc), valuing experiences and servicesover products in some categories, and valuing convenience in their purchasing habits. These trends play out in the dealactivity and are reflected in the expansion/contraction in volume in certain segments.
CONSUMER M&A SECTOR DEAL FLOW1
M&A Transactions (count) by Sector
0%
10%
20%
30%
40%
50%
60%
70%
80%
90%
100%
Q1 Q2 Q3 Q4 Q1 Q2 Q3 Q4 1Q 2Q 3Q Q4 1Q 2Q 3Q 4Q 1Q
2013 2014 2015 2016 2017
Apparel and Accessories Durables Media Non-Durables Other Restaurants, Hotels and Leisure Retail
CONSUMER PRIVATE EQUITY EXIT ACTIVITY1

PAGE |
Noteworthy Transaction Description
Amazon Acquiring Whole Foods
Amazon announced that it has agreed to acquire Whole Foods for $13.7 billion. The deal highlights
Amazon’s expanding presence in retail as the company makes its first significant move into over 450
brick-and-mortar locations.
Target Investing in Casper
As acquisition talks fizzled between the two parties, Target countered with a $75 million investment in
Casper. As the leading investor in Casper, Target will now offer Casper’s mattresses, pillows, sheets
and more in its stores and on its website.
PetSmart Acquiring ChewyPetSmart has agreed to make the biggest e-commerce acquisition in history, putting a deal in place
to snatch up fast-growing pet food and product site Chewy.com for $3.35 billon.
Kohlberg Acquiring Newell Brands’ Winter
Sports Business
Kohlberg & Company has agreed to acquire Newell Brands’ winter sports business for $240 million.
The transaction is expected to close in early Q3 2017 and includes Völkl, K2, Marker, Dalbello,
Madshus, Line, Full Tilt, Atlas, Tubbs, Ride, and BCA.
Coach Acquiring Kate Spade
In an effort to resonate more with younger consumers, handbag maker Coach is buying its smaller
rival, Kate Spade & Co., for $2.4 billion. The deal is expected to close in Q3 2017 and puts M&A rumors
to rest.
Cornell Capital Acquiring World KitchenCornell Capital acquired World Kitchen bringing new commitment to World Kitchen’s product
innovation and growth strategy for iconic brands such as Pyrex, Corelle, and CorningWare.
CVC Capital Partners Acquiring PDC Brands
CVC Capital Partners acquired PDC Brands from Yellow Wood Partners – financial terms were not
disclosed. CVC looks to grow PDC Brands domestically and abroad by leveraging their deep sector
experience and global resources.
Samsonite Acquiring eBagsSamsonite International has acquired eBags for $105 million. Samsonite made the acquisition of
eBags as a way to strengthen its own e-commerce business to sell directly to consumers.
Wal-Mart Acquiring Bonobos
Wal-Mart has reached a deal to acquire Bonobos for $310 million marking a major step for Wal-Mart
as the company invests in an upscale fashion business. This acquisition further demonstrates the
company’s ongoing digital innovation strategy.
Spectrum Acquiring PetmatrixSpectrum Brands has agreed to acquire Petmatrix for $255 million. Petmartix is a manufacturer and
distributor of dog food products with brands including Dream Bones and Smart Bones.
Authentic Brands Group Acquiring Majority
Stake in Frye
Authentic Brands Group has acquired a 51% stake in Frye from Global Brands Group. The acquisition
marks as the first time ABG and Global Brands have co-owned a brand. The groups plan to expand
Frye to new product categories and grow its global retail presence with new standalone stores.
Ares Acquiring DevaCurlAres Management has agreed to acquire DevaCurl from Tengram Capital for an undisclosed
amount. DevaCurl is a leading professional and prestige hair care brand dedicated to curly hair.
HARRIS WILLIAMS & CO. CONSUMER UPDATE
3
CONSUMER AND RETAIL
INDUSTRY UPDATE │ JUNE 2017
In addition to our deals, Q2 had several noteworthy announced or closed consumer deals that reflect the changeshappening in the sector – several of these are noted below:
WHAT WE’RE READING
For the Wealthiest Americans, Amazon Prime has Become the Norm
“Households that made more than $112,000 per year, on the other hand, are nearing saturation, with 82 percent inpossession of Amazon Prime memberships, according to a survey of 5,500 U.S. teens about whether their families had Primememberships. The insight comes from a ongoing Jaffray survey on what brands teens consume and what trends teensfollow. It bases income on average household income for each teen’s zip code.
Recode
The Mall of the Future Will Have No Stores
“In all, retailers have announced 2,880 store closings from January to April 6 of this year, more than twice as many as in thesame period a year earlier, according to Credit Suisse .For the full year, the investment bank anticipates more than 8,600stores to close. Analysts predict that 400 or so of the roughly 1,100 malls in the U.S. will close in the coming years.”
WSJ
PAGE |
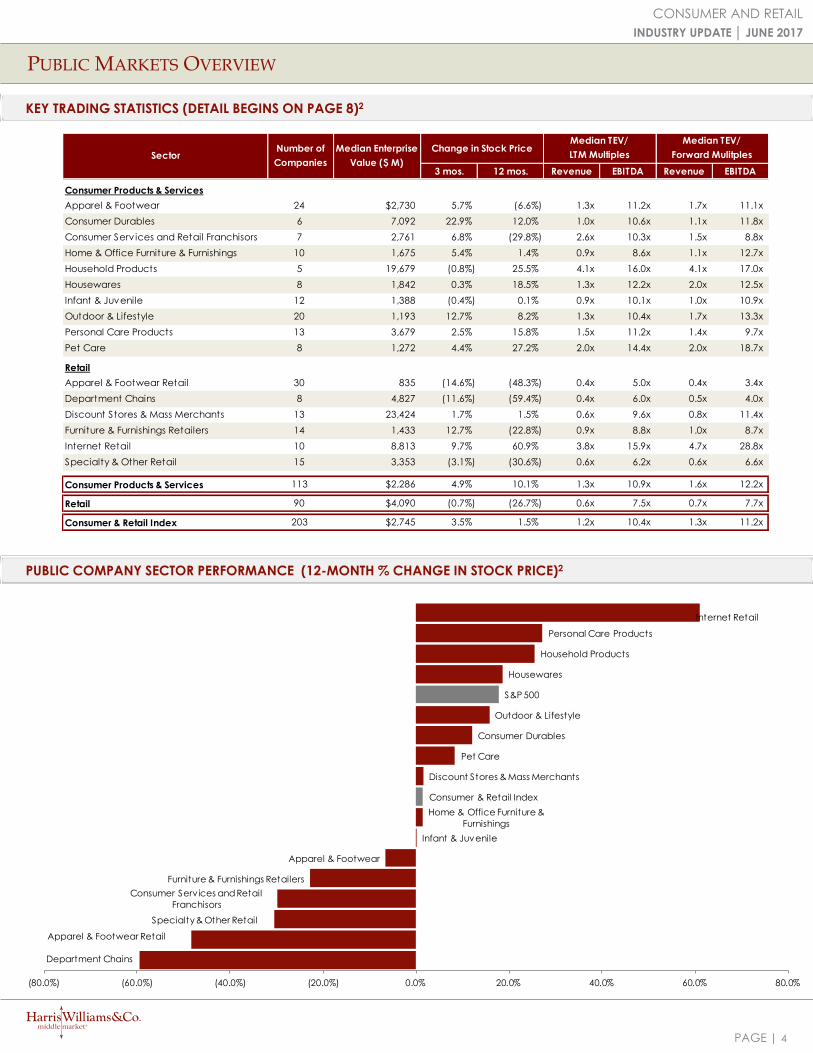
KEY TRADING STATISTICS (DETAIL BEGINS ON PAGE 8)2
PUBLIC MARKETS OVERVIEW
PUBLIC COMPANY SECTOR PERFORMANCE (12-MONTH % CHANGE IN STOCK PRICE)2
CONSUMER AND RETAIL
INDUSTRY UPDATE │ JUNE 2017
4
Change in Stock Price
3 mos. 12 mos. Revenue EBITDA Revenue EBITDA
Consumer Products & Services
Apparel & Footwear 24 $2,730 5.7% (6.6%) 1.3x 11.2x 1.7x 11.1x
Consumer Durables 6 7,092 22.9% 12.0% 1.0x 10.6x 1.1x 11.8x
Consumer Serv ices and Retail Franchisors 7 2,761 6.8% (29.8%) 2.6x 10.3x 1.5x 8.8x
Home & Office Furniture & Furnishings 10 1,675 5.4% 1.4% 0.9x 8.6x 1.1x 12.7x
Household Products 5 19,679 (0.8%) 25.5% 4.1x 16.0x 4.1x 17.0x
Housewares 8 1,842 0.3% 18.5% 1.3x 12.2x 2.0x 12.5x
Infant & Juvenile 12 1,388 (0.4%) 0.1% 0.9x 10.1x 1.0x 10.9x
Outdoor & Lifestyle 20 1,193 12.7% 8.2% 1.3x 10.4x 1.7x 13.3x
Personal Care Products 13 3,679 2.5% 15.8% 1.5x 11.2x 1.4x 9.7x
Pet Care 8 1,272 4.4% 27.2% 2.0x 14.4x 2.0x 18.7x
Retail
Apparel & Footwear Retail 30 835 (14.6%) (48.3%) 0.4x 5.0x 0.4x 3.4x
Department Chains 8 4,827 (11.6%) (59.4%) 0.4x 6.0x 0.5x 4.0x
Discount Stores & Mass Merchants 13 23,424 1.7% 1.5% 0.6x 9.6x 0.8x 11.4x
Furniture & Furnishings Retailers 14 1,433 12.7% (22.8%) 0.9x 8.8x 1.0x 8.7x
Internet Retail 10 8,813 9.7% 60.9% 3.8x 15.9x 4.7x 28.8x
Specialty & Other Retail 15 3,353 (3.1%) (30.6%) 0.6x 6.2x 0.6x 6.6x
Consumer Products & Services 113 $2,286 4.9% 10.1% 1.3x 10.9x 1.6x 12.2x
Retail 90 $4,090 (0.7%) (26.7%) 0.6x 7.5x 0.7x 7.7x
Consumer & Retail Index 203 $2,745 3.5% 1.5% 1.2x 10.4x 1.3x 11.2x
SectorNumber of
Companies
Median Enterprise
Value ($ M)
Median TEV/
Forward Mulitples
Median TEV/
LTM Multiples
Department Chains
Apparel & Footwear Retail
Specialty & Other Retail
Consumer Serv ices and Retail
Franchisors
Furniture & Furnishings Retailers
Apparel & Footwear
Infant & Juvenile
Home & Office Furniture &
Furnishings
Consumer & Retail Index
Discount Stores & Mass Merchants
Pet Care
Consumer Durables
Outdoor & Lifestyle
S&P 500
Housewares
Household Products
Personal Care Products
Internet Retail
(80.0%) (60.0%) (40.0%) (20.0%) 0.0% 20.0% 40.0% 60.0% 80.0%

PAGE |
CONSUMER AND RETAIL INDUSTRY STOCK PERFORMANCE2
PUBLIC MARKETS OVERVIEW
5
RECENT EQUITY OFFERINGS3
CONSUMER AND RETAIL
INDUSTRY UPDATE │ JUNE 2017
Close Date Filing Date Issuer Ticker
Transaction
Type
Gross Proceeds
($ M) Primary Industry
05/04/17 05/04/17 Planet Fitness, Inc. PLNT Follow-On $326.2 Other Consumer Serv ices
04/28/17 04/28/17 Carvana Co. CVNA IPO 225.0 E-Commerce
04/05/17 04/05/17 Winnebago Industries WGO Follow-On 61.5 Recreational Products
03/31/17 03/31/17 Elf Beauty ELF Follow-On 225.2 Household/Personal Care
03/15/07 03/15/17 Canada Goose GOOS IPO 250.0 Apparel
01/27/17 01/27/17 Horizon Global HZN Follow-On 74.0 Automotive Aftermarket
12/12/16 12/12/16 The Michaels Companies, Inc. MIK Follow-On 264.5 Specialty Stores
12/08/16 12/08/16 MCBC Holdings MCFT Follow-On 20.0 Recreational Products
11/16/16 11/16/16 Planet Fitness, Inc. PLNT Follow-On 348.3 Other Consumer Serv ices
11/16/16 11/16/16 Fox Factory Holding Corp. FOXF Follow-On 82.6 Recreational Products
11/01/16 11/01/16 Walgreens Boots Alliance WBA Follow-On 1,667.6 Drugstore Chains
10/28/16 10/28/16 Acushnet Holdings Corp. GOLF IPO 378.0 Recreational Products
50
75
100
125
150
175
Jun-13 Oct-13 Feb-14 Jun-14 Oct-14 Feb-15 Jun-15 Oct-15 Feb-16 Jun-16 Oct-16 Feb-17 Jun-17
Ind
ex
Dow Jones U.S. Retail Index Dow Jones U.S. Consumer Goods Index Dow Jones U.S. Consumer Services S&P 500 Index
PAGE | 6
CONSUMER AND RETAIL
INDUSTRY UPDATE │ JUNE 2017
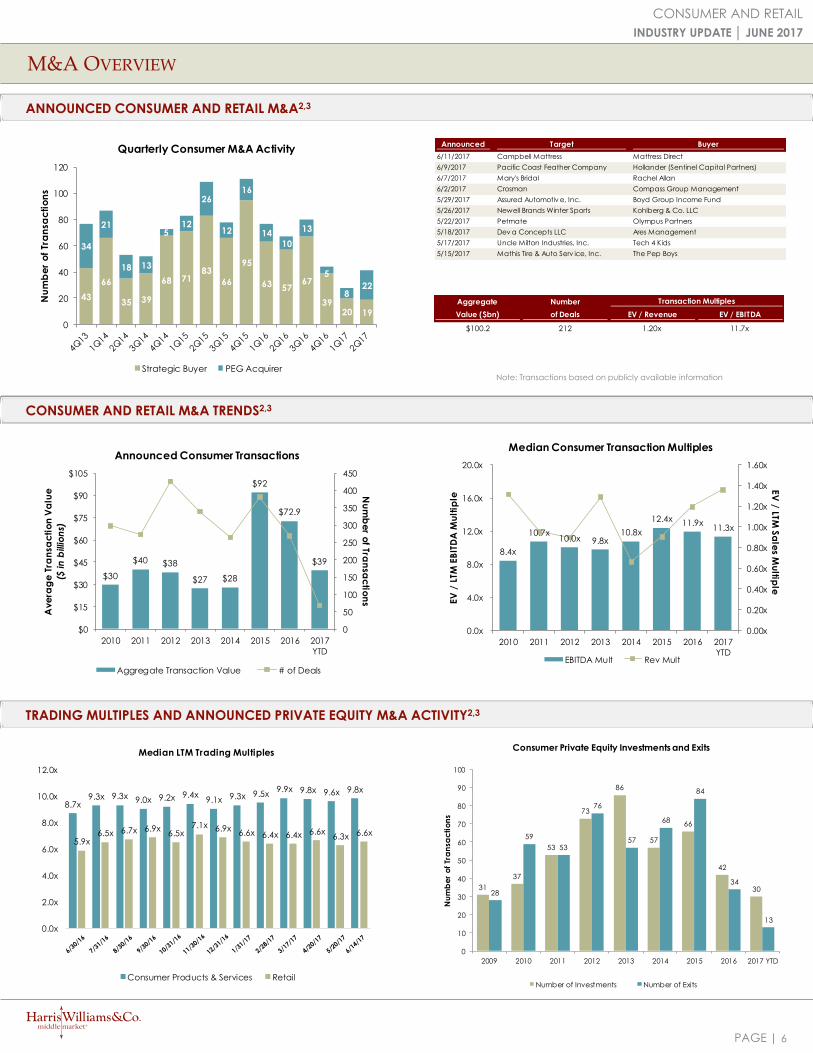
M&A OVERVIEW
Note: Transactions based on publicly available information
CONSUMER AND RETAIL M&A TRENDS2,3
TRADING MULTIPLES AND ANNOUNCED PRIVATE EQUITY M&A ACTIVITY2,3
ANNOUNCED CONSUMER AND RETAIL M&A2,3
$30
$40 $38
$27 $28
$92
$72.9
$39
0
50
100
150
200
250
300
350
400
450
$0
$15
$30
$45
$60
$75
$90
$105
2010 2011 2012 2013 2014 2015 2016 2017
YTD
Nu
mb
er o
f Tran
sac
tion
s
Ave
rag
e T
ran
sac
tio
n V
alu
e
($ in
bill
ion
s)
Announced Consumer Transactions
Aggregate Transaction Value # of Deals
8.4x
10.7x 10.0x 9.8x
10.8x
12.4x 11.9x 11.3x
0.00x
0.20x
0.40x
0.60x
0.80x
1.00x
1.20x
1.40x
1.60x
0.0x
4.0x
8.0x
12.0x
16.0x
20.0x
2010 2011 2012 2013 2014 2015 2016 2017
YTD
EV
/ LTM S
ale
s Mu
ltiple
EV
/ L
TM E
BIT
DA
Mu
ltip
leMedian Consumer Transaction Multiples
EBITDA Mult Rev Mult
43
66
35 39
68 7183
66
95
63 5767
3920 19
34
21
18 13
512
26
12
16
1410
13
5
822
0
20
40
60
80
100
120
Nu
mb
er
of
Tra
nsa
cti
on
s
Quarterly Consumer M&A Activity
Strategic Buyer PEG Acquirer
31
37
53
73
86
57
66
42
3028
59
53
76
57
68
84
34
13
0
10
20
30
40
50
60
70
80
90
100
2009 2010 2011 2012 2013 2014 2015 2016 2017 YTD
Nu
mb
er
of
Tra
nsa
cti
on
s
Consumer Private Equity Investments and Exits
Number of Investments Number of Exits
8.7x9.3x 9.3x 9.0x 9.2x 9.4x
9.1x 9.3x 9.5x9.9x 9.8x 9.6x 9.8x
5.9x6.5x 6.7x 6.9x
6.5x7.1x 6.9x
6.6x 6.4x 6.4x 6.6x6.3x 6.6x
0.0x
2.0x
4.0x
6.0x
8.0x
10.0x
12.0x
Median LTM Trading Multiples
Consumer Products & Services Retail
Aggregate Number Transaction Multiples
Value ($bn) of Deals EV / Revenue EV / EBITDA
$100.2 212 1.20x 11.7x
Announced Target Buyer
6/11/2017 Campbell Mattress Mattress Direct
6/9/2017 Pacific Coast Feather Company Hollander (Sentinel Capital Partners)
6/7/2017 Mary's Bridal Rachel Allan
6/2/2017 Crosman Compass Group Management
5/29/2017 Assured Automotiv e, Inc. Boyd Group Income Fund
5/26/2017 Newell Brands Winter Sports Kohlberg & Co. LLC
5/22/2017 Petmate Olympus Partners
5/18/2017 Dev a Concepts LLC Ares Management
5/17/2017 Uncle Milton Industries, Inc. Tech 4 Kids
5/15/2017 Mathis Tire & Auto Serv ice, Inc. The Pep Boys

PAGE |
0
2
4
6
8
10
12
14
1Q09 3Q09 1Q10 3Q10 1Q11 3Q11 1Q12 3Q12 1Q13 3Q13 1Q14 3Q14 1Q15
Loa
n V
olu
me
by
Qu
art
er
($ i
n b
illi
on
s)
Quarterly Retail Loan Volume
Institutional Pro Rata
7
CONSUMER AND RETAIL
INDUSTRY UPDATE │ JUNE 2017
DEBT MARKET OVERVIEW
COMMENTARY ON RECENT CONSUMER AND RETAIL DEBT TRANSACTIONS4,5
KEY RETAIL CREDIT STATISTICS2,5
0.00
2.00
4.00
6.00
8.00
10.00
12.00
14.00
4Q102Q114Q112Q124Q122Q134Q132Q144Q142Q154Q152Q164Q16
Loa
n V
olu
me
by
Qu
art
er
($ i
n b
illi
on
s)
Quarterly Retail Loan Volume
Institutional Pro Rata
L + 0
L + 100
L + 200
L + 300
L + 400
L + 500
L + 600
L + 700
2008 2009 2010 2011 2012 2013 2014 2015 2016 4Q16
Ave
rag
e S
pre
ad
Ove
r LI
BO
R
Average Spread on Retail Loans
Revolving Credit / Term Loan A Weighted-Average Institutional
L + 0
L + 500
L + 1000
L + 1500
L + 2000
L + 2500
4Q06 4Q07 4Q08 4Q09 4Q10 4Q11 4Q12 4Q13 4Q14 4Q15 4Q16
Ave
rag
e S
pre
ad
Ove
r LI
BO
R
Average Secondary Spread
0.0x
1.0x
2.0x
3.0x
4.0x
5.0x
6.0x
Debt/EBITDA Senior
Debt/EBITDA
EBITDA/Cash
Interest
EBITDA -
Capex/Cash
Interest
EB
ITD
A M
ult
iple
Credit Statistics
2010 2011 2012 2013 2014 2015 2016
• Arrangers have launched a $260 million covenant-lite B term loan for Melissa & Doug, with commitments due byWednesday, June 21. Price talk on the seven-year loan is making the rounds at L+500, with a 1% LIBOR floor and anOID of 99. Lenders are offered six months of 101 soft call protection.
• Accounts have received allocations of a $205 million first-lien term loan for Rough Country. Golub Capital was solelead arranger. The covenant-lite term loan due 2023 (L+450, 1% LIBOR floor) priced in line with talk and broke to a99.5/100.25 market, from issuance at 99. The loan backs the buyout of the company by Gridiron Capital. First-lienfinancing also includes a $20 million, five-year revolver. An $85 million, second-lien term loan was privately placed.Carlyle Private Credit led the second-lien tranche. Dyersburg, Tenn.–based Rough Country is a provider of after-market auto products, focused on lift and level kits catered to off-road enthusiasts.
• The term debt of clothing retailer Eddie Bauer has been marked at 45.5/50 in the wake of the private release of a2017 budget which forecast a profit of half the previous forecast. Eddie Bauer placed a $225 million, six-year termloan (L+525) at 98.5 in May 2014. Proceeds from the loan were used to refinance secured notes and fund apayment to sponsor Golden Gate Capital. Goldman Sachs, Guggenheim, and MCS Capital Markets werearrangers.

PAGE |
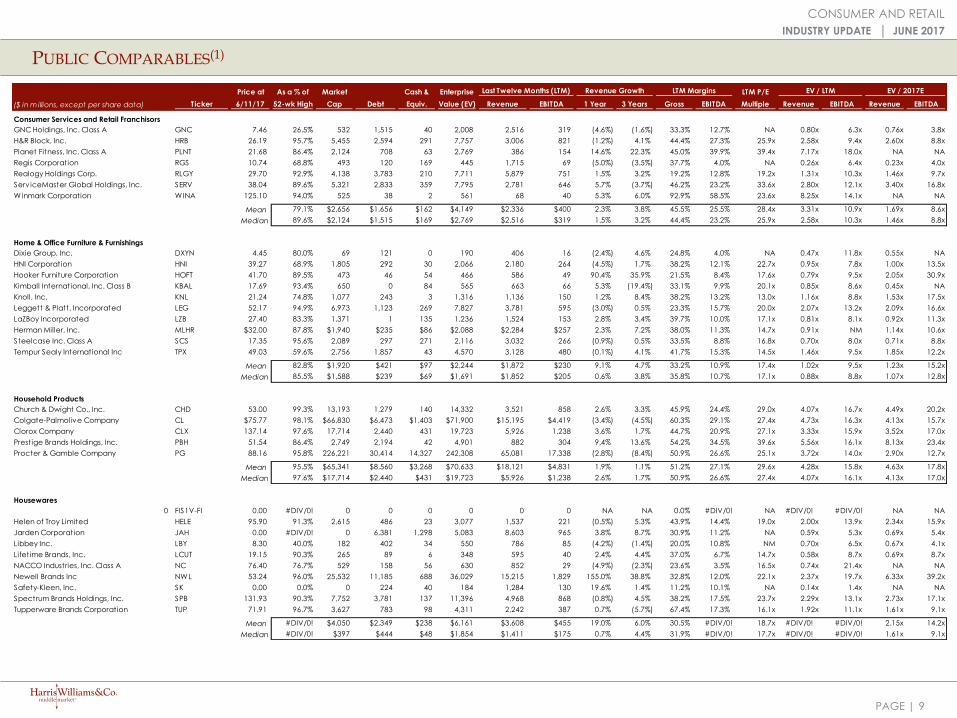
PUBLIC COMPARABLES(1)
CONSUMER AND RETAIL
INDUSTRY UPDATE │ JUNE 2017
8
Price at As a % of Market Cash & Enterprise LTM P/E
($ in m illions, except per share data) Ticker 6/11/17 52-wk High Cap Debt Equiv. Value (EV) Revenue EBITDA 1 Year 3 Years Gross EBITDA Multiple Revenue EBITDA Revenue EBITDA
Consumer Products & Services
Apparel & Footwear
Coach, Inc. COH 46.72 98.8% 13,115 592 1,892 11,815 4,509 1,011 3.9% (2.7%) 69.0% 22.4% 25.3x 2.62x 11.7x 2.39x 7.6x
Columbia Sportswear Company COLM 57.26 90.1% 4,019 14 590 3,443 2,396 315 1.0% 10.8% 44.6% 13.1% 20.6x 1.44x 10.9x 2.04x 19.0x
Carter's, Inc. CRI 86.08 76.5% $4,230 $582 $154 $4,658 $3,208 $449 5.1% 5.9% 43.1% 14.0% 17.3x 1.45x 10.4x 1.77x 12.4x
Crocs, Inc. CROX 7.16 57.1% 550 5 91 463 1,025 32 (7.5%) (4.9%) 46.5% 3.1% NA 0.45x 14.5x 0.39x 3.5x
Deckers Outdoor Corporation DECK 70.04 96.3% 2,238 33 292 1,979 1,783 204 (5.0%) 14.8% 46.4% 11.4% NM 1.11x 9.7x 1.58x 9.9x
Fossil Group, Inc. FOSL 10.84 29.4% 523 616 321 818 2,964 243 (6.3%) (4.0%) 51.3% 8.2% 21.3x 0.28x 3.4x 0.25x 1.3x
G-III Apparel Group, Ltd. GIII 25.84 49.9% 1,258 493 67 1,683 2,458 136 3.8% 10.7% 34.3% 5.5% 31.1x 0.68x 12.4x 1.00x 11.7x
Hanesbrands Inc. HBI 22.07 78.2% 8,319 4,140 464 11,995 6,189 1,026 7.8% 9.3% 38.9% 16.6% 16.0x 1.94x 11.7x 2.59x 17.5x
Iconix Brand Group, Inc. ICON 6.60 61.1% 379 1,160 208 1,330 333 169 (12.5%) (6.9%) 0.0% 50.9% NA 4.00x 7.9x 3.07x 5.1x
Kate Spade & Co KATE 18.47 76.2% 2,375 393 422 2,346 1,378 237 9.2% 4.1% 60.3% 17.2% 16.7x 1.70x NM 1.85x 20.2x
NIKE, Inc. Class B NKE 53.46 88.6% 89,518 3,501 6,160 86,859 33,810 4,798 5.5% 7.7% 43.7% 14.2% 22.3x 2.57x 18.1x 3.24x 21.7x
Oxford Industries, Inc. OXM 61.49 80.7% 1,047 93 7 1,134 1,039 116 7.6% 3.4% 56.6% 11.2% 20.7x 1.09x 9.7x 1.24x 9.9x
Perry Ellis International, Inc. PERY 19.20 66.2% 304 147 43 409 842 34 (5.9%) (2.5%) 35.6% 4.0% 23.1x 0.49x 12.2x 0.45x 12.6x
PVH Corp. PVH 105.59 91.5% 8,293 3,200 491 11,002 8,274 1,032 2.7% 0.1% 53.5% 12.5% 21.8x 1.33x 10.7x 1.37x 9.0x
Ralph Lauren Corporation Class A RL 70.15 61.5% 5,693 862 1,386 5,169 6,653 983 (10.2%) (3.7%) 57.5% 14.8% NA 0.78x 5.3x 0.71x 3.7x
Steven Madden, Ltd. SHOO 39.75 98.0% 2,394 0 140 2,254 1,437 178 1.8% 2.3% 37.1% 12.4% 19.4x 1.57x 12.7x 1.72x 10.4x
Skechers U.S.A., Inc. Class A SKX 27.32 83.5% 4,318 77 608 3,787 3,657 428 8.9% 23.5% 43.5% 11.7% 17.7x 1.04x 8.9x 2.05x 28.5x
Gildan Activewear Inc. GIL-CA 30.42 95.7% 6,865 771 82 7,554 2,657 552 (8.9%) 6.3% 27.3% 20.8% 19.4x 2.84x 13.7x 3.58x 17.6x
Tumi Holdings, Inc. TUMI 0.00 0.0% 0 7 113 (106) 565 117 4.0% 9.2% 59.4% 20.7% NA NM NM NM NM
Under Armour, Inc. Class C UA 20.21 47.1% 9,686 861 172 10,375 4,895 560 16.4% 25.1% 46.0% 11.5% NM 2.12x 18.5x 4.45x 32.8x
V.F. Corporation VFC 55.33 84.8% 22,666 2,594 604 24,655 11,721 1,266 (5.7%) 0.4% 44.1% 10.8% 19.7x 2.10x 19.5x 2.16x 13.0x
Vera Bradley, Inc. VRA 9.00 52.3% 329 0 84 246 477 45 (5.9%) (3.2%) 55.7% 9.5% 24.7x 0.51x 5.4x 0.46x 2.2x
Weyco Group, Inc. WEYS 28.90 89.5% 301 0 26 274 287 27 (10.7%) (1.6%) 36.9% 9.4% 19.0x 0.96x 10.2x 0.91x NA
Wolverine World Wide, Inc. WWW 26.86 99.2% 2,611 813 304 3,120 2,525 273 (4.3%) (1.9%) 39.0% 10.8% 30.5x 1.24x 11.4x 1.16x 10.5x
Mean 73.0% $7,960 $873 $613 $8,219 $4,378 $593 (0.2%) 4.3% 44.6% 14.0% 21.5x 1.49x 11.3x 1.76x 12.7x
Median 79.4% $2,503 $537 $250 $2,733 $2,492 $258 1.4% 2.9% 44.3% 12.0% 20.7x 1.33x 11.2x 1.72x 11.1x
Consumer Durables
Arcelik A.S. ARCLK-TR 7.44 96.8% 4,967 1,833 794 6,007 5,370 596 2.7% (2.1%) 31.5% 11.1% 11.4x 1.12x 10.1x 1.16x 11.1x
Electrolux AB Class B ELUX.B-SE 32.55 98.6% 9,953 1,086 880 10,158 14,058 1,185 (2.9%) (5.7%) 20.5% 8.4% 17.2x 0.72x 8.6x 0.60x 10.4x
iRobot Corporation IRBT 95.99 95.1% 2,686 0 276 2,410 698 89 10.9% 12.1% 50.3% 12.8% 49.7x 3.45x 27.0x 4.94x 41.7x
Middleby Corporation MIDD 130.95 86.8% 7,492 729 77 8,144 2,282 530 17.8% 15.7% 41.2% 23.2% 24.9x 3.57x 15.4x 5.70x 27.7x
Haier Electronics Group Co., Ltd. 1169-HK 2.64 95.7% 7,361 197 1,889 5,669 9,612 520 (3.8%) (1.7%) 17.7% 5.4% 17.5x 0.59x 10.9x 0.55x 12.4x
Whirlpool Corporation WHR 190.98 98.0% 14,053 5,033 951 18,135 20,888 1,998 1.1% 3.4% 16.6% 9.6% 16.5x 0.87x 9.1x 0.97x 9.9x
Mean 95.2% $7,752 $1,480 $811 $8,420 $8,818 $820 4.3% 3.6% 29.6% 11.8% 22.9x 1.72x 13.5x 2.32x 18.9x
Median 96.3% $7,427 $907 $837 $7,076 $7,491 $563 1.9% 0.8% 26.0% 10.3% 17.3x 0.99x 10.5x 1.07x 11.7x
Last Twelve Months (LTM) EV / LTM EV / 2017ERevenue Growth LTM Margins
PAGE |
PUBLIC COMPARABLES(1)
CONSUMER AND RETAIL
INDUSTRY UPDATE │ JUNE 2017
9
Price at As a % of Market Cash & Enterprise LTM P/E
($ in m illions, except per share data) Ticker 6/11/17 52-wk High Cap Debt Equiv. Value (EV) Revenue EBITDA 1 Year 3 Years Gross EBITDA Multiple Revenue EBITDA Revenue EBITDA
Consumer Services and Retail Franchisors
GNC Holdings, Inc. Class A GNC 7.46 26.5% 532 1,515 40 2,008 2,516 319 (4.6%) (1.6%) 33.3% 12.7% NA 0.80x 6.3x 0.76x 3.8x
H&R Block, Inc. HRB 26.19 95.7% 5,455 2,594 291 7,757 3,006 821 (1.2%) 4.1% 44.4% 27.3% 25.9x 2.58x 9.4x 2.60x 8.8x
Planet Fitness, Inc. Class A PLNT 21.68 86.4% 2,124 708 63 2,769 386 154 14.6% 22.3% 45.0% 39.9% 39.4x 7.17x 18.0x NA NA
Regis Corporation RGS 10.74 68.8% 493 120 169 445 1,715 69 (5.0%) (3.5%) 37.7% 4.0% NA 0.26x 6.4x 0.23x 4.0x
Realogy Holdings Corp. RLGY 29.70 92.9% 4,138 3,783 210 7,711 5,879 751 1.5% 3.2% 19.2% 12.8% 19.2x 1.31x 10.3x 1.46x 9.7x
Serv iceMaster Global Holdings, Inc. SERV 38.04 89.6% 5,321 2,833 359 7,795 2,781 646 5.7% (3.7%) 46.2% 23.2% 33.6x 2.80x 12.1x 3.40x 16.8x
Winmark Corporation WINA 125.10 94.0% 525 38 2 561 68 40 5.3% 6.0% 92.9% 58.5% 23.6x 8.25x 14.1x NA NA
Mean 79.1% $2,656 $1,656 $162 $4,149 $2,336 $400 2.3% 3.8% 45.5% 25.5% 28.4x 3.31x 10.9x 1.69x 8.6x
Median 89.6% $2,124 $1,515 $169 $2,769 $2,516 $319 1.5% 3.2% 44.4% 23.2% 25.9x 2.58x 10.3x 1.46x 8.8x
Home & Office Furniture & Furnishings
Dixie Group, Inc. DXYN 4.45 80.0% 69 121 0 190 406 16 (2.4%) 4.6% 24.8% 4.0% NA 0.47x 11.8x 0.55x NA
HNI Corporation HNI 39.27 68.9% 1,805 292 30 2,066 2,180 264 (4.5%) 1.7% 38.2% 12.1% 22.7x 0.95x 7.8x 1.00x 13.5x
Hooker Furniture Corporation HOFT 41.70 89.5% 473 46 54 466 586 49 90.4% 35.9% 21.5% 8.4% 17.6x 0.79x 9.5x 2.05x 30.9x
Kimball International, Inc. Class B KBAL 17.69 93.4% 650 0 84 565 663 66 5.3% (19.4%) 33.1% 9.9% 20.1x 0.85x 8.6x 0.45x NA
Knoll, Inc. KNL 21.24 74.8% 1,077 243 3 1,316 1,136 150 1.2% 8.4% 38.2% 13.2% 13.0x 1.16x 8.8x 1.53x 17.5x
Leggett & Platt, Incorporated LEG 52.17 94.9% 6,973 1,123 269 7,827 3,781 595 (3.0%) 0.5% 23.3% 15.7% 20.0x 2.07x 13.2x 2.09x 16.6x
LaZBoy Incorporated LZB 27.40 83.3% 1,371 1 135 1,236 1,524 153 2.8% 3.4% 39.7% 10.0% 17.1x 0.81x 8.1x 0.92x 11.3x
Herman Miller, Inc. MLHR $32.00 87.8% $1,940 $235 $86 $2,088 $2,284 $257 2.3% 7.2% 38.0% 11.3% 14.7x 0.91x NM 1.14x 10.6x
Steelcase Inc. Class A SCS 17.35 95.6% 2,089 297 271 2,116 3,032 266 (0.9%) 0.5% 33.5% 8.8% 16.8x 0.70x 8.0x 0.71x 8.8x
Tempur Sealy International Inc TPX 49.03 59.6% 2,756 1,857 43 4,570 3,128 480 (0.1%) 4.1% 41.7% 15.3% 14.5x 1.46x 9.5x 1.85x 12.2x
Mean 82.8% $1,920 $421 $97 $2,244 $1,872 $230 9.1% 4.7% 33.2% 10.9% 17.4x 1.02x 9.5x 1.23x 15.2x
Median 85.5% $1,588 $239 $69 $1,691 $1,852 $205 0.6% 3.8% 35.8% 10.7% 17.1x 0.88x 8.8x 1.07x 12.8x
Household Products
Church & Dwight Co., Inc. CHD 53.00 99.3% 13,193 1,279 140 14,332 3,521 858 2.6% 3.3% 45.9% 24.4% 29.0x 4.07x 16.7x 4.49x 20.2x
Colgate-Palmolive Company CL $75.77 98.1% $66,830 $6,473 $1,403 $71,900 $15,195 $4,419 (3.4%) (4.5%) 60.3% 29.1% 27.4x 4.73x 16.3x 4.13x 15.7x
Clorox Company CLX 137.14 97.6% 17,714 2,440 431 19,723 5,926 1,238 3.6% 1.7% 44.7% 20.9% 27.1x 3.33x 15.9x 3.52x 17.0x
Prestige Brands Holdings, Inc. PBH 51.54 86.4% 2,749 2,194 42 4,901 882 304 9.4% 13.6% 54.2% 34.5% 39.6x 5.56x 16.1x 8.13x 23.4x
Procter & Gamble Company PG 88.16 95.8% 226,221 30,414 14,327 242,308 65,081 17,338 (2.8%) (8.4%) 50.9% 26.6% 25.1x 3.72x 14.0x 2.90x 12.7x
Mean 95.5% $65,341 $8,560 $3,268 $70,633 $18,121 $4,831 1.9% 1.1% 51.2% 27.1% 29.6x 4.28x 15.8x 4.63x 17.8x
Median 97.6% $17,714 $2,440 $431 $19,723 $5,926 $1,238 2.6% 1.7% 50.9% 26.6% 27.4x 4.07x 16.1x 4.13x 17.0x
Housewares
0 FIS1V-FI 0.00 #DIV/0! 0 0 0 0 0 0 NA NA 0.0% #DIV/0! NA #DIV/0! #DIV/0! NA NA
Helen of Troy Limited HELE 95.90 91.3% 2,615 486 23 3,077 1,537 221 (0.5%) 5.3% 43.9% 14.4% 19.0x 2.00x 13.9x 2.34x 15.9x
Jarden Corporation JAH 0.00 #DIV/0! 0 6,381 1,298 5,083 8,603 965 3.8% 8.7% 30.9% 11.2% NA 0.59x 5.3x 0.69x 5.4x
Libbey Inc. LBY 8.30 40.0% 182 402 34 550 786 85 (4.2%) (1.4%) 20.0% 10.8% NM 0.70x 6.5x 0.67x 4.1x
Lifetime Brands, Inc. LCUT 19.15 90.3% 265 89 6 348 595 40 2.4% 4.4% 37.0% 6.7% 14.7x 0.58x 8.7x 0.69x 8.7x
NACCO Industries, Inc. Class A NC 76.40 76.7% 529 158 56 630 852 29 (4.9%) (2.3%) 23.6% 3.5% 16.5x 0.74x 21.4x NA NA
Newell Brands Inc NWL 53.24 96.0% 25,532 11,185 688 36,029 15,215 1,829 155.0% 38.8% 32.8% 12.0% 22.1x 2.37x 19.7x 6.33x 39.2x
Safety-Kleen, Inc. SK 0.00 0.0% 0 224 40 184 1,284 130 19.6% 1.4% 11.2% 10.1% NA 0.14x 1.4x NA NA
Spectrum Brands Holdings, Inc. SPB 131.93 90.3% 7,752 3,781 137 11,396 4,968 868 (0.8%) 4.5% 38.2% 17.5% 23.7x 2.29x 13.1x 2.73x 17.1x
Tupperware Brands Corporation TUP 71.91 96.7% 3,627 783 98 4,311 2,242 387 0.7% (5.7%) 67.4% 17.3% 16.1x 1.92x 11.1x 1.61x 9.1x
Mean #DIV/0! $4,050 $2,349 $238 $6,161 $3,608 $455 19.0% 6.0% 30.5% #DIV/0! 18.7x #DIV/0! #DIV/0! 2.15x 14.2x
Median #DIV/0! $397 $444 $48 $1,854 $1,411 $175 0.7% 4.4% 31.9% #DIV/0! 17.7x #DIV/0! #DIV/0! 1.61x 9.1x
Last Twelve Months (LTM) LTM Margins EV / LTM EV / 2017ERevenue Growth

PAGE |
PUBLIC COMPARABLES(1)
CONSUMER AND RETAIL
INDUSTRY UPDATE │ JUNE 2017
10
Price at As a % of Market Cash & Enterprise LTM P/E
($ in m illions, except per share data) Ticker 6/11/17 52-wk High Cap Debt Equiv. Value (EV) Revenue EBITDA 1 Year 3 Years Gross EBITDA Multiple Revenue EBITDA Revenue EBITDA
Infant & Juvenile
Carter's, Inc. CRI 86.08 76.5% 4,230 582 154 4,658 3,208 449 5.1% 5.9% 43.1% 14.0% 17.3x 1.45x 10.4x 1.77x 12.4x
Crown Crafts, Inc. CRWS 7.85 76.7% 79 0 14 65 74 11 (13.6%) (3.0%) 27.9% 15.1% 12.9x 0.88x 5.8x 0.80x 6.1x
Dorel Industries Inc. Class B DII.B 25.43 82.0% 820 496 38 1,278 2,604 161 (2.2%) 1.5% 22.6% 6.2% NA 0.49x 8.0x 0.52x 7.6x
Hasbro, Inc. HAS 107.90 98.3% 13,520 1,614 1,487 13,648 5,089 1,009 11.3% 7.5% 52.0% 19.8% 24.0x 2.68x 13.5x 3.34x 18.3x
JAKKS Pacific, Inc. JAKK 4.10 42.1% 110 175 68 217 705 38 (3.0%) 3.4% 31.5% 5.4% NM 0.31x 5.7x 0.34x NM
Mattel, Inc. MAT 22.27 65.0% 7,584 2,315 382 9,517 5,323 820 (5.8%) (6.1%) 46.2% 15.4% 27.8x 1.79x 11.6x 1.47x 6.9x
Mothercare plc MTC-GB 1.60 75.6% 263 39 45 257 976 64 (8.8%) (5.5%) 9.2% 6.6% 4.8x 0.26x 4.0x 0.21x 4.5x
Newell Brands Inc NWL 53.24 96.0% 25,532 11,185 688 36,029 15,215 1,829 155.0% 38.8% 32.8% 12.0% 22.1x 2.37x 19.7x 6.33x 39.2x
Children's Place, Inc. PLCE 105.85 84.5% 1,899 27 231 1,695 1,803 223 3.6% 0.9% 33.9% 12.4% 17.5x 0.94x 7.6x 0.96x 9.6x
Goodbaby International Holdings Ltd. 1086-HK 0.45 72.9% 503 158 101 560 804 54 (10.4%) 14.2% 33.8% 6.7% 18.4x 0.70x 10.4x 1.04x 16.1x
Summer Infant, Inc. SUMR 1.90 77.9% 35 47 1 81 192 7 (5.2%) (1.3%) 29.4% 3.8% NA 0.42x 11.1x 0.39x 11.0x
Tomy Company, Ltd. 7867-JP 12.92 97.3% 1,244 606 336 1,514 1,533 151 16.6% (2.4%) 35.8% 9.8% 27.9x 0.99x 10.0x 0.98x 13.3x
Mean 78.7% $4,652 $1,437 $295 $5,793 $3,127 $401 11.9% 4.5% 33.2% 10.6% 19.2x 1.11x 9.8x 1.51x 13.2x
Median 77.3% $1,032 $335 $128 $1,396 $1,668 $156 (2.6%) 1.2% 33.3% 10.9% 18.4x 0.91x 10.2x 0.97x 11.0x
Outdoor & Lifestyle
Arctic Cat Inc. ACAT $0.00 0.0% $0 $79 $10 $69 $508 ($61) (16.7%) (10.1%) 9.1% NM NA 0.13x NM 0.10x 0.9x
Brunswick Corporation BC 60.79 98.5% 5,527 442 285 5,684 4,579 538 9.3% 5.8% 27.2% 11.7% 20.2x 1.24x 10.6x 1.46x 14.0x
Black Diamond, Inc. BDE 6.80 99.3% 201 0 74 128 151 (0) 8.7% (9.8%) 28.2% NM NA 0.84x NM 0.63x 16.5x
Columbia Sportswear Company COLM 57.26 90.1% 4,019 14 590 3,443 2,396 315 1.0% 10.8% 44.6% 13.1% 20.6x 1.44x 10.9x 2.04x 19.0x
Callaway Golf Company ELY 12.70 95.1% 1,188 77 48 1,218 907 63 8.7% (0.0%) 44.4% 7.0% 6.9x 1.34x NM 1.44x 37.4x
Escalade, Incorporated ESCA 12.95 88.1% 189 24 3 210 164 21 4.6% (0.4%) 24.2% 12.8% 16.5x 1.28x 10.0x NA NA
Fox Factory Holding Corp. FOXF 32.70 96.2% 1,228 66 43 1,251 429 70 13.2% 16.1% 32.2% 16.2% 29.2x 2.92x 18.0x 4.59x 25.3x
GoPro, Inc. Class A GPRO 8.37 47.3% 1,222 0 75 1,147 1,221 (221) (15.3%) 8.1% 40.3% NM NA 0.94x NM 1.16x 8.9x
Amer Sports Oyj Class A AMEAS-FI 23.83 75.0% 2,856 917 316 3,457 2,905 290 1.4% 0.4% 44.3% 10.0% 20.6x 1.19x 11.9x 1.17x 12.7x
Rapala VMC Oyj RAP1V-FI 4.51 81.6% 175 138 36 277 288 23 (6.0%) (8.4%) 22.9% 7.9% NA 0.96x 12.2x 0.70x 6.0x
Harley-Davidson, Inc. HOG 53.28 84.0% 9,384 6,971 920 15,435 5,748 1,146 (5.3%) (1.7%) 36.6% 19.9% 15.1x 2.69x 13.5x 2.94x 11.4x
Johnson Outdoors Inc. Class A JOUT 45.86 97.6% 460 5 29 436 458 49 2.6% 3.7% 41.4% 10.7% 20.2x 0.95x 8.9x 1.02x NA
Malibu Boats Inc Class A MBUU 24.83 98.9% 448 55 32 471 274 45 10.7% 13.6% 28.4% 16.6% 19.9x 1.72x 10.4x NA NA
Marine Products Corporation MPX 13.99 94.1% 501 0 10 491 249 24 13.0% 13.1% 21.2% 9.8% 28.6x 1.97x NM 2.92x 45.6x
Nautilus Inc NLS 17.85 71.4% 562 60 89 533 398 55 10.5% 19.8% 52.4% 13.8% 18.8x 1.34x 9.7x 2.44x 27.8x
Polaris Industries Inc. PII 87.41 88.3% 5,582 1,178 137 6,623 4,687 432 (2.9%) 6.1% 23.4% 9.2% 34.8x 1.41x 15.3x 1.75x 10.1x
Sturm, Ruger & Company, Inc. RGR 68.00 96.7% 1,210 0 35 1,175 659 168 12.1% (2.1%) 32.8% 25.6% 14.8x 1.78x 7.0x 1.71x 5.9x
American Outdoor Brands Corporation SWHC 23.97 76.9% 1,359 168 54 1,473 895 260 31.1% 12.1% 41.1% 29.1% 10.1x 1.65x 5.7x 2.40x 8.8x
Shimano Inc. 7309-JP 152.69 86.7% 14,157 80 1,756 12,481 2,963 737 (1.8%) 1.6% 41.1% 24.9% 28.4x 4.21x 16.9x 4.84x 25.5x
Vista Outdoor Inc VSTO 23.80 45.7% 1,365 1,121 45 2,441 2,547 306 12.2% 10.8% 26.3% 12.0% NA 0.96x 8.0x NA NA
Mean 80.6% $2,582 $570 $229 $2,922 $1,621 $213 4.6% 4.5% 33.1% 14.7% 20.3x 1.55x 11.3x 1.96x 17.2x
Median 88.2% $1,216 $72 $51 $1,196 $777 $67 6.7% 4.8% 32.5% 12.8% 20.2x 1.34x 10.6x 1.71x 13.4x
Last Twelve Months (LTM) Revenue Growth LTM Margins EV / LTM EV / 2017E

PAGE |
PUBLIC COMPARABLES(1)
CONSUMER AND RETAIL
INDUSTRY UPDATE │ JUNE 2017
11
Price at As a % of Market Cash & Enterprise LTM P/E
($ in m illions, except per share data) Ticker 6/11/17 52-wk High Cap Debt Equiv. Value (EV) Revenue EBITDA 1 Year 3 Years Gross EBITDA Multiple Revenue EBITDA Revenue EBITDA
Personal Care Products
Avon Products, Inc. AVP 3.54 50.9% 1,586 1,895 560 2,921 5,744 541 1.3% (15.9%) 60.7% 9.4% NA 0.51x 5.4x 0.29x 2.9x
Estee Lauder Companies Inc. Class A EL 96.35 99.3% 35,297 3,896 1,840 37,353 11,576 2,395 3.9% 2.8% 80.0% 20.7% 32.2x 3.23x 15.6x 3.53x 18.1x
Herbalife Ltd. HLF 68.88 92.7% 6,439 2,303 1,783 6,959 4,471 453 (0.3%) (3.4%) 79.0% 10.1% 23.9x 1.56x 15.4x 1.44x 8.1x
Kimberly-Clark Corporation KMB 128.77 92.7% 45,839 7,753 835 52,757 18,209 4,085 (0.9%) (4.8%) 36.6% 22.4% 21.2x 2.90x 12.9x 2.49x 12.6x
Medifast, Inc. MED 41.95 88.6% 502 0 79 423 273 40 0.4% (7.7%) 75.3% 14.7% 25.6x 1.55x 10.5x 1.18x 8.0x
Nu Skin Enterprises, Inc. Class A NUS 58.39 88.4% 3,098 428 347 3,179 2,236 342 2.8% (12.1%) 78.8% 15.3% 19.5x 1.42x 9.3x 1.00x 5.4x
Procter & Gamble Company PG 88.16 95.8% 226,221 30,414 14,327 242,308 65,081 17,338 (2.8%) (8.4%) 50.9% 26.6% 25.1x 3.72x 14.0x 2.90x 12.7x
Elizabeth Arden, Inc. RDEN 0.00 0.0% 0 422 45 377 966 15 0.0% (10.4%) 40.6% 1.5% NA 0.39x 25.2x 0.30x 3.8x
Revlon, Inc. Class A REV 20.50 54.0% 1,036 2,731 122 3,645 2,489 332 30.0% 15.1% 58.7% 13.3% NA 1.46x 11.0x 2.44x 14.0x
Sally Beauty Holdings, Inc. SBH 19.43 63.2% 2,685 1,790 49 4,427 3,906 578 (1.0%) 2.0% 46.6% 14.8% 12.1x 1.13x 7.7x 1.21x 7.4x
Ulta Beauty Inc ULTA 307.87 97.8% 18,789 0 472 18,317 5,096 921 23.4% 22.1% 36.0% 18.1% 43.2x 3.59x 19.9x 6.96x 43.1x
USANA Health Sciences, Inc. USNA 65.65 87.5% 1,592 0 176 1,415 1,021 151 8.7% 11.8% 80.2% 14.8% 16.6x 1.39x 9.3x 1.97x 11.3x
All for One Steeb AG A1OS-DE $73.76 96.7% $363 $26 $20 $369 $306 $33 8.3% 3.3% 19.0% 10.8% 25.9x 1.20x 11.2x 1.38x NA
Mean 77.5% $26,419 $3,974 $1,589 $28,804 $9,337 $2,094 5.7% (0.4%) 57.1% 14.8% 24.5x 1.85x 12.9x 2.08x 12.3x
Median 88.6% $2,685 $1,790 $347 $3,645 $3,906 $453 1.3% (3.4%) 58.7% 14.8% 24.5x 1.46x 11.2x 1.44x 9.7x
Pet Care
Blue Buffalo Pet Products Inc BUFF 24.01 87.3% 4,739 382 338 4,783 1,172 271 10.7% 17.7% 45.3% 23.1% 35.3x 4.08x 17.6x NA NA
Central Garden & Pet Company CENT $31.28 79.5% $1,548 $496 $17 $2,027 $1,917 $191 9.8% 5.0% 30.7% 10.0% 25.9x 1.06x 10.6x 1.24x 24.8x
Freshpet Inc FRPT $15.65 96.9% $519 $6 $2 $523 $136 $7 12.9% 25.6% 40.7% 5.4% NA 3.84x 71.4x NA NA
Oil-Dri Corporation of America ODC 40.51 98.2% 275 12 25 262 261 24 (1.1%) 0.0% 29.6% 9.0% 28.0x 1.01x 11.1x NA NA
Spectrum Brands Holdings, Inc. SPB 131.93 90.3% 7,752 3,781 137 11,396 4,968 868 (0.8%) 4.5% 38.2% 17.5% 23.7x 2.29x 13.1x 2.73x 17.1x
Maabarot Products Ltd. MABR-IL 19.85 96.2% 192 4 37 160 89 7 1.4% (4.6%) 39.8% 7.4% 17.3x 1.79x 24.3x NA NA
Echo Trading Co., Ltd. 7427-JP 6.31 95.8% 38 35 29 44 718 3 15.1% (1.7%) 12.0% 0.5% 7.4x 0.06x 13.1x 0.06x NA
Unicharm Corporation 8113-JP 26.63 94.7% 16,535 596 1,007 16,124 6,328 1,036 3.5% 1.9% 45.0% 16.4% 36.4x 2.55x 15.6x 2.95x 18.6x
Mean 92.4% $3,950 $664 $199 $4,415 $1,949 $301 6.4% 6.1% 35.2% 11.2% 24.8x 2.08x 22.1x 1.75x 20.2x
Median 95.3% $1,034 $209 $33 $1,275 $945 $107 6.6% 3.2% 39.0% 9.5% 25.9x 2.04x 14.3x 1.98x 18.6x
LTM MarginsLast Twelve Months (LTM) EV / 2017ERevenue Growth EV / LTM

PAGE |
PUBLIC COMPARABLES(1)
CONSUMER AND RETAIL
INDUSTRY UPDATE │ JUNE 2017
12
Price at As a % of Market Cash & Enterprise LTM P/E
($ in millions, except per share data) Ticker 6/11/17 52-wk High Cap Debt Equiv. Value (EV) Revenue EBITDA 1 Year 3 Years Gross EBITDA Multiple Revenue EBITDA Revenue EBITDA
LTM MarginsLast Twelve Months (LTM) EV / 2017ERevenue Growth EV / LTM
Retail
Apparel & Footwear Retail
American Eagle Outfitters, Inc. AEO 11.58 59.2% 2,092 0 225 1,867 3,622 495 1.4% 3.4% 32.9% 13.7% 10.7x 0.52x 3.8x 0.56x 5.0x
Abercrombie & Fitch Co. Class A ANF $12.72 54.6% $863 $310 $421 $752 $3,302 $170 (5.5%) (7.0%) 54.5% 5.1% NA 0.23x 4.4x 0.18x 1.6x
Ascena Retail Group, Inc. ASNA 2.20 24.1% 464 1,608 300 1,772 6,804 581 7.1% 12.3% 52.3% 8.5% NA 0.26x 3.0x 0.37x 3.7x
Buckle, Inc. BKE 17.90 62.4% 897 0 261 636 944 174 (13.6%) (5.8%) 40.7% 18.4% 9.5x 0.67x 3.7x 0.56x 2.2x
Cabela's Incorporated CAB 56.02 88.1% 3,863 5,582 305 9,140 4,100 435 1.6% 5.2% 37.6% 10.6% 26.9x 2.23x 21.0x 2.54x 19.9x
Caleres, Inc. CAL 27.51 75.1% 1,213 282 72 1,423 2,626 194 2.6% 1.4% 41.3% 7.4% 18.8x 0.54x 7.3x 0.56x 9.0x
Cato Corporation Class A CATO 17.65 45.5% 462 0 235 226 908 56 (10.5%) (1.0%) 33.3% 6.1% 13.8x 0.25x 4.1x 0.25x 2.2x
Chico's FAS, Inc. CHS 9.32 55.3% 1,214 80 170 1,124 2,417 281 (6.7%) (2.4%) 38.1% 11.6% NM 0.47x 4.0x 0.43x 3.3x
Citi Trends, Inc. CTRN 20.57 90.5% 316 0 107 208 701 36 2.8% 3.7% 35.9% 5.1% 22.6x 0.30x 5.8x 0.33x 9.8x
Destination Maternity Corporation DEST 4.95 58.8% 69 39 2 105 416 16 (13.7%) (8.3%) 52.5% 3.9% NA 0.25x 6.6x 0.21x NA
DSW Inc. Class A DSW 17.52 66.8% 1,440 0 257 1,183 2,721 245 2.8% 4.8% 27.9% 9.0% 12.2x 0.43x 4.8x 0.50x 3.5x
Destination XL Group, Inc. DXLG 2.35 42.2% 111 79 8 182 450 26 1.0% 4.8% 38.5% 5.7% NA 0.41x 7.1x 0.47x 15.5x
Express, Inc. EXPR 7.03 42.9% 559 68 191 435 2,157 162 (8.3%) (0.2%) 29.1% 7.5% 13.8x 0.20x 2.7x 0.20x 1.5x
Finish Line, Inc. Class A FINL 14.72 60.0% 595 0 91 504 1,844 121 (2.4%) 3.4% 27.1% 6.5% 39.8x 0.27x 4.2x 0.31x 3.1x
Foot Locker, Inc. FL 54.78 69.0% 7,251 127 1,049 6,329 7,780 1,138 4.0% 4.9% 31.6% 14.6% 11.2x 0.81x 5.6x 0.98x 7.9x
Genesco Inc. GCO 35.75 48.2% 701 178 43 836 2,863 197 (4.9%) 2.4% 49.1% 6.9% 8.2x 0.29x 4.2x 0.32x 3.2x
Guess?, Inc. GES 11.64 62.3% 962 24 316 670 2,236 138 2.9% (4.2%) 33.6% 6.2% 37.5x 0.30x 4.9x 0.26x 2.1x
Gap, Inc. GPS 22.83 74.3% 9,231 1,315 1,583 8,963 15,518 2,002 (0.4%) (1.4%) 36.8% 12.9% 13.2x 0.58x 4.5x 0.56x 3.4x
J.Jill, Inc. JILL 13.47 93.5% 587 267 13 841 639 96 13.7% 11.9% 67.0% 15.0% 24.5x 1.32x 8.8x NA NA
L Brands, Inc. LB 52.30 65.6% 15,558 5,746 1,555 19,749 12,397 2,425 1.2% 4.4% 40.2% 19.6% 13.8x 1.59x 8.1x 1.84x 9.4x
Lululemon Athletica Inc LULU 51.70 63.2% 7,128 0 698 6,430 2,369 534 11.1% 13.3% 51.6% 22.6% 24.5x 2.71x 12.0x 4.09x 14.6x
Tailored Brands, Inc. TLRD 11.13 38.7% 546 1,588 67 2,068 3,333 333 (3.1%) 10.2% 42.7% 10.0% NM 0.62x 6.2x 0.84x 7.9x
New York & Company, Inc. NWY 1.45 53.5% 93 12 75 30 923 17 (2.1%) (0.3%) 29.1% 1.8% NA 0.03x 1.8x 0.03x 0.8x
Children's Place, Inc. PLCE 105.85 84.5% 1,899 27 231 1,695 1,803 223 3.6% 0.9% 33.9% 12.4% 17.5x 0.94x 7.6x 0.96x 9.6x
Ross Stores, Inc. ROST 61.96 88.8% 24,230 397 1,258 23,369 13,084 2,133 8.2% 8.1% 28.7% 16.3% 21.2x 1.79x 11.0x 2.29x 15.3x
Shoe Carnival, Inc. SCVL 20.33 64.0% 355 0 25 330 994 64 0.2% 3.8% 28.8% 6.4% 16.9x 0.33x 5.1x 0.37x 5.4x
Stein Mart, Inc. SMRT 1.63 17.7% 83 157 16 225 1,342 28 (1.5%) 1.8% 23.3% 2.1% NA 0.17x 8.0x 0.18x 3.1x
Stage Stores, Inc. SSI 2.47 37.7% 66 223 22 267 1,419 35 (9.5%) (4.5%) 21.1% 2.5% NA 0.19x 7.5x 0.16x 2.1x
Urban Outfitters, Inc. URBN 17.62 43.2% 2,126 0 371 1,755 3,544 446 2.2% 4.3% 34.6% 12.6% 10.3x 0.50x 3.9x 0.57x 3.2x
Zumiez Inc. ZUMZ 13.35 50.3% 338 0 76 261 844 67 5.6% 4.6% 30.6% 7.9% 14.2x 0.31x 3.9x 0.36x 2.7x
Mean 59.3% $2,844 $604 $335 $3,113 $3,470 $429 (0.3%) 2.5% 37.5% 9.6% 18.2x 0.65x 6.2x 0.73x 6.1x
Median 59.6% $782 $73 $208 $838 $2,303 $184 1.1% 3.4% 35.3% 8.2% 14.2x 0.42x 5.0x 0.43x 3.5x
Department Chains
Bon-Ton Stores, Inc. BONT $0.49 24.9% $10 $1,034 $7 $1,037 $2,619 $101 (5.5%) (2.3%) 33.4% 3.9% NA 0.40x 10.2x 0.36x 6.3x
Dillard's, Inc. Class A DDS 54.92 70.7% 1,742 820 301 2,261 6,332 552 (5.2%) (1.8%) 31.4% 8.7% 11.3x 0.36x 4.1x 0.34x 2.8x
J. C. Penney Company, Inc. JCP 4.87 43.1% 1,544 4,602 363 5,783 12,442 922 (1.1%) 1.1% 30.9% 7.4% NA 0.46x 6.3x 0.48x NM
Nordstrom, Inc. JWN 47.16 75.1% 7,776 2,742 653 9,865 14,862 1,686 2.7% 5.3% 36.1% 11.3% 22.1x 0.66x 5.9x 0.79x 5.5x
Kohl's Corporation KSS 37.87 63.5% 6,564 4,586 625 10,525 18,557 2,326 (2.6%) (0.6%) 31.2% 12.5% 11.1x 0.57x 4.5x 0.55x 4.0x
Macy's Inc M 22.70 50.0% 6,914 6,725 1,201 12,438 25,345 2,587 (4.8%) (3.1%) 35.1% 10.2% 12.3x 0.49x 4.8x 0.45x 3.3x
Stage Stores, Inc. SSI 2.47 37.7% 66 223 22 267 1,419 35 (9.5%) (4.5%) 21.1% 2.5% NA 0.19x 7.5x 0.16x 2.1x
Hudson's Bay Co. HBC-CA 6.41 44.7% 1,181 2,826 104 3,903 10,977 77 27.5% 29.7% 36.5% 0.7% NA 0.36x 50.9x 0.81x 10.6x
Mean 51.2% $3,225 $2,945 $410 $5,760 $11,569 $1,036 0.2% 3.0% 32.0% 7.2% 14.2x 0.44x 11.8x 0.49x 4.9x
Median 47.4% $1,643 $2,784 $332 $4,843 $11,709 $737 (3.7%) (1.2%) 32.4% 8.1% 11.8x 0.43x 6.1x 0.46x 4.0x

PAGE |
PUBLIC COMPARABLES(1)
CONSUMER AND RETAIL
INDUSTRY UPDATE │ JUNE 2017
13
Price at As a % of Market Cash & Enterprise LTM P/E
($ in m illions, except per share data) Ticker 6/11/17 52-wk High Cap Debt Equiv. Value (EV) Revenue EBITDA 1 Year 3 Years Gross EBITDA Multiple Revenue EBITDA Revenue EBITDA
Discount Stores & Mass Merchants
Big Lots, Inc. BIG 50.49 89.3% 2,233 116 66 2,283 5,185 381 (0.7%) (0.6%) 38.3% 7.3% 13.7x 0.44x 6.0x 0.43x 7.4x
Costco Wholesale Corporation COST 180.38 98.5% 78,570 3,979 5,725 76,824 123,285 5,189 (14.4%) 4.0% 13.3% 4.2% 31.3x 0.62x 14.8x 0.71x 18.8x
CVS Health Corporation CVS 79.71 80.8% 80,577 27,433 2,302 105,708 178,825 12,878 11.6% 11.6% 16.1% 7.2% 16.7x 0.59x 8.2x 0.83x 10.7x
Dollar General Corporation DG 75.22 77.6% 20,638 3,033 206 23,465 22,331 2,455 7.8% 7.9% 30.8% 11.0% 17.0x 1.05x 9.6x 1.35x 11.4x
Dollar Tree, Inc. DLTR 75.38 75.4% 17,875 6,298 1,159 23,013 20,921 2,359 13.7% 37.9% 30.9% 11.3% 20.7x 1.10x 9.8x 2.95x 19.9x
Ollie's Bargain Outlet Holdings Inc OLLI 43.25 98.1% 2,549 128 34 2,644 924 120 16.5% 19.6% 39.6% 12.9% 40.8x 2.86x 22.1x NA NA
PriceSmart, Inc. PSMT 88.75 93.6% 2,707 123 183 2,647 2,948 184 2.1% 6.6% 15.9% 6.2% 29.6x 0.90x 14.4x 1.12x 16.6x
Rite Aid Corporation RAD 3.00 34.2% 3,202 7,329 252 10,279 32,845 1,100 6.9% 8.8% 23.7% 3.3% NM 0.31x 9.3x 0.40x 8.0x
Target Corporation TGT 56.90 71.7% 32,109 12,803 2,680 42,232 69,316 6,560 (4.9%) (1.7%) 26.2% 9.5% 11.7x 0.61x 6.4x 0.58x 6.7x
TJX Companies Inc TJX 73.68 88.1% 47,602 2,228 3,127 46,704 33,425 4,515 5.7% 6.4% 28.9% 13.5% 20.9x 1.40x 10.3x 1.71x 12.0x
Tuesday Morning Corporation TUES 2.00 24.6% 91 41 4 129 966 (1) 2.0% 4.2% 34.1% NM NA 0.13x NM 0.15x NA
Walgreens Boots Alliance Inc WBA 80.99 92.0% 88,114 18,911 11,822 95,203 116,081 7,605 (0.4%) 16.1% 23.6% 6.6% 20.8x 0.82x 12.5x 1.29x 17.2x
Wal-Mart Stores, Inc. WMT 79.42 98.7% 238,417 46,497 6,545 278,369 486,782 32,240 0.7% 0.7% 25.6% 6.6% 18.1x 0.57x 8.6x 0.59x 7.6x
Mean 78.7% $47,283 $9,917 $2,623 $54,577 $84,141 $5,814 3.6% 9.3% 26.7% 8.3% 21.9x 0.88x 11.0x 1.01x 12.4x
Median 88.1% $20,638 $3,979 $1,159 $23,465 $32,845 $2,455 2.1% 6.6% 26.2% 7.3% 20.7x 0.62x 9.7x 0.77x 11.4x
Furniture & Furnishings Retailers
Aaron's, Inc. AAN $39.49 97.9% $2,821 $485 $370 $2,936 $3,198 $312 (0.5%) 12.9% 47.3% 9.8% 20.0x 0.92x 9.4x 1.31x 10.8x
At Home Group, Inc. HOME 22.75 95.7% 1,310 450 11 1,749 805 114 23.3% 25.9% 31.8% 14.2% 44.0x 2.17x 15.3x NA NA
Bed Bath & Beyond Inc. BBBY 35.64 73.0% 5,304 1,492 488 6,307 12,216 1,426 0.9% 2.0% 37.5% 11.7% 7.8x 0.52x 4.4x 0.55x 3.4x
Conn's, Inc. CONN 19.20 96.2% 602 1,208 273 1,537 1,564 109 (4.5%) 6.9% 49.4% 7.0% NA 0.98x 14.1x 1.32x 8.7x
Ethan Allen Interiors Inc. ETH 28.90 74.5% 807 30 64 774 774 85 (1.0%) 2.0% 55.2% 11.0% 19.5x 1.00x 9.1x 1.05x 8.8x
Haverty Furniture Companies, Inc. HVT 25.60 97.3% 533 56 70 519 827 75 2.4% 3.7% 54.2% 9.0% 18.4x 0.63x 6.9x 0.70x 7.0x
Kirkland's, Inc. KIRK 9.55 54.9% 152 0 60 92 597 39 4.2% 8.5% 13.8% 6.5% 18.0x 0.15x 2.4x 0.20x 2.3x
LaZBoy Incorporated LZB 27.40 83.3% 1,371 1 135 1,236 1,524 153 2.8% 3.4% 39.7% 10.0% 17.1x 0.81x 8.1x 0.92x 11.3x
Pier 1 Imports, Inc. PIR 5.53 57.2% 480 201 154 526 1,828 118 (3.4%) 1.1% 35.2% 6.5% 14.9x 0.29x 4.5x 0.30x 2.4x
Rent-A-Center Inc RCII 12.61 91.8% 689 653 58 1,285 2,870 148 (11.3%) (2.7%) 35.3% 5.2% NA 0.45x 8.7x 0.41x 3.9x
RH RH 50.74 84.4% 1,679 803 80 2,402 2,241 151 4.6% 11.5% 32.2% 6.7% NM 1.07x 15.9x 1.58x 16.7x
Select Comfort Corporation SCSS 32.02 95.9% 1,357 0 36 1,321 1,352 149 11.1% 11.4% 63.5% 11.0% 23.0x 0.98x 8.9x 1.38x 10.9x
Sherwin-Williams Company SHW 352.91 99.5% 32,555 1,954 1,018 33,492 12,043 2,042 5.1% 5.1% 50.3% 17.0% 27.3x 2.78x 16.4x 3.29x 24.5x
Williams-Sonoma, Inc. WSM 48.51 84.5% 4,294 45 94 4,245 5,098 662 1.1% 4.4% 37.0% 13.0% 14.2x 0.83x 6.4x 0.97x 7.0x
Mean 84.7% $3,854 $527 $208 $4,173 $3,353 $399 2.5% 6.9% 41.6% 9.9% 20.4x 0.97x 9.3x 1.08x 9.1x
Median 88.2% $1,334 $325 $87 $1,429 $1,696 $148 1.7% 4.8% 38.6% 9.9% 18.4x 0.88x 8.8x 0.97x 8.7x
EV / 2017ELast Twelve Months (LTM) Revenue Growth LTM Margins EV / LTM
PAGE |
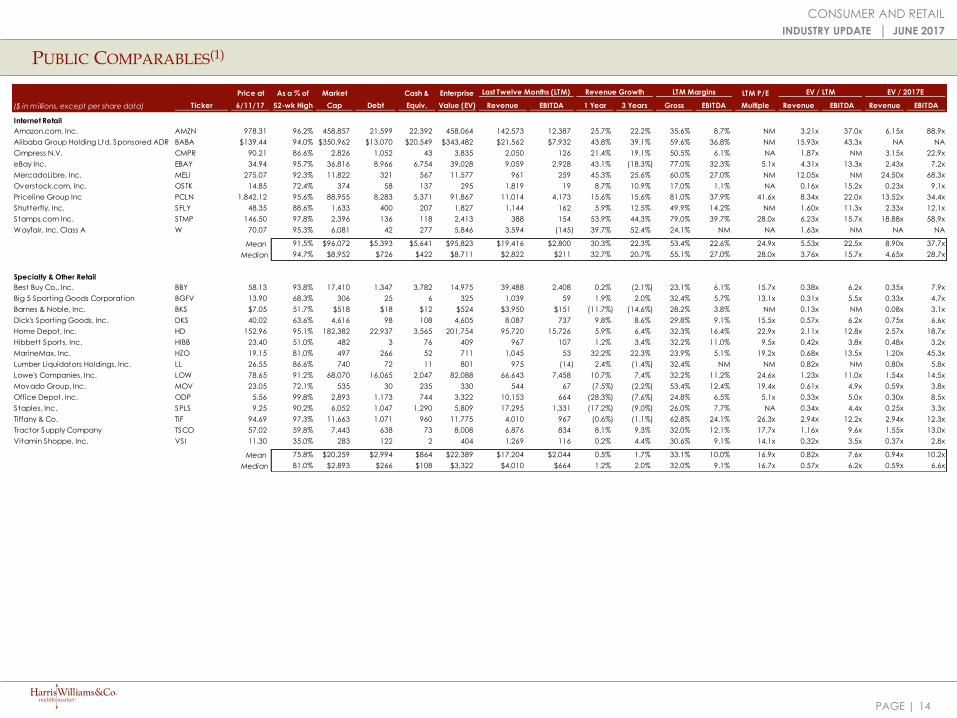
PUBLIC COMPARABLES(1)
CONSUMER AND RETAIL
INDUSTRY UPDATE │ JUNE 2017
14
Price at As a % of Market Cash & Enterprise LTM P/E
($ in m illions, except per share data) Ticker 6/11/17 52-wk High Cap Debt Equiv. Value (EV) Revenue EBITDA 1 Year 3 Years Gross EBITDA Multiple Revenue EBITDA Revenue EBITDA
Internet Retail
Amazon.com, Inc. AMZN 978.31 96.2% 458,857 21,599 22,392 458,064 142,573 12,387 25.7% 22.2% 35.6% 8.7% NM 3.21x 37.0x 6.15x 88.9x
Alibaba Group Holding Ltd. Sponsored ADR BABA $139.44 94.0% $350,962 $13,070 $20,549 $343,482 $21,562 $7,932 43.8% 39.1% 59.6% 36.8% NM 15.93x 43.3x NA NA
Cimpress N.V. CMPR 90.21 86.6% 2,826 1,052 43 3,835 2,050 126 21.4% 19.1% 50.5% 6.1% NA 1.87x NM 3.15x 22.9x
eBay Inc. EBAY 34.94 95.7% 36,816 8,966 6,754 39,028 9,059 2,928 43.1% (18.3%) 77.0% 32.3% 5.1x 4.31x 13.3x 2.43x 7.2x
MercadoLibre, Inc. MELI 275.07 92.3% 11,822 321 567 11,577 961 259 45.3% 25.6% 60.0% 27.0% NM 12.05x NM 24.50x 68.3x
Overstock.com, Inc. OSTK 14.85 72.4% 374 58 137 295 1,819 19 8.7% 10.9% 17.0% 1.1% NA 0.16x 15.2x 0.23x 9.1x
Priceline Group Inc PCLN 1,842.12 95.6% 88,955 8,283 5,371 91,867 11,014 4,173 15.6% 15.6% 81.0% 37.9% 41.6x 8.34x 22.0x 13.52x 34.4x
Shutterfly, Inc. SFLY 48.35 88.6% 1,633 400 207 1,827 1,144 162 5.9% 12.5% 49.9% 14.2% NM 1.60x 11.3x 2.33x 12.1x
Stamps.com Inc. STMP 146.50 97.8% 2,396 136 118 2,413 388 154 53.9% 44.3% 79.0% 39.7% 28.0x 6.23x 15.7x 18.88x 58.9x
Wayfair, Inc. Class A W 70.07 95.3% 6,081 42 277 5,846 3,594 (145) 39.7% 52.4% 24.1% NM NA 1.63x NM NA NA
Mean 91.5% $96,072 $5,393 $5,641 $95,823 $19,416 $2,800 30.3% 22.3% 53.4% 22.6% 24.9x 5.53x 22.5x 8.90x 37.7x
Median 94.7% $8,952 $726 $422 $8,711 $2,822 $211 32.7% 20.7% 55.1% 27.0% 28.0x 3.76x 15.7x 4.65x 28.7x
Specialty & Other Retail
Best Buy Co., Inc. BBY 58.13 93.8% 17,410 1,347 3,782 14,975 39,488 2,408 0.2% (2.1%) 23.1% 6.1% 15.7x 0.38x 6.2x 0.35x 7.9x
Big 5 Sporting Goods Corporation BGFV 13.90 68.3% 306 25 6 325 1,039 59 1.9% 2.0% 32.4% 5.7% 13.1x 0.31x 5.5x 0.33x 4.7x
Barnes & Noble, Inc. BKS $7.05 51.7% $518 $18 $12 $524 $3,950 $151 (11.7%) (14.6%) 28.2% 3.8% NM 0.13x NM 0.08x 3.1x
Dick's Sporting Goods, Inc. DKS 40.02 63.6% 4,616 98 108 4,605 8,087 737 9.8% 8.6% 29.8% 9.1% 15.5x 0.57x 6.2x 0.75x 6.6x
Home Depot, Inc. HD 152.96 95.1% 182,382 22,937 3,565 201,754 95,720 15,726 5.9% 6.4% 32.3% 16.4% 22.9x 2.11x 12.8x 2.57x 18.7x
Hibbett Sports, Inc. HIBB 23.40 51.0% 482 3 76 409 967 107 1.2% 3.4% 32.2% 11.0% 9.5x 0.42x 3.8x 0.48x 3.2x
MarineMax, Inc. HZO 19.15 81.0% 497 266 52 711 1,045 53 32.2% 22.3% 23.9% 5.1% 19.2x 0.68x 13.5x 1.20x 45.3x
Lumber Liquidators Holdings, Inc. LL 26.55 86.6% 740 72 11 801 975 (14) 2.4% (1.4%) 32.4% NM NM 0.82x NM 0.80x 5.8x
Lowe's Companies, Inc. LOW 78.65 91.2% 68,070 16,065 2,047 82,088 66,643 7,458 10.7% 7.4% 32.2% 11.2% 24.6x 1.23x 11.0x 1.54x 14.5x
Movado Group, Inc. MOV 23.05 72.1% 535 30 235 330 544 67 (7.5%) (2.2%) 53.4% 12.4% 19.4x 0.61x 4.9x 0.59x 3.8x
Office Depot, Inc. ODP 5.56 99.8% 2,893 1,173 744 3,322 10,153 664 (28.3%) (7.6%) 24.8% 6.5% 5.1x 0.33x 5.0x 0.30x 8.5x
Staples, Inc. SPLS 9.25 90.2% 6,052 1,047 1,290 5,809 17,295 1,331 (17.2%) (9.0%) 26.0% 7.7% NA 0.34x 4.4x 0.25x 3.3x
Tiffany & Co. TIF 94.69 97.3% 11,663 1,071 960 11,775 4,010 967 (0.6%) (1.1%) 62.8% 24.1% 26.3x 2.94x 12.2x 2.94x 12.3x
Tractor Supply Company TSCO 57.02 59.8% 7,443 638 73 8,008 6,876 834 8.1% 9.3% 32.0% 12.1% 17.7x 1.16x 9.6x 1.55x 13.0x
Vitamin Shoppe, Inc. VSI 11.30 35.0% 283 122 2 404 1,269 116 0.2% 4.4% 30.6% 9.1% 14.1x 0.32x 3.5x 0.37x 2.8x
Mean 75.8% $20,259 $2,994 $864 $22,389 $17,204 $2,044 0.5% 1.7% 33.1% 10.0% 16.9x 0.82x 7.6x 0.94x 10.2x
Median 81.0% $2,893 $266 $108 $3,322 $4,010 $664 1.2% 2.0% 32.0% 9.1% 16.7x 0.57x 6.2x 0.59x 6.6x
Last Twelve Months (LTM) Revenue Growth LTM Margins EV / LTM EV / 2017E
PAGE |
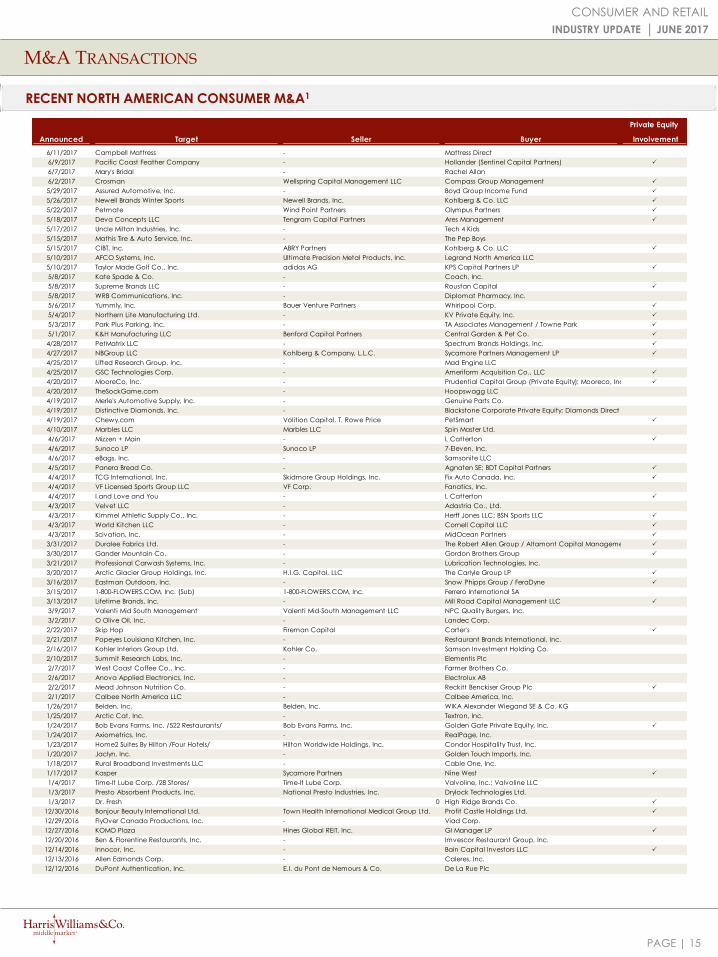
M&A TRANSACTIONS
RECENT NORTH AMERICAN CONSUMER M&A1
CONSUMER AND RETAIL
INDUSTRY UPDATE │ JUNE 2017
15
Private Equity
Announced Target Seller Buyer Involvement
6/11/2017 Campbell Mattress - Mattress Direct
6/9/2017 Pacific Coast Feather Company - Hollander (Sentinel Capital Partners) P
6/7/2017 Mary's Bridal - Rachel Allan
6/2/2017 Crosman Wellspring Capital Management LLC Compass Group Management P
5/29/2017 Assured Automotive, Inc. - Boyd Group Income Fund P
5/26/2017 Newell Brands Winter Sports Newell Brands, Inc. Kohlberg & Co. LLC P
5/22/2017 Petmate Wind Point Partners Olympus Partners P
5/18/2017 Deva Concepts LLC Tengram Capital Partners Ares Management P
5/17/2017 Uncle Milton Industries, Inc. - Tech 4 Kids
5/15/2017 Mathis Tire & Auto Service, Inc. - The Pep Boys
5/15/2017 CIBT, Inc. ABRY Partners Kohlberg & Co. LLC P
5/10/2017 AFCO Systems, Inc. Ultimate Precision Metal Products, Inc. Legrand North America LLC
5/10/2017 Taylor Made Golf Co., Inc. adidas AG KPS Capital Partners LP P
5/8/2017 Kate Spade & Co. - Coach, Inc.
5/8/2017 Supreme Brands LLC - Roustan Capital P
5/8/2017 WRB Communications, Inc. - Diplomat Pharmacy, Inc.
5/6/2017 Yummly, Inc. Bauer Venture Partners Whirlpool Corp. P
5/4/2017 Northern Lite Manufacturing Ltd. - KV Private Equity, Inc. P
5/3/2017 Park Plus Parking, Inc. - TA Associates Management / Towne Park P
5/1/2017 K&H Manufacturing LLC Benford Capital Partners Central Garden & Pet Co. P
4/28/2017 PetMatrix LLC - Spectrum Brands Holdings, Inc. P
4/27/2017 NBGroup LLC Kohlberg & Company, L.L.C. Sycamore Partners Management LP P
4/25/2017 Lifted Research Group, Inc. - Mad Engine LLC
4/25/2017 GSC Technologies Corp. - Ameriform Acquisition Co., LLC P
4/20/2017 MooreCo, Inc. - Prudential Capital Group (Private Equity); Mooreco, Inc. /Private Group/P
4/20/2017 TheSockGame.com - Hoopswagg LLC
4/19/2017 Merle's Automotive Supply, Inc. - Genuine Parts Co.
4/19/2017 Distinctive Diamonds, Inc. - Blackstone Corporate Private Equity; Diamonds Direct USA, Inc.
4/19/2017 Chewy.com Volition Capital, T. Rowe Price PetSmart P
4/10/2017 Marbles LLC Marbles LLC Spin Master Ltd.
4/6/2017 Mizzen + Main - L Catterton P
4/6/2017 Sunoco LP Sunoco LP 7-Eleven, Inc.
4/6/2017 eBags, Inc. - Samsonite LLC
4/5/2017 Panera Bread Co. - Agnaten SE; BDT Capital Partners P
4/4/2017 TCG International, Inc. Skidmore Group Holdings, Inc. Fix Auto Canada, Inc. P
4/4/2017 VF Licensed Sports Group LLC VF Corp. Fanatics, Inc.
4/4/2017 I and Love and You - L Catterton P
4/3/2017 Velvet LLC - Adastria Co., Ltd.
4/3/2017 Kimmel Athletic Supply Co., Inc. - Herff Jones LLC; BSN Sports LLC P
4/3/2017 World Kitchen LLC - Cornell Capital LLC P
4/3/2017 Scivation, Inc. - MidOcean Partners P
3/31/2017 Duralee Fabrics Ltd. - The Robert Allen Group / Altamont Capital Management LLC P
3/30/2017 Gander Mountain Co. - Gordon Brothers Group P
3/21/2017 Professional Carwash Systems, Inc. - Lubrication Technologies, Inc.
3/20/2017 Arctic Glacier Group Holdings, Inc. H.I.G. Capital, LLC The Carlyle Group LP P
3/16/2017 Eastman Outdoors, Inc. - Snow Phipps Group / FeraDyne P
3/15/2017 1-800-FLOWERS.COM, Inc. (Sub) 1-800-FLOWERS.COM, Inc. Ferrero International SA
3/13/2017 Lifetime Brands, Inc. - Mill Road Capital Management LLC P
3/9/2017 Valenti Mid South Management Valenti Mid-South Management LLC NPC Quality Burgers, Inc.
3/2/2017 O Olive Oil, Inc. - Landec Corp.
2/22/2017 Skip Hop Fireman Capital Carter's P
2/21/2017 Popeyes Louisiana Kitchen, Inc. - Restaurant Brands International, Inc.
2/16/2017 Kohler Interiors Group Ltd. Kohler Co. Samson Investment Holding Co.
2/10/2017 Summit Research Labs, Inc. - Elementis Plc
2/7/2017 West Coast Coffee Co., Inc. - Farmer Brothers Co.
2/6/2017 Anova Applied Electronics, Inc. - Electrolux AB
2/2/2017 Mead Johnson Nutrition Co. - Reckitt Benckiser Group Plc P
2/1/2017 Calbee North America LLC - Calbee America, Inc.
1/26/2017 Belden, Inc. Belden, Inc. WIKA Alexander Wiegand SE & Co. KG
1/25/2017 Arctic Cat, Inc. - Textron, Inc.
1/24/2017 Bob Evans Farms, Inc. /522 Restaurants/ Bob Evans Farms, Inc. Golden Gate Private Equity, Inc. P
1/24/2017 Axiometrics, Inc. - RealPage, Inc.
1/23/2017 Home2 Suites By Hilton /Four Hotels/ Hilton Worldwide Holdings, Inc. Condor Hospitality Trust, Inc.
1/20/2017 Jaclyn, Inc. - Golden Touch Imports, Inc.
1/18/2017 Rural Broadband Investments LLC - Cable One, Inc.
1/17/2017 Kasper Sycamore Partners Nine West P
1/4/2017 Time-It Lube Corp. /28 Stores/ Time-It Lube Corp. Valvoline, Inc.; Valvoline LLC
1/3/2017 Presto Absorbent Products, Inc. National Presto Industries, Inc. Drylock Technologies Ltd.
1/3/2017 Dr. Fresh 0 High Ridge Brands Co. P
12/30/2016 Bonjour Beauty International Ltd. Town Health International Medical Group Ltd. Profit Castle Holdings Ltd. P
12/29/2016 FlyOver Canada Productions, Inc. - Viad Corp.
12/27/2016 KOMO Plaza Hines Global REIT, Inc. GI Manager LP P
12/20/2016 Ben & Florentine Restaurants, Inc. - Imvescor Restaurant Group, Inc.
12/14/2016 Innocor, Inc. - Bain Capital Investors LLC P
12/13/2016 Allen Edmonds Corp. - Caleres, Inc.
12/12/2016 DuPont Authentication, Inc. E.I. du Pont de Nemours & Co. De La Rue Plc

PAGE |
M&A TRANSACTIONS
RECENT NORTH AMERICAN CONSUMER M&A (CONTINUED)1
CONSUMER AND RETAIL
INDUSTRY UPDATE │ JUNE 2017
16
Private Equity
Announced Target Seller Buyer Involvement
12/12/2016 Smith Mountain Industries, Inc. - Newell Brands, Inc.
12/7/2016 Pebble Technology Corp. - Fitbit, Inc.
12/7/2016 Hyatt Regency Pier Sixty-Six Boca Resorts LLC Tavistock Development Co. P
12/2/2016 Victoria Fine Foods LLC - B&G Foods, Inc.
12/2/2016 Cosi, Inc. - Milfam LLC; AB Opportunity Fund LLC; Cosi, Inc. /Private Group/
11/25/2016 REINS International (USA) Co. Ltd. - Reins International, Inc.
11/22/2016 KeVita, Inc. - PepsiCo, Inc. P
11/22/2016 Bai Brands LLC - Dr Pepper Snapple Group, Inc.
11/18/2016 Natural Essence Group SPV - LifeBrandz Ltd.
11/17/2016 Bellisio Foods, Inc. - Charoen Pokphand Foods Public Co. Ltd.
11/17/2016 Ryeson Corp. - Snap-On, Inc.
11/16/2016 Elore Enterprises LLC - The Carlyle Group LP (Corporate Private Equity); Grupo Empresarial Palacios Alimentación SAP
11/14/2016 Harman International Industries, Inc. - Samsung Electronics America, Inc.
11/14/2016 Too Faced Cosmetics LLC - Estee Lauder Cos., Inc.
11/14/2016 American Apparel LLC /American Apparel Brand/ American Apparel, Inc. Gildan Activewear, Inc.
11/10/2016 JemPak GK, Inc. - Acasta Enterprises, Inc.
11/9/2016 Kimpton Hotel Allegro - Hospitality Properties Trust
11/8/2016 GlassMasters Autoglass Ltd. - The Western Investment Co. of Canada Ltd. P
11/8/2016 ARG Wholesale Ltd. - Alberta Treasury Branches Financial; The Western Investment Co. of Canada Ltd.; Arg Wholesale Ltd. /Private Group/P
11/7/2016 Coleman Homes LLC - Toll Brothers, Inc.
11/4/2016 Dick Clark Productions, Inc. - Dalian Wanda Group Co., Ltd.
11/4/2016 Ultimate Survival Technologies, Inc. - Battenfeld Technologies, Inc.
11/3/2016 Angelic Bakehouse, Inc. - T. Marzetti Co., Inc.
10/31/2016 Performance Sports Group Ltd. - Fairfax Financial Holdings Ltd.; Sagard Capital Partners Management Corp.; Performance Sports Group Ltd. /Private Group/P
10/31/2016 Grupo Modelo Sab De Cv /Obregon Brewery/ Anheuser-Busch InBev SA/NV Constellation Brands, Inc.
10/26/2016 Pacific Island Restaurants, Inc. - Restaurant Brands New Zealand Ltd.
10/25/2016 Courtyard By Marriott (Sunnyvale) Marriott International, Inc. Hersha Hospitality Trust
10/24/2016 Mactac Americas, LLC - LINTEC Corp.
10/17/2016 Constellation Brands Canada, Inc. Constellation Brands, Inc. Ontario Teachers' Pension Plan Board; Province of Ontario
10/17/2016 International Palms Resort & Conference Center Orlando Lone Star Funds Empresas Brasif SA P
10/17/2016 Charles Smith Wines LLC /Wines Business/ Charles Smith Wines LLC Constellation Brands, Inc.
10/12/2016 Newell Brands, Inc. /Tools Business/ Newell Brands, Inc. Stanley Black & Decker, Inc.
10/5/2016 Pocahontas Parkway Holdings LLC - Optrust Private Equity; GlobalVia Infraestructuras SA; PGGM Vermogensbeheer BV (Private Equity)
10/4/2016 High West Distillery & Saloon - Constellation Brands, Inc.
10/3/2016 Point Grey Research, Inc. - FLIR Systems, Inc.
10/3/2016 EPS Financial LLC Drake Enterprises Ltd. MetaBank
10/3/2016 Stone Canyon Industries LLC /2 Subsidiaries/ - Green Plains, Inc.
9/28/2016 Lafayette Puzzle Factory LLC - Cra-Z-Art LLC
9/23/2016 Fanlogic LLC - HeadsUp Entertainment
9/21/2016 Corby LLC - US Lighting Group, Inc.
9/21/2016 Frio Ice Chest Co. - Visual Promotions LLC
9/13/2016 David Michael & Co., Inc. - International Flavors & Fragrances
9/13/2016 SalonQuest LLC - Conair Corp.
9/12/2016 CID Entertainment LLC - Clearlake Capital Group LP P
9/9/2016 SRP Companies Seidler Equity Partners Aurora Capital Partners
9/6/2016 SharpShooter Imaging LLC - Magic Memories Group Holdings Ltd.
9/1/2016 L.O.P. Enterprises, Inc. - Vista Outdoor, Inc.
9/1/2016 Amety Ltd. - Park Lawn Corp.
9/1/2016 Jones Media, Inc. - Adams Publishing Group LLC
9/1/2016 New Homes Guide - NewPoint Media Group LLC
9/1/2016 Diversified Industrial Services - Orion Industries
8/31/2016 Focus Products Group International LLC /Kitchen Division/ - Lifetime Brands, Inc.
8/31/2016 Promax Nutrition Corp. /Sport Perfomance Brand/ - NuGo Nutrition
8/31/2016 Boomerang Carwash LLC - Zips Car Wash LLC
8/30/2016 Plus II Sanitation Supplies, Inc. - Bunzl Plc
8/30/2016 Apex Sanitation Products Ltd. - Bunzl Plc P
8/30/2016 800Razors.com LLC - Shave Mob LLC
8/30/2016 The River Club - Landeavor LLC
8/30/2016 Coast Apparel LLC - Delta Apparel, Inc.
8/30/2016 Heritage Golf Club - ClubCorp Holdings, Inc.
8/30/2016 True Contact - Appsbuyout P
8/29/2016 Playworld Systems, Inc. - Littlejohn & Co. LLC; PlayPower, Inc.
8/29/2016 Toulon Design - Callaway Golf Co.
8/19/2016 Affinity Sports - Dick's Sporting Goods, Inc.
8/17/2016 Ecodesarrollo Papagayo SA - Gencom Group
8/16/2016 RunHaven Moko Social Media Ltd. Calera Capital Advisors P
8/16/2016 RCL Benziger Publishing LLC New Mountain Learning LLC Kendall/Hunt Publishing Co.
8/16/2016 Alienation, Inc. - J&B Importers, Inc.
8/16/2016 LeftField Media LLC - Urban Exposition LLC
8/2/2016 Swimways Corp. - Spin Master Corp.
8/15/2016 InterHealth Nutraceuticals, Inc. - Lonza Group AG
8/15/2016 Wisconsin Cemeteries - StoneMor Partners LP
8/15/2016 Pounds Media LLC - Snapshot Interactive LLC
8/12/2016 Edwards & Zuck DPC - Stantec, Inc.
8/12/2016 The Car Wash Barn - Car Wash Partners, Inc.
8/11/2016 Canada à la Carte Viad Corp. VBR Tours LLC

PAGE |
M&A TRANSACTIONS
CONSUMER AND RETAIL
INDUSTRY UPDATE │ JUNE 2017
RECENT NORTH AMERICAN CONSUMER M&A (CONTINUED)1
17
HW&CO. CONSUMER TEAM
Private Equity
Announced Target Seller Buyer Involvement
8/10/2016 Preptix LLC - Huddle, Inc.
8/10/2016 Dacor, Inc. - Samsung Electronics America, Inc.
8/10/2016 Sina Pearson Textiles, Inc. - Riverside Partners LLC (New York); Momentum Textiles, Inc.; Momentum GroupP
8/10/2016 ECM Publishers, Inc. - Adams Publishing Group LLC
8/10/2016 Mocean Holding Co. Llc - SNC Technical Services LLC
8/9/2016 Stefano A, Inc. - JN Phillips Auto Glass, Inc.
8/9/2016 Hope River Entertainment - Moonstruck Management LLC
8/9/2016 Herington Times-Sun Printing & Publishing - Kansas Publishing Ventures LLC
8/8/2016 Becker & Mayer LLC The McEvoy Group LLC Quarto Publishing Group USA, Inc.
8/8/2016 Whistler Blackcomb Holdings, Inc. - Vail Resorts, Inc.
8/8/2016 Delta Ultraviolet Corp. - AEA Investors LP; Neptune-Benson, Inc.; Evoqua Water Technologies LLCP
8/8/2016 Flick Brothers Auto Body - 3-D Body Works, Inc.
8/8/2016 Rooftop2 Productions, Inc. - Lagardère Sports SAS
8/5/2016 Pokervision Media, Inc. - Network Life Sciences, Inc.
8/4/2016 S&D Coffee, Inc. - Cott Corp. (Canada)
8/3/2016 Stein World Operating Co. - ELK Group International, Inc.
8/3/2016 Create-A-Treat Ltd. - Thomas H. Lee Partners LP; Give & Go Prepared Foods Corp. P
8/2/2016 Oak State Products, Inc. - Vestar Capital Partners, Inc.; Goldman Sachs Private Equity Group; Hearthside Food Solutions LLCP
8/2/2016 HC Operating Co. LLC - Avista Capital Holdings LP; WideOpenWest Finance LLC; Constitution Capital Partners LLC
8/2/2016 The GameTV Corp. Kilmer Group Anthem Sports & Entertainment Corp.
8/1/2016 Carstar Collision Care of Kings, Inc. /Cincinnati 10 Shops/ Carstar Collision Care of Kings, Inc. The Boyd Group, Inc.
7/29/2016 Dr. Smoothie Brands, Inc. Dr. Smoothie Enterprises Highlander Partners LP; Bevolution Group P
7/27/2016 Peds Legwear, Inc. - Gildan Activewear, Inc.
7/26/2016 Vizio Holdings, Inc. - Leshi Internet Information & Technology
7/26/2016 Legion Industries, Inc. - The Legacy Cos.
7/25/2016 Donna Karan International, Inc. LVMH Moët Hennessy Louis Vuitton SE G-III Apparel Group Ltd.
7/22/2016 Model in a Bottle - American International Industries P
7/19/2016 Golden Enterprises, Inc. - UTZ Quality Foods, Inc.
7/13/2016 Tessive LLC - RealD, Inc.; Rizvi Traverse Management LLC P
7/7/2016 Erno Laszlo, Inc. - CITIC Capital Partners Ltd. P
7/6/2016 First Act, Inc. - Alleghany Capital Partners LLC P
7/6/2016 Idaho Pacific Holdings, Inc. - Arlon Group LLC
7/5/2016 Source Media LLC /Traders Magazine/ Source Media LLC Markets Media LLC
7/5/2016 Hostess Brands LLC - The Gores Group LLC; Gores Holdings, Inc. P
7/5/2016 Thunder Jet - Brunswick Corp.
7/5/2016 Sea Crest Resort & Conference Center Scout Real Estate Capital LLC Delaware North Cos., Inc.
7/5/2016 D.K. Shifflet & Associates Ltd. - Peninsula Capital Partners LLC; MMGY Global Inc.
7/1/2016 Oliva Cigar Co. - V.D.M. Invest CVA; J. Cortès Cigars NV
7/1/2016 Harris Publications, Inc. - Athlon Media Group
7/1/2016 Supplies On The Fly Instawares Holding Co. LLC Sysco Corp.
7/1/2016 Heartland Habitat for Humanity, Inc. - Habitat For Humanity Kansas City, Inc.
6/30/2016 VF Corp. /Contemporary Premium Brand Business/ VF Corp. Delta Galil Industries Ltd.
6/30/2016 The Hershey Co. - Mondelez International, Inc.
6/28/2016 Peekaboo Child Care Centre, Inc. /Child Care Centres (20)/Peekaboo Child Care Centre, Inc. BrightPath Early Learning, Inc.
6/28/2016 Mile High Hoodies LLC - Vaprwear Gear LLC
6/28/2016 ABT Power Management, Inc. - Total Fleet Solutions Ltd.
6/27/2016 Clean Ones Corp. - Butler Home Products LLC
6/26/2016 Bromeland Publishing, Inc. /Scuttlebutt Magazine/ Bromeland Publishing, Inc. Forum Communications Co.
6/24/2016 The Sun Products Corp. - Henkel AG & Co. KGaA
6/24/2016 Skullcandy, Inc. - Incipio Technologies, Inc.
6/23/2016 HDMI Digital Media, Inc. - 8020 Connect, Inc.
6/22/2016 Hillcrest Golf & Country Club LP - PulteGroup, Inc.
6/22/2016 Binder Casting - RWS & Associates Entertainment, Inc.
Tim AlexanderManaging [email protected]+1 (612) 359-2716
Brant [email protected]+1 (612) 359-2709
Ed ArkusManaging [email protected]+44 20 7518 8905
Ryan BudlongManaging [email protected]+1 (415) 217-3409
Glenn GurtcheffManaging [email protected]+1 (612) 359-2702
Ryan [email protected]+1 (612) 359-2703
Andy WarczakVice [email protected]+1 (612) 359-2714
Zach EnglandVice [email protected]+1 (415) 217-3429
Beau PierceVice [email protected]+1 (804) 887-6113
John Neuner IVManaging [email protected]+1 (804) 915-0125
Brent SpillerManaging [email protected]+1 (804) 915-0183
Will [email protected]+44 20 7518 8906
Corey [email protected]+1 (804) 932-1342

Energy, Power& Infrastructure
IndustrialsHealthcare & Life Sciences
Transportation & Logistics
Aerospace, Defense & Government
Services
Business Services
Building Products & Materials
Technology, Media & Telecom
Specialty Distribution
Consumer
PAGE |
HARRIS WILLIAMS & CO. OFFICE LOCATIONS
UNITED STATES EUROPE
BostonOne International Place24th FloorBoston, Massachusetts 02110Phone: +1 (617) 482-7501
Cleveland1900 East 9th Street20th FloorCleveland, Ohio 44114Phone: +1 (216) 689-2400
Minneapolis222 South 9th StreetSuite 3350Minneapolis, Minnesota 55402Phone: +1 (612) 359-2700
Richmond (Headquarters)1001 Haxall Point9th FloorRichmond, Virginia 23219Phone: +1 (804) 648-0072
San Francisco575 Market Street31st FloorSan Francisco, California 94105Phone: +1 (415) 288-4260
Washington, D.C. 800 17th St. NW2nd FloorWashington, D.C. 20006Phone: +1 202-207-2300
FrankfurtBockenheimer Landstrasse 33-3560325 FrankfurtGermanyPhone: +49 069 3650638 00
London63 Brook StreetLondon W1K 4HS, EnglandPhone: +44 (0) 20 7518 8900
NETWORK OFFICES
Beijing
Hong Kong
Mumbai
New Delhi
Shanghai
Consumer
18
OUR FIRM
Harris Williams & Co. has a broad range of industry expertise, which creates powerful opportunities.Our clients benefit from our deep-sector experience, integrated industry intelligence andcollaboration across the firm, and our commitment to learning what makes them unique. For moreinformation, visit our website.
INDUSTRY UPDATE │ JUNE 2017
CONSUMER AND RETAIL

PAGE |
HARRIS WILLIAMS & CO.
19
SOURCES
Harris Williams & Co. (www.harriswilliams.com and www.harriswilliams.de) is a preeminent middle market investment bank focused on the advisory needs of clients worldwide. The firm has deep industry knowledge, global transaction expertise, and an unwavering commitment to excellence. Harris Williams & Co. provides sell-side and acquisition advisory, restructuring advisory, board advisory, private placements, and capital markets advisory services.
Harris Williams & Co. Ltd is a private limited company authorised and regulated by the Financial Conduct Authority, incorporated under English law with its registered office at 5th Floor, 6 St. Andrew Street, London EC4A 3AE, UK, registered with the Registrar of Companies for England and Wales under company number 7078852. Directors: Mr. Ned Valentine, Mr. Paul Poggi, Mr. Thierry Monjauze and Mr. Aadil Khan.
Harris Williams & Co. Ltd Niederlassung Frankfurt (German branch) is registered in the Commercial Register (Handelsregister) of the Local Court (Amtsgericht) of Frankfurt am Main, Germany, under registration number HRB 96687, having its business address at Bockenheimer Landstrasse 33-35, 60325 Frankfurt am Main, Germany. Permanent Representative (Ständiger Vertreter) of the Branch Niederlassung: Mr. Jeffery H. Perkins.
THIS REPORT MAY CONTAIN REFERENCES TO REGISTERED TRADEMARKS, SERVICE MARKS AND COPYRIGHTS OWNED BY THIRD-PARTY INFORMATION PROVIDERS. NONE OF THE THIRD-PARTY INFORMATION PROVIDERS IS ENDORSING THE OFFERING OF, AND SHALL NOT IN ANY WAY BE DEEMED AN ISSUER OR UNDERWRITER OF, THE SECURITIES, FINANCIAL INSTRUMENTS OR OTHER INVESTMENTS DISCUSSED IN THIS REPORT, AND SHALL NOT HAVE ANY LIABILITY OR RESPONSIBILITY FOR ANY STATEMENTS MADE IN THE REPORT OR FOR ANY FINANCIAL STATEMENTS, FINANCIAL PROJECTIONS OR OTHER FINANCIAL INFORMATION CONTAINED OR ATTACHED AS AN EXHIBIT TO THE REPORT. FOR MORE INFORMATION ABOUT THE MATERIALS PROVIDED BY SUCH THIRD PARTIES, PLEASE CONTACT US.
The information and views contained in this report were prepared by Harris Williams & Co. (“Harris Williams”). It is not a research report, as such term is defined by applicable law and regulations, and is provided for informational purposes only. It is not to be construed as an offer to buy or sell or a solicitation of an offer to buy or sell any financial instruments or to participate in any particular trading strategy. The information contained herein is believed by Harris Williams to be reliable, but Harris Williams makes no representation as to the accuracy or completeness of such information. Harris Williams and/or its affiliates may be market makers or specialists in, act as advisers or lenders to, have positions in and effect transactions in securities of companies mentioned herein and also may provide, may have provided, or may seek to provide investment banking services for those companies. In addition, Harris Williams and/or its affiliates or their respective officers, directors and employees may hold long or short positions in the securities, options thereon or other related financial products of companies discussed herein. Opinions, estimates and projections in this report constitute Harris Williams’ judgment and are subject to change without notice. The financial instruments discussed in this report may not be suitable for all investors, and investors must make their own investment decisions using their own independent advisors as they believe necessary and based upon their specific financial situations and investment objectives. Also, past performance is not necessarily indicative of future results. No part of this material may be copied or duplicated in any form or by any means, or redistributed, without Harris Williams’ prior written consent.
Copyright© 2017 Harris Williams & Co., all rights reserved.
CONSUMER AND RETAIL
INDUSTRY UPDATE │ JUNE 2017
DISCLOSURES
1) Pitch Book
2) FactSet
3) Thomson Financial
4) Reuters
5) S&P Capital IQ LCD