constructing progress maps of digital technology for
TRANSCRIPT

Journal of Education and Learning; Vol. 8, No. 6; 2019 ISSN 1927-5250 E-ISSN 1927-5269
Published by Canadian Center of Science and Education
90
Constructing Progress Maps of Digital Technology for Diagnosing Mathematical Proficiency
Putcharee Junpeng1, Jenrop Krotha1, Kanokphon Chanayota1, KeowNgang Tang2 & Mark Wilson3 1 Faculty of Education, Khon Kaen University, Khon Kaen 40002, Thailand 2 International College, Khon Kaen University, Khon Kaen 40002, Thailand 3 Graduate School of Education, University of California, Berkeley, California 94720, United States
Correspondence: Putcharee Junpeng, Faculty of Education, Khon Kaen University, Khon Kaen 40002, Thailand. E-mail: [email protected]
Received: September 9, 2019 Accepted: October 9, 2019 Online Published: October 26, 2019
doi:10.5539/jel.v8n6p90 URL: https://doi.org/10.5539/jel.v8n6p90
Abstract
This research aims to construct and validate progress maps of digital technology for diagnosing the multidimensional mathematical proficiency (MP) in Number and Algebra for Grade 7 students utilizing the Construct Modeling Approach. Researchers employed four building blocks as follows. Firstly, researchers developed the progress maps as an assessment framework of multidimensional MP. This is followed by creating the test for diagnosing MP. Next, researchers assigned scoring criteria and created the transition points of students’ MP levels. Finally, researchers validated the quality of the progress maps through empirical evidence. A total sample 1,500 Grade 7 students was used to support the validity and reliability evidence of the progress maps through the Wright Map using Multidimensional Random Coefficients Multinomial Logit Model. Results revealed that there were two dimensions of progress maps, namely mathematical procedures (MAP) and structure of learning outcome (SLO), and the researchers investigated three strands of validity evidence, namely test content, response processes, and internal structure. The reliability values in the MAP and SLO were 0.84 and 0.80 respectively. Finally, the Grade 7 students were mainly found to be at level-2 in the MAP dimension (44.95%) and the SLO dimension (61.57%). The experts’ evaluation results showed that the digital technology that was developed at the “most appropriate” quality levels in terms of usefulness, suitability, and accuracy, and at the “very appropriate” for the feasibility aspect, and hence is successfully contributing to the clarification of learning goals, to support for student-centered instruction, and that it is helpful in improving in teacher professional development.
Keywords: mathematical procedures, multidimensional mathematical proficiency, number and algebra, progress maps, structure of learning outcome
1. Introduction
Mathematics is a form of practical knowledge in our daily life which is not only a fundamental discipline but also a foundation for many other scientific disciplines and thus it plays a significant role in stimulating students’ learning (Huang, Huang, & Wu, 2014). Since we are living in an era of accelerating change in society, particularly due to technological development, students have to be prepared with sufficient mathematical proficiency (MP) in terms of skills and competencies needed for work and life in the 21st Century (Redecker & Johannessen, 2014). MP is defined as a student’s ability to explore, conjecture, and reason logically in cognitive processes and to understand how to solve mathematics problems that is to, apply, and adopt appropriate strategies to solve the problems, and reflect on the process used to solve the problems (Junpeng, Inprasitha, & Wilson, 2018).
The United States National Research Council (2001) identified five strands of MP consisting of conceptual understanding, procedural fluency, strategic competence, adaptive reasoning, and productive disposition and their definitions as follows. Conceptual understanding refers to the integrated and functional grasp of mathematical ideas which enables students to learn new ideas by connecting those ideas to what they already know. The procedural fluency is defined as the skill in carrying out procedures flexibly, accurately, efficiently, and appropriately. Strategic competence is the ability to formulate, represent, and solve mathematical problems.

jel.ccsenet.org Journal of Education and Learning Vol. 8, No. 6; 2019
91
Adaptive reasoning means the capacity for logical thought, reflection, explanation, and justification. Productive disposition is the inclination to see mathematics as sensible, useful, and worthwhile, coupled with a belief in diligence and one’s efficacy.
MP requires the students not only be able to recall conceptual knowledge but also use this knowledge to engage in practices such as developing inquiries, creating explanations and interpreting data (OECD, 2016). There are a few existing diagnostic tools such as ALEKS, Carnegie Learning’s Cognitive Tutors, Ms. Linkquist, and ActiveMath designed to diagnose students’ mathematics problem-solving abilities. However, these tools differ in terms of the measurement technique employed, and perhaps more importantly on the local level of the diagnosis there is a wide range, for example from analyzing specific problem-solving steps to a global level, such as inferring mastery status of general MPs (Shute & Underwood, 2006).
Through enhanced digital technology in education, teachers have begun to realize the benefits of technology in making drastic changes to their instruction, assessments, and even the physical make-up of their classrooms, and are doing so at a much faster rate than expected (Newman, 2017). The current educational sector is becoming more competitive, and hence digital technologies are becoming a necessary means of survival: the new digital educational environment requires teachers to adapt and adopt digital technologies, methodologies, and mindsets (O’Brien, n.d.). Digital assessment is one of the effective ways to diagnose MP by improving assessment across a range of contexts and purposes (Drasgow, 2016; Gane, Zaidi, & Pellegrino, 2018).
One of the greatest challenges in Grade 7 mathematics education is serving the diverse preparation and students’ needs within a framework that is both driven by research yet simplifies the management task. This is because teachers and students must have a simple, transparent, and constant means to guide and assess learning mathematics (Junpeng et al., 2018). As a result, researchers aimed to create a digital learning system focusing on dynamic assessment, grounded in research on learning trajectories around great ideas, and designed to inform instructional practices within a competency-based and personalization-based model of school change to diagnose and improve students’ MP. On this line of reasoning, researchers aimed to construct and validate the progress maps of digital technology for diagnosing multidimensional MP in Number and Algebra to the Grade 7 students utilizing Construct Modelling Approach.
2. Literature Review
2.1 A Developmental Perspective on Student Learning
MP is defined as the mathematical process of applying mathematical knowledge. Since mathematics is considered as fundamental to a child’s development and communication in later life, basic numeracy skills are essential to assist them to be a competent adult with high achievement (Papadakis, Kalogiannakis, & Zaranis, 2018). Several cycles of piloting and revising the tasks for assessing MP were conducted. This is predominantly accurate for open-response questions where students are requested to produce and transcribe the answer, employing higher-order thinking, provoking the measured MP, and enlightening the MP process through the practice of two dimensions, namely mathematical procedures (MAP) (Junpeng et al., 2018) and structure of learning outcome (SLO) (Biggs & Collis, 1982).
The Structure of the Observed Learning Outcome (SOLO taxonomy) is a model used to identify, describe or explain the level of understanding to determine the quality level of students’ learning results and can be used to measure the SLO. Biggs and Collins (1982) proposed the concept of conceptual structure into five levels, namely pre-structural, uni-structural, multi-structural, relational, and extended abstract. The pre-structural level is where students do not understand the true purpose and still use simple methods to understand the content. They cannot create concepts and still have misunderstandings in their mathematical thinking. The unistructural level refers to response where the student’s focus is related to only one view of the mathematical situation. They can identify things that they learn by memorizing, such as identifying names, remembering, and following simple instructions. The multi-structural level refers to a response where the students’ focus is on many perspectives and they can connect complex concepts, explain, and describe each section. The relational level is the integration of various relationships together. They can analyze, compare, identify differences, explain the logical relationship and apply what they learned but they still cannot conclude abstract knowledge. The extended abstract refers to the integration of the relationships. Students can create an advanced abstract concept or create a new theory and make a conclusion based on the concepts that they learn.
2.2 Mathematical Proficiency Assessment
Junpeng et al. (2018) developed an assessment system using construct modeling to assess students’ MP in mathematics problems-solving in terms of their 3-D process-oriented thinking, namely mathematical procedures

jel.ccsenet.o
(MAP), mabilities of
A successinterpretabresponses progress mOhtani, 20mathemati
In this stud
2.3 Multid
Item Respability andParameter
The MRCMspecificatiospecify thesituation. F& Haldaneselecting th
A Wright probabilitybetween thdifficulty l
2.4 Past R
Huang et mechanismengaged imotivationmathemati
org
mathematical stf students in th
sful progress ble across a care linked to t
map is one m015). Figure 1ical reasoning
Fig
dy, we will be
dimensional Re
ponse Theory d item difficuLogistic Mod
MLM (Adamson of a large e relationship bFor this projecte, 2007). The mhe assessment
map is the dy of answeringhe student and level of most o
Research Review
al. (2014) adom strategy for in mathematicn. Besides, theics learning an
trategies (MAhese three dime
map displayscurriculum buthe progress m
model of how 1 shows the pto assess stude
gure 1. Framew
focusing on th
esponse Test M
is a measuremulty. Some exadel, and the Thr
, Wilson, & Wnumber of mu
between respon, the parameter
model fit, reliabframework wit
istribution of g correctly eacthe examinati
of the items is
w
opted an Inputa primary scho
cs learning threir research rend provide a d
Journal of Ed
AS), and matheensions correla
what is to but specific enomap, then it caassessment ca
progress mapsents’ abilities i
work for asses
he MAP dimen
Model
ment approachamples are three-Parameter
Wang, 1997) is ultidimensionanses to the itemrs in these modbility and item fth the flexibilit
item difficultych item of the on as reflectedabove the mea
t-Process-Outcool mathematirough a digita
esults imply thdiagnostic me
ducation and Le
92
ematical reasoated between 0
be measured ough to guidean be determinan be integrates of mathematin solving math
ssing mathema
nsion among th
h base on a me One-ParameLogistic Mod
an extended Rl item respons
ms and structuradels were estimafit comparisonty and appropri
y, the studentexamination.
d in the Rasch an of the stude
come digital gics course. Theal game-basedhat teachers shechanism that
earning
oning (MAR).0.86 and 0.89.
or assessed ie MP item dened what is theed with diagntical procedurhematics prob
atics problem-s
hese three, but
odel of the reeter Logistic Mel (Embretson
asch model thase models. Thial parameters aated using ACEs provide the reiateness for dia
ts’ ability, andThis probabiliModel. The tents (Baker & K
game-based leeir research resd learning syhould integratecan enhance s
Their finding
in terms geneevelopment. We students’ levnosis and instres, mathemati
blems (Junpeng
solving MP
also on SLO.
elationship betModel (Rasch
n & Reise, 2000
at is more flexiis model uses assumed for a ER ConQuest (eliability and vagnosing in a r
d their MP levity is represenest is considereKim, 2017).
earning systemsults showed tstem and thise a motivatingstudents’ inter
Vol. 8, No. 6;
gs showed tha
eral enough tWhen the studvel of learningruction (Watsoical strategies,g et al., 2018).
tween the studh Model), the 0).
ible allowing fodesign matric
given measure(Wu, Adam, Wvalidity evidenceal-world cont
vel in terms onted by the disted as difficult i
m with a diagnthat students cas leads to posg game modelrest and reduc
2019
at the
to be dents’ . The on & , and
dents’ Two
or the ces to ement
Wilson, ce for ext.
f the tance if the
nostic an be sitive l into e the

jel.ccsenet.org Journal of Education and Learning Vol. 8, No. 6; 2019
93
anxiety of learning mathematics. Finally, Huang et al. (2014) concluded that learning motivation and learning performance are enhanced when anxiety is mitigated.
Ketterlin-Geller and Yovanoff (2009) found that diagnosis is an integral part of instructional decision-making as it can be the bridge between identification of students who may be at-risk for failure if the instructional delivery is not designed carefully with diagnostic assessments. This is because diagnostic assessments can provide valuable information about students’ persistent misconceptions in the targeted domain. Ketterlin-Geller and Yovanoff (2009) pointed out that cognitive diagnostic assessments are an emerging solution to provide detailed and precise information about students’ thinking that is needed to provide appropriate educational opportunities for students who struggle in mathematics.
Faber, Luyten and Visscher (2017) examined the effects of a digital formative assessment tool on mathematics achievement and motivation in Grade 3 primary education. A total of 79 schools and 1808 students participated in their research. The experimental schools used a digital formative assessment tool while control schools used their regular teaching methods and materials. The digital tool used in their research consisted of students’ feedback, feedback to teachers, and adaptive assignments. The collected data were standardized achievement pretests and posttests, a student motivation survey, classroom observations, and students’ log files. Multilevel analysis showed that there are positive effects of the digital formative assessment tool towards students’ achievement and motivation. Furthermore, achievement effects were found to be greater for high-performing students.
Gane et al. (2018) illustrated the challenges that were associated with the assessment of multidimensional learning to diagnose science proficiency and the benefits provided by technology. They framed the assessment development as an evidence-centered design process and illustrated it by using cases drawn from middle school science. Then they turned to ways in which assessment systems need to evolve to expand the scope of what the students can do in the creation and use of valid, reliable, and equitable assessments of complex and multidimensional learning. They concluded that technology-based assessment systems with an emphasis on measuring what matters versus measuring what is easy are efficacious, since what they choose to assess will become the focus of instruction. They also suggested that investment in the development, validation, and deployment of technology-based assessments that reflect the multidimensional competencies identified by contemporary research and theory will form major advances in assessment policy and practice.
Chanayota and Junpeng (2016) investigated of mathematical reasoning skills in the Theorem Pythagorean topic for Grade 5 students. Cronbach’s alpha for the test was 0.74. Their findings showed that students have different levels of mathematical reasoning skills. The majority of the students were at the level of strategic thinking skills.
3. Method
Researchers employed the construct modeling approval based on Wilson’s (2005) developmental assessment ideas that embed pedagogy and curriculum in the design of diagnostic tasks and so-called the Berkeley Evaluation and Assessment Research (BEAR) assessment system (BAS). Wilson and Sloane (2000) proposed the four building blocks as the components of the assessment system, namely progress maps; design of tasks; outcome space, and measurement model (as represented by the Wright map). BAS is conducted under four principles as follows: (i) A developmental perspective of students’ learning; (ii) the link between instruction and assessment; (iii) teacher management of classroom instruction and assessment, and (vi) generation of high-quality evidence.
3.1 Research Design and Sample
The study employed a research and development design to develop a framework to assess Grade 7 students’ MP levels. The population of the study is all the Grade 7 students in secondary schools located in the northeastern region of Thailand. The total population was 136,063 students in the year 2017. The stratified random sampling technique was employed, and the sample size required was 1,500. Moreover, the required sample size for estimation of item parameters in the multidimensional model of the Rasch-family models is 400 to 500 to provide accurate parameter estimates (Custer, 2015; Jiang, Wang, & Weiss, 2016).
A total of 30 Grade 7 students from three different proficiency levels were selected as the pre-pilot group for creating the progress maps. There were two groups of examinees used to validate the progress maps, namely 200 and 1,500 examinees who involved in pilot study and actual study respectively. The role of the evidence from the 200 examinees was to explore the quality of levels and descriptions in each progress map with link test items and scoring guide through the Wright Map using the Rasch model. The evidence from the 1,500 examinees supported the validity and reliability argument about the progress maps, again through the Wright Map.
jel.ccsenet.org Journal of Education and Learning Vol. 8, No. 6; 2019
94
3.2 Research Procedure
3.2.1 Progress Maps
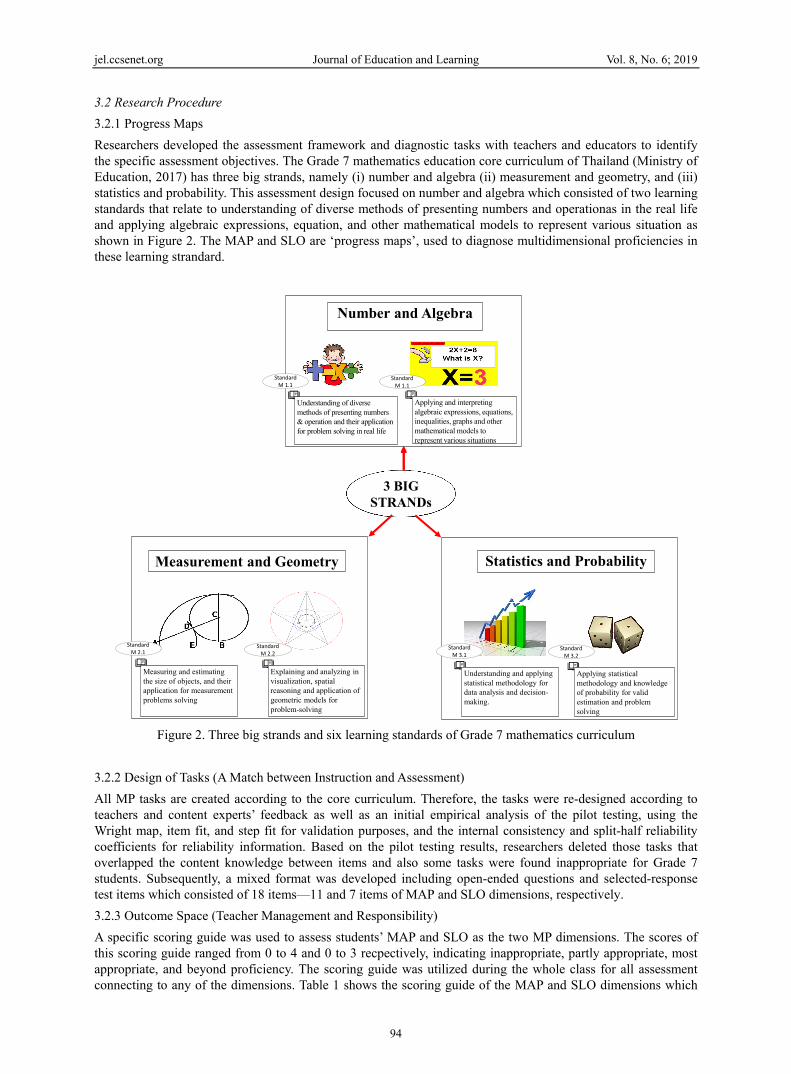
Researchers developed the assessment framework and diagnostic tasks with teachers and educators to identify the specific assessment objectives. The Grade 7 mathematics education core curriculum of Thailand (Ministry of Education, 2017) has three big strands, namely (i) number and algebra (ii) measurement and geometry, and (iii) statistics and probability. This assessment design focused on number and algebra which consisted of two learning standards that relate to understanding of diverse methods of presenting numbers and operationas in the real life and applying algebraic expressions, equation, and other mathematical models to represent various situation as shown in Figure 2. The MAP and SLO are ‘progress maps’, used to diagnose multidimensional proficiencies in these learning strandard.
Measurement and Geometry
3 BIG STRANDs
Number and Algebra
Statistics and Probability
Understanding of diverse methods of presenting numbers & operation and their application for problem solving in real life
Applying and interpreting algebraic expressions, equations, inequalities, graphs and other mathematical models to represent various situations
Measuring and estimating the size of objects, and their application for measurement problems solving
Explaining and analyzing in visualization, spatial reasoning and application of geometric models for problem-solving
Understanding and applying statistical methodology for data analysis and decision-making.
Applying statistical methodology and knowledge of probability for valid estimation and problem solving
Standard M 1.1
Standard M 1.1
Standard M 2.1
Standard M 2.2
Standard M 3.1
Standard M 3.2
Figure 2. Three big strands and six learning standards of Grade 7 mathematics curriculum
3.2.2 Design of Tasks (A Match between Instruction and Assessment)
All MP tasks are created according to the core curriculum. Therefore, the tasks were re-designed according to teachers and content experts’ feedback as well as an initial empirical analysis of the pilot testing, using the Wright map, item fit, and step fit for validation purposes, and the internal consistency and split-half reliability coefficients for reliability information. Based on the pilot testing results, researchers deleted those tasks that overlapped the content knowledge between items and also some tasks were found inappropriate for Grade 7 students. Subsequently, a mixed format was developed including open-ended questions and selected-response test items which consisted of 18 items—11 and 7 items of MAP and SLO dimensions, respectively.
3.2.3 Outcome Space (Teacher Management and Responsibility)
A specific scoring guide was used to assess students’ MAP and SLO as the two MP dimensions. The scores of this scoring guide ranged from 0 to 4 and 0 to 3 recpectively, indicating inappropriate, partly appropriate, most appropriate, and beyond proficiency. The scoring guide was utilized during the whole class for all assessment connecting to any of the dimensions. Table 1 shows the scoring guide of the MAP and SLO dimensions which

jel.ccsenet.org Journal of Education and Learning Vol. 8, No. 6; 2019
95
consisted of five and four proficiency levels respectively (i.e., see the Number and Algebra box in Figure 2).
Table 1. Scoring guide of proficiency levels for diagnosing students’ ability in MAP and SLO dimensions
Level Score Learning Progress Level of MAP
Diagnostic Description Level Score Learning Progress Level of SLO
Diagnostic Description
5 4 Strategic/ Extended Thinking
- Student is able to show a variety of complex and appropriate solutions - Student is able to expand the original knowledge to new knowledge for finding answers Student is able to create his own ideas - Student can choose appropriate strategies and concepts to solve the problems. - Student can display the relationship of numbers and write them in general as a mathematical model.
4 3 Relational/ Extended Abstract
- Student can solve problems in each situation and create a relationship of problem situations - Student can use concepts to connect and can summarize references as abstract knowledge. - Student can create knowledge from his own ideas.
4 3 Simple Skills / Concept
-Student can apply basic mathematical knowledge to solve more complex problems through the process or method. -Student can solve the problems to reflect that he has the knowledge and understanding of principles used. - Student can explain using the mathematical symbols appropriately. -Student can use the mathematical representation to explain in the form of a picture or table to reasonably assemble but still not perfect or accurate as it should be
3 2 Multi-structural
- Student can solve the problems in each situation but student can not associate the relationships of the each situation together. - Student can use the method of addition, subtraction, multiplication, and division but cannot be combined all together.
3 2 Basic memory / Reproduction
- Student can apply the basic knowledge to solve the simple or familiar mathematical problems. -Student is able to write explanations of the concepts but can not explain in the form of mathematical symbols. -Student lacks of knowledge and understanding about applying mathematical principles to solve problems and it is impossible for him to solve problems at a higher level.
2 1 Uni-structural
- Student can answer the problems in a manner like an example but when adding conditions, student cannot connect the concept to solve the problems.
2 1 Unrecalled Memory
- Student can not use basic knowledge or important knowledge in the number and algebra to use in image analysis and also cannot identify the relationship of that image. - Student can find the answer but cannot explain an appropriate method to answer the question. - Student can not extend the solution to this issue at a higher level
1 0 Pre-structural
- Student lacks the skills in interpretation of questions / problems/ situations - Students can not create the concept of number and algebra. - Student is unable to link the algebraic concepts. - Student has misconception in number and algebra. - Student is unable to answer or answer unrelatedly.
1 0 Non-response/ Irrelavance
- Student is unable to answer or answer unrelatedly.
3.2.4 Measurement Model (Generating Quality Evidence)
This study employed the MRCMLM (Adams, Wilson, & Wang, 1997) which is the family of Rasch Model (Rasch, 1960) to investigate a sound progress maps for diagnosing MP. MRCMLM is a measurement tool that enables researchers to relate the modelling of items in multidimensional proficiencies, estimate of the students’ proficientcy parameter, and set the transition points for diagnosing student’s MP level in each dimension. The parameters in these models are estimated using ACER ConQuest version 2.0 (Wu, Adam, Wilson, & Haldane, 2007). The Wright map provide the reliability and validity for validating the quality of the progress map in each dimension.

jel.ccsenet.org Journal of Education and Learning Vol. 8, No. 6; 2019
96
3.3 Evaluation Assessment on Digital Diagnostic MP Tool
Researchers adapted the concepts of Stufflebeam (as presented in Kanjanawasi, 2011) to evaluate the quality of the digital diagnostic MP tool in four aspects, namely usefulness, feasibility, suitability, and accuracy. Usefulness is measured according to the benefits of the diagnostic MP tool to serve the needs of the students on time and have a good effect on using it. Feasibility is to ensure the consistency of the reality for practical, acceptable, economical, and cost-effective situations. Suitability is to ensure that the system is appropriate for its quality or state of being and will ultimately depend on the needs of the users. Accuracy is defined as the degree to which the result of a measurement or specification conforms to the correct value or a standard of precision.
The final phase of this research was to evaluate the usefulness, feasibility, suitability, and accuracy of the digital technology assessment system to diagnose MP by 10 experts after digital technology has been successfully implemented. A five-point Likert scale evaluation form was used as an instrument to gauge the experts’ views ranged from minimal, less, medium, extreme, to most appropriate levels. The five appropriateness levels were interpreted according to the average score as shown in Table 2.
Table 2. Interpretation of appropriate level based on average score
Mean Score Range Interpretation
4.50–5.00 Most appropriate 3.50–4.49 Very appropriate 2.50–3.49 Medium appropriate 1.50–2.49 Less appropriate 1.00–1.49 Minimal appropriote
4. Results
The results of this research are presented in line with the research aim indicated above. The initial result was the development of the progress maps as an assessment framework of multidimensional MP. This is followed by creating the test for diagnosing MP. Next, the scoring criteria were assigned to measure Grade 7 students’ MP levels. Finally, a Heuristic evaluation of the quality of digital technology in terms of its usefulness, feasibility, suitability, and accuracy by 10 experts is performed.
4.1 Development of Progress Maps of Digital Technology for Diagnosing MP
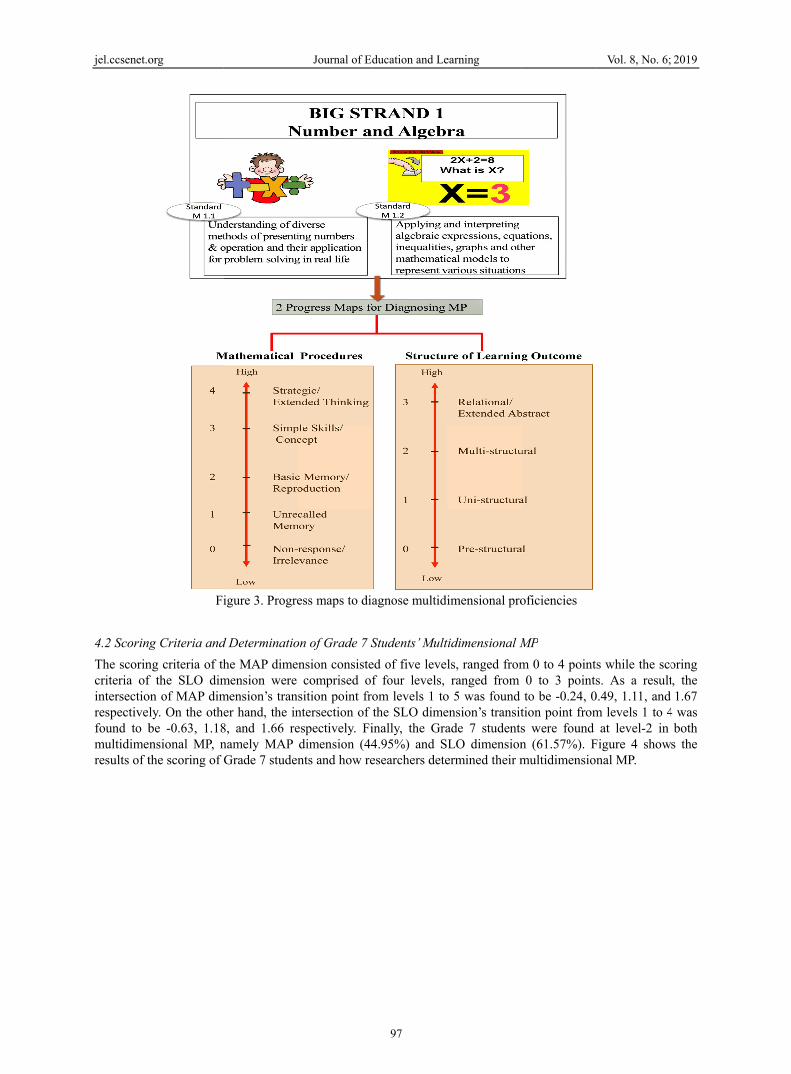
Researchers employed a construct modelling approach to access Grade 7 students’ multidimensional MP on number and algebra in terms of MAP and SLO. According to the assessment results, researchers found that there were two learning standards, namely M1.1 and M1.2. These learning standards had two progress maps (see Figure 3). The MAP progress map had five levels, namely non-response/irrelevance, unrecalled memory, basic memory/reproduction, simple skills/concept, and strategic/extended thinking levels (see Figure 3). Besides, the EAP/PV reliability value was 0.84 and Cronbach’s Alpha coefficient was 0.85, thus it was concluded as having acceptable reliability. Results imply that the test was found to be suitable for the Grade 7 students and they were at a moderate level of MAP dimension of MP.
On the other hand, the results of the SLO progress map showed that there were four levels of SLO, namely pre-structural, uni-structural, multi structural, and relational/extended abstract levels (see Figure 3). The EAP/PV reliability value was 0.80 and Cronbach’s Alpha coefficient was 0.85, thus it was concluded as having acceptable reliability. Once again, results of the SLO dimension imply that the test was found to be suitable for the Grade 7 students and they were at a moderate level of SLO dimension of MP. Besides, there were three strands of validity evidence found, namely test content, response processes, and internal structure being identified in the progress maps through the Wright map (see Figure 4).
jel.ccsenet.o
4.2 Scoring
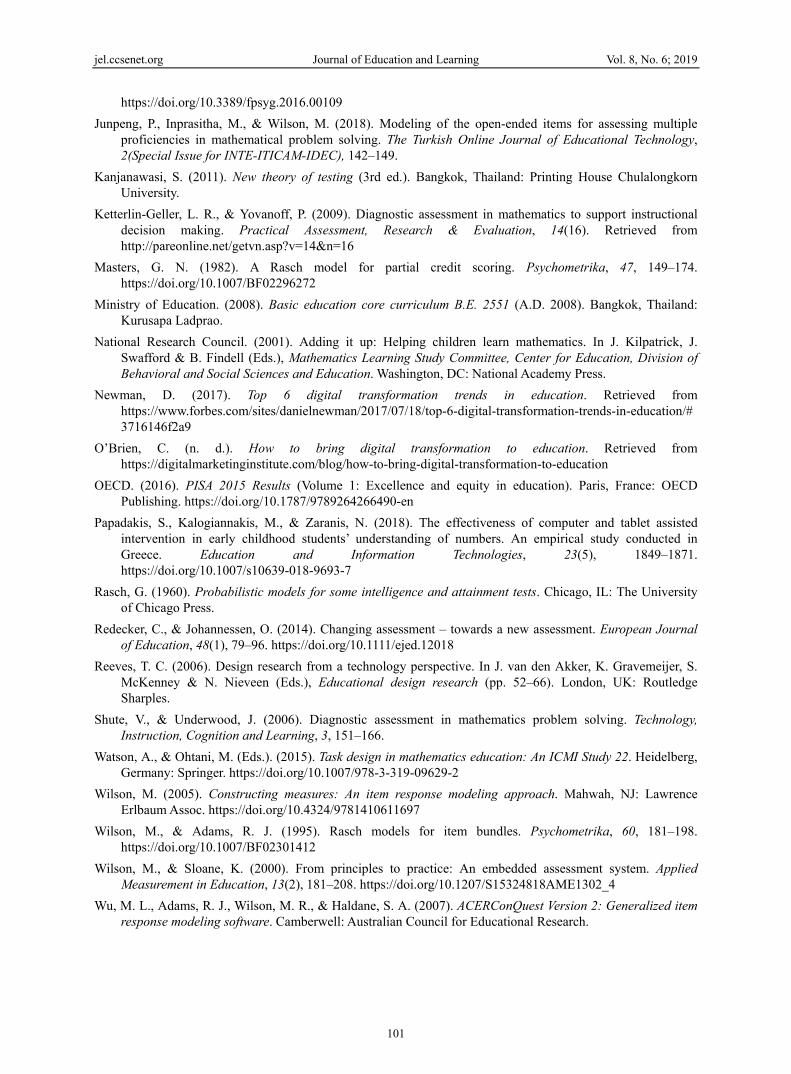
The scorincriteria ofintersectiorespectivelfound to bmultidimeresults of t
org
Fi
g Criteria and
ng criteria of thf the SLO dimon of MAP dimly. On the othbe -0.63, 1.18nsional MP, nthe scoring of
igure 3. Progre
d Determinatio
he MAP dimemension were mension’s traner hand, the in
8, and 1.66 renamely MAP Grade 7 studen
Journal of Ed
ess maps to dia
on of Grade 7 S
nsion consistecomprised of
sition point frontersection of espectively. Fidimension (44nts and how re
ducation and Le
97
agnose multidi
Students’ Mult
ed of five levelf four levels, om levels 1 tothe SLO dimeinally, the Gra4.95%) and Sesearchers dete
earning
imensional pro
tidimensional M
ls, ranged fromranged from
o 5 was found ension’s transitade 7 studentsLO dimensionermined their m
oficiencies
MP
m 0 to 4 point0 to 3 pointsto be -0.24, 0
tion point froms were found n (61.57%). Fmultidimension
Vol. 8, No. 6;
s while the scos. As a result
0.49, 1.11, and m levels 1 to 4
at level-2 in Figure 4 shownal MP.
2019
oring t, the 1.67
4 was both s the

jel.ccsenet.o
Figu
4.3 Heuris
The Heurisuitability,technologyfeasibility.accuracy oobjective oassessmenactual abil
This is foSD=0.44).system is cthe assessmscore fromSD=0.46).be utilized
The feasibquality. Ththe digitallearning m(X=4.00, results of t
org
MA
ure 4. The tran
stic Evaluation
istic evaluatio, and accuracyy system was . The feasibilitof digital technof the diagnos
nt system is acclity of the stud
llowed by the. This implies tconsistent withment is conduc
m the experts sh. This implies d to diagnose M
bility aspect haherefore, the fel technology cmanagement anSD=0.00), andthe heuristic ev
AP Dimension
sition point of
n Results
on results on y were evaluate
at most approty of digital tenology (X=4.6stic assessmencurate (X=4.40ents (X=4.60,
e suitability ofthat the assessmh the assessmencted as well ashowed that usethat digital tec
MP, and can pr
ad the lowest easibility of dican be used tond student devd the system pvaluation.
Journal of Ed
f MAP and SLO
the quality ofed by 10 experopriate levels chnology was
67, SD=0.33). nt accurately (X0, SD=0.49), anSD=0.49).
f digital technment process, nt guidelines (s the scope of tefulness of digchnology canrepare students
average meanigital technoloo assess the abvelopment (X=process and pr
ducation and Le
98
O dimensions
f digital technrts. Results of tin terms of itat the “very aThis implies thX=5.00, SD=0nd the report o
nology which the completenX=4.80, SD=0the assessmentgital technologrespond to the
s to improve th
n (X=4.26, SDgy was found
bility of studen=5.00, SD=0.0rocedure is pra
earning
SLO
from the lowe
nology in termthe Heuristic ets accuracy, u
appropriate” lehat this digital0.00), the eval
of the reflection
was at the “mness of the eval0.40). Besides,t content (X=4gy was at the “me needs of the heir learning ou
=0.13) if compat a “very app
nts and can be00), the resultactical (X=3.8
O Dimension
est level to the
ms of its usefevaluation showusefulness, andevel. The highe
technology is luation procesn data is accura
most approprialuation report, , there is a clea.40, SD=0.49)most appropriastudents, stud
utcomes.
pared to the otpropriate” levee used by teact of the evalua0, SD=0.40).
Vol. 8, No. 6;
highest level
fulness, feasibwed that the dd suitability exest average wa able to identif
ss of the diagnate according t
ate” level (X=and the assess
ar agreement b). Next, the aveate” level (X=
dents’ feedback
ther three aspecel. This implieschers in develoation is appropTable 3 show
2019
bility, igital xcept as the fy the nostic to the
4.64, ment efore erage 4.60, k can
cts of s that oping priate
ws the

jel.ccsenet.org Journal of Education and Learning Vol. 8, No. 6; 2019
99
Table 3. Heuristic evaluation
Quality Aspect Average Score Standard Deviation Appropriate Level
Accuracy 4.67 0.33 Most appropriate Suitability 4.64 0.44 Most appropriate Usefulness 4.60 0.46 Most appropriate Feasibility 4.26 0.13 Very appropriate
5. Discussion and Conclusion
The key results of this research are the progress maps for the digital diagnostic tool to diagnose Grade 7 students’ MP in terms of MAP and SLO dimensions. Besides, expert opinion found that this digital technology tool is at the “most appropriate” level in terms of its accuracy, suitability, and usefulness and “very appropriate” in its feasibility aspect. As a result, this digital technology has been found to be not only timely, accurate, and relevant to teaching but also very informative on student progress in a systematic manner, precise, and can be taken multiple times. In addition, results revealed that the progress maps help give a clear vision of the learning goals, identification of big strand, including two learning standards which are in line with Thailand National Core Standards of Grade 7 mathematics curriculum. These can be utilized as guidelines to provide effective mathematics teachers’ professional development as well as to promote the importance of student-centered instruction.
Diagnostic assessment is a key element in the process of learning mathematics because it can signify what the teachers want their students to know and be able to do and can help teachers to create learning environments that support the attainment of learning standards as indicated in the national mathematics curriculum. Using this line of reasoning, the results of this research imply that what the teachers choose to assess using digital diagnostic tools will end up being the focus of instruction. The results are corresponding to previous researchers’ results (Faber et al., 2017; Gane et al., 2018; Huang et al., 2014; Ketterlin-Geller & Yovanoff, 2009). Besides, the assigned diagnostic MP assessments in the digital diagnostic tool must be best represented in the forms of knowledge and competency and the kinds of learning that teachers want to emphasize. This is because the current education system is designed to require students to possess a higher level of MP in the complex and multidimensional proficiencies which are needed in the 21st century.
However, results imply that there are still some limitations relating to the unclear scoring criteria especially between the MP levels. This requires future researchers to clarify the descriptions in detail for each skill so that the test questions will be designed to be consistent to the students’ MP level while they are developing an assessment framework. Besides, future researchers have to take into consideration the influence of raters in terms of their consistency in assessing the students’ diagnostic tests before analyzing the data. Multidimensional Item Response Theory (MIRT) that used in this research needs to span the range of item difficulties for accurate estimation of the item parameters. Therefore, researchers would like to suggest to future researchers to use a nonrandom sample so that the estimated parameters could later to cover the whole range of different MP levels from the lowest level (logit ≤ -3) to the highest level (logit ≥ +3) (Baker & Kim, 2017; DeMars, 2010).
Although the digital technology can be accessed freely as web-based resources and compatibility with multiple sequences and approaches, the results revealed that the process system component still has problems estimating students’ MP because of the complexity of the algorithm which is a psychometric model. Besides, Adam et al.’s (1997) MRCMLM model were used in this process system component that allowing for the specification of a large number of multidimensional item response models (Draney & Wilson, 2010) because MRCMLM is a general and flexible model. As a result, this model uses design matrices to specify the relationship between responses to the items and structural parameters for a given measurement situation.
In addition, the diagnostic report component of digital technology is beneficial for teachers and students because it allows teachers to post assignments for students and dedicates an online brainstorming session for students at the same time. This has been supported by the experts in their evaluation of digital technology’s suitability aspect. On top of that, it is a real-time tool in assisting teachers to view their students’ feedback on the assessment items (Hwang & Chang, 2011). However, digital technology cannot allow teachers to interact with their peers to provide feedback on the tasks at hand. Consequently, researchers needed to develop multiple ways to provide feedback and apply a formative strategy to create web-based learning as a future step to overcome the current shortcoming. This type of web-based formative assessment has been recognized as an effective approach to assist students to identify learning flaws and thus trigger their motivation for active learning. This enables students to understand the learning content effectively. This argument is supported by past researchers such as

jel.ccsenet.org Journal of Education and Learning Vol. 8, No. 6; 2019
100
Confrey and Maloney (2015), Cowie and Sakui (2015), Ketterlin-Geller and Yovanoff (2009), and Faber et al. (2017).
Researchers would like to suggest to the Ministry of Education to conduct training for mathematics teachers so that they can utilize the progress maps to measure and the digital technology to diagnose their students’ learning problems. Ultimately, the progress maps of the digital technology will assist them to diagnose their students’ multidimensional MP and improve their MP level as well.
Acknowledgments
The research and development activities that discussed in this article were supported by the grant from Thailand Research Fund (TRF) Advanced Research Scholar and Khon Kaen University, Thailand (Grant No: RSA6080074). The researchers would like to thank Center for Research in Mathematics Education (CRME), Faculty of Education, Khon Kaen University for providing the supports to make the research a success.
References
Adams, R. J., Wilson, M., & Wang, W. (1997). The multidimensional random coefficient multinomial logit model. Applied Psychological Measurement, 21, 1–23. https://doi.org/10.1177/0146621697211001
Baker, F. B., & Kim, S.-H. (2017). The Basics of Item Response Theory Using R. Cham, Switzerland: Springer International. https://doi.org/10.1007/978-3-319-54205-8
Briggs, J. B., & Collis, K. (1982). Evaluating the quality of learning: The SOLO taxonomy. New York, NY: Academic Press.
Chanayota, K., & Junpeng, P. (2016). Assessing mathematical reasoning skills in the Theorem Pythagorean topic to Grade 5 students of Thailand. Research report. Khon Kaen, Thailand: Khon Kaen University Press.
Confrey, J., & Maloney, A. (2015). A design research study of a curriculum and diagnostic assessment system for a learning trajectory on equipartitioning. The International Journal on Mathematics Education, 47(6). https://doi.org/10.1007/s11858-015-0699-y
Cowie, N., & Sakui, K. (2015). Assessment and E-learning: Current issues and future trends. JALT CALL Journal, 11(3), 271–281.
Custer, M. (2015). Sample size and item parameter estimation precision when utilizing the one-parameter “Rasch” model. Paper presented at the annual meeting of the mid-western Educational Research Association, Evanston, Illinois, 21–24 October 2015.
DeMars, C. (2010). Item Response Theory: Understanding Statistics Measurement. Oxford, UK: Oxford University Press. https://doi.org/10.1093/acprof:oso/9780195377033.001.0001
Draney, K., & Wilson, M. (2010). Selecting cut scores with a composite of item types: The construct of mapping procedure. Journal of Applied Measurement, 12, 298–309.
Drasgow, F. (Ed). (2016). Technology and testing: Improving educational and psychological measurement. New York, NY: Routledge. https://doi.org/10.4324/9781315871493
Embretson, S. E., & Reise, S. P. (2000). Multivariate Applications Books Series. Item response theory for psychologists. Mahwah, NJ, US: Lawrence Erlbaum Associates Publishers.
Faber, J. M., Luyten, H., & Visscher, A. J. (2017). The effects of a digital formative assessment tool on mathematics achievement and student motivation: Results of a randomized experiment. Computers & Education, 106, 83–96. https://doi.org/10.1016/j.compedu.2016.12.001
Gane, B. D., Zaidi, S. Z., & Pellegrino, J. W. (2018). Measuring what matters: Using technology to assess multidimensional learning. European Journal of Education, 53, 176–187. https://doi.org/10.1111/ejed.12269
Huang, Y-M., Huang, S-H., & Wu, T-T. (2014). Enbedding diagnostics mechanisms in a digital game for learning mathematics. Education Technology Research and Development, 62, 187–207. https://doi.org/10.1007/s11423-013-9315-4
Hwang, G-J., & Chang, H-F. (2011). A formative assessment-based mobile learning approach to improving the learning attitudes and achievements of students. Computers & Education, 56, 1023–1031. https://doi.org/10.1016/j.compedu.2010.12.002
Jiang, S., Wang, C., & Weiss, D. J. (2016). Sample size requirements for estimation of item parameters in the Multidimensional Graded Response Model. Frontiers in Psychology, 7, 109.
jel.ccsenet.org Journal of Education and Learning Vol. 8, No. 6; 2019
101
https://doi.org/10.3389/fpsyg.2016.00109
Junpeng, P., Inprasitha, M., & Wilson, M. (2018). Modeling of the open-ended items for assessing multiple proficiencies in mathematical problem solving. The Turkish Online Journal of Educational Technology, 2(Special Issue for INTE-ITICAM-IDEC), 142–149.
Kanjanawasi, S. (2011). New theory of testing (3rd ed.). Bangkok, Thailand: Printing House Chulalongkorn University.
Ketterlin-Geller, L. R., & Yovanoff, P. (2009). Diagnostic assessment in mathematics to support instructional decision making. Practical Assessment, Research & Evaluation, 14(16). Retrieved from http://pareonline.net/getvn.asp?v=14&n=16
Masters, G. N. (1982). A Rasch model for partial credit scoring. Psychometrika, 47, 149–174. https://doi.org/10.1007/BF02296272
Ministry of Education. (2008). Basic education core curriculum B.E. 2551 (A.D. 2008). Bangkok, Thailand: Kurusapa Ladprao.
National Research Council. (2001). Adding it up: Helping children learn mathematics. In J. Kilpatrick, J. Swafford & B. Findell (Eds.), Mathematics Learning Study Committee, Center for Education, Division of Behavioral and Social Sciences and Education. Washington, DC: National Academy Press.
Newman, D. (2017). Top 6 digital transformation trends in education. Retrieved from https://www.forbes.com/sites/danielnewman/2017/07/18/top-6-digital-transformation-trends-in-education/#3716146f2a9
O’Brien, C. (n. d.). How to bring digital transformation to education. Retrieved from https://digitalmarketinginstitute.com/blog/how-to-bring-digital-transformation-to-education
OECD. (2016). PISA 2015 Results (Volume 1: Excellence and equity in education). Paris, France: OECD Publishing. https://doi.org/10.1787/9789264266490-en
Papadakis, S., Kalogiannakis, M., & Zaranis, N. (2018). The effectiveness of computer and tablet assisted intervention in early childhood students’ understanding of numbers. An empirical study conducted in Greece. Education and Information Technologies, 23(5), 1849–1871. https://doi.org/10.1007/s10639-018-9693-7
Rasch, G. (1960). Probabilistic models for some intelligence and attainment tests. Chicago, IL: The University of Chicago Press.
Redecker, C., & Johannessen, O. (2014). Changing assessment – towards a new assessment. European Journal of Education, 48(1), 79–96. https://doi.org/10.1111/ejed.12018
Reeves, T. C. (2006). Design research from a technology perspective. In J. van den Akker, K. Gravemeijer, S. McKenney & N. Nieveen (Eds.), Educational design research (pp. 52–66). London, UK: Routledge Sharples.
Shute, V., & Underwood, J. (2006). Diagnostic assessment in mathematics problem solving. Technology, Instruction, Cognition and Learning, 3, 151–166.
Watson, A., & Ohtani, M. (Eds.). (2015). Task design in mathematics education: An ICMI Study 22. Heidelberg, Germany: Springer. https://doi.org/10.1007/978-3-319-09629-2
Wilson, M. (2005). Constructing measures: An item response modeling approach. Mahwah, NJ: Lawrence Erlbaum Assoc. https://doi.org/10.4324/9781410611697
Wilson, M., & Adams, R. J. (1995). Rasch models for item bundles. Psychometrika, 60, 181–198. https://doi.org/10.1007/BF02301412
Wilson, M., & Sloane, K. (2000). From principles to practice: An embedded assessment system. Applied Measurement in Education, 13(2), 181–208. https://doi.org/10.1207/S15324818AME1302_4
Wu, M. L., Adams, R. J., Wilson, M. R., & Haldane, S. A. (2007). ACERConQuest Version 2: Generalized item response modeling software. Camberwell: Australian Council for Educational Research.

jel.ccsenet.org Journal of Education and Learning Vol. 8, No. 6; 2019
102
Copyrights
Copyright for this article is retained by the author, with first publication rights granted to the journal.
This is an open-access article distributed under the terms and conditions of the Creative Commons Attribution license (http://creativecommons.org/licenses/by/4.0/).