consortium for electric reliability … · the electricity advisory board’s subcommittee report...
TRANSCRIPT
CONSORTIUM FOR ELECTRIC RELIABILITY
TECHNOLOGY SOLUTIONS (CERTS)
U.S. Department of Energy
Transmission Bottleneck Project Report
March 19, 2003
Prepared by
Jim Dyer
Electric Power Group

Page 2
DOE TRANSMISSION BOTTLENECK PROJECT REPORT
TABLE OF CONTENTS
Executive Summary……………………………………………………………..5 Section 1: Introduction…………………………………………………….…...18 Section 2: Background and Definition…………………………………….…...19 Section 3: Study Methodology..……………………………………………..…21 Section 4: Results of CERTS’ Survey of Independent System Operators
Ø CAISO……………………………………………..…………..21 Ø ERCOT………………………………………………..……….29 Ø MISO…………………………………………………………..36 Ø NYISO…………………………………………………………45 Ø ISO-NE…………………………………………………….…..56 Ø PJM…………………………………………………………….64
Section 5: Summary of Bottleneck Information from Related Organizations
Ø Federal Energy Regulatory Commission…………………..…..71 Ø Western Governors’ Association……………………….……...76 Ø North American Electric Reliability Council……………..…...84 Ø Edison Electric Institute……………………………….…….…90
Section 6: Summary of Key Findings…………………………………….……93 Section 7: Bottlenecks Identified – Sorting and Prioritization………….….…..94 . Section 8: References……………………………………………….………….98
Page 3
List of Acronyms AC alternating current ATC available transmission capacity CAISO California Independent System Operator CSC Commercially Significant Constraint COI California - Oregon Interconnection DC direct current DSM demand-side management ECAR East Central Area Reliability (Coordination Agreement) EEI Edison Electric Institute EHV extra high voltage ERCOT Electric Reliability Council of Texas FERC Federal Energy Regulatory Commission HVDC high voltage direct current IPP independent power producer ISO independent system operator ISO-NE Independent System Operator, New England LE London Economics LMP locational marginal pricing LRP load response program MAIN Mid-America Interconnected Network MAPP Mid-Continent Area Power Pool MISO Midwest Independent System Operator MVAR megavar MW megawatt MWh megawatt hour NCPC Net Commitment Period Compensation NEMA northeastern Massachusetts NEPOOL New England Power Pool NERC North American Electric Reliability Council NOB Nevada – Oregon Border NOR Norwalk/Stamford NPCC Northeast Power Coordinating Council NY New York NYCA New York Control Area NYISO New York Independent System Operator PAC Planning Advisory Committee PJM PJM Interconnection, LLC PTO Participating Transmission Owner PSC Public Service Commission PSEG Public Service Electric and Gas Company PUCT Public Utilities Commission of Texas RAS Reliability Assessment Subcommittee of NERC RFP request for proposals RI Rhode Island
Page 4
RNA Restated NEPOOL Agreement RTEP Regional Transmission Expansion Plan RTO Regional Transmission Organization SEMA southeastern Massachusetts SENY southeast New York SMD Standard Market Design SPP Southwest Power Pool SVC static var compensator SWCT southwestern Connecticut TAC Technical Advisory Committee TEAC Transmission Expansion Advisory Committee TFSS Task Force on System Studies TO transmission owner TLR transmission loading relief UPNY upstate New York TVA Tennessee Valley Authority VAR Volt ampere reactive, a measure of reactive power WECC Western Electricity Coordinating Council WGA Western Governors’ Association
EXECUTIVE SUMMARY Introduction The U.S. Department of Energy (DOE) National Transmission Grid Study (DOE 2002) determined that congestion in the U.S. electricity transmission system places daily constraints on electricity trade, increasing both electricity costs to consumers and impacts reliable operations. In an effort to support DOE’s investigation of transmission bottlenecks, the Consortium for Electric Reliability Technology Solutions (CERTS) surveyed the current state of transmission congestion around the nation. This report describes the study findings, which are based on interviews and discussions with the nation’s six established ISO/RTOs – the California ISO, the New York ISO, the Midwest ISO, ISO New England, the Electric Reliability Council of Texas, and the PJM Interconnection. In addition, this report summarizes information on bottlenecks gathered from other sources, including the Federal Energy Regulatory Commission, the Western Governors’ Association, the North American Electric Reliability Council, and the Edison Electric Institute. To address the problems of transmission congestion, the Secretary of Energy chartered an Electricity Advisory Board, which established the Transmission Grid Solution Subcommittee. A report (Transmission Grid Solutions Report September 2002) prepared by this subcommittee highlights the importance of eliminating transmission grid bottlenecks and calls for:
Ø DOE to identify “National Interest Transmission Bottlenecks”
that need to be relieved by construction of new facilities to upgrade or expand the transmission grid,
Ø Congress to enact legislation that would provide FERC with
“backstop” authority to approve applications to site “National Interest Transmission Facilities” to relieve DOE-identified bottlenecks, and
Ø The formation of RTOs to facilitate grid expansion and to
improve the operation of competitive wholesale electricity markets.
The Electricity Advisory Board’s Subcommittee report defines transmission bottlenecks as follows: “Bottlenecks occur when the system is constrained such that it cannot accommodate the flow of electricity and systematically inhibits transactions. Thus, a bottleneck has economic and/or reliability impacts.” The report also reminds us that solving one reliability limit will just cause the next most limiting element to show up and therefore, we must look at these limits as “system” limits needing “system” solutions.

Page 6
Causes and Impacts of Bottlenecks The Key Impacts of Bottlenecks are impairment of security, reduction of transmission capability, foregone market transactions and reduced reliability. Bottlenecks may be present under normal operating conditions or as a result of equipment failures and system disturbance conditions.
• Physical Security of the Electricity System – Vulnerable infrastructure elements or critical facilities whose loss or impairment would substantially reduce the transmission of electricity into or out of key load or resource centers.
• Reliability – Criteria established by North American Electric Reliability
Council (NERC), Regional Reliability Council, or local jurisdiction (state or ISO) limit transmission capability due to:
- Stability Limits – Anticipated power flows after a contingency in the
list of specified contingencies would exceed stability limit, resulting in an unstable power system.
- Thermal Limits – Anticipated power flows after a contingency would
exceed the thermal limit of a line or a component of the network (e.g., a transformer).
- Voltage Collapse – Anticipated power flows after an event would
create a reactive demand that would exceed the local reactive resources, resulting in rapid voltage decay.
- Loop Flow – Unscheduled power flows on lines or facilities that result
in a violation of reliability criteria.
- Resource Deficiency – Installed capacity levels are inadequate to support the load demand.
• Market Economics – Bottlenecks prevent efficient/lower cost generating
resources from serving the customers. Examples include:
- Implementations of transmission loading relief procedures (TLRs) in the Eastern Interconnections that result in reduction or termination of energy transactions.
- Inability of Southern California resources to compete for Northern
California load (congestion on California Path 15 in a south-to-north direction)
Page 7
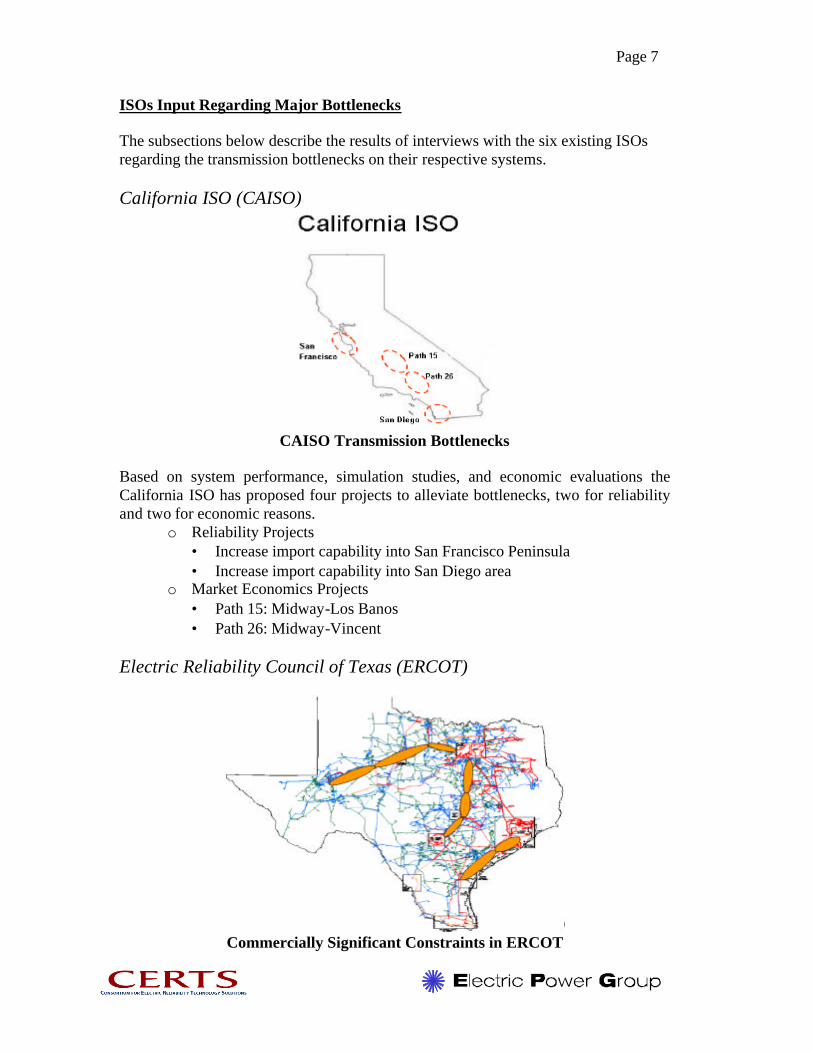
ISOs Input Regarding Major Bottlenecks The subsections below describe the results of interviews with the six existing ISOs regarding the transmission bottlenecks on their respective systems. California ISO (CAISO)
CAISO Transmission Bottlenecks
Based on system performance, simulation studies, and economic evaluations the California ISO has proposed four projects to alleviate bottlenecks, two for reliability and two for economic reasons.
o Reliability Projects • Increase import capability into San Francisco Peninsula • Increase import capability into San Diego area
o Market Economics Projects • Path 15: Midway-Los Banos • Path 26: Midway-Vincent
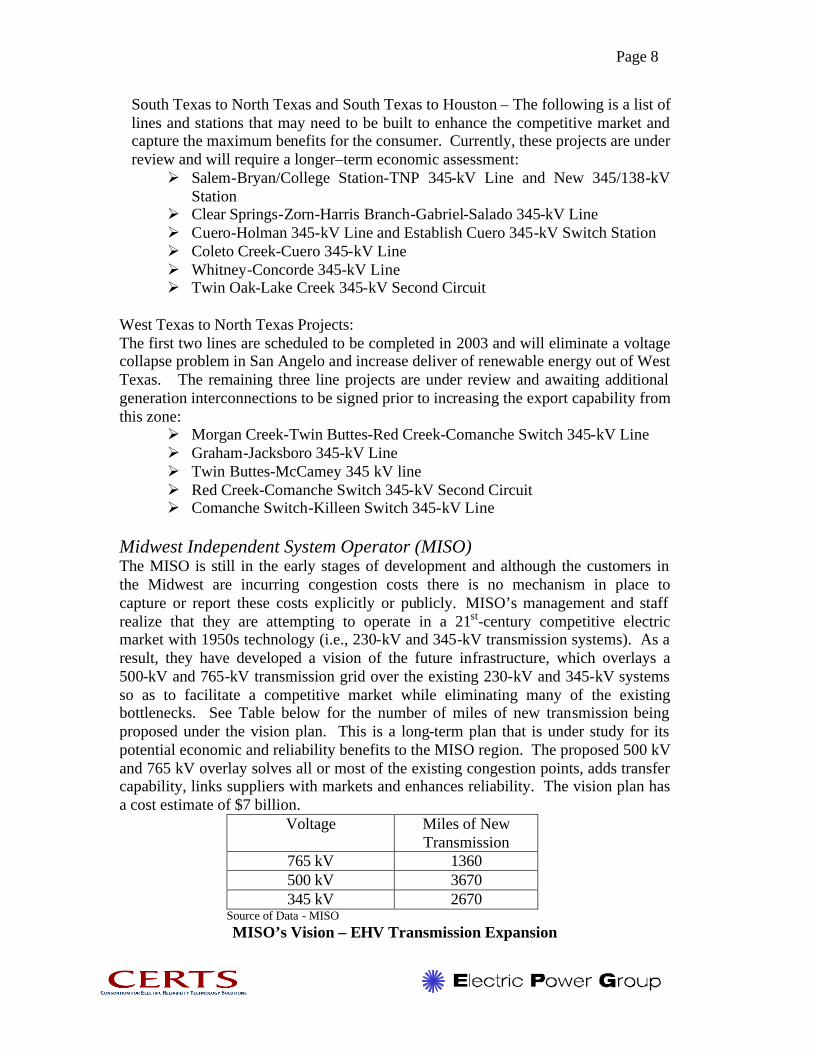
Electric Reliability Council of Texas (ERCOT)
Commercially Significant Constraints in ERCOT
Page 8
South Texas to North Texas and South Texas to Houston – The following is a list of lines and stations that may need to be built to enhance the competitive market and capture the maximum benefits for the consumer. Currently, these projects are under review and will require a longer–term economic assessment:
Ø Salem-Bryan/College Station-TNP 345-kV Line and New 345/138-kV Station
Ø Clear Springs-Zorn-Harris Branch-Gabriel-Salado 345-kV Line Ø Cuero-Holman 345-kV Line and Establish Cuero 345-kV Switch Station Ø Coleto Creek-Cuero 345-kV Line Ø Whitney-Concorde 345-kV Line Ø Twin Oak-Lake Creek 345-kV Second Circuit
West Texas to North Texas Projects: The first two lines are scheduled to be completed in 2003 and will eliminate a voltage collapse problem in San Angelo and increase deliver of renewable energy out of West Texas. The remaining three line projects are under review and awaiting additional generation interconnections to be signed prior to increasing the export capability from this zone:
Ø Morgan Creek-Twin Buttes-Red Creek-Comanche Switch 345-kV Line Ø Graham-Jacksboro 345-kV Line Ø Twin Buttes-McCamey 345 kV line Ø Red Creek-Comanche Switch 345-kV Second Circuit Ø Comanche Switch-Killeen Switch 345-kV Line
Midwest Independent System Operator (MISO) The MISO is still in the early stages of development and although the customers in the Midwest are incurring congestion costs there is no mechanism in place to capture or report these costs explicitly or publicly. MISO’s management and staff realize that they are attempting to operate in a 21st-century competitive electric market with 1950s technology (i.e., 230-kV and 345-kV transmission systems). As a result, they have developed a vision of the future infrastructure, which overlays a 500-kV and 765-kV transmission grid over the existing 230-kV and 345-kV systems so as to facilitate a competitive market while eliminating many of the existing bottlenecks. See Table below for the number of miles of new transmission being proposed under the vision plan. This is a long-term plan that is under study for its potential economic and reliability benefits to the MISO region. The proposed 500 kV and 765 kV overlay solves all or most of the existing congestion points, adds transfer capability, links suppliers with markets and enhances reliability. The vision plan has a cost estimate of $7 billion.
Voltage Miles of New Transmission
765 kV 1360 500 kV 3670 345 kV 2670
Source of Data - MISO MISO’s Vision – EHV Transmission Expansion

Page 9
MISO’s Vision – Regional EHV Transmission Expansion
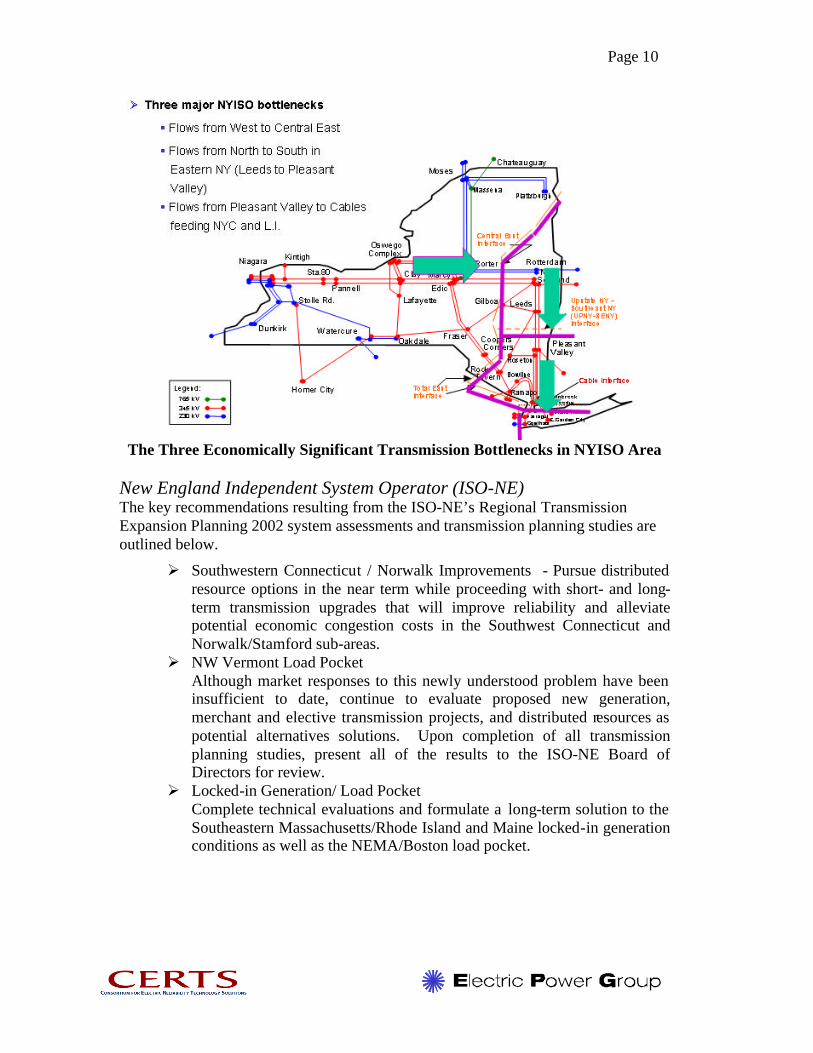
New York Independent System Operator – NYISO Critical economic bottlenecks in the NYISO control area are a result of flows from west to east and flows from upstate into the New York City and Long Island areas. At this time, there are ongoing studies looking at options, discussions with stakeholders, but there are no active projects to resolve or mitigate the existing upstate bottlenecks. NY’s congestion costs should decline as more capacity is added within the congested areas and merchant transmission facilities in the form of HVDC ties are constructed between the NY control area and neighboring control areas.
Page 10
The Three Economically Significant Transmission Bottlenecks in NYISO Area
New England Independent System Operator (ISO-NE) The key recommendations resulting from the ISO-NE’s Regional Transmission Expansion Planning 2002 system assessments and transmission planning studies are outlined below.
Ø Southwestern Connecticut / Norwalk Improvements - Pursue distributed resource options in the near term while proceeding with short- and long-term transmission upgrades that will improve reliability and alleviate potential economic congestion costs in the Southwest Connecticut and Norwalk/Stamford sub-areas.
Ø NW Vermont Load Pocket Although market responses to this newly understood problem have been insufficient to date, continue to evaluate proposed new generation, merchant and elective transmission projects, and distributed resources as potential alternatives solutions. Upon completion of all transmission planning studies, present all of the results to the ISO-NE Board of Directors for review.
Ø Locked-in Generation/ Load Pocket Complete technical evaluations and formulate a long-term solution to the Southeastern Massachusetts/Rhode Island and Maine locked-in generation conditions as well as the NEMA/Boston load pocket.
Page 11
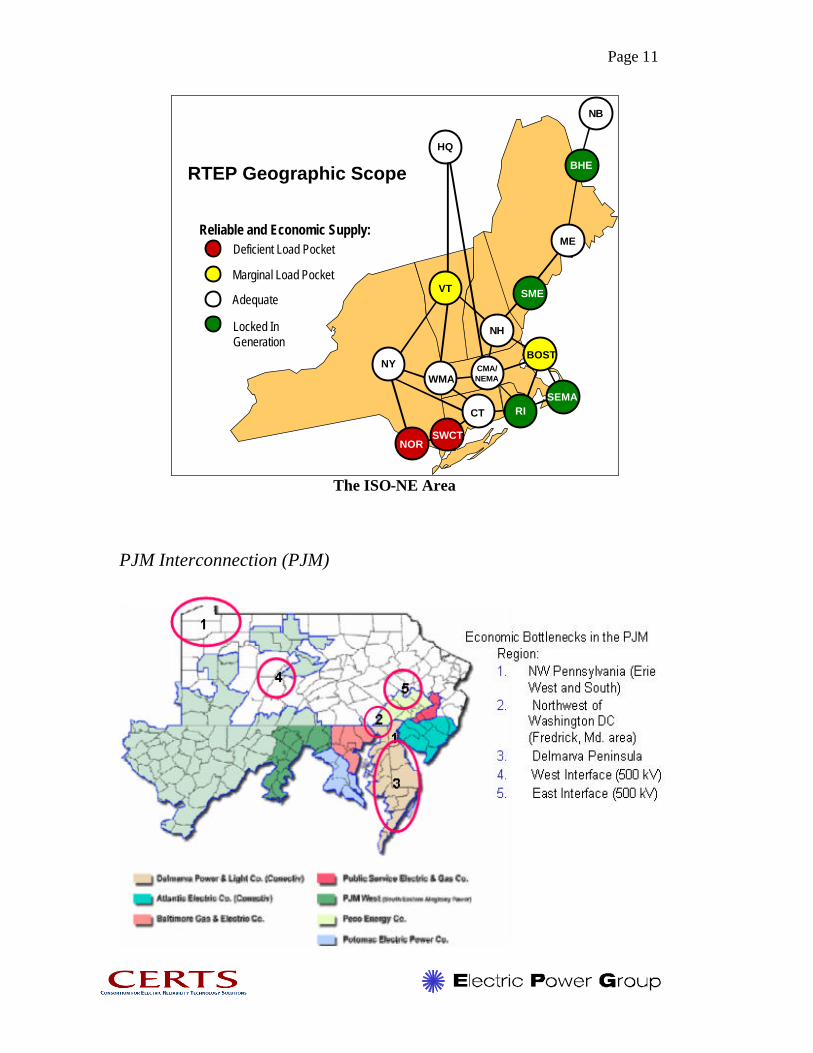
RTEP Geographic Scope
HQ
SEMARI
NORSWCT
BHE
ME
NB
BOST
NH
SME
CMA/NEMA
Adequate
Locked InGeneration
Marginal Load Pocket
Deficient Load PocketReliable and Economic Supply:
WMA
VT
NY
CT
The ISO-NE Area
PJM Interconnection (PJM)

Page 12
Congestion vs. Investment Transmission congestion between 1998 and 1999 was up 40 percent and between 1999 and 2000, it was up 140 percent. Moreover, transmission investments have been declining for almost 25 years at an average rate of $120 million per year. The investment in transmission during 1999 was less than half of what it had been 20 years earlier.
Figure – Transmission Congestion (NERC TLRs)
Figure – Transmission Investment1
1 Eric Hirst and Brendan Kirby “Transmission Planning for a Restructured U.S. Electric Industry”, prepared for Edison Electric Institute June 2001

Page 13
Congestion a Moving Target As indicated in the Figure on the next page, the locations of transmission congestion can and will vary for different reasons, such as temperature differences between regions, time of day and the season of the year. In the Figure it can be observed the locations of congestion during the summer and winter of 2000 was different from the locations during the same period in 2001. Example – Summer 2000, the upper Midwest was cooler than normal. The South was hot and humid with higher natural gas prices, low cost energy from the Midwest coal fired resources tried to flow south to meet demands created congestion from north to south along ECAR and MAIN. Summer 2001 saw a return to more normal temperatures and congestion flowed from south to north and west to east directions, localizing the congestion along the boundary between the MAPP and MAIN region as well as the eastern boundary of ECAR with the SERC region.
Summary of Key Findings The challenges and issues the ISO Planning staff face are very similar throughout the nation. The following were the key findings that resulted from the site visits and interviews with the ISOs management and staff:

Page 14
Ø ISOs have the technical tools and ability to identify current and future
transmission reliability criteria deficiencies and develop solutions to address bottlenecks through upgrades, new lines, and remedial actions schemes.
Ø ISO’s have the ability to identify the current economically significant bottlenecks; however, these tend to shift around based on market conditions.
Ø Transmission bottlenecks are more acute during extended peak demands, large resource outages, major construction projects, high fuel differential costs between regions and other market conditions.
Ø The ISO’s are challenged when asked to develop a business case justifying a market economics project and lack the necessary market models to adequately forecast and “prove” their need.
Ø Transforming the transmission network from the historical vertically integrated design to an open competitive network that facilitates large regional power transfers may have a significant price tag and there are no established processes for reviewing and getting approvals to build such facilities.
Ø ISO transmission expansion plans are shared with market participants for the purpose of attracting alternate solutions (i.e., generation, load response).
Ø Generation interconnection projects dominate the transmission planning process.
Ø The inter-ISO transmission projects under serious review or development are DC lines and they are being driven by merchant transmission interests:
• Cross Sound (NY-NE), Neptune (PJM-NY), Lake Erie Link (PJM-Canada) and Harbor Cable (PJM-NY)
Ø Regulatory approval process, especially for multi-state projects, is long and consequently may be very uncertain.
Ø Uncertainty about cost recovery and regulatory treatment provides a disincentive for Transmission Owners to do anything more than reliability projects.
Ø There is a disconnect between who pays for new transmission vs. who benefits – the customers of the local transmission owner could be straddled with the costs of fixing bottlenecks while those benefiting may be located several states away.
Ø A market design that does not include LMP creates disincentives in many cases – congestion costs added to uplift are spread over all users of transmission.
Ø The minimum interconnection standard for new generators does not ensure deliverability and as a result it creates stranded generation pockets, does not address regional adequacy issues and puts the planning process in a reactionary mode.
Page 15
Ø Generation solutions have shorter lead times versus those for transmission projects and can provide a quicker fix to many bottlenecks, but recent generation project cancellations around the nation are creating challenges for the grid planners and eventually customers.
Ø There is limited data available on planned new generation projects to support ISO long term planning studies.
Ø Among the six ISOs there is not a common definition or method of monitoring and tracking congestion.
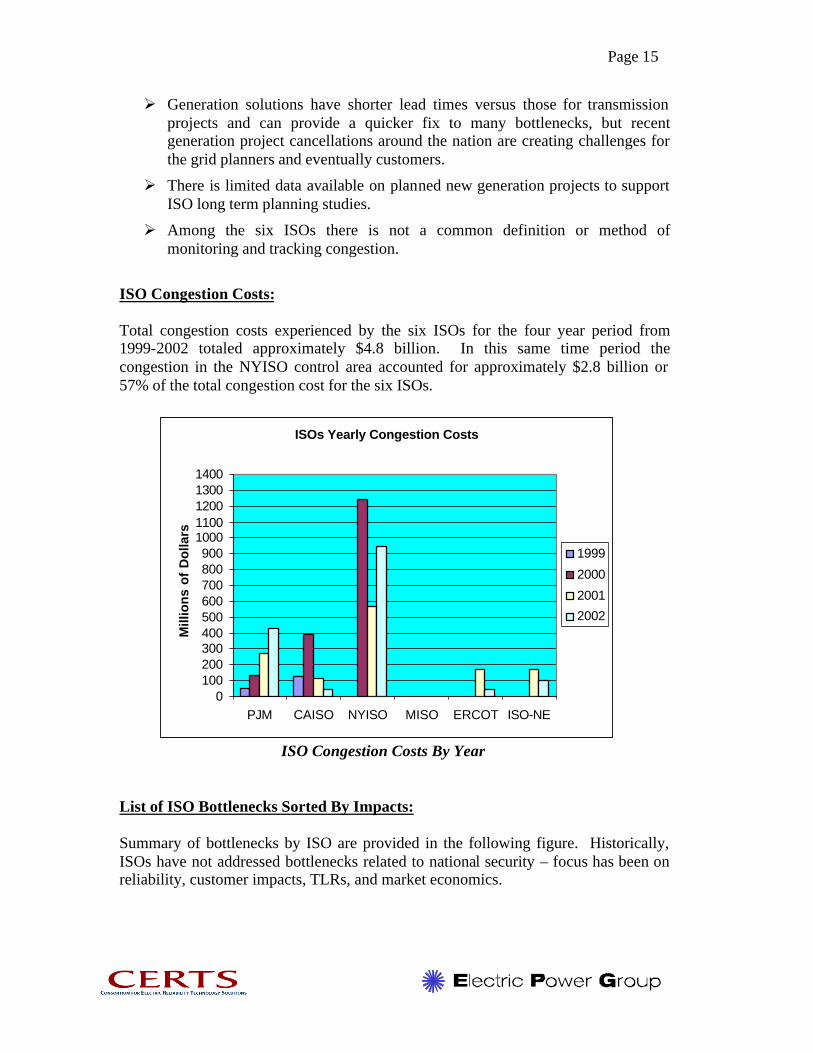
ISO Congestion Costs: Total congestion costs experienced by the six ISOs for the four year period from 1999-2002 totaled approximately $4.8 billion. In this same time period the congestion in the NYISO control area accounted for approximately $2.8 billion or 57% of the total congestion cost for the six ISOs.
ISOs Yearly Congestion Costs
0100200300400500600700800900
10001100120013001400
PJM CAISO NYISO MISO ERCOT ISO-NE
Mill
ion
s o
f D
olla
rs
1999
2000
2001
2002
ISO Congestion Costs By Year
List of ISO Bottlenecks Sorted By Impacts: Summary of bottlenecks by ISO are provided in the following figure. Historically, ISOs have not addressed bottlenecks related to national security – focus has been on reliability, customer impacts, TLRs, and market economics.

Page 16
List of ISO Bottlenecks Sorted By Priority: Based on the information received during the interview process, impacts the bottlenecks have on reliability and markets and the cost data the priority for addressing the ISOs bottlenecks are as indicated in the Table below:
Priority ISO Comment 1 NYISO Congestion costs over a three year period
are averaging in excess of $900 million per year.
2 ISO-NE Load is at risk
3 CAISO California has two significant load pockets that are forecasted to be in violation or reliability criteria and a path that has inhibited transactions between
Page 17
the northern and southern portions of the state.
4 PJM PJM’s congestion costs continue a four year trend of almost doubling each year, but the majority of 2002 increase is a result of adding PJM West to its market.
5 MISO At this time, the true congestion costs are unknown. The region will have difficulty operating an efficient market with the limited EVH infrastructure.
6 ERCOT ERCOT will need to expand its transfer capability to accommodate new generation and achieve market efficiency.
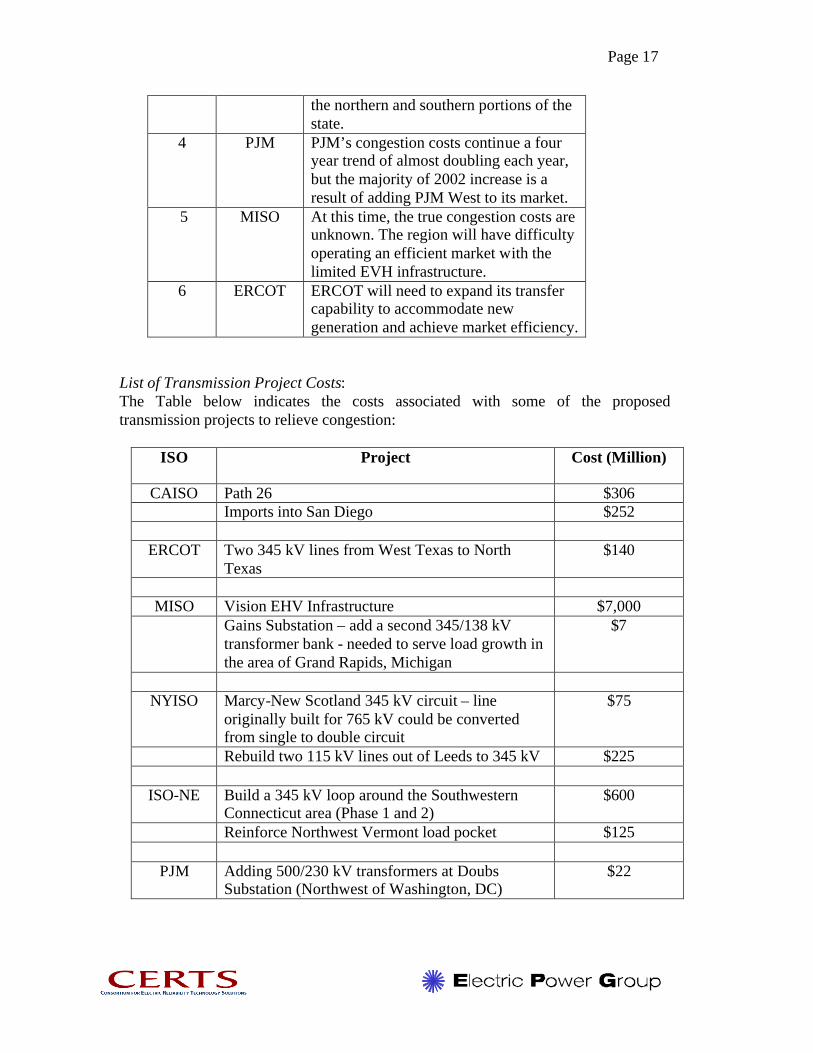
List of Transmission Project Costs: The Table below indicates the costs associated with some of the proposed transmission projects to relieve congestion:
ISO Project Cost (Million)
CAISO Path 26 $306 Imports into San Diego $252
ERCOT Two 345 kV lines from West Texas to North Texas
$140
MISO Vision EHV Infrastructure $7,000
Gains Substation – add a second 345/138 kV transformer bank - needed to serve load growth in the area of Grand Rapids, Michigan
$7
NYISO Marcy-New Scotland 345 kV circuit – line
originally built for 765 kV could be converted from single to double circuit
$75
Rebuild two 115 kV lines out of Leeds to 345 kV $225
ISO-NE Build a 345 kV loop around the Southwestern Connecticut area (Phase 1 and 2)
$600
Reinforce Northwest Vermont load pocket $125
PJM Adding 500/230 kV transformers at Doubs Substation (Northwest of Washington, DC)
$22
Page 18
1. Introduction
The U.S. Department of Energy (DOE) National Transmission Grid Study (DOE 2002) determined that congestion in the U.S. electricity transmission system places daily constraints on electricity trade, increasing both electricity costs to consumers and the risk of blackouts. In an effort to support DOE’s investigation of transmission bottlenecks that affect the national interest, the Consortium for Electric Reliability Technology Solutions (CERTS) surveyed the current state of transmission congestion around the nation. The goals of CERTS’ study were to: Ø Assess transmission operations and planning at the nation’s Independent
System Operators/Regional Transmission Organizations (ISOs/RTOs) Ø Using available data, quantify the impacts of transmission congestion on
operations and economics Ø Identify the impact(s) of the transmission bottlenecks and rank the regions
in order of priority requiring action. This report describes the study findings, which are based on interviews and discussions with the nation’s six ISOs – the California ISO (CAISO), the New York ISO (NYISO), the Midwest ISO (MISO), ISO New England (ISO-NE), the Electric Reliability Council of Texas (ERCOT), and the PJM Interconnection (PJM). In addition, this report summarizes the information on bottlenecks gathered from other sources including the Federal Energy Regulatory Commission (FERC), the Western Governors’ Association (WGA), the North American Electric Reliability Council (NERC), and the Edison Electric Institute (EEI).
Discussions with the ISOs focused on the following key issues:
• Definition(s) of transmission bottlenecks used by each ISO • Impacts of transmission congestion on operations, types of problems
caused by congestion (i.e., inability to import, export, use of higher priced resources, serve load), and timing of congestion (i.e., seasonal, annual peak, on peak, off peak)
• Historical pattern and trends of congestion costs • Facility limitations or condition that is creating congestion (i.e. line(s),
equipment, stability) • Transmission modifications required to eliminate or mitigate
congestion issues • Transmission planning methods and processes, including coordination
process with directly connected control areas and ISOs as well as regional planning activity
This report presents the findings of the CERTS study as follows: Section 2 – background on and definition of transmission bottlenecks Section 3 – summary of CERTS study methodology Section 4 – results of CERTS’ survey of ISOs
Page 19
Section 5 – summary of bottleneck information from ISOs and other related organizations
Section 6 – key findings Section 7 – prioritizing transmission bottlenecks identified in this study based on the
priority of required action Section 8 – references 2. Background and Definition
The National Transmission Grid Study, prepared by the U.S. Department of Energy (DOE) and presented to the President in May 2002, describes the formation of the U.S. electricity transmission system by vertically integrated utilities that historically produced and transmitted electricity to meet local demand. Interconnections between neighboring utilities were constructed to increase system reliability and share the economics of excess or low cost generation. The transmission system is an extensive, interconnected network of high-voltage power lines specifically designed to transport electricity from remote generators to meet the demand of the utilities customers. The introduction of competition in wholesale electricity markets during the past decade has called upon the transmission system to accommodate flows of electricity for which it was not designed. The result has been congestion in the system. According to a recent DOE independent assessment of the transmission system, it was found that interregional transmission congestion costs consumers hundreds of millions of dollars annually, even though wholesale electricity markets have lowered consumers’ electricity bills by nearly $13 billion a year.
To address the problems of transmission congestion, the Secretary of Energy chartered an Electricity Advisory Board, which in turn, established the Transmission Grid Solution Subcommittee. A report (Transmission Grid Solutions Report September 2002) prepared by this Subcommittee highlights the importance of eliminating transmission grid bottlenecks and calls for: Ø DOE to identify “National Interest Transmission Bottlenecks”
that need to be relieved by construction of new facilities to upgrade or expand the transmission grid,
Ø Congress to enact legislation that would provide FERC with “backstop” authority to approve applications to site “National Interest Transmission Facilities” to relieve DOE-identified bottlenecks, and
Ø The formation of RTOs to facilitate grid expansion and to improve the operation of competitive wholesale electricity markets.
The Electricity Advisory Board’s report defines transmission bottlenecks as follows: “Bottlenecks occur when the system is constrained such that it cannot
Page 20
accommodate the flow of electricity and systematically inhibits transactions. Thus, a bottleneck has economic and/or reliability impacts.” The September 2002 report also notes that all transmission systems have an upper limit – a “reliability limit” – on their ability to transfer electricity and that bottlenecks and the methods to alleviate their impacts cannot always be straightforwardly specified:
A bottleneck is not always the inability to transfer electricity from point A to point B due to a single transmission circuit, but can be due to the inability to transfer electricity over a group of lines (sometimes called an interface or flowgate) or a system voltage or system stability limit that occurs at a given level of electricity transfer. Therefore, relieving a ‘bottleneck’ may involve more than just replacing or upgrading one facility. In some cases, it may not even involve a transmission line at all, but rather the addition of voltage support equipment (capacitors or static var compensators), local generation or stability enhancing devices, such as power system stabilizers on generating units. Even after an identified reliability limit is relieved, another facility or group of facilities will show up as the next higher reliability limit. As such, the reliability limits to the transfer of electricity should be thought of as ‘system’ reliability limits that require a ‘system’ solution, not just the upgrade or replacement of one facility.
The Key Impacts of Bottlenecks: Bottlenecks may be present under normal operating conditions, a result of equipment failures or system disturbance and/or peak system demands.
• Physical Security of the Electricity System – Vulnerable infrastructure
elements or critical facilities whose loss or impairment would substantially reduce the transmission of electricity into or out of key load or resource centers.
• Reliability – Criteria established by North American Electric Reliability
Council (NERC), Regional Reliability Council, or local jurisdiction (state or ISO) limit transmission capability due to:
- Stability Limits – Anticipated power flows after a contingency in the
list of specified contingencies would exceed stability limit, resulting in an unstable power system.
- Thermal Limits – Anticipated power flows after a contingency would
exceed the thermal limit of a line or a component of the network (e.g., a transformer).
Page 21
- Voltage Collapse – Anticipated power flows after an event would
create a reactive demand that would exceed the local reactive resources, resulting in rapid voltage decay.
- Loop Flow – Unscheduled power flows on lines or facilities that result
in a violation of reliability criteria.
- Resource Deficiency – Installed capacity levels are inadequate to support the load demand.
• Market Economics – Bottlenecks prevent efficient/lower cost generating
resources from serving the customers. Examples include:
- Implementations of transmission loading relief procedures (TLRs) in the Eastern Interconnections that result in reduction or termination of energy transactions.
- Inability of Southern California resources to compete for Northern
California load (congestion on California Path 15 in a south-to-north direction)
3. Study Methodology
The study described in this report comprises of three key activities:
• Review of publicly available documents from: - ISOs - FERC - Western Governors’ Association (WGA) - North American Electric Reliability Council (NERC) - Edison Electric Institute (EEI) - DOE
• Interviews with planning and operations personnel from the six ISOs (on-
site interviews were conducted for all ISOs except PJM, whose representatives were interviewed on a conference call)
• An assessment to quantify the impact of congestion on operations and
economics and a ranking of the identified transmission bottlenecks
4. Independent System Operators Survey Results The subsections below describe the results of interviews with the six ISOs surveyed for this study. Each subsection begins with a summary of key findings, followed by
Page 22
the detailed information gathered from documents provided by each ISO and the extensive interviews with ISO personnel.
4.1 California Independent System Operator (CAISO) Summary of Key Findings CAISO’s criteria for selecting transmission expansion/enhancement projects are based on system reliability (e.g., the specification of a double contingency that includes the simultaneous loss of a critical transmission line and a significant resource) and economics (cost to eliminate congestion is less than or equal to forecasted congestion cost). Transmission bottleneck projects totaling $720 million have been proposed, with two projects based on market economics (Path 15, Midway-Los Banos and Path 26, Midway-Vincent) and two based on reliability (increasing import capability to San Francisco and San Diego areas). Projects based on economics are facing an increasingly uncertain future because of regulatory uncertainty and construction cost recovery issues. For generation interconnection, the CAISO complies with FERC’s policy of only requiring the minimum reliability standard, which may result in pockets of stranded generation. CAISO currently uses zonal pricing but will shift to locational marginal pricing (LMP) in 2005. Information provided by CAISO CAISO control area includes much of the state of California. The other control areas in California are made up of the public power systems of Los Angeles and Sacramento and the Imperial Irrigation District. The CAISO provided the following information regarding transmission bottlenecks and transmission planning from its web site (www.caiso.com) and interviews with some of the CAISO staff. CAISO Grid Coordinated Planning Process [Figure 1] is a block diagram of the CAISO’s process that is used to plan future changes and additions to the grid. The URL location on the CAISO’s web site for transmission planning information is www1.caiso.com/thegrid/planning/. The following is an excerpt from the web site.
The CAISO Grid Coordinated Planning Process is flexible; projects can be generated from a variety of sources including transmission owners, CAISO, or any entity that participates in the energy marketplace by buying, selling, transmitting, or distributing energy or ancillary services into, out of, or through the CAISO-controlled grid. The participation of all of these interests in the planning process is expected to facilitate the development of projects that will result in a grid that best meets the needs of all its users and maximizes benefits to the state of California.

Page 23
The projects that will be developed through this process will fill a number of needs including:
Ø Interconnecting generation or load Ø Protecting or enhancing system reliability? Ø Improving system efficiency Ø Enhancing operating flexibility Ø Reducing or eliminating congestion Ø Minimizing the need for must-run contracts
Annual Transmission Plans – “The overall CAISO planning process relies heavily on the Participating Transmission Owners (PTOs) that filed annual transmission plans primarily for the portions of the grid that they own. These annual plans are coordinated with neighboring systems and describe the proposed facility additions over a minimum five-year planning horizon.” It is not unusual for the CAISO to expand the planning horizon to ensure long lead time projects are accounted for and there is effective coordination between mid-term and long-term planning.
Figure 1 - Flow Diagram of CAISO’s Coordinated Planning
Plans identify system concerns and evaluate the technical merits of various potential transmission, generation, and operating solutions. In conducting their analyses, the PTOs will address the needs identified by the various market

Page 24
participants. The CAISO is involved in the annual PTO planning process [see Figure 2] and the study cases and simulations developed for these annual plans will be available to CAISO and other market participants so that integrated review and independent studies can be accommodated.
Figure 2 - Flow Diagram of PTO’s Coordinated System Assessment Process Projects flow through the Western Electricity Coordinating Council (WECC) Transmission Planning Process. Once CAISO projects are identified, they will go through the WECC for coordination and integration. To the maximum extent possible, the CAISO planning process utilizes the WECC to streamline transmission planning and avoid redundancy. An additional advantage of utilizing WECC is that all transmission owners in California follow these processes whether or not they are CAISO PTOs. CAISO Review Process – All CAISO Grid projects will also undergo a CAISO review process, focused on ensuring that projects connected to the grid will meet the CAISO grid planning criteria. Assessment of many projects according to the
Page 25
grid planning criteria will have already been undertaken as part of the WECC process. In addition, concurrently with WECC’s transmission planning process, CAISO will conduct an operational review to ensure that each project meets CAISO’s needs for operational flexibility and the requirements for proper integration with the CAISO grid. Many projects will also need to be evaluated from an economic perspective to determine whether project costs make economic sense and should be incorporated into the access fee or split among directly identifiable beneficiaries. Generation interconnection – Generating resources are built to a minimum interconnection reliability standard, which does not assure deliverability. The developer has the option to pay for upgrades that will ensure deliverability. If the developer elects not to incur the added cost to ensure that their dispatch is physically feasible the CAISO will evaluate future congestion impacts. If the evaluation indicates the potential for significant congestion, the CAISO will develop an expansion project and all associated project costs will be allocated appropriately, based on assignable benefits. Construction – At the end of the planning and review process the CAISO will track construction to ensure project is completed and in service when needed.
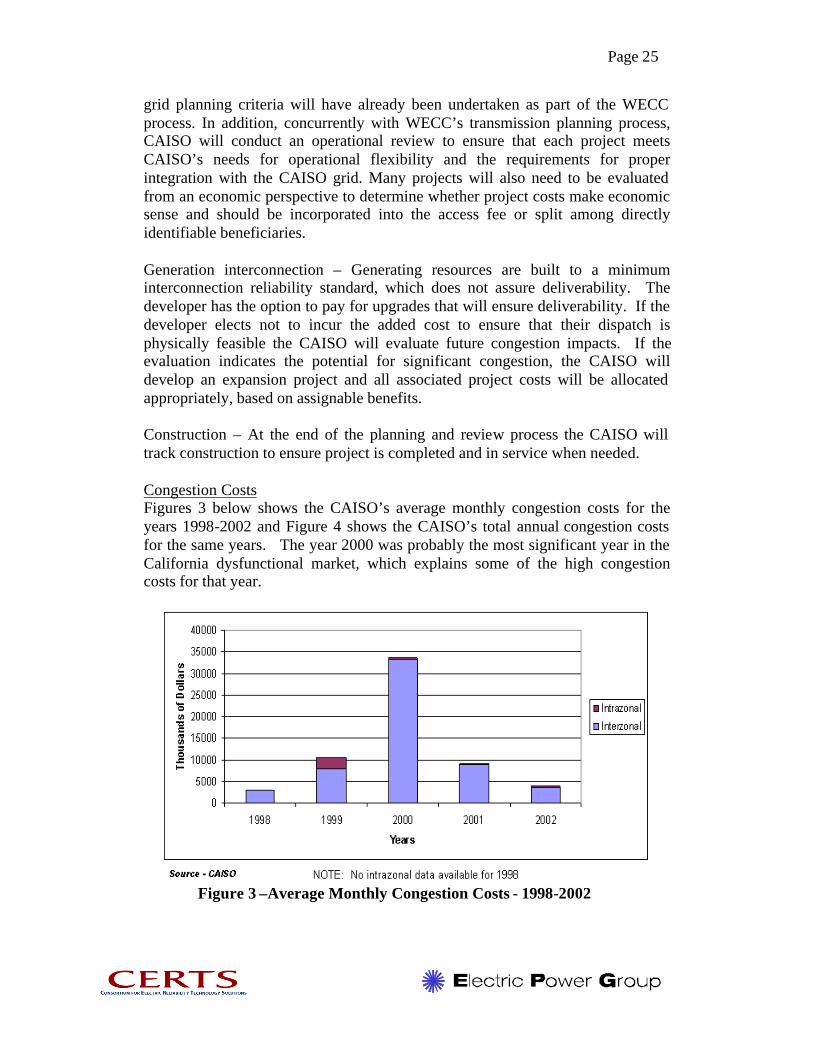
Congestion Costs Figures 3 below shows the CAISO’s average monthly congestion costs for the years 1998-2002 and Figure 4 shows the CAISO’s total annual congestion costs for the same years. The year 2000 was probably the most significant year in the California dysfunctional market, which explains some of the high congestion costs for that year.
Figure 3 –Average Monthly Congestion Costs - 1998-2002

Page 26
Figure 4 – Total Annual Congestion Costs – 1998-2002
Interview team observations based on on-site interviews with CAISO staff: Ø CAISO will be implementing LMP in 2005 or sooner.
Ø Based on system performance, simulation studies, and economic evaluations
CAISO has proposed four projects to alleviate bottlenecks, two of the projects are justified for reliability reasons and two are justified for economic reasons. Figure 5 shows CAISO bottlenecks. o Reliability Projects
• Increase import capability into San Francisco Peninsula • Increase import capability into San Diego area
o Market Economics Projects • Path 15: Midway-Los Banos • Path 26: Midway-Vincent
Ø The criterion used to determine need for the four projects:
o Planning criterion for reliability projects – The area being evaluated should be able to withstand the simultaneous loss of a critical transmission line or facility with the loss of a significant resource contingency. In the case of the San Francisco Peninsula, based on historical performance, the criterion is the loss of two major resources.
o Economic criterion for market economics projects – The cost to eliminate congestion is less than or equal to the expected congestion cost.
Ø The cost of the above two reliability justified and two economically justified
transmission projects is approximately $720 million.
Page 27
o Path 15 upgrade: A new Los Banos – Gates 500-kV line and Gates – Midway 230-kV line, plus two 225-MVAR capacitor banks. Cost - $306 million. The CAISO using reasonable assumptions calculated that, in a drought year, the project savings are $205 million dollars or two thirds of the project cost and, in a normal year, the savings are $104 million. As described above, in concluding that the Path 15 Upgrade would pay for itself within one drought year and three average years, the CAISO assumed that generation would develop uniformly throughout the state. The CAISO did not suggest that more generation is more likely to develop in the South than in the North, but noted that if this happened, the savings from the project would be even more significant (ranging from $69 million per year to $1,304 million per year depending on the reasonable assumptions that are made). Of course, if more generation develops in Northern California than Southern California the savings would range from $12 million per year to $137 million per year. The CAISO is awaiting approval on this project from the CPUC.
o Path 26 upgrade – Installation of a generating tripping scheme. Cost - $2 million. Path 26 is south of and in series with Path 15. If Path 15 is upgraded, congestion problems will move to Path 26; the current cost to resolve congestion on Path 26 is low. The percent of time congestion was present and documented for 2000 and 2001 was 1% and 4% respectively. The project is currently going through the CPUC review and approval process.
o San Diego Area – A new 500-kV line between Valley and Rainbow,
installation of 500/230kV transformer, with flow control capability, 230-kV line work and additional voltage support. Cost - $252 million. In the first quarter of 2003, the CPUC reviewed the project and it was not approved. The CAISO will appeal the Commission’s decision.
o San Francisco Peninsula - Convert the existing 60-kV line between
Jefferson and Martin to 230 kV. Cost - $150 million. The project is currently going through the CPUC review and approval process.
Ø Projects that are based on economics face an uncertain future for several
reasons. First, there is a need for appropriate market modeling tools to support the decision-making process associated with forecasting need in an open competitive market. Second, the review and approval process is not clear, especially for multi-jurisdictional projects. Third, there is uncertainty associated about who pays for construction of new lines and facilities and how cost recovery will be possible.

Page 28
Figure 5 - CAISO Transmission Bottlenecks
Ø Value of Transmission Projects – In early 2001, CAISO staff began
developing a methodology to assess the economic value of proposed transmission projects. CAISO deemed this effort necessary because there is no commonly accepted methodology in California or elsewhere in the nation for evaluating the economic value of transmission facilities and because CAISO is increasingly faced with the need to make determinations on proposed transmission facilities that are justified based on economics rather than reliability. The CAISO, with input from industry stakeholders, worked on developing this methodology with a common object to reduce, to the extent possible, the possibility of inconsistent assessments and results at the various stages of project approval. CAISO issued a request for proposal (RFP) for a consultant to develop the methodology in consultation with CAISO and a steering committee; the US office (Boston) of the United Kingdom consulting firm London Economics (LE) was selected.
The LE methodology provides a comprehensive, highly sophisticated approach to evaluating the economic benefit of transmission projects. However, CAISO believes that modifications and enhancements to the LE methodology are necessary before it can be used. The CAISO Department of Market Analysis and Grid Planning are working with LE to make the necessary modifications. The objective is to develop a revised methodology that “reasonably” captures the economic benefits of transmission upgrades, considering:
Ø new generation entry
Page 29
Ø market power Ø a wide spectrum of system conditions
A revised LE methodology paper should be available by first quarter 2003. See CAISO’s website for more information (search: “London Economics”).
Ø The CAISO has approved more than $1.0 billion in transmission expansion
and replacement since it began operations in March 1998.
4.2 Electric Reliability Council of Texas – (ERCOT)
Summary of Key Findings ERCOT has reassigned congestion costs so that they are no longer uplift costs but are instead assigned to the entities deemed responsible for the congestion. This reassignment has significantly reduced congestion costs in the ERCOT system, from $180 million for eight months of 2001 to $41 million in 2002. In 2002, the ERCOT area was divided into four congestion zones: West, North, South and Houston. Each zone has generating resources in excess of the peak demand. Since February of 2002, there is little difference between the monthly average marginal energy clearing prices between zones. ERCOT is the only ISO that requires all consumers to pay for transmission integration costs associated with new generation facilities. In ERCOT, over 95% of energy requirements are managed through bilateral schedules and 80 % of ancillary services are self arranged. Three major new transmission projects are called for in ERCOT’s current plan, one for reliability reasons, based on planning criteria violations, and two for economic reasons. ERCOT is in the process of developing the necessary justification to support the two economics-based projects. Information Provided by ERCOT ERCOT provided the following information regarding transmission bottlenecks and transmission planning from their web site (www.ercot.com) and interviews with some members of the ERCOT staff. The ERCOT ISO supervises and exercises comprehensive authority over the overall planning of bulk transmission projects that affect the transfer capability of the ERCOT transmission grid. ERCOT’s Transmission Planning information can be accessed on their web site at the following URL: www.ercot.com/Participants/SystemPlanning.htm
Determining the Need for Transmission Additions to Address Constraints ERCOT uses the following criteria in determining when constraints need to be addressed by transmission facility additions: Ø Studies show that a contingency on the transmission system will result in
one or more of the four conditions listed below under the forecasted generation additions:

Page 30
1. Flow on a circuit is at or above the thermal limit for the post-contingency loading
2. Voltage at a bus is at or below the minimum post-contingency limit 3. A portion of the transmission system reaches a state of voltage
instability that may lead to voltage collapse 4. A portion of the transmission system would not be dynamically stable
if a particular disturbance were to occur Ø Significant excess generation is constrained inside an area where
forecasted load fails to materialize as is anticipated or where the load growth cannot be met by sufficiently competitive new generation as a result of the inability to site new generation in that area
Ø Additions may be indicated when the studies show an inadequate amount of transmission capacity in a load area.
Considering New Transmission Proposals Submitted by Interested Parties ERCOT’s “Procedure for ISO Evaluation.” requires them to consider all new transmission proposals submitted by interested parties that comply with the protocol. The ISO will support those proposals that meet ERCOT’s planning criteria and, in accordance with the above procedures for assessing need, best meet the system’s future requirements. Processing of Requests for New Generation Interconnection ERCOT receives and processes new generation interconnection requests as per its “Generation Interconnection Request Procedures.” As a part of that request procedure, ERCOT performs a steady-state security study to determine how feasible a site is for interconnection and at what level the generator can expect to run with other generation in operation in the area before significant transmission additions are required. In addition, a very rough estimate is made of the transmission system additions or upgrades needed to integrate the new generation. If the generating entity decides to go forward at the proposed site, the ISO will then initiate a full interconnection study. Once an interconnection agreement is signed, the local transmission owner commences the construction of all required high voltage transmission facilities. The generation owner is responsible for low voltage interconnection requirements associated with plant auxiliary power requirements. Recommendation of Needed Transmission Facility Additions ERCOT transmission planning process considers both reliability and market facilitation in its planning activities and utilizes the results of the constraint studies, the proposed projects submitted by transmission owners and other interested parties, and generation interconnection security studies to perform ongoing transmission planning. The objective of the planning process is to determine transmission facility additions or modifications needed to:
• Maintain reliability sufficient to meet ERCOT and NERC transmission planning and operating criteria

Page 31
• Integrate new generating facilities that, in the opinion of the ISO, are reasonably sited.
• Adequately serve areas with increasing load • Provide adequate competitive generation to meet the load demand of each
ERCOT zone • Support renewable energy projects
Conducting Open Review and Comment on Proposed Facility Additions ERCOT posts all recommended transmission projects, including support information for them, on its website and notifies the Texas Public Utilities Commission (PUCT) staff, ERCOT Technical Advisory Committee (TAC), TAC Subcommittees, and ERCOT distribution list of the posting. In addition, ERCOT schedules open meetings for all interested parties to discuss projects prior to their final consideration.
Submitting Final Recommended Transmission Projects to the ERCOT Board and Notifying PUCT Following the open meetings and after all concerns and issues are adequately addressed, ERCOT will determine the final recommended transmission projects to be submitted to the ERCOT Board for review and approval. This is normally an annual process, but may occur more frequently if system conditions so require. ERCOT formally informs PUCT of all recommended transmission projects and the designated providers for those projects.
Figure 6 - Transfer Capability between the ERCOT Zones
Transfer Capability between Zones Figure 6, identifies the current transfer capability between the four ERCOT zones. Although a total of 4,590 MW of transfer capability exist between the zones it is not significant relative to the regions peak demand (57,606 MW) and installed
Page 32
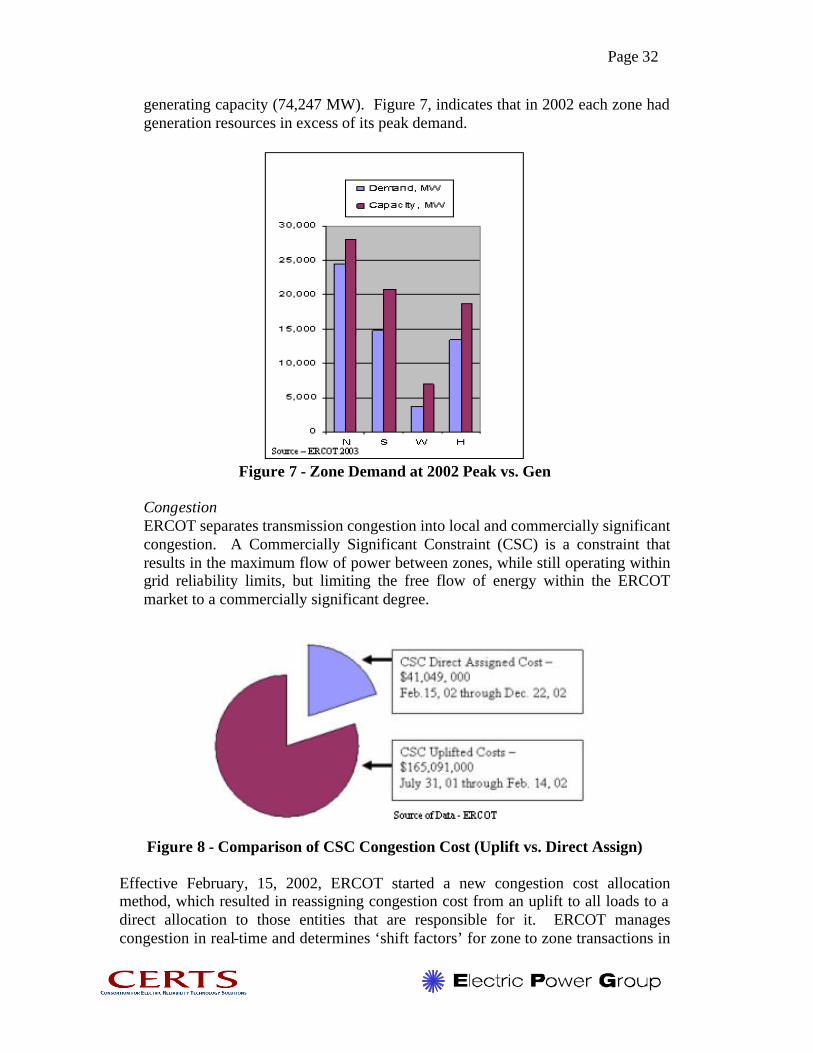
generating capacity (74,247 MW). Figure 7, indicates that in 2002 each zone had generation resources in excess of its peak demand.
Figure 7 - Zone Demand at 2002 Peak vs. Gen
Congestion ERCOT separates transmission congestion into local and commercially significant congestion. A Commercially Significant Constraint (CSC) is a constraint that results in the maximum flow of power between zones, while still operating within grid reliability limits, but limiting the free flow of energy within the ERCOT market to a commercially significant degree.
Figure 8 - Comparison of CSC Congestion Cost (Uplift vs. Direct Assign)
Effective February, 15, 2002, ERCOT started a new congestion cost allocation method, which resulted in reassigning congestion cost from an uplift to all loads to a direct allocation to those entities that are responsible for it. ERCOT manages congestion in real-time and determines ‘shift factors’ for zone to zone transactions in
Page 33
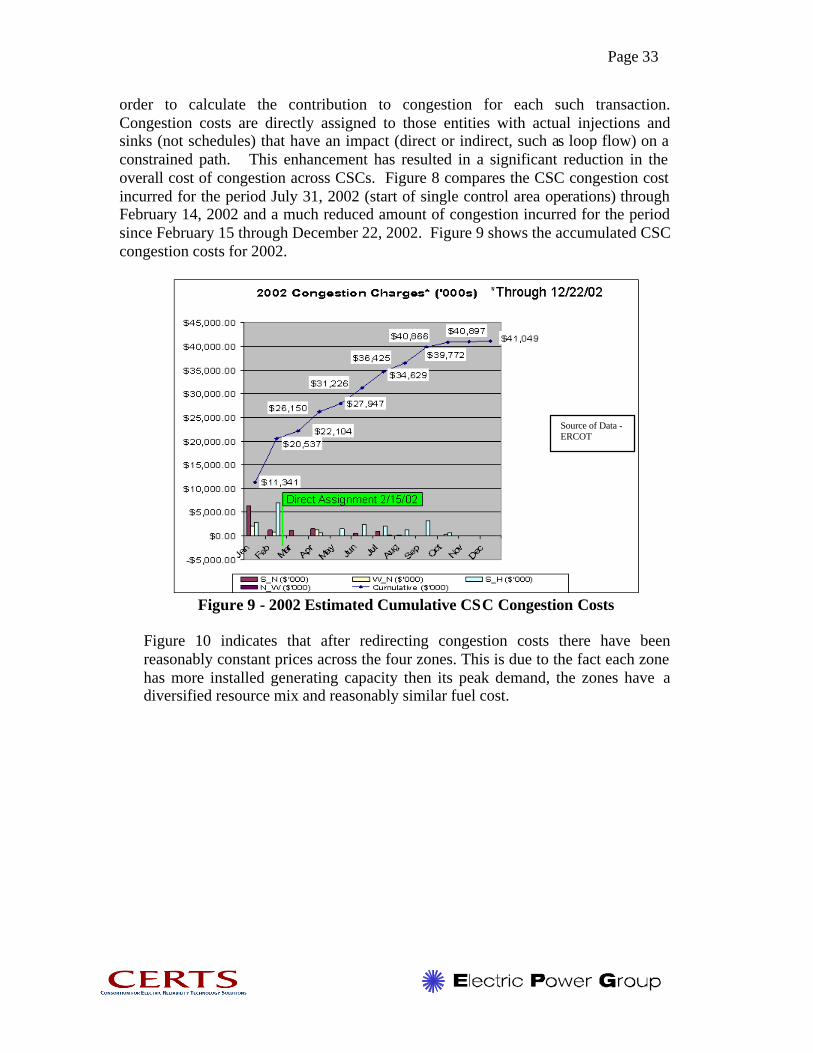
order to calculate the contribution to congestion for each such transaction. Congestion costs are directly assigned to those entities with actual injections and sinks (not schedules) that have an impact (direct or indirect, such as loop flow) on a constrained path. This enhancement has resulted in a significant reduction in the overall cost of congestion across CSCs. Figure 8 compares the CSC congestion cost incurred for the period July 31, 2002 (start of single control area operations) through February 14, 2002 and a much reduced amount of congestion incurred for the period since February 15 through December 22, 2002. Figure 9 shows the accumulated CSC congestion costs for 2002.
Figure 9 - 2002 Estimated Cumulative CSC Congestion Costs
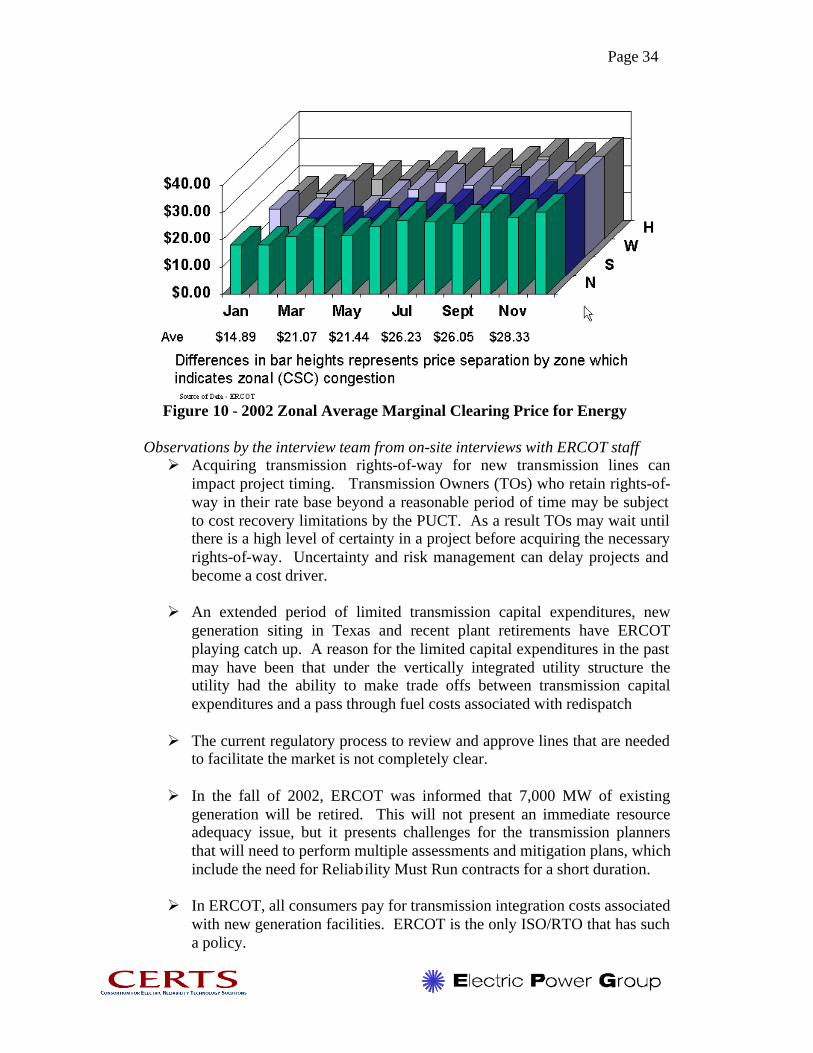
Figure 10 indicates that after redirecting congestion costs there have been reasonably constant prices across the four zones. This is due to the fact each zone has more installed generating capacity then its peak demand, the zones have a diversified resource mix and reasonably similar fuel cost.
Source of Data - ERCOT
Page 34
Figure 10 - 2002 Zonal Average Marginal Clearing Price for Energy
Observations by the interview team from on-site interviews with ERCOT staff Ø Acquiring transmission rights-of-way for new transmission lines can
impact project timing. Transmission Owners (TOs) who retain rights-of-way in their rate base beyond a reasonable period of time may be subject to cost recovery limitations by the PUCT. As a result TOs may wait until there is a high level of certainty in a project before acquiring the necessary rights-of-way. Uncertainty and risk management can delay projects and become a cost driver.
Ø An extended period of limited transmission capital expenditures, new
generation siting in Texas and recent plant retirements have ERCOT playing catch up. A reason for the limited capital expenditures in the past may have been that under the vertically integrated utility structure the utility had the ability to make trade offs between transmission capital expenditures and a pass through fuel costs associated with redispatch
Ø The current regulatory process to review and approve lines that are needed
to facilitate the market is not completely clear. Ø In the fall of 2002, ERCOT was informed that 7,000 MW of existing
generation will be retired. This will not present an immediate resource adequacy issue, but it presents challenges for the transmission planners that will need to perform multiple assessments and mitigation plans, which include the need for Reliability Must Run contracts for a short duration.
Ø In ERCOT, all consumers pay for transmission integration costs associated
with new generation facilities. ERCOT is the only ISO/RTO that has such a policy.
Page 35
Ø In the ERCOT market, 95% of the energy is procured through bi-lateral
agreements and 80% of the ancillary service requirements are met through self-arranged transactions.
Ø As a result of the current level of congestion being low, ERCOT’s primary
focus is to resolve immediate problems that affect local area reliability and to acquire the necessary simulation and market models to evaluate future grid expansion needs.
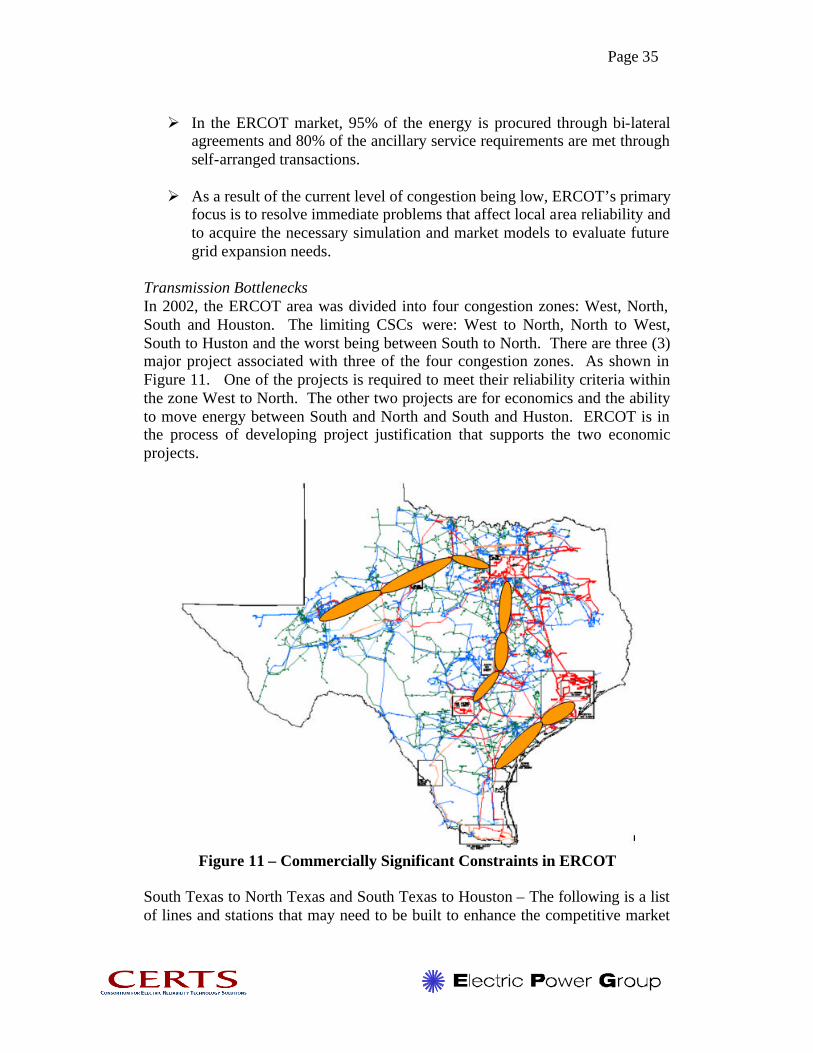
Transmission Bottlenecks In 2002, the ERCOT area was divided into four congestion zones: West, North, South and Houston. The limiting CSCs were: West to North, North to West, South to Huston and the worst being between South to North. There are three (3) major project associated with three of the four congestion zones. As shown in Figure 11. One of the projects is required to meet their reliability criteria within the zone West to North. The other two projects are for economics and the ability to move energy between South and North and South and Huston. ERCOT is in the process of developing project justification that supports the two economic projects.
Figure 11 – Commercially Significant Constraints in ERCOT
South Texas to North Texas and South Texas to Houston – The following is a list of lines and stations that may need to be built to enhance the competitive market
Page 36
and capture the maximum benefits for the consumer. Currently, these projects are under review and will require a longer–term economic assessment: Ø Salem-Bryan/College Station-TNP 345-kV Line and New 345/138-kV
Station Ø Clear Springs-Zorn-Harris Branch-Gabriel-Salado 345-kV Line Ø Cuero-Holman 345-kV Line and Establish Cuero 345-kV Switch Station Ø Coleto Creek-Cuero 345-kV Line Ø Whitney-Concorde 345-kV Line Ø Twin Oak-Lake Creek 345-kV Second Circuit
West Texas to North Texas Projects:
Note - The first two lines are scheduled to be completed in 2003 and will eliminate a potential voltage collapse problem in San Angelo and increase delivery of renewable energy out of West Texas. Project cost: $140 Million for 205 miles of 345-kV line. The remaining three line projects are under review and awaiting additional generation interconnections to be signed prior to increasing the export capability from this zone:
Ø Morgan Creek-Twin Buttes-Red Creek-Comanche Switch 345-kV Line Ø Graham-Jacksboro 345-kV Line Ø Twin Buttes-McCamey 345 kV line Ø Red Creek-Comanche Switch 345-kV Second Circuit Ø Comanche Switch-Killeen Switch 345-kV Line
4.3 Midwest Independent System Operator (MISO)
Summary of Key Findings MISO has the most requests for TLRs reported by NERC but reports congestion costs of only $3 million per year. The MISO is in the early stages of operation and although the customers in the Midwest are incurring congestion costs there is no mechanism in place to capture or report these costs explicitly or publicly. Currently, the local utilities are still managing congestion in the traditional method of re-dispatching their available resources and recovering resulting fuel differential costs through rates. The MISO has plans to implement LMP in 2003, which will provide visibility for some or most of the costs associated with congestion plus provide the right signal for transmission investment. MISO anticipates being able to meet projected load growth reliably through 2007. Due to reported high utilization of existing facilities a portion of the MISO region has been denying ATC requests for new uses since 1999. MISO envisions developing a new infrastructure that will overlay the existing system of 230- and 345-kV lines with a combination of 500-kV and 765-kV lines (estimated cost: $7 billion) and that will address many existing bottlenecks. MISO requires only the minimum reliability interconnection standard for new generation, which could result in pockets of stranded generation.
Page 37
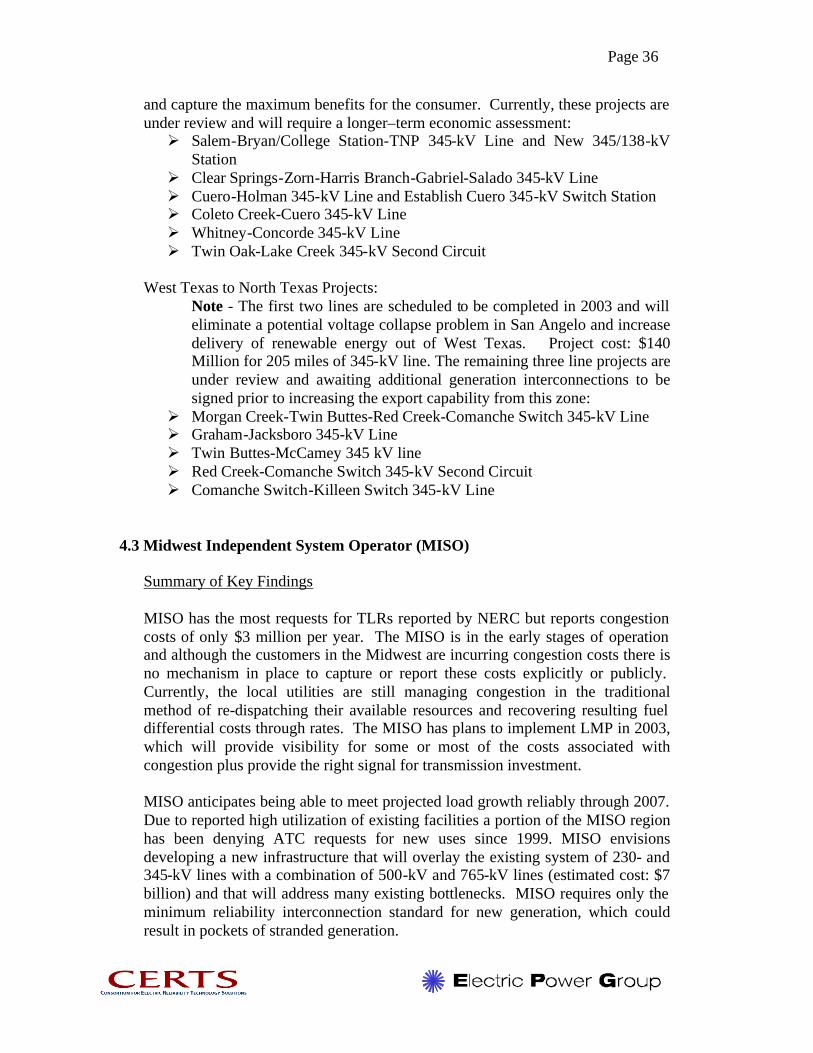
Information provided by MISO MISO provided the following information regarding transmission bottlenecks and transmission planning from their web site (www.midwestiso.org) and through interviews with some of the MISO staff. The following MISO Transmission Planning information can be found at the following URL – www.midwestiso.org/plan_inter/index.shtml The MISO Planning Structure The MISO Planning Advisory Committee (PAC), as shown in Figure 12, consists of representatives from eight stakeholder groups with a structure similar to the Advisory Committee. The PAC advises the MISO Planning Staff on policy and adds a diverse input to the Planning process.
Figure 12 - MISO Planning Advisory Structure
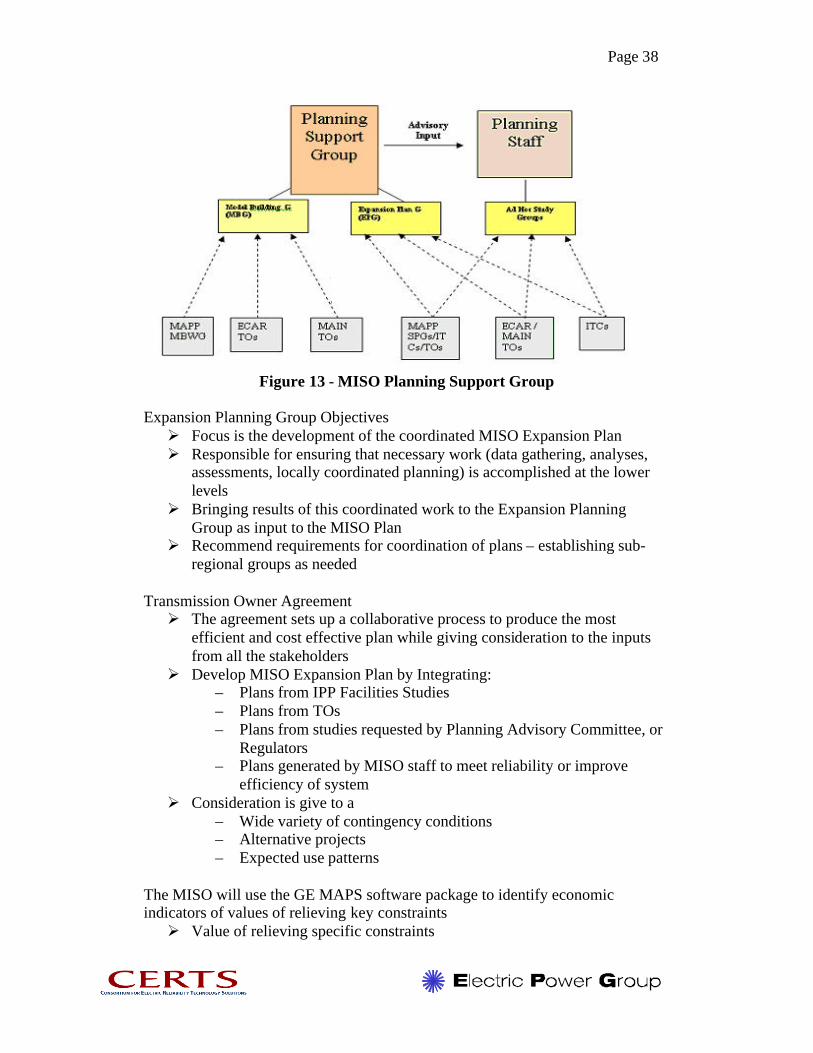
The MISO Planning Support Group (See Figure 13) provides technical support for all planning functions. It is made up of:
– Transmission Owners – Generators – Regulators – Other Stakeholders
Page 38
Figure 13 - MISO Planning Support Group
Expansion Planning Group Objectives Ø Focus is the development of the coordinated MISO Expansion Plan Ø Responsible for ensuring that necessary work (data gathering, analyses,
assessments, locally coordinated planning) is accomplished at the lower levels
Ø Bringing results of this coordinated work to the Expansion Planning Group as input to the MISO Plan
Ø Recommend requirements for coordination of plans – establishing sub-regional groups as needed
Transmission Owner Agreement Ø The agreement sets up a collaborative process to produce the most
efficient and cost effective plan while giving consideration to the inputs from all the stakeholders
Ø Develop MISO Expansion Plan by Integrating: – Plans from IPP Facilities Studies – Plans from TOs – Plans from studies requested by Planning Advisory Committee, or
Regulators – Plans generated by MISO staff to meet reliability or improve
efficiency of system Ø Consideration is give to a
– Wide variety of contingency conditions – Alternative projects – Expected use patterns
The MISO will use the GE MAPS software package to identify economic indicators of values of relieving key constraints Ø Value of relieving specific constraints

Page 39
Ø Value of a Long-Term Vision Plan Ø Value of specific more near-term transmission solutions (Stakeholders
provide input to desired transmission solutions to evaluate)
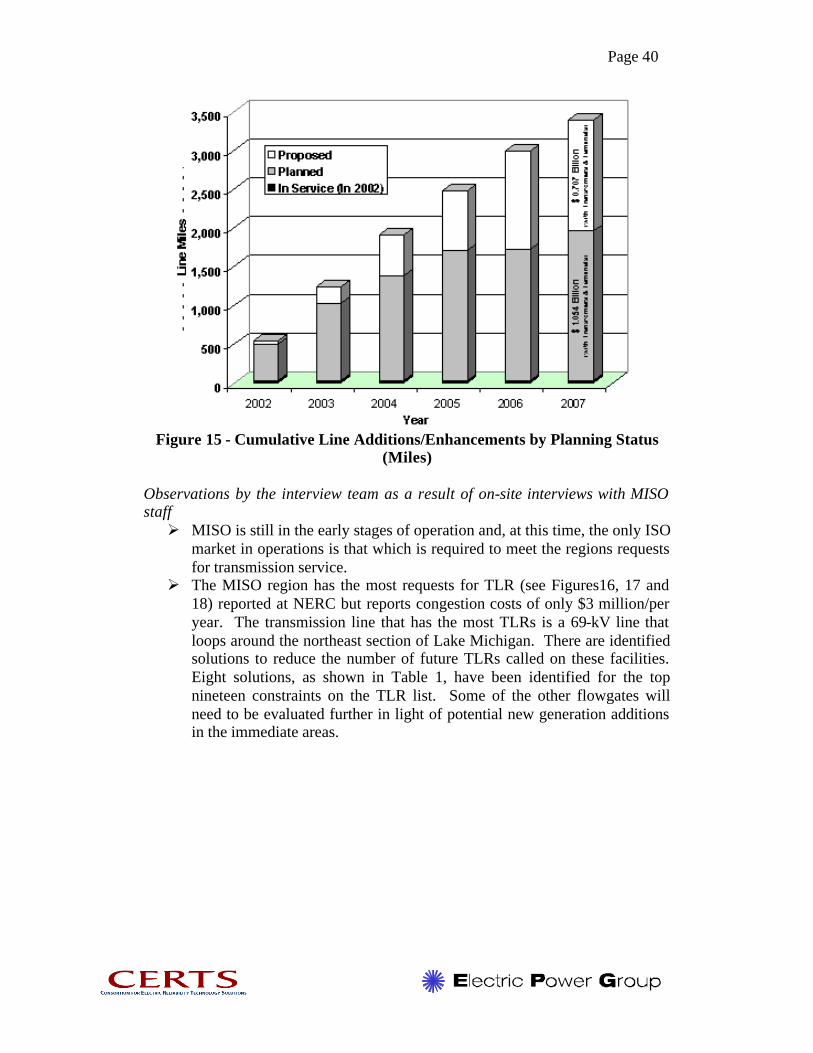
MISO Transmission Expansion Plan (MTEP) The MISO is currently drafting its first Transmission Expansion Plan that will be referred to as MTEP 03, in reference to the year of issue, and will be submitted to the Board in May of this year. The plan will document bulk electric system projects to be developed through the year 2007 that MISO believes are necessary to maintain the reliability of the region. Projects to be contained in the report will be designated as Planned projects or Proposed projects. Planned projects will be those for which a system condition has been found to violate applicable planning standards, and the Planned project has been determined to be the recommended project from among alternatives. Proposed projects are those for which a system condition has been found to violate applicable planning standards, and the proposed project is the best-known alternative at this time. The draft report estimates the direct cost of the Planned and Proposed facilities is $1.8 billion for the six-year period 2002-2007. Of these recommended projects, $1,054 million are considered Planned, and $707 million are considered Proposed and will continue to be reviewed. Currently, there is approximately 147,000 miles of transmission lines throughout the MISO area. The total miles of new construction and upgrades under the draft MTEP 03 would add approximately 3,400 miles of transmission by 2007. This includes lines that went in service in 2002, as well as lines Planned or Proposed through 2007. See Figures 14 and 15
Figure 14 - Cumulative Line Additions/Enhancements by Voltage Class \
Miles
Page 40
Figure 15 - Cumulative Line Additions/Enhancements by Planning Status
(Miles)
Observations by the interview team as a result of on-site interviews with MISO staff Ø MISO is still in the early stages of operation and, at this time, the only ISO
market in operations is that which is required to meet the regions requests for transmission service.
Ø The MISO region has the most requests for TLR (see Figures16, 17 and 18) reported at NERC but reports congestion costs of only $3 million/per year. The transmission line that has the most TLRs is a 69-kV line that loops around the northeast section of Lake Michigan. There are identified solutions to reduce the number of future TLRs called on these facilities. Eight solutions, as shown in Table 1, have been identified for the top nineteen constraints on the TLR list. Some of the other flowgates will need to be evaluated further in light of potential new generation additions in the immediate areas.

Page 41
Table 1 – MISO Solutions for Some of the Top Constraints

Page 42
Figure 16 - MISO Flowgates
Figure 17 - MISO TLRs by Month (2001 and 2002)

Page 43
Figure 18 - MISO Flowgate TLR Hours by Time of Day Relative Eastern
Interconnection
Ø Although the customers in the Midwest are incurring congestion costs there is no mechanism in place to capture or report these costs explicitly or publicly. Currently, the local utilities are still managing congestion in the traditional method of re-dispatching their available resources and recovering fuel differential costs through rates.
Ø The MISO has plans to implement LMP in 2003, which will provide visibility for some or most of the costs associated with congestion plus provide the right signal for transmission investment.
Ø MISO is forecasting, based on its current transmission infrastructure and IPPs that have signed interconnection agreements, that it will be able to meet anticipated load growth reliably through 2007.
Ø Generation interconnection – MISO, like the other FERC jurisdictional ISOs, only requires a generator to build to the minimum interconnection reliability standard, which could lead to pockets of stranded generation.
Ø ISO management and staff realize that they are attempting to operate in a 21st-century competitive electric market with 1950s technology (i.e. 230-kV and 345-kV transmission systems).
Ø The Northwest portion (MAPP) of MISO region has been fully utilizing the existing transmission capability and has been denying ATC requests for new uses since 1999 and somewhat reflects the of ATC utilization elsewhere in MISO.
Page 44
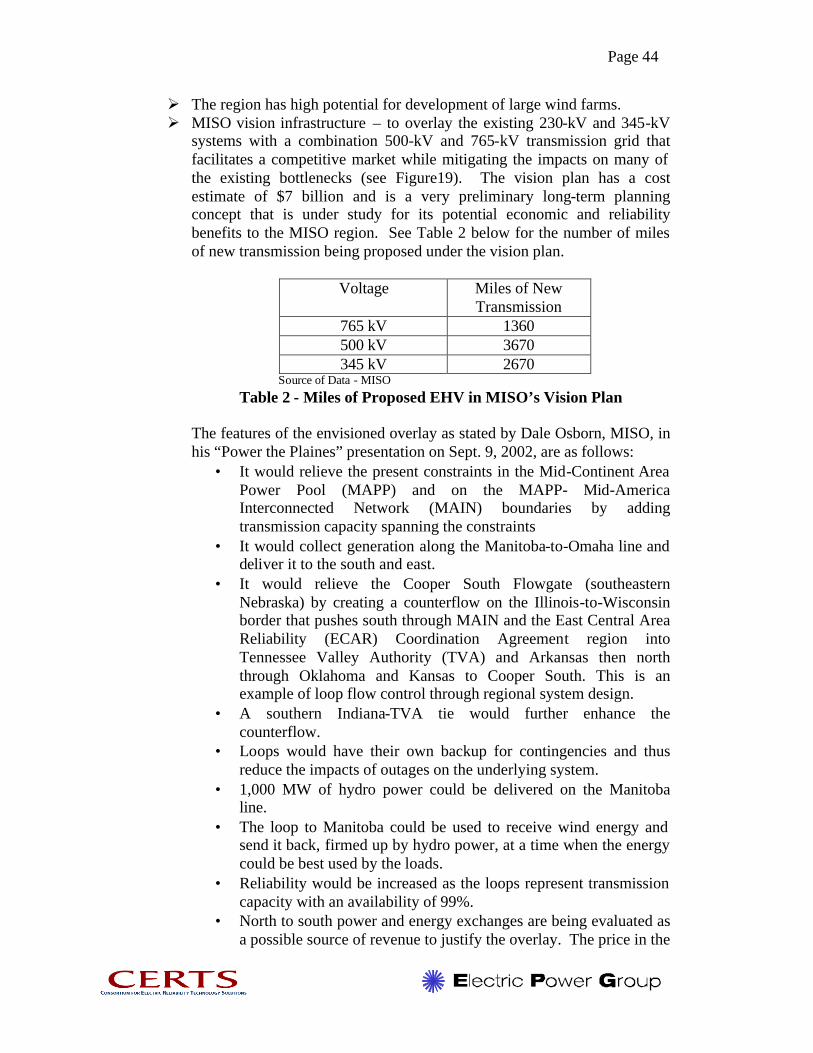
Ø The region has high potential for development of large wind farms. Ø MISO vision infrastructure – to overlay the existing 230-kV and 345-kV
systems with a combination 500-kV and 765-kV transmission grid that facilitates a competitive market while mitigating the impacts on many of the existing bottlenecks (see Figure19). The vision plan has a cost estimate of $7 billion and is a very preliminary long-term planning concept that is under study for its potential economic and reliability benefits to the MISO region. See Table 2 below for the number of miles of new transmission being proposed under the vision plan.
Voltage Miles of New
Transmission 765 kV 1360 500 kV 3670 345 kV 2670
Source of Data - MISO
Table 2 - Miles of Proposed EHV in MISO’s Vision Plan The features of the envisioned overlay as stated by Dale Osborn, MISO, in his “Power the Plaines” presentation on Sept. 9, 2002, are as follows:
• It would relieve the present constraints in the Mid-Continent Area Power Pool (MAPP) and on the MAPP- Mid-America Interconnected Network (MAIN) boundaries by adding transmission capacity spanning the constraints
• It would collect generation along the Manitoba-to-Omaha line and deliver it to the south and east.
• It would relieve the Cooper South Flowgate (southeastern Nebraska) by creating a counterflow on the Illinois-to-Wisconsin border that pushes south through MAIN and the East Central Area Reliability (ECAR) Coordination Agreement region into Tennessee Valley Authority (TVA) and Arkansas then north through Oklahoma and Kansas to Cooper South. This is an example of loop flow control through regional system design.
• A southern Indiana-TVA tie would further enhance the counterflow.
• Loops would have their own backup for contingencies and thus reduce the impacts of outages on the underlying system.
• 1,000 MW of hydro power could be delivered on the Manitoba line.
• The loop to Manitoba could be used to receive wind energy and send it back, firmed up by hydro power, at a time when the energy could be best used by the loads.
• Reliability would be increased as the loops represent transmission capacity with an availability of 99%.
• North to south power and energy exchanges are being evaluated as a possible source of revenue to justify the overlay. The price in the

Page 45
north is lower due to a prevalence of low cost coal in the region. The south is dominated by gas-fired generation. Information concerning the power transfer performance and the economics of the overlay and its parts will be contained in the MISO Transmission Expansion Plan 03.
• The 500 kV overlay spans the constraints in the present transmission system and adds transfer capability to the transmission system.
Figure 19 - MISO’s Vision – Regional EHV Transmission Expansion
4.4 New York Independent System Operator – NYISO Summary of Key Findings Since January 2000, NYISO has experienced transmission congestion costs of approximately $2.75 billion. Critical bottlenecks that are associated with approximately two-thirds of the congestion costs are the upstate Central East and Leeds interfaces. Two merchant direct current (DC) lines, the Neptune and Harbor Cable projects, are being developed. Transmission expansion is generally undertaken based on reliability justification; expansion of transmission facilities based on economic justification is almost non-existent. New requests for generator interconnections are responding to LMP signals, with 89% of proposed generation on the “correct” side relieving congestion.
Page 46
Information Provided by NYISO NYISO provided the following information regarding transmission bottlenecks and transmission planning from their web site (www. nyiso.com) and through interviews with some of the NYISO staff.
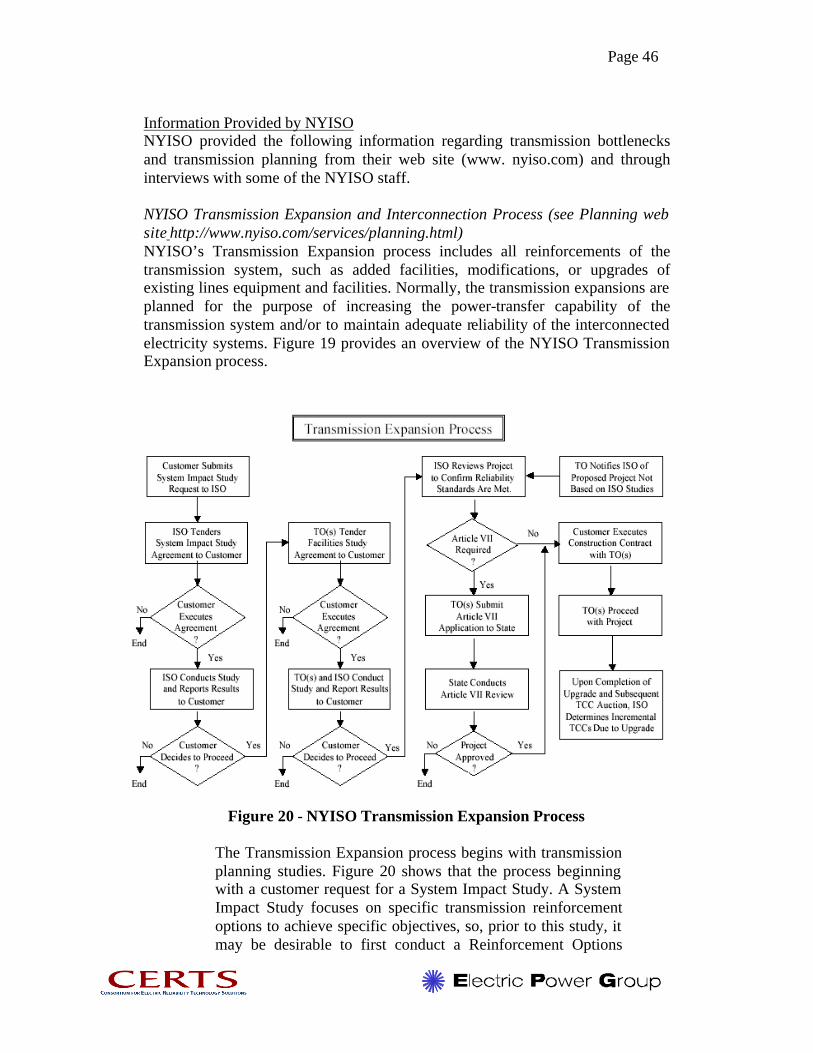
NYISO Transmission Expansion and Interconnection Process (see Planning web site http://www.nyiso.com/services/planning.html) NYISO’s Transmission Expansion process includes all reinforcements of the transmission system, such as added facilities, modifications, or upgrades of existing lines equipment and facilities. Normally, the transmission expansions are planned for the purpose of increasing the power-transfer capability of the transmission system and/or to maintain adequate reliability of the interconnected electricity systems. Figure 19 provides an overview of the NYISO Transmission Expansion process.
Figure 20 - NYISO Transmission Expansion Process
The Transmission Expansion process begins with transmission planning studies. Figure 20 shows that the process beginning with a customer request for a System Impact Study. A System Impact Study focuses on specific transmission reinforcement options to achieve specific objectives, so, prior to this study, it may be desirable to first conduct a Reinforcement Options
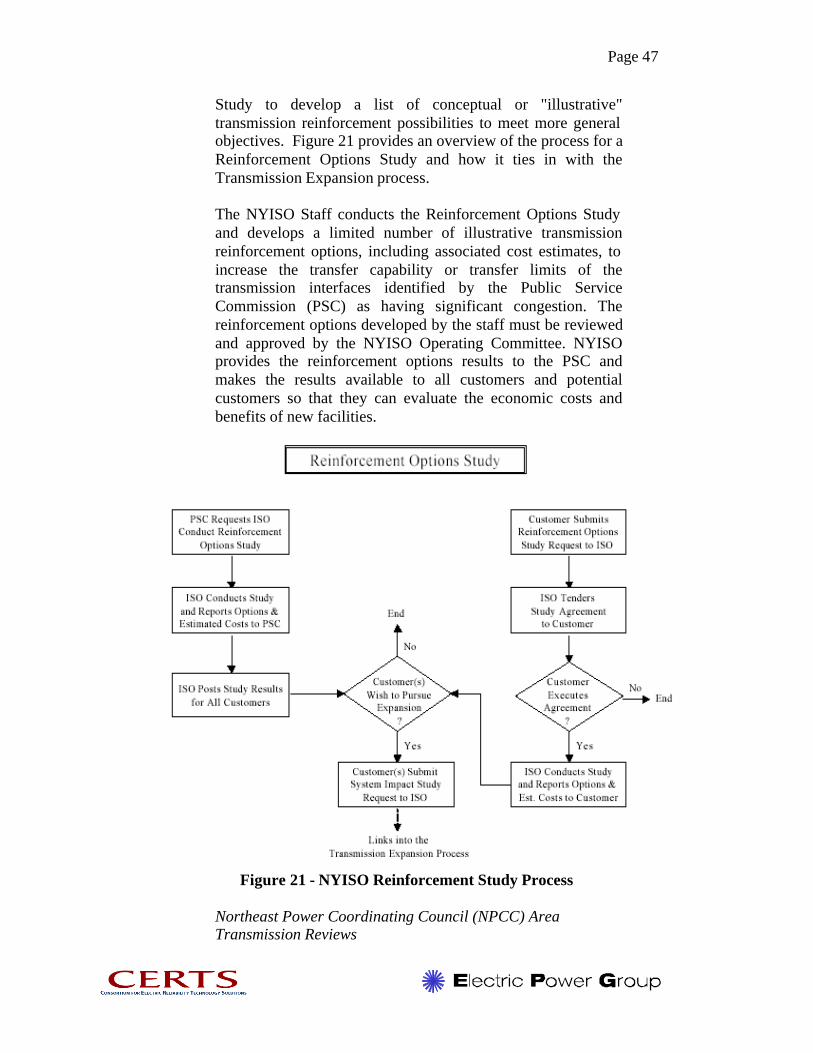
Page 47
Study to develop a list of conceptual or "illustrative" transmission reinforcement possibilities to meet more general objectives. Figure 21 provides an overview of the process for a Reinforcement Options Study and how it ties in with the Transmission Expansion process.
The NYISO Staff conducts the Reinforcement Options Study and develops a limited number of illustrative transmission reinforcement options, including associated cost estimates, to increase the transfer capability or transfer limits of the transmission interfaces identified by the Public Service Commission (PSC) as having significant congestion. The reinforcement options developed by the staff must be reviewed and approved by the NYISO Operating Committee. NYISO provides the reinforcement options results to the PSC and makes the results available to all customers and potential customers so that they can evaluate the economic costs and benefits of new facilities.
Figure 21 - NYISO Reinforcement Study Process
Northeast Power Coordinating Council (NPCC) Area Transmission Reviews

Page 48
NPCC has established a Reliability Assessment Program to bring together work done by the council, its member systems, and areas relevant to the assessment of bulk power system reliability. As part of the Reliability Assessment Program, the Task Force on System Studies (TFSS) periodically reviews the reliability of the planned bulk power transmission system of each area of NPCC and the transmission interconnections to other areas. To assist the TFSS in carrying out this charge, each NPCC area annually assesses the reliability of the planned bulk power transmission system within its area and the transmission interconnections to other areas (an Area Transmission Review) in accordance with these guidelines. A report of this assessment is sent to the TFSS for review. Each area is also responsible for providing an annual report to the Compliance Monitoring and Assessment Subcommittee about its Area Transmission Review in accordance with the NPCC Reliability Compliance and Enforcement Program.
NYISO’s Report on Development of Competitive Electricity Markets In February 2001, the PSC, concerned about the lack of transmission system expansion requested that NYISO evaluate transmission reinforcement options that would increase transfer capability between the NY and neighboring control areas. In response to this request, the NYISO developed a study process that not only looks at the options requested by the PSC but also conducts the evaluation from the perspective of the entire Northeast. The objectives of this study are:
Ø To establish the context of the NY transmission grid within the Northeast power markets
Ø To develop a relative measure of the efficiency of the transmission grid in terms of congestion costs
Ø To evaluate, per the PSC request, illustrative transmission system enhancements that can improve the efficiency of the transmission grid – i.e., reduce congestion costs
Ø To assess, where appropriate, the relative benefits of the enhancements Ø To identify the barriers to transmission expansion
The following are excerpts of the NYISO’s report to the PSC (The TX-Factor in the Development of Competitive Electricity Markets, Version 2, 11/26/2002)
The Northeast Region of NERC represents approximately 155,000 MW of peak demand and operates four competitive markets, with some what limited transfer capability between the markets [see Figure22]. The nominal transfer capability between the Northeast control areas is only on the order of 4-5% of the total peak load of the region.

Page 49
Figure 22 - Transfer Capability in the Northeast Region of NERC
[Figure23] shows the load and pricing zones within the NYISO control area.
Figure 23 - NYISO Load and Price Zones
Based on the price of energy: Ø Zones A-E have are referred to as a the super zone “West NY”, since all
they zones have relatively similar energy prices
Page 50
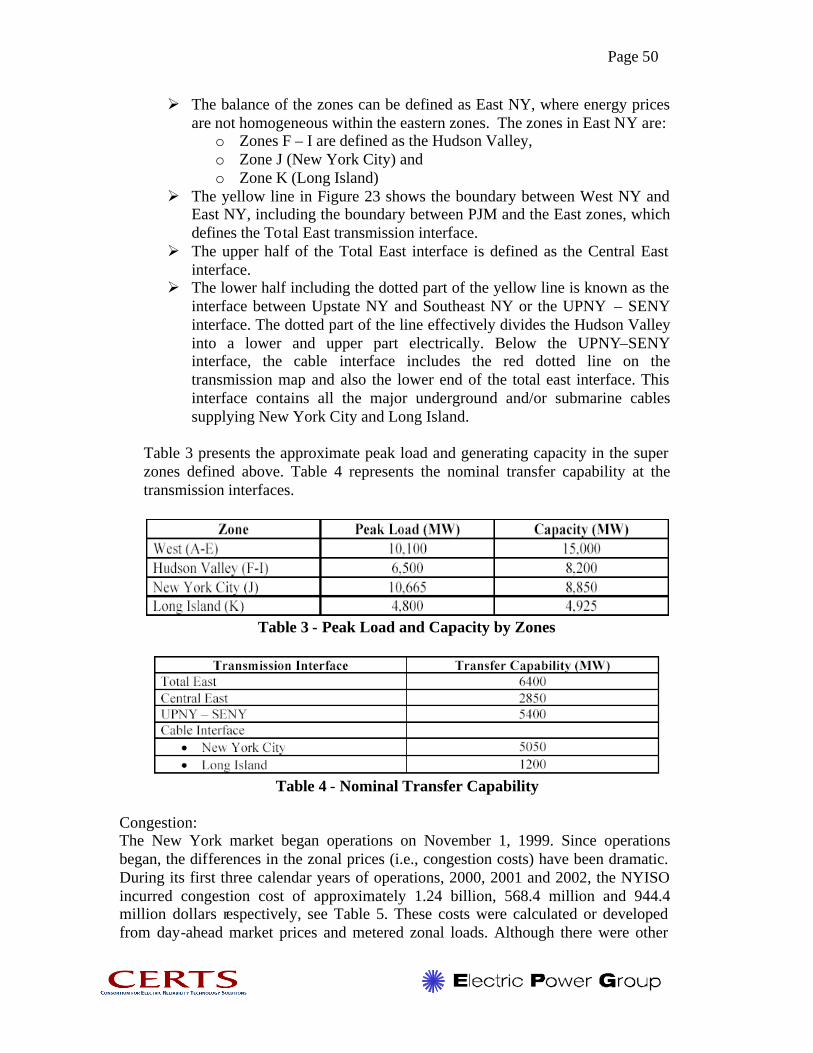
Ø The balance of the zones can be defined as East NY, where energy prices are not homogeneous within the eastern zones. The zones in East NY are:
o Zones F – I are defined as the Hudson Valley, o Zone J (New York City) and o Zone K (Long Island)
Ø The yellow line in Figure 23 shows the boundary between West NY and East NY, including the boundary between PJM and the East zones, which defines the Total East transmission interface.
Ø The upper half of the Total East interface is defined as the Central East interface.
Ø The lower half including the dotted part of the yellow line is known as the interface between Upstate NY and Southeast NY or the UPNY – SENY interface. The dotted part of the line effectively divides the Hudson Valley into a lower and upper part electrically. Below the UPNY–SENY interface, the cable interface includes the red dotted line on the transmission map and also the lower end of the total east interface. This interface contains all the major underground and/or submarine cables supplying New York City and Long Island.
Table 3 presents the approximate peak load and generating capacity in the super zones defined above. Table 4 represents the nominal transfer capability at the transmission interfaces.
Table 3 - Peak Load and Capacity by Zones
Table 4 - Nominal Transfer Capability
Congestion: The New York market began operations on November 1, 1999. Since operations began, the differences in the zonal prices (i.e., congestion costs) have been dramatic. During its first three calendar years of operations, 2000, 2001 and 2002, the NYISO incurred congestion cost of approximately 1.24 billion, 568.4 million and 944.4 million dollars respectively, see Table 5. These costs were calculated or developed from day-ahead market prices and metered zonal loads. Although there were other

Page 51
factors related to inefficiencies in the initial period of the NYISO market that have been greatly addressed, much of the difference in congestion costs between 2000 and 2001 are attributed to the outage of a large nuclear plant, in Southeast NY. In year 2002, again the congestion almost reached one billion dollars. The majority of the differences from 2001 were a result of line outages that impacted the cable interfaces and NYISO started tracking congestion associated with the 138 kV in-city load pockets
Table 5 - Estimated NY Congestion Cost: Total NY and for the Major
Constraints for the Years 2000, 2001 and 2002
Figure 24 - The Three Economically Significant Transmission Bottlenecks in
NYISO Area

Page 52
Further, the analysis shows that about two-thirds of the congestion costs for the NY system can be assigned to upstate Central East and Leeds interfaces see Figure24. As result of planned and unplanned transmission line outages, congestion costs incurred in year 2002 have been approximately $1 billion. This puts congestion costs in year 2002 exceeding year 2001 costs by almost $400 million dollars and approximately $300 million below year 2000 cost.
A base case was developed as the reference case for the system with the expected generation expansion between now and 2010 plus the addition of the [high-voltage direct-current] HVDC merchant transmission facility between Long Island and Connecticut. [Table 6] presents base-case results.
Table 6 - Congestion Base-Case Forecast
A merchant transmission scenario was also evaluated - In addition to the HVDC tie included in the base case, the NYISO interconnection queue contains several merchant transmission proposals. Two proposals are included in the scenario. The two proposals are the HVDC tie lines between NY and PJM resulting in a total increase in tie capability between the two control areas of 1260 MW. This represents an increase of almost 50% in the transfer capability between NY and PJM or an almost 20% increase in the total east interface. The two merchant transmission projects are the Neptune and Harbor Cable projects [These projects are described in more detail in Section 5]. These facilities were added to the base case and modeled to be in service by 2003. The objective of modeling the facilities in service by 2003 is to demonstrate the benefits of transmission expansion before significant generation additions are in place in the congested zones. [Table 7] presents the results for this scenario. The cost for the two projects is estimated to be in the area of $450 to 500 million.
Table 7 - NY Congestion and Energy Costs – Merchant
Page 53
Transmission Scenario
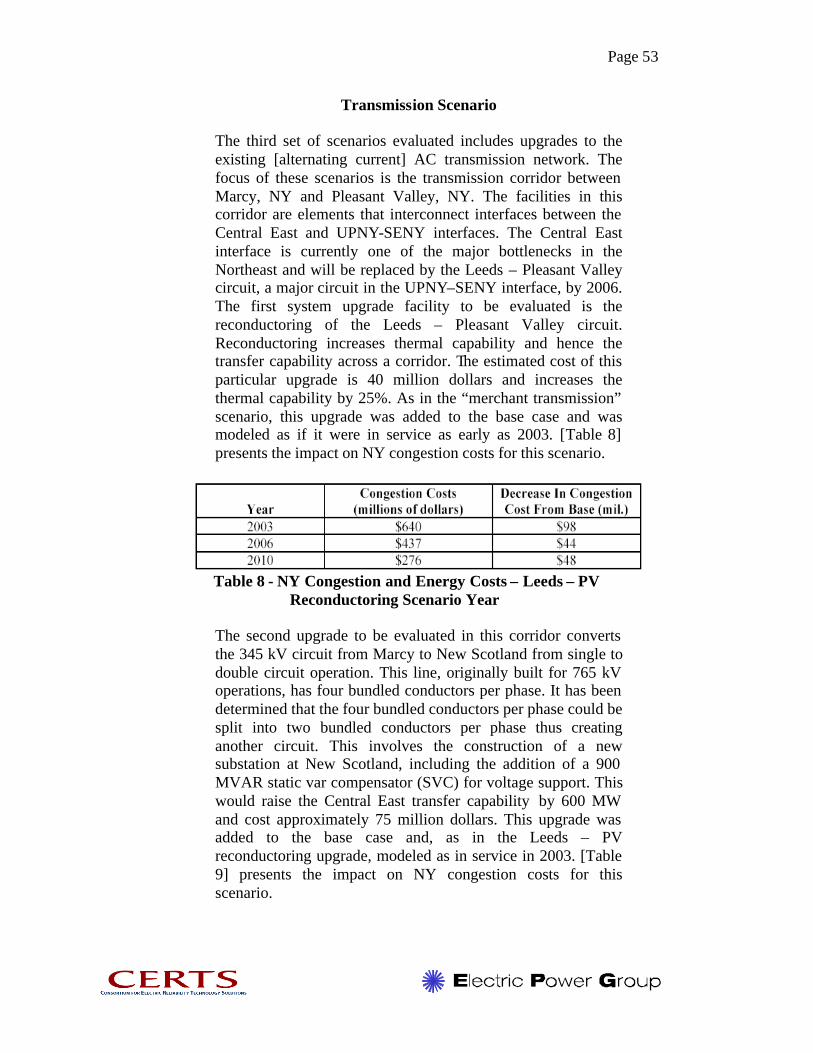
The third set of scenarios evaluated includes upgrades to the existing [alternating current] AC transmission network. The focus of these scenarios is the transmission corridor between Marcy, NY and Pleasant Valley, NY. The facilities in this corridor are elements that interconnect interfaces between the Central East and UPNY-SENY interfaces. The Central East interface is currently one of the major bottlenecks in the Northeast and will be replaced by the Leeds – Pleasant Valley circuit, a major circuit in the UPNY–SENY interface, by 2006. The first system upgrade facility to be evaluated is the reconductoring of the Leeds – Pleasant Valley circuit. Reconductoring increases thermal capability and hence the transfer capability across a corridor. The estimated cost of this particular upgrade is 40 million dollars and increases the thermal capability by 25%. As in the “merchant transmission” scenario, this upgrade was added to the base case and was modeled as if it were in service as early as 2003. [Table 8] presents the impact on NY congestion costs for this scenario.
Table 8 - NY Congestion and Energy Costs – Leeds – PV
Reconductoring Scenario Year
The second upgrade to be evaluated in this corridor converts the 345 kV circuit from Marcy to New Scotland from single to double circuit operation. This line, originally built for 765 kV operations, has four bundled conductors per phase. It has been determined that the four bundled conductors per phase could be split into two bundled conductors per phase thus creating another circuit. This involves the construction of a new substation at New Scotland, including the addition of a 900 MVAR static var compensator (SVC) for voltage support. This would raise the Central East transfer capability by 600 MW and cost approximately 75 million dollars. This upgrade was added to the base case and, as in the Leeds – PV reconductoring upgrade, modeled as in service in 2003. [Table 9] presents the impact on NY congestion costs for this scenario.

Page 54
Table 9 - NY Congestion and Energy Costs – Central
East Scenario Year
The fourth scenario evaluated is the rebuilding of one of the 115 kV circuits between New Scotland and Leeds to 345 kV as well as rebuilding one of the 115 kV circuits between Leeds and Pleasant Valley to 345 kV operations. This work in conjunction with Marcy to New Scotland conversion to double circuit creates another 345 kV circuit between Marcy and Pleasant Valley. It is estimated that the cost to create this additional 345 kV circuit between Marcy and Pleasant Valley would cost approximately 225 million dollars and increase transfer capability across the Total East Interface by 1100 MW. This scenario is added to the base case and is modeled in service by 2003. Although it is recognized that it is not technically feasible to have such an upgrade in service by 2003, it provides another example that clearly contrast the economics in terms of congestion costs savings of transmission expansion vs. generation expansion. [Table 10 presents the congestion cost benefits]
Table 10 - NY Congestion and Energy Costs –
Additional 345 kV Circuit Scenario
Report Conclusions: The analysis presented demonstrates that NY congestion costs should decline as more capacity is added within the congested areas and merchant transmission facilities in the form of HVDC ties are constructed between the NY control area and neighboring control areas. The report also shows that there are benefits to expanding the AC transmission network to enhance the efficiency of the market. Congestion that results from transmission constraints shrinks the scope of markets, dampens competition and increases the need for market mitigation processes. This is especially true in zones with load pockets. However, there are formidable barriers to achieving that end
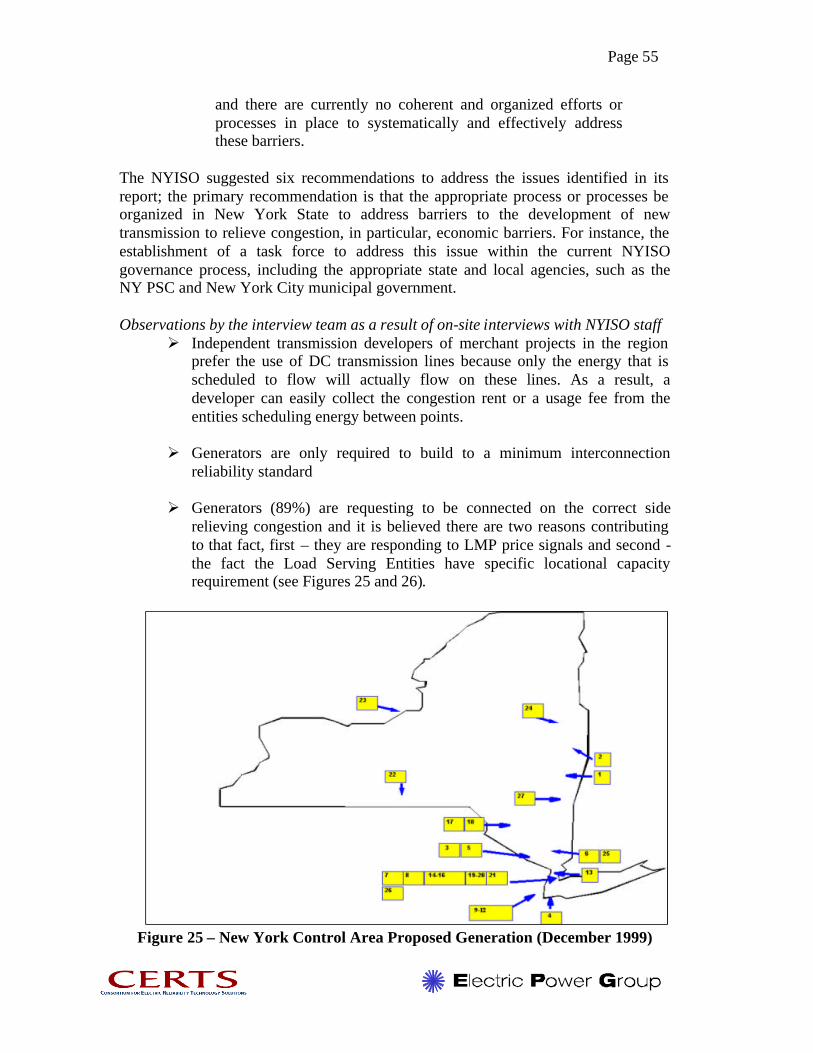
Page 55
and there are currently no coherent and organized efforts or processes in place to systematically and effectively address these barriers.
The NYISO suggested six recommendations to address the issues identified in its report; the primary recommendation is that the appropriate process or processes be organized in New York State to address barriers to the development of new transmission to relieve congestion, in particular, economic barriers. For instance, the establishment of a task force to address this issue within the current NYISO governance process, including the appropriate state and local agencies, such as the NY PSC and New York City municipal government. Observations by the interview team as a result of on-site interviews with NYISO staff
Ø Independent transmission developers of merchant projects in the region prefer the use of DC transmission lines because only the energy that is scheduled to flow will actually flow on these lines. As a result, a developer can easily collect the congestion rent or a usage fee from the entities scheduling energy between points.
Ø Generators are only required to build to a minimum interconnection
reliability standard
Ø Generators (89%) are requesting to be connected on the correct side relieving congestion and it is believed there are two reasons contributing to that fact, first – they are responding to LMP price signals and second - the fact the Load Serving Entities have specific locational capacity requirement (see Figures 25 and 26).
Figure 25 – New York Control Area Proposed Generation (December 1999)
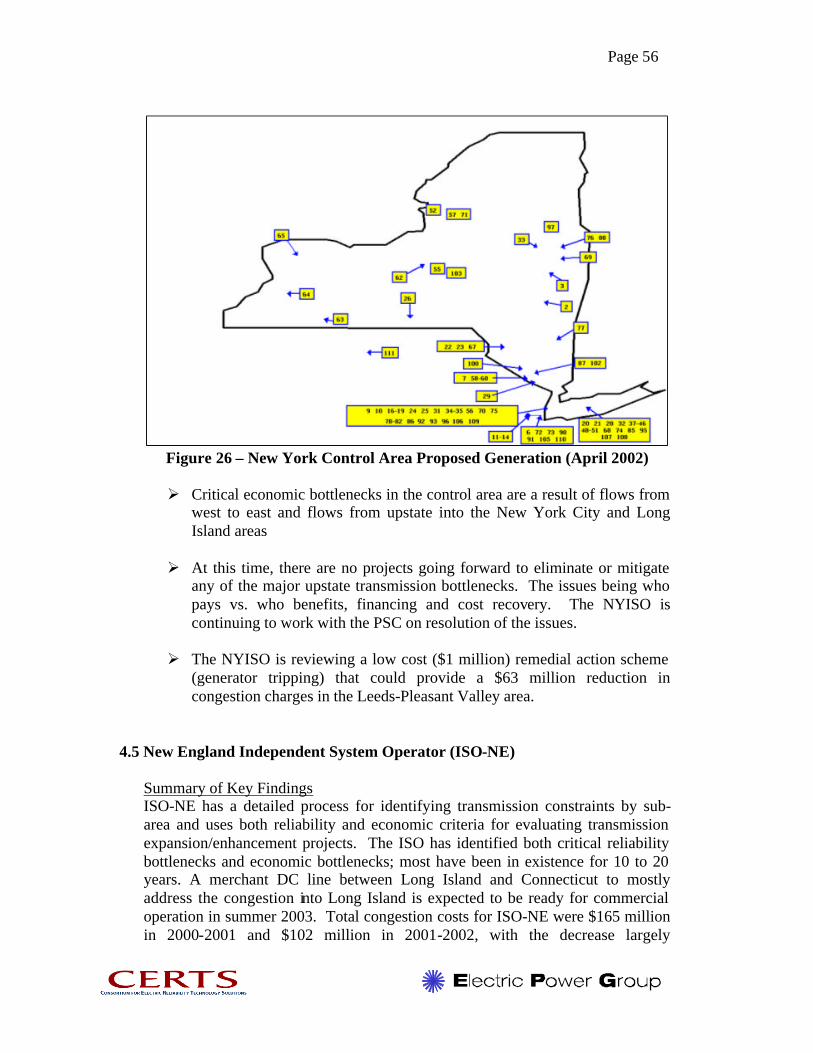
Page 56
Figure 26 – New York Control Area Proposed Generation (April 2002)
Ø Critical economic bottlenecks in the control area are a result of flows from
west to east and flows from upstate into the New York City and Long Island areas
Ø At this time, there are no projects going forward to eliminate or mitigate
any of the major upstate transmission bottlenecks. The issues being who pays vs. who benefits, financing and cost recovery. The NYISO is continuing to work with the PSC on resolution of the issues.
Ø The NYISO is reviewing a low cost ($1 million) remedial action scheme
(generator tripping) that could provide a $63 million reduction in congestion charges in the Leeds-Pleasant Valley area.
4.5 New England Independent System Operator (ISO-NE)
Summary of Key Findings ISO-NE has a detailed process for identifying transmission constraints by sub-area and uses both reliability and economic criteria for evaluating transmission expansion/enhancement projects. The ISO has identified both critical reliability bottlenecks and economic bottlenecks; most have been in existence for 10 to 20 years. A merchant DC line between Long Island and Connecticut to mostly address the congestion into Long Island is expected to be ready for commercial operation in summer 2003. Total congestion costs for ISO-NE were $165 million in 2000-2001 and $102 million in 2001-2002, with the decrease largely
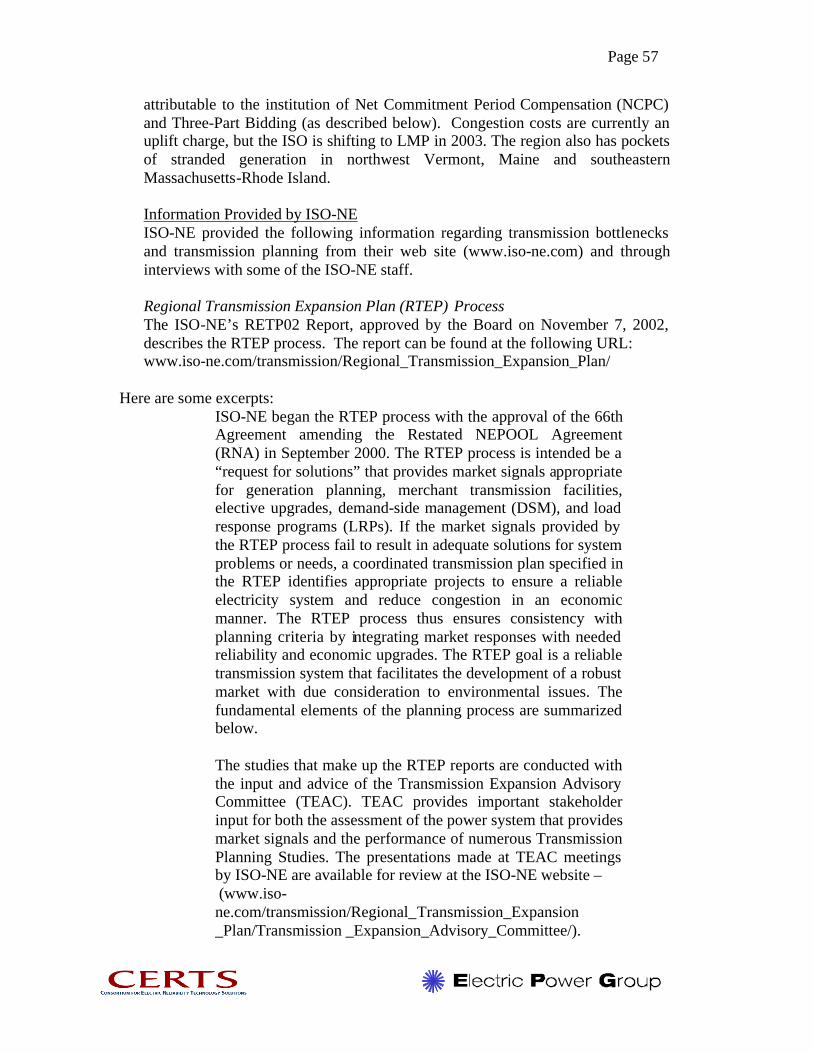
Page 57
attributable to the institution of Net Commitment Period Compensation (NCPC) and Three-Part Bidding (as described below). Congestion costs are currently an uplift charge, but the ISO is shifting to LMP in 2003. The region also has pockets of stranded generation in northwest Vermont, Maine and southeastern Massachusetts-Rhode Island.
Information Provided by ISO-NE ISO-NE provided the following information regarding transmission bottlenecks and transmission planning from their web site (www.iso-ne.com) and through interviews with some of the ISO-NE staff. Regional Transmission Expansion Plan (RTEP) Process The ISO-NE’s RETP02 Report, approved by the Board on November 7, 2002, describes the RTEP process. The report can be found at the following URL: www.iso-ne.com/transmission/Regional_Transmission_Expansion_Plan/
Here are some excerpts:
ISO-NE began the RTEP process with the approval of the 66th Agreement amending the Restated NEPOOL Agreement (RNA) in September 2000. The RTEP process is intended be a “request for solutions” that provides market signals appropriate for generation planning, merchant transmission facilities, elective upgrades, demand-side management (DSM), and load response programs (LRPs). If the market signals provided by the RTEP process fail to result in adequate solutions for system problems or needs, a coordinated transmission plan specified in the RTEP identifies appropriate projects to ensure a reliable electricity system and reduce congestion in an economic manner. The RTEP process thus ensures consistency with planning criteria by integrating market responses with needed reliability and economic upgrades. The RTEP goal is a reliable transmission system that facilitates the development of a robust market with due consideration to environmental issues. The fundamental elements of the planning process are summarized below. The studies that make up the RTEP reports are conducted with the input and advice of the Transmission Expansion Advisory Committee (TEAC). TEAC provides important stakeholder input for both the assessment of the power system that provides market signals and the performance of numerous Transmission Planning Studies. The presentations made at TEAC meetings by ISO-NE are available for review at the ISO-NE website – (www.iso-ne.com/transmission/Regional_Transmission_Expansion _Plan/Transmission _Expansion_Advisory_Committee/).
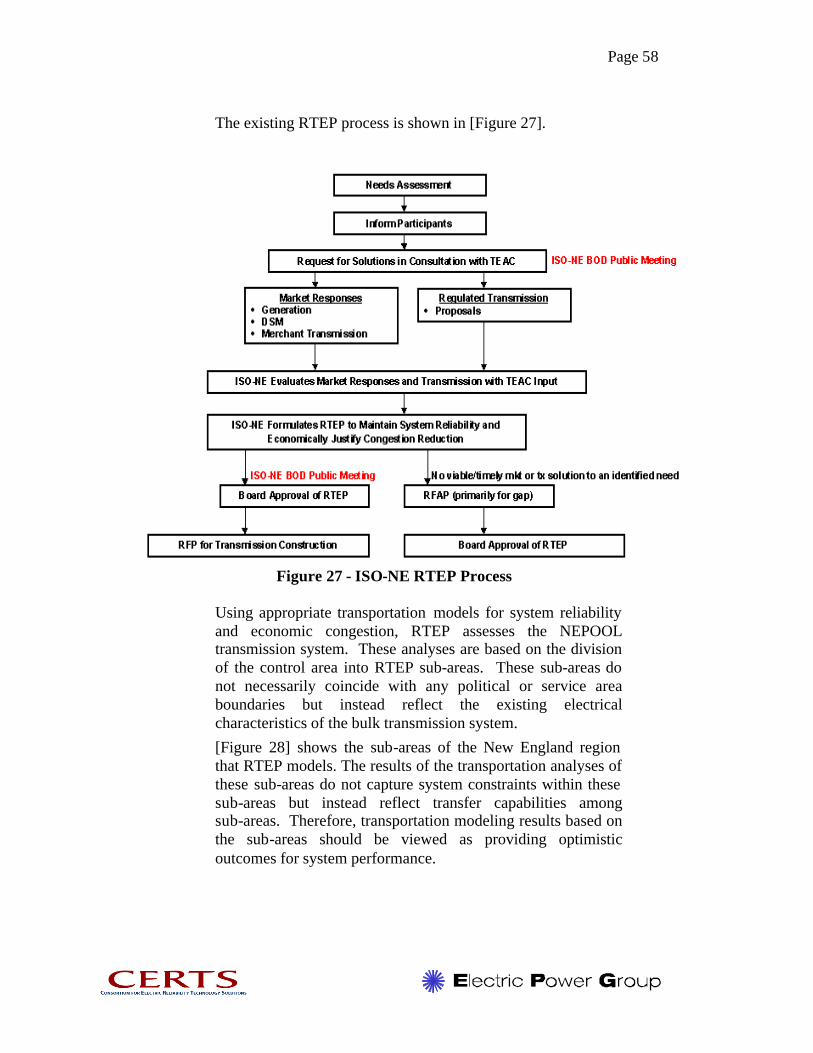
Page 58
The existing RTEP process is shown in [Figure 27].
Figure 27 - ISO-NE RTEP Process
Using appropriate transportation models for system reliability and economic congestion, RTEP assesses the NEPOOL transmission system. These analyses are based on the division of the control area into RTEP sub-areas. These sub-areas do not necessarily coincide with any political or service area boundaries but instead reflect the existing electrical characteristics of the bulk transmission system. [Figure 28] shows the sub-areas of the New England region that RTEP models. The results of the transportation analyses of these sub-areas do not capture system constraints within these sub-areas but instead reflect transfer capabilities among sub-areas. Therefore, transportation modeling results based on the sub-areas should be viewed as providing optimistic outcomes for system performance.
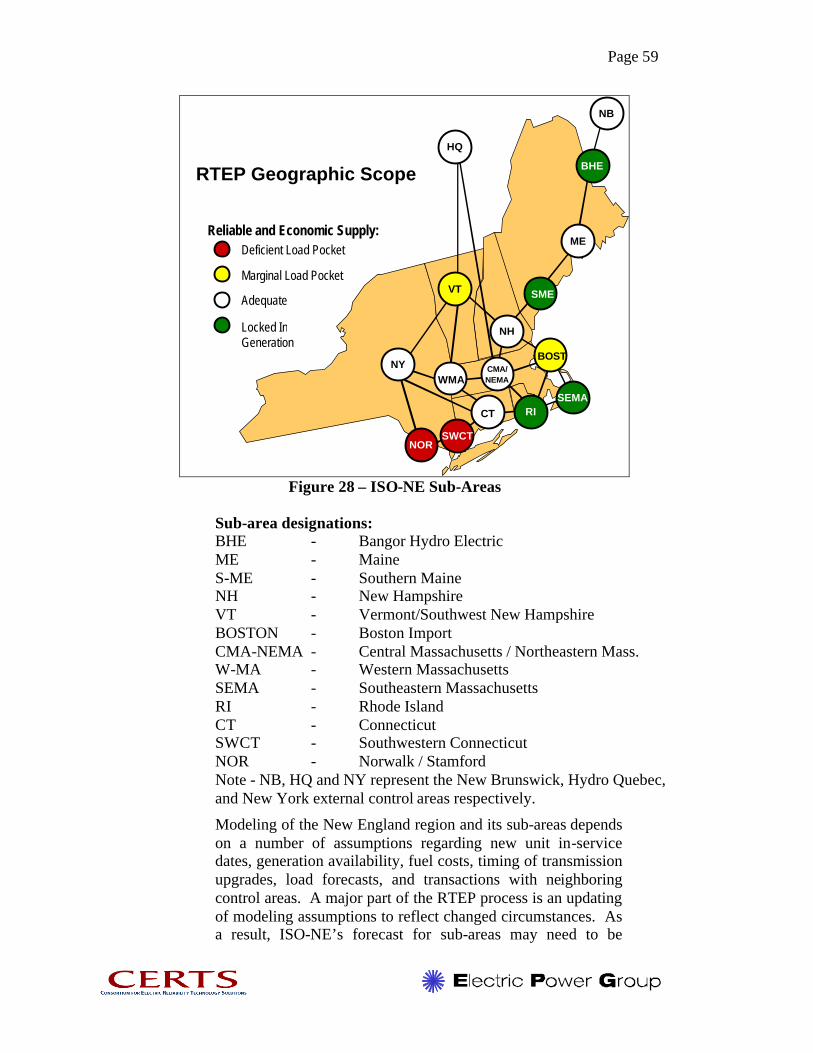
Page 59
RTEP Geographic Scope
HQ
SEMARI
NORSWCT
BHE
ME
NB
BOST
NH
SME
CMA/NEMA
Adequate
Locked InGeneration
Marginal Load Pocket
Deficient Load PocketReliable and Economic Supply:
WMA
VT
NY
CT
Figure 28 – ISO-NE Sub-Areas
Sub-area designations: BHE - Bangor Hydro Electric ME - Maine S-ME - Southern Maine NH - New Hampshire VT - Vermont/Southwest New Hampshire BOSTON - Boston Import CMA-NEMA - Central Massachusetts / Northeastern Mass. W-MA - Western Massachusetts SEMA - Southeastern Massachusetts RI - Rhode Island CT - Connecticut SWCT - Southwestern Connecticut NOR - Norwalk / Stamford Note - NB, HQ and NY represent the New Brunswick, Hydro Quebec, and New York external control areas respectively.
Modeling of the New England region and its sub-areas depends on a number of assumptions regarding new unit in-service dates, generation availability, fuel costs, timing of transmission upgrades, load forecasts, and transactions with neighboring control areas. A major part of the RTEP process is an updating of modeling assumptions to reflect changed circumstances. As a result, ISO-NE’s forecast for sub-areas may need to be

Page 60
modified over time to remain current with conditions impacting the bulk power grid.
System problems are also identified through transmission planning studies that analyze the system in detail and capture system performance within the sub-areas. These studies provide additional market signals and form an essential basis for the study of system improvements. The RTEP02 Report summarizes these studies - (www.iso-ne.com/transmission/Regional_Transmission_Expansion_ Plan/).
Major RTEP02 Findings and Recommendations The major findings of the system assessments and transmission planning studies conducted are outlined below.
Ø Southwestern Connecticut (SWCT) and the Norwalk / Stamford (NOR) Areas The most urgent system reliability need is in the SWCT and NOR sub-areas. These combined areas lack the required transmission infrastructure to provide adequate reliability to electricity customers. Studies demonstrate that, without transmission infrastructure upgrades, there will be widespread violations of transmission planning criteria. As a result, it is doubtful that, without these upgrades, the existing system could reliably support projected loads in the long term. In the short term, it is doubtful that, without significantly increased implementation of DSM and LRP, the existing system can reliably support projected loads. ISO-NE has determined that the existing transmission system configuration cannot provide for significant generation expansion or even the simultaneous operation of existing generation at full load.
Ø Resource Adequacy/System Reliability Accounting for the impact of the recently announced retirements of New Boston Unit 1 and Devon Units 7, 8, & 10 (Devon units = a total of 231 MW, located in SWCT), barring any unanticipated future generator retirements in New England and assuming recommended transmission upgrades are made in SWCT, NEPOOL will meet its generation resource adequacy requirements of interrupting firm load no more than once in 10 years for the period 2002 through 2011.
Ø Forecasted Range of Congestion Costs Taking into account transmission improvements that went into service during summer 2002, projected congestion costs under a

Page 61
Standard Market Design (SMD) environment in New England will be mostly due to constraints in the SWCT and NOR sub-areas. Forecasted congestion costs in the SWCT and NOR sub-areas could dramatically increase if any of the major generating units or transmission facilities are out of service during peak load periods and during any periods of extremely hot weather. Conversely, significant peak load reductions would reduce congestion costs. Congestion costs could range from a low of $50million to a high of $300 million for 2003.
Ø Northwest Vermont The Northwest Vermont area faces severe reliability problems because of weak interconnections with the bulk transmission system and a lack of generating resources including distributed resources in the region. The condition is expected to worsen with continued load growth.
Ø Northeastern Massachusetts (NEMA)/Boston The NEMA/Boston upgrades completed and planned for the future coupled with new generating units scheduled in the Boston area have largely addressed both reliability and economic congestion concerns for the next five years. The report also expresses the need to address longer term issues for the NEMA-Boston area.
Ø LRP/DSM Potential LRP and/or DSM programs in constrained sub-areas could significantly reduce forecasted congestion and improve reliability.
Ø Locked-in Generation Proposed short-term solutions to locked-in generation problems in Maine and Southeastern Massachusetts /Rhode Island (SEMA/RI) will help mitigate projected system-wide congestion costs. However, long-term improvements in the export capabilities of the Maine and SEMA-RI sub-areas will be required to further mitigate the locked-in generation problems in those sub-areas. These improvements would increase overall system reliability and market efficiency.
RTEP02 Recommendations The recommendations resulting from the RTEP02 system assessments and transmission planning studies are outlined below.
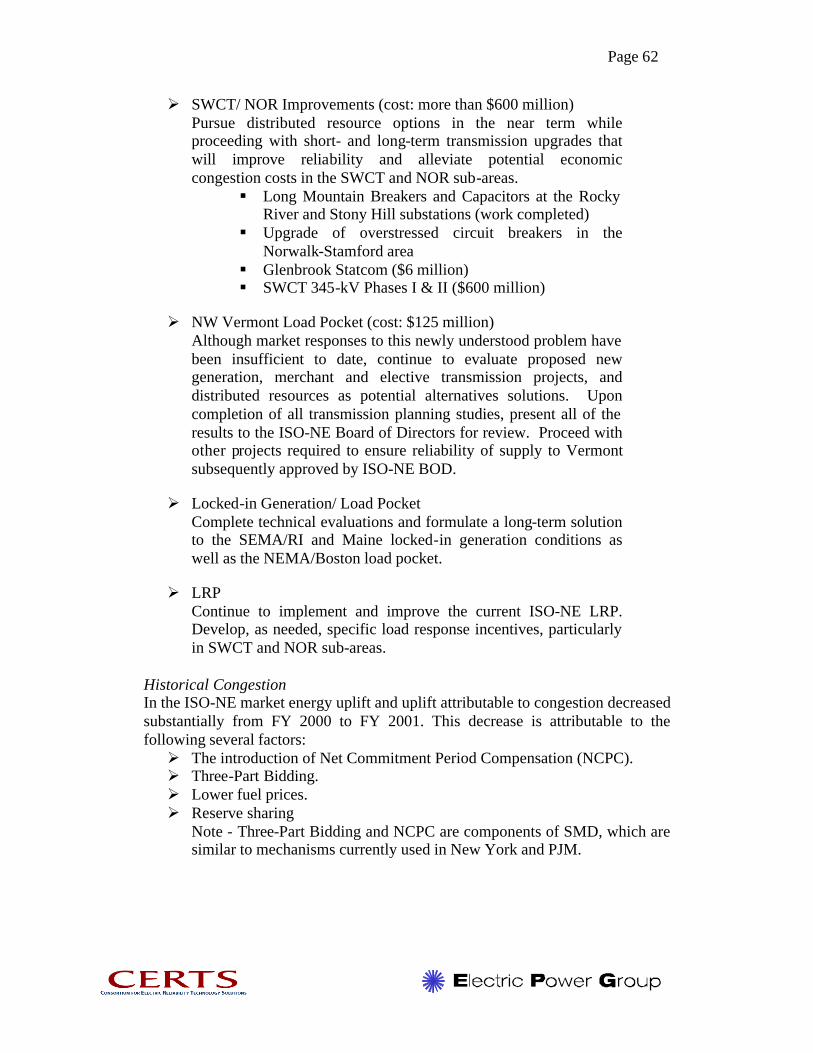
Page 62
Ø SWCT/ NOR Improvements (cost: more than $600 million) Pursue distributed resource options in the near term while proceeding with short- and long-term transmission upgrades that will improve reliability and alleviate potential economic congestion costs in the SWCT and NOR sub-areas.
§ Long Mountain Breakers and Capacitors at the Rocky River and Stony Hill substations (work completed)
§ Upgrade of overstressed circuit breakers in the Norwalk-Stamford area
§ Glenbrook Statcom ($6 million) § SWCT 345-kV Phases I & II ($600 million)
Ø NW Vermont Load Pocket (cost: $125 million) Although market responses to this newly understood problem have been insufficient to date, continue to evaluate proposed new generation, merchant and elective transmission projects, and distributed resources as potential alternatives solutions. Upon completion of all transmission planning studies, present all of the results to the ISO-NE Board of Directors for review. Proceed with other projects required to ensure reliability of supply to Vermont subsequently approved by ISO-NE BOD.
Ø Locked-in Generation/ Load Pocket Complete technical evaluations and formulate a long-term solution to the SEMA/RI and Maine locked-in generation conditions as well as the NEMA/Boston load pocket.
Ø LRP Continue to implement and improve the current ISO-NE LRP. Develop, as needed, specific load response incentives, particularly in SWCT and NOR sub-areas.
Historical Congestion In the ISO-NE market energy uplift and uplift attributable to congestion decreased substantially from FY 2000 to FY 2001. This decrease is attributable to the following several factors: Ø The introduction of Net Commitment Period Compensation (NCPC). Ø Three-Part Bidding. Ø Lower fuel prices. Ø Reserve sharing
Note - Three-Part Bidding and NCPC are components of SMD, which are similar to mechanisms currently used in New York and PJM.
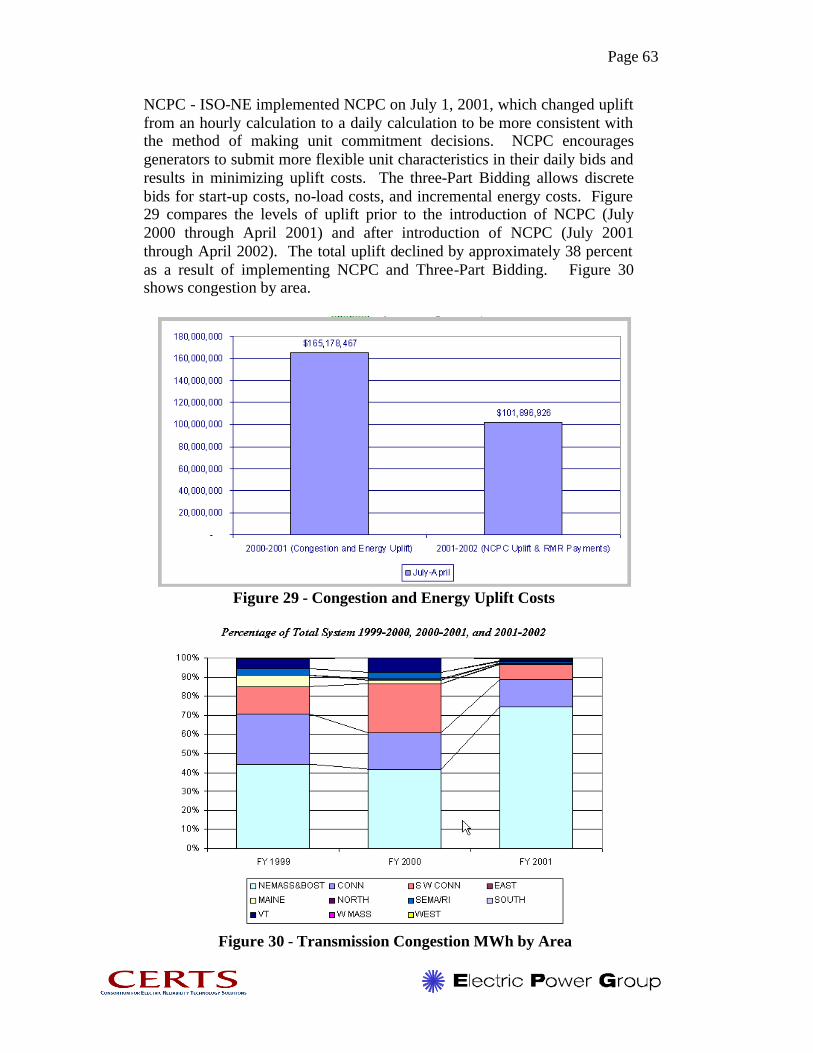
Page 63
NCPC - ISO-NE implemented NCPC on July 1, 2001, which changed uplift from an hourly calculation to a daily calculation to be more consistent with the method of making unit commitment decisions. NCPC encourages generators to submit more flexible unit characteristics in their daily bids and results in minimizing uplift costs. The three-Part Bidding allows discrete bids for start-up costs, no-load costs, and incremental energy costs. Figure 29 compares the levels of uplift prior to the introduction of NCPC (July 2000 through April 2001) and after introduction of NCPC (July 2001 through April 2002). The total uplift declined by approximately 38 percent as a result of implementing NCPC and Three-Part Bidding. Figure 30 shows congestion by area.
Figure 29 - Congestion and Energy Uplift Costs
Figure 30 - Transmission Congestion MWh by Area
Page 64
Observations by the interview team as a result of on-site interviews with ISO-NE staff
Ø ISO-NE will be implementing LMP in 2003. Ø Critical reliability bottleneck areas are imports into Boston, Southwest
Connecticut, and NW Vermont; economic bottlenecks are exports from New Brunswick to Maine, from Maine to New Hampshire, and from New England to New York.
Ø Many of the region’s bottlenecks have existed for one to two decades. Ø The merchant DC line between Long Island and Connecticut is expected
to start testing in the spring and be ready for commercial operation in summer of 2003.
Ø The region has pockets of stranded generation in the following areas: o Bangor o Southern Maine o Southeastern Massachusetts o Rhode Island
4.6 PJM Interconnection (PJM)
Summary of Key Findings Yearly congestion costs have been increasing in PJM from $53 million in 1999 to $132 million in 2000 to $271 million in 2001 and to approximately $430 million in year 2002. A significant amount of the cost increase for year 2002 is attributed to including PJM West facilities to the market. Five economic bottleneck areas have been identified, but at this time, PJM’s Tariff/Operating Agreement precludes “ordering” economic upgrades in the RTEP. In March of 2003 they will file proposed changes to their Tariff/Operating Agreement to correct this issue. PJM has the minimum interconnection reliability standard requirement for new generation, but IPPs typically request and pay for transmission upgrades to ensure that their energy can be delivered; IPPs are willing to pay for these costs in PJM because the load density within the region many of the transmission upgrades are low cost.
Information Provided by PJM PJM provided the following information regarding transmission bottlenecks and transmission planning from their web site (www.pjm.com) and through discussions with some of the PJM staff. PJM RTEP Process The PJM Board of Managers approved the third RETPlan in October of 2002. The report can be accessed from the PJM web site home page by selecting “Regional Transmission Expansion Planning”.
Page 65
The PJM RTEP Process [see Figure 31] governs the means by which PJM coordinates the preparation of a plan for the enhancement and expansion of the regional transmission system on a reliable, economic, and environmentally acceptable basis - in order to meet the demands for firm transmission service in the PJM Control Area. All expansion plans developed by PJM conform to the reliability standards and criteria specified by the North American Electric Reliability Council (NERC), the Mid-Atlantic Area Council (MAAC) for PJM East, and the East Central Area Reliability (ECAR) Council for PJM West.
The RTEP process provides a mechanism by which input from all interested parties is considered. The process includes broad stakeholder input through the activities of the Transmission Expansion Advisory Committee (TEAC). And, further, by virtue of its regional scope, the RTEP Process assures coordination of expansion plans across multiple transmission owners’ systems, permitting the identification of the most effective and efficient expansion plan for the region. The RTEPlan which evolves is reviewed by PJM’s independent Board of Managers who has the final authority for RTEPlan approval and implementation.
The PJM RTEP Process: • The process develops a coordinated expansion plan as a result
of the need for additional transfer capability associated with criteria violations identified through reliability council (MAAC & ECAR) assessments, load forecasts and generation additions or transmission or distribution system upgrades by transmission owners themselves.
• PJM notifies the Transmission Expansion Advisory Committee (TEAC) regarding initiation of the study process. The TEAC notifies PJM of any additional transmission considerations to be included.
• PJM consults with the TEAC to prepare a Scope and Procedure. The Scope includes identification of system limitations; proposes mitigating actions/system expansion alternatives; evaluates proposed enhancements; estimates associated expansion costs and proposed cost allocation; and assesses compliance with established reliability criteria.
• Transmission Owners supply PJM with the necessary load forecast data and transmission system modeling data.
• Upon completion of its studies and analyses, PJM prepares a recommended enhancement and expansion plan for review by the TEAC. The plan also includes recommendations for assignment of cost responsibility.
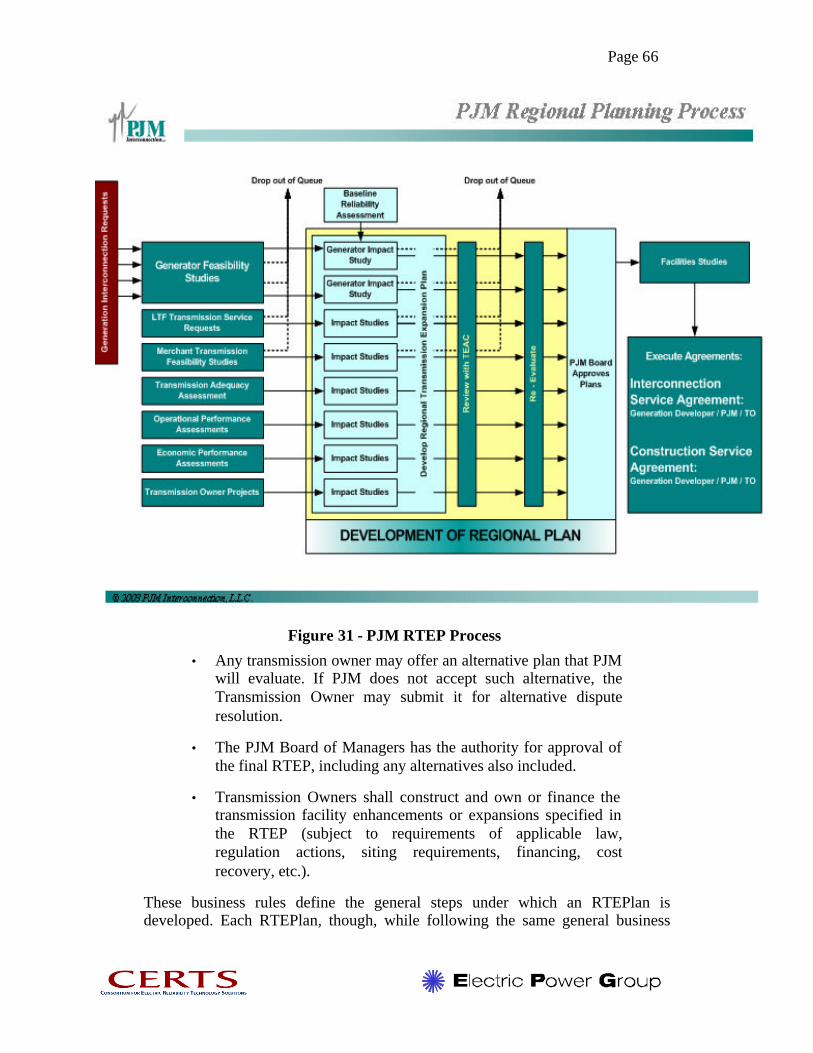
Page 66
Figure 31 - PJM RTEP Process
• Any transmission owner may offer an alternative plan that PJM will evaluate. If PJM does not accept such alternative, the Transmission Owner may submit it for alternative dispute resolution.
• The PJM Board of Managers has the authority for approval of the final RTEP, including any alternatives also included.
• Transmission Owners shall construct and own or finance the transmission facility enhancements or expansions specified in the RTEP (subject to requirements of applicable law, regulation actions, siting requirements, financing, cost recovery, etc.).
These business rules define the general steps under which an RTEPlan is developed. Each RTEPlan, though, while following the same general business

Page 67
rules is subject to drivers which influence the results and recommendations which the Board ultimately reviews. The PJM Board approves the final RTEP, including any alternatives. The current and approved RTEP is published on the PJM internet site and is submitted to the applicable reliability council for verification that all enhancements or expansions conform to reliability principles and standards.
Congestion The information for this section was taken from PJM’s “State of the Market Report 2002, Section 1.
Table 11 shows the total congestion in PJM by year from 1999 through 2002. Congestion charges in 2002 were 58% higher then 2001 which totaled $271,400,000 and 2001 was approximately twice the congestion charges in 2000, which totaled $132,000,000. The year 2002 increase in measured congestion was, for the most part, a result of adding PJM-West facilities to the market. The addition of PJM-West Region transmission facilities to the market resulted in the redispatch of those PJM units required to relieve congestion on specific transmission constraints rather than the simple restriction of all power transfers that had been the pre-market method of controlling congestion for transfers of power from west to east across the Allegheny Power System (APS) and across PJM. The result of this market-based redispatch was the explicit pricing of congestion via LMP.
Year $ in Millions 1999 $53 2000 $132 2001 $271 2002 $430
Table 11 - Total PJM Congestion by Year
[Table12] lists the constraints that ranked in the top 10 for hours of occurrence for 2000 or 2001 and ranked by positive or negative change between the years, sorted by percent of PJM load impacted. Constraints 1 through 4 in make up the set of constraints that impact more than 50% of PJM load (higher LMP), a set composed entirely of the primary operating interfaces. The number of congested hours increased by 308 between the years 2000 to 2001 for this group, from 533 to 841 hours, impacting, on average, 70% of PJM load. Congestion increased on the Western and Western Voltage Interfaces by a
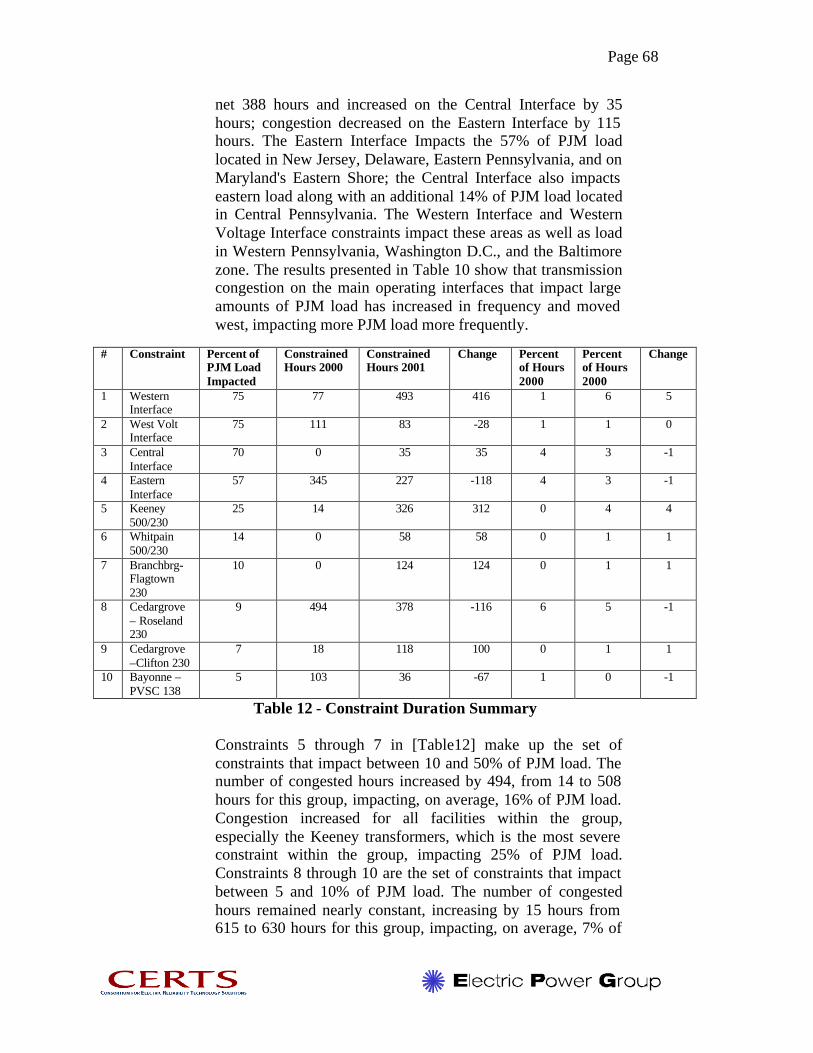
Page 68
net 388 hours and increased on the Central Interface by 35 hours; congestion decreased on the Eastern Interface by 115 hours. The Eastern Interface Impacts the 57% of PJM load located in New Jersey, Delaware, Eastern Pennsylvania, and on Maryland's Eastern Shore; the Central Interface also impacts eastern load along with an additional 14% of PJM load located in Central Pennsylvania. The Western Interface and Western Voltage Interface constraints impact these areas as well as load in Western Pennsylvania, Washington D.C., and the Baltimore zone. The results presented in Table 10 show that transmission congestion on the main operating interfaces that impact large amounts of PJM load has increased in frequency and moved west, impacting more PJM load more frequently.
Table 12 - Constraint Duration Summary Constraints 5 through 7 in [Table12] make up the set of constraints that impact between 10 and 50% of PJM load. The number of congested hours increased by 494, from 14 to 508 hours for this group, impacting, on average, 16% of PJM load. Congestion increased for all facilities within the group, especially the Keeney transformers, which is the most severe constraint within the group, impacting 25% of PJM load. Constraints 8 through 10 are the set of constraints that impact between 5 and 10% of PJM load. The number of congested hours remained nearly constant, increasing by 15 hours from 615 to 630 hours for this group, impacting, on average, 7% of
# Constraint Percent of PJM Load Impacted
Constrained Hours 2000
Constrained Hours 2001
Change Percent of Hours 2000
Percent of Hours 2000
Change
1 Western Interface
75 77 493 416 1 6 5
2 West Volt Interface
75 111 83 -28 1 1 0
3 Central Interface
70 0 35 35 4 3 -1
4 Eastern Interface
57 345 227 -118 4 3 -1
5 Keeney 500/230
25 14 326 312 0 4 4
6 Whitpain 500/230
14 0 58 58 0 1 1
7 Branchbrg- Flagtown 230
10 0 124 124 0 1 1
8 Cedargrove – Roseland 230
9 494 378 -116 6 5 -1
9 Cedargrove –Clifton 230
7 18 118 100 0 1 1
10 Bayonne – PVSC 138
5 103 36 -67 1 0 -1

Page 69
PJM load. All three of these constraints are located in the Northern portion of Public Service Electric & Gas’ area.
Observations by the interview team as a result of interviews with PJM staff Ø PJM has the same minimum interconnection reliability standard for generation
interconnection as the other FERC jurisdictional ISO/RTOs, but IPPs typically request and pay for transmission upgrades to ensure deliverability. This may be partly a result of the region’s dense population and load areas, which means that long transmission lines are not required for IPP integration. Many of the transmission enhancements required to ensure deliverability may only cost a few million dollars. See Figure 32 for locations of new generation.
Ø Each state regulatory body reviews and approves the projects associated with the utilities under its jurisdiction.
Figure 32 - Locations of New Generation
Ø Five economic bottleneck areas have been identified (see Figure 33), but at
this time, PJM’s Tariff/Operating Agreement precludes “ordering” economic upgrades in the RTEP. In March of 2003 they will file proposed changes to their Tariff/Operating Agreement to correct this issue: § NW Pennsylvania (Erie West and South) § West of Washington DC (Doubs Substation) § Delmarva Peninsula

Page 70
§ West Interface (500 kV) § East Interface (500 kV)
Figure 33 - Transmission Bottlenecks in the PJM Area
Table 13 show the cost and hours per year of congestion in the Delmarva Peninsula area and Table 14 Shows the causes and percent of time.
Year 1999 (5 months)
2000 2001 2002 (8 months)
Cost (million) $7 $20 $59 $16 Hours per year 435 2615 3175 860
Table 13 – Delmarva Peninsular Congestion
Causes Cost (million) Percent of Time
Construction Outages $24 23% High flows with all facilities in service
$21 21%
Forced Outages $24 23% Maintenance Outages $33 33%
Table 14 – Delmarva Peninsular Congestion – Causes 5. Information on Transmission Congestion from Other Sources This section supplements the information provided in Section 4 by the six ISOs with information gathered from four key organizations and agencies that are major

Page 71
stakeholders in bottleneck issues: FERC, WGA, NERC, and EEI. This information reinforces and augments the information gathered from the ISOs. 5.1 Federal Energy Regulatory Commission (FERC) The information presented in this subsection was taken from the FERC website www.ferc.gov.
FERC’s Northeast Energy Infrastructure Conference (New York NY, January 31, 2002) focused on creating a snapshot of the current energy infrastructure in the Northeast for electricity and other energy sources. The information about the Northeast presented here comes from material presented at that conference by a representative of the FERC Office of Energy Projects. Figure 34 shows the 11 Northeast states that, along with the District of Columbia, were the focus of the presentation.
Figure 34 – Northeast Region
Three large merchant transmission projects are under development in the Northeast, as shown in [Figure 35]. The first, the Neptune Regional Transmission System, is an HVDC transmission system that would go from Canada Sub C to the Boston and New York City/New Jersey metropolitan areas. It has a 4,800-megawatt capacity its estimated cost is $4 billion. A second project is the TransEnergy Cross Sound Cable that links Connecticut to New York, a 24-mile DC transmission cable with a 330-MW capacity at an estimated cost of $120 million. The Lake Erie project from Ontario to Pennsylvania and Ohio is still in the planning phase. This is an approximately 70-mile DC transmission line with a capacity of 975 MW.

Page 72
Figure 35 - Merchant Transmission Projects
In summer 2001, FERC identified four major transmission constraints in the Northeast [Figure 36], each of which results in extra costs for ratepayers. The Southeast Pennsylvania constraint costs ratepayers an extra $16 million. The Eastern New York constraint costs ratepayers an extra $64.6 million. The Southwest Connecticut Interface costs $4 million extra, and the Northeast-to-Boston constraint cost an additional $60 million.
Figure 36 – Constraints in the Northeast
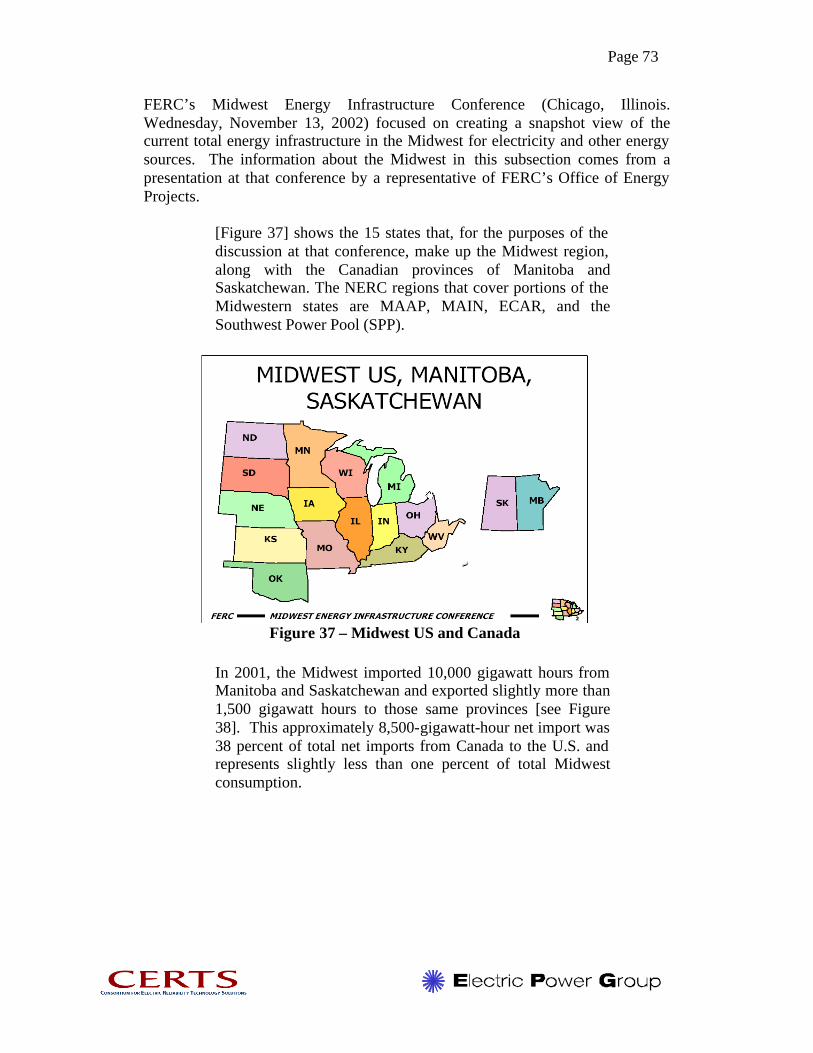
Page 73
FERC’s Midwest Energy Infrastructure Conference (Chicago, Illinois. Wednesday, November 13, 2002) focused on creating a snapshot view of the current total energy infrastructure in the Midwest for electricity and other energy sources. The information about the Midwest in this subsection comes from a presentation at that conference by a representative of FERC’s Office of Energy Projects.
[Figure 37] shows the 15 states that, for the purposes of the discussion at that conference, make up the Midwest region, along with the Canadian provinces of Manitoba and Saskatchewan. The NERC regions that cover portions of the Midwestern states are MAAP, MAIN, ECAR, and the Southwest Power Pool (SPP).
Figure 37 – Midwest US and Canada
In 2001, the Midwest imported 10,000 gigawatt hours from Manitoba and Saskatchewan and exported slightly more than 1,500 gigawatt hours to those same provinces [see Figure 38]. This approximately 8,500-gigawatt-hour net import was 38 percent of total net imports from Canada to the U.S. and represents slightly less than one percent of total Midwest consumption.
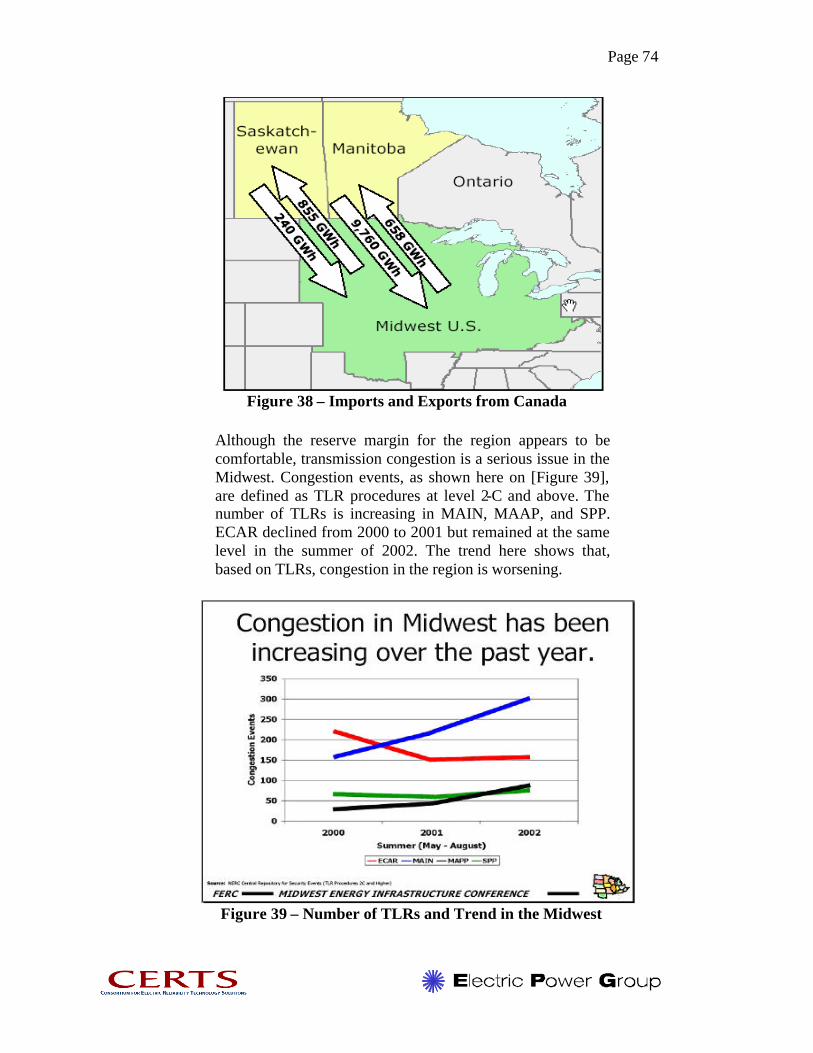
Page 74
Figure 38 – Imports and Exports from Canada
Although the reserve margin for the region appears to be comfortable, transmission congestion is a serious issue in the Midwest. Congestion events, as shown here on [Figure 39], are defined as TLR procedures at level 2-C and above. The number of TLRs is increasing in MAIN, MAAP, and SPP. ECAR declined from 2000 to 2001 but remained at the same level in the summer of 2002. The trend here shows that, based on TLRs, congestion in the region is worsening.
Figure 39 – Number of TLRs and Trend in the Midwest

Page 75
[Figure 40] shows that the locations of congestion can vary for different reasons, e.g., season of the year or temperature differentials between the Midwest and Southeast. For example, in summer 2000, the South stayed much hotter than the North, resulting in congestion in flows from the Midwest to the Southeast. Time of day can also affect flow patterns as people turn on lights and heat in different regions of the country. Power prices and TLRs do not show congestion’s total economic impact because power prices and transmission schedules are determined the day before power delivery, and TLR procedures serve to reschedule generation and transmission flow schedules. The lack of price signals means there is no indication of the cost of business lost due to congestion, and there are no signs or incentives to construct transmission facilities.
Figure 40 – Changes in Congestion Location Several projects in the Midwest are designed to alleviate congestion; however, these projects are designed to resolve immediate problems that may affect reliability, especially in Michigan and Wisconsin. These projects do not reflect the

Page 76
addition of new transmission technology, demand-response mechanisms, or generation sited to remedy congestion. The lack of adequate transmission projects results not only from the lack of price signals but also from the difficulty in siting new facilities across multiple jurisdictions where environmental and landowner concerns can lead to project delays. The formation of RTOs, such as MISO, will help mitigate inefficient curtailment of service and, along with LMP, will highlight the cost of congestion and encourage appropriate projects to relieve congestion. Electricity transmission appears to be the weak link in the Midwest energy infrastructure, and price signals appear to be needed as incentives for transmission expansion to relieve congestion. The near-term consequences of inadequate transmission in this region will, in the near term, limit the movement of electricity at appropriate market prices, and, in the future, compromise reliability if investments are not made. Important steps toward enabling necessary investment in transmission facilities will be full integration of the MISO and SPP and implementation of LMP.
5.2 The Western Governors’ Association (WGA) The information in this subsection comes from the WGA website at www.westgov.org. As a result of the May 9, 2001, Western Governors’ Association Transmission Roundtable in Salt Lake City UT, a working group was convened to develop a conceptual transmission plan for the Western Interconnection, addressing three key questions:
1. What transmission enhancements are needed in the Western Interconnection?
2. How can the necessary transmission enhancements be financed? 3. How can the necessary transmission plans be expeditiously permitted?
A broadly-based group of public-and private-sector representatives participated in the development of the plan, which focuses on transmission additions needed between regions within the Western Interconnection (rather than enhancements to meet local transmission needs). The excerpts below are sections from the work groups’ August 2001 “Conceptual Plans for Electricity Transmission in the West Report” to the WGA.
Predicting Future Bottlenecks:
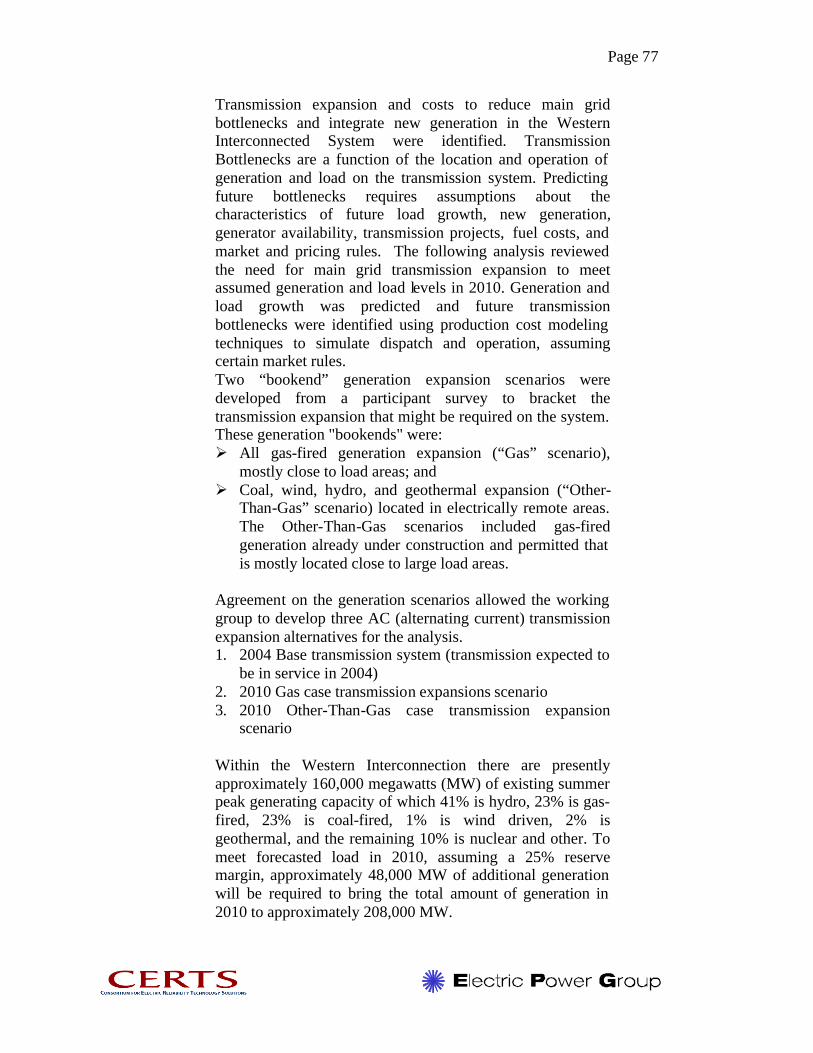
Page 77
Transmission expansion and costs to reduce main grid bottlenecks and integrate new generation in the Western Interconnected System were identified. Transmission Bottlenecks are a function of the location and operation of generation and load on the transmission system. Predicting future bottlenecks requires assumptions about the characteristics of future load growth, new generation, generator availability, transmission projects, fuel costs, and market and pricing rules. The following analysis reviewed the need for main grid transmission expansion to meet assumed generation and load levels in 2010. Generation and load growth was predicted and future transmission bottlenecks were identified using production cost modeling techniques to simulate dispatch and operation, assuming certain market rules. Two “bookend” generation expansion scenarios were developed from a participant survey to bracket the transmission expansion that might be required on the system. These generation "bookends" were: Ø All gas-fired generation expansion (“Gas” scenario),
mostly close to load areas; and Ø Coal, wind, hydro, and geothermal expansion (“Other-
Than-Gas” scenario) located in electrically remote areas. The Other-Than-Gas scenarios included gas-fired generation already under construction and permitted that is mostly located close to large load areas.
Agreement on the generation scenarios allowed the working group to develop three AC (alternating current) transmission expansion alternatives for the analysis. 1. 2004 Base transmission system (transmission expected to
be in service in 2004) 2. 2010 Gas case transmission expansions scenario 3. 2010 Other-Than-Gas case transmission expansion
scenario Within the Western Interconnection there are presently approximately 160,000 megawatts (MW) of existing summer peak generating capacity of which 41% is hydro, 23% is gas-fired, 23% is coal-fired, 1% is wind driven, 2% is geothermal, and the remaining 10% is nuclear and other. To meet forecasted load in 2010, assuming a 25% reserve margin, approximately 48,000 MW of additional generation will be required to bring the total amount of generation in 2010 to approximately 208,000 MW.
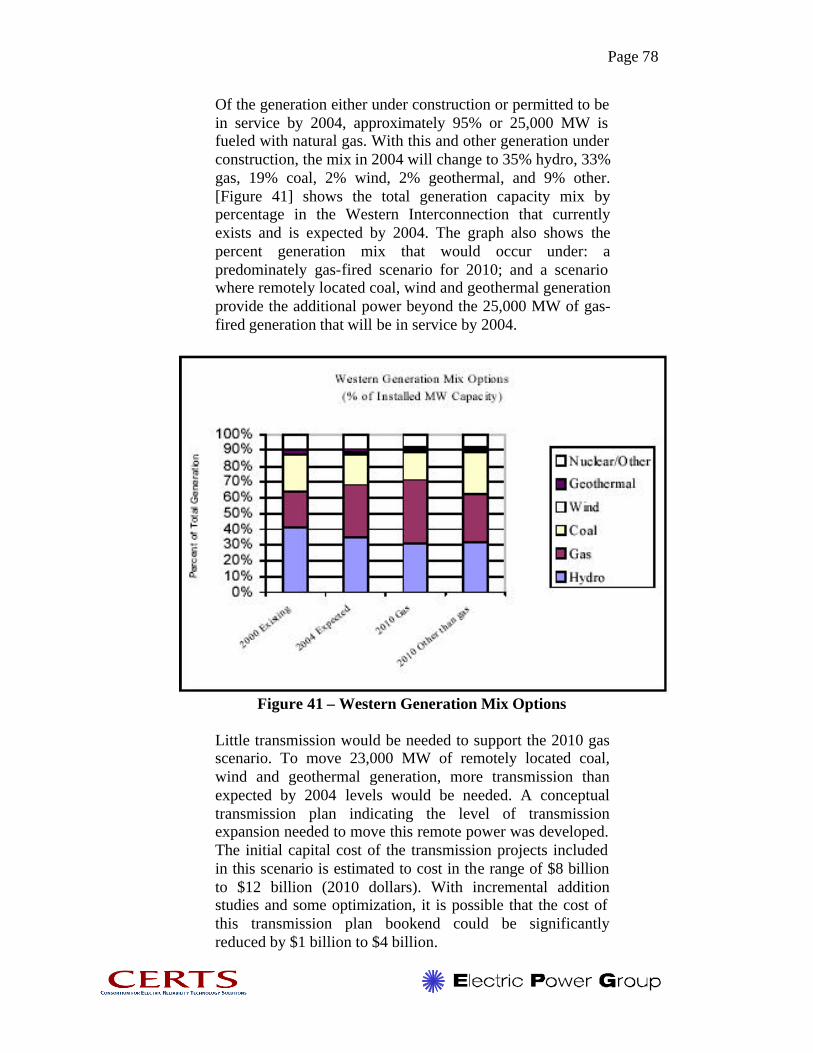
Page 78
Of the generation either under construction or permitted to be in service by 2004, approximately 95% or 25,000 MW is fueled with natural gas. With this and other generation under construction, the mix in 2004 will change to 35% hydro, 33% gas, 19% coal, 2% wind, 2% geothermal, and 9% other. [Figure 41] shows the total generation capacity mix by percentage in the Western Interconnection that currently exists and is expected by 2004. The graph also shows the percent generation mix that would occur under: a predominately gas-fired scenario for 2010; and a scenario where remotely located coal, wind and geothermal generation provide the additional power beyond the 25,000 MW of gas-fired generation that will be in service by 2004.
Figure 41 – Western Generation Mix Options
Little transmission would be needed to support the 2010 gas scenario. To move 23,000 MW of remotely located coal, wind and geothermal generation, more transmission than expected by 2004 levels would be needed. A conceptual transmission plan indicating the level of transmission expansion needed to move this remote power was developed. The initial capital cost of the transmission projects included in this scenario is estimated to cost in the range of $8 billion to $12 billion (2010 dollars). With incremental addition studies and some optimization, it is possible that the cost of this transmission plan bookend could be significantly reduced by $1 billion to $4 billion.
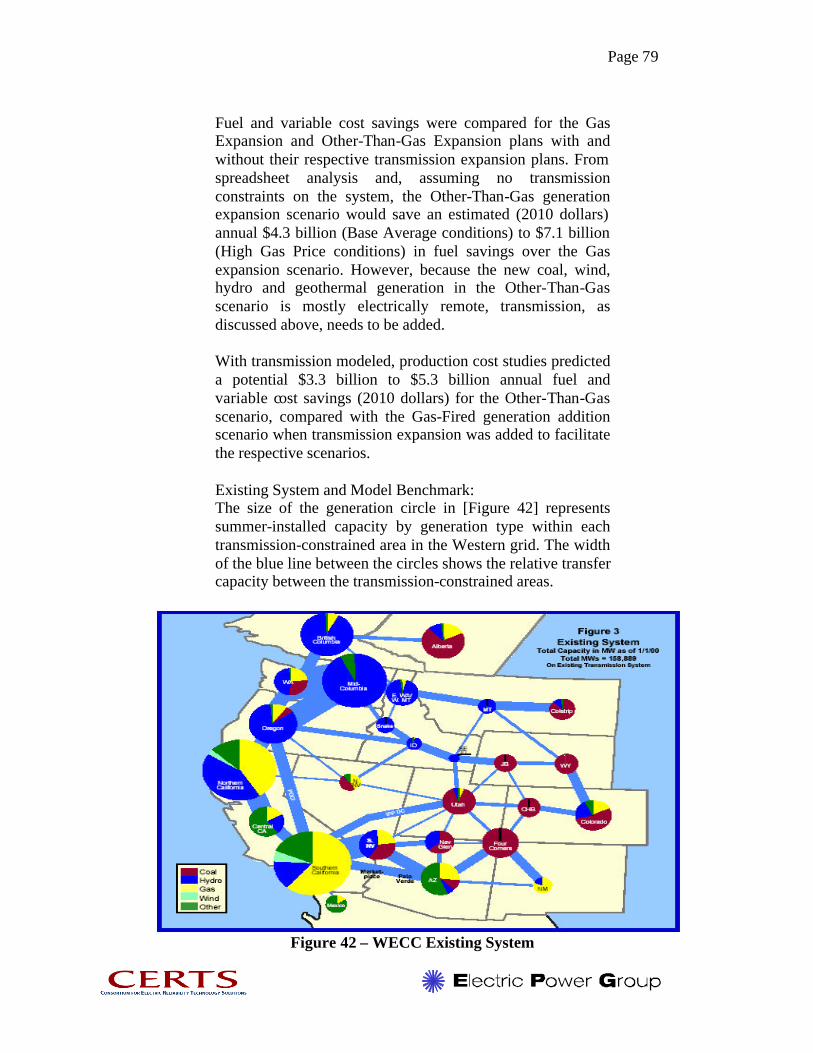
Page 79
Fuel and variable cost savings were compared for the Gas Expansion and Other-Than-Gas Expansion plans with and without their respective transmission expansion plans. From spreadsheet analysis and, assuming no transmission constraints on the system, the Other-Than-Gas generation expansion scenario would save an estimated (2010 dollars) annual $4.3 billion (Base Average conditions) to $7.1 billion (High Gas Price conditions) in fuel savings over the Gas expansion scenario. However, because the new coal, wind, hydro and geothermal generation in the Other-Than-Gas scenario is mostly electrically remote, transmission, as discussed above, needs to be added. With transmission modeled, production cost studies predicted a potential $3.3 billion to $5.3 billion annual fuel and variable cost savings (2010 dollars) for the Other-Than-Gas scenario, compared with the Gas-Fired generation addition scenario when transmission expansion was added to facilitate the respective scenarios. Existing System and Model Benchmark: The size of the generation circle in [Figure 42] represents summer-installed capacity by generation type within each transmission-constrained area in the Western grid. The width of the blue line between the circles shows the relative transfer capacity between the transmission-constrained areas.
Figure 42 – WECC Existing System

Page 80
[Figure 43] indicates the amount of exports and imports between the circles that might be expected during the peak summer hours under average hydro conditions in the Western System. The connecting main grid infrastructure is designed to facilitate these exports. The main grid infrastructure does not have to move every MW generated to every corner of the system, only the exports to importing areas. However, the grid must not only handle these exports during average peak conditions, but also exports during other likely conditions, including off-peak hours, peak conditions in seasons other than summer, extreme load conditions (heat or cold waves), and conditions in which system elements are out because of planned maintenance or forced outage.
Figure 43 – Energy Imports and Exports in the West
A significant amount of transmission on the West Coast links the hydro generation areas of the Northwest with coastal load areas. It facilitates the considerable amount and variation of inexpensive hydro generation that can occur depending on seasonal water conditions. There also is a significant amount of transmission between the Desert Southwest areas and Southern California areas facilitating large amounts of
Page 81
dedicated coal-fired generation, jointly built and owned by California and Southwest entities. Because of the long distances between areas in the Rocky Mountain States, transmission is limited in the eastern part of the loop. In this area dominated by coal-fired generation, the existing transmission is generally tailored to fit specific generation and exports. These plants supply power to load centers in the eastern end of the Western Interconnection. They also supply energy through the limited east side transmission system to the West Coast and Southwest areas where hydro and gas peaking capacity is used to shape or store the energy and follow capacity demand.
Figure 44a – Actual Line Loading (2000) vs. MAPS
Simulation
Figures 44a and b show both historic recorded levels of "actual flow" and the production cost model’s prediction of bottlenecks on the existing system. Given the transmission capability that must be set aside for reliability and system performance during outages and during other than-average conditions, a rule of thumb is that a path is considered heavily loaded if its use exceeds 50% of its rating for the majority of time. Figures 44a and b shows the amount of time some of the most heavily loaded paths were loaded to 50%, 75%, 90%, and 95% of their rating during the year 2000. It does not include times when the path was reserved but not used, yet unavailable for use on a firm basis. The second set of bars for each path shows results from the model analysis

Page 82
which corresponds reasonably with actual flows, thus providing some confidence in the model's ability to predict future bottlenecks, when new generation and load is added. Their location in the Western transmission system is shown on [Figure 45].
Figure 44b – Actual Line Loading (2000) vs. MAPS
Simulation

Page 83
BUCKLEY
SUNDANCE
FT. PECK
PEACE CANYON
MICA
VANCOUVER
SEATTLE
PRINCE RUPERT
AREA
AREA
COLSTRIP
BOISE
PORTLANDAREA
MALIN
TABLE MTN
ROUND MTN
SALT LAKECITY AREA
MEXICO
EL PASOAREA
DEVERSLUGO
SAN FRANCISCO
MIDPOINT
AREA
LOS ANGELESAREA
ALBUQUERQUEAREA
NAVAJO
DENVERAREA
MOJAVE
HOOVERPHOENIX
AREA
LANGDON
HOT SPRINGS
HELLSCANYON
CHIEF JOSEPH
BURNS
PINTO
FOURCORNERS
SHASTA
LANGDON
CANADA
UNITED STATES
66
65
14
8
30
49
31
19
22
34
16
3
35
185
4
6
17
20
23
3236
5051
73
Location of Famous TransmissionConstrained Paths in the
Western Interconnected System
15
Path # WSCC Path Name Path # WSCC Path Name Path # WSCC Path Name
3 Northwest – Canada 18 Idaho – Montana 34 Tot 2B4 West of Cascades – North 19 Bridger West 35 Tot 2C5 West of Cascades – South 20 Path C 36 Tot 36 West of Hatwai 22 Southwest of Four Corners 49 East of Colorado River8 Montana – Northwest 23 Four Corners 345/500 kV 50 Cholla - Pinnacle Peak14 Idaho – Northwest 26 No. - So. Calif. Midway-Vincent 51 Southern Navajo15 Midway - Los Banos 30 Tot 1A 65 Pacific DC Intertie 16 Idaho – Sierra 31 Tot 2A 66 California Oregon Intertie (COI)17 Borah West 32 Pavant – Gonder 230 kV 73 North of John Day
26
Source: Western Governors’ Association, Conceptual Plans for Electricity Transmission
Figure 45 - Transmission Congestion Paths in the West
It should be noted that Path 15 between Northern and Southern California is not on the list because loading data for Path 15 [are] not generally available. However, the Path 15 bottleneck is significant and has contributed to price volatility in the West. A special analysis of Path 15 using 2001 gas prices and hydro conditions similar to last summer was performed. Results showed congestion and spot market differences ($35 and $65 dollars per megawatt hour) between each end of the path.
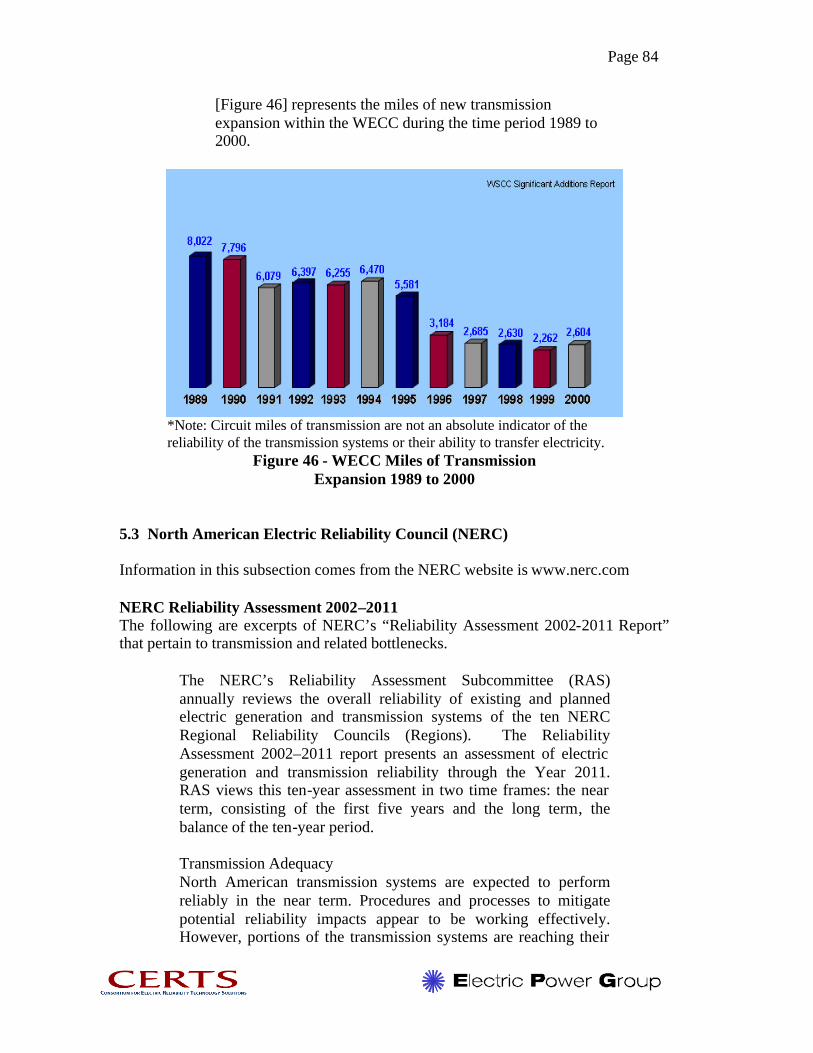
Page 84
[Figure 46] represents the miles of new transmission expansion within the WECC during the time period 1989 to 2000.
*Note: Circuit miles of transmission are not an absolute indicator of the reliability of the transmission systems or their ability to transfer electricity.
Figure 46 - WECC Miles of Transmission Expansion 1989 to 2000
5.3 North American Electric Reliability Council (NERC) Information in this subsection comes from the NERC website is www.nerc.com NERC Reliability Assessment 2002–2011 The following are excerpts of NERC’s “Reliability Assessment 2002-2011 Report” that pertain to transmission and related bottlenecks.
The NERC’s Reliability Assessment Subcommittee (RAS) annually reviews the overall reliability of existing and planned electric generation and transmission systems of the ten NERC Regional Reliability Councils (Regions). The Reliability Assessment 2002–2011 report presents an assessment of electric generation and transmission reliability through the Year 2011. RAS views this ten-year assessment in two time frames: the near term, consisting of the first five years and the long term, the balance of the ten-year period. Transmission Adequacy North American transmission systems are expected to perform reliably in the near term. Procedures and processes to mitigate potential reliability impacts appear to be working effectively. However, portions of the transmission systems are reaching their
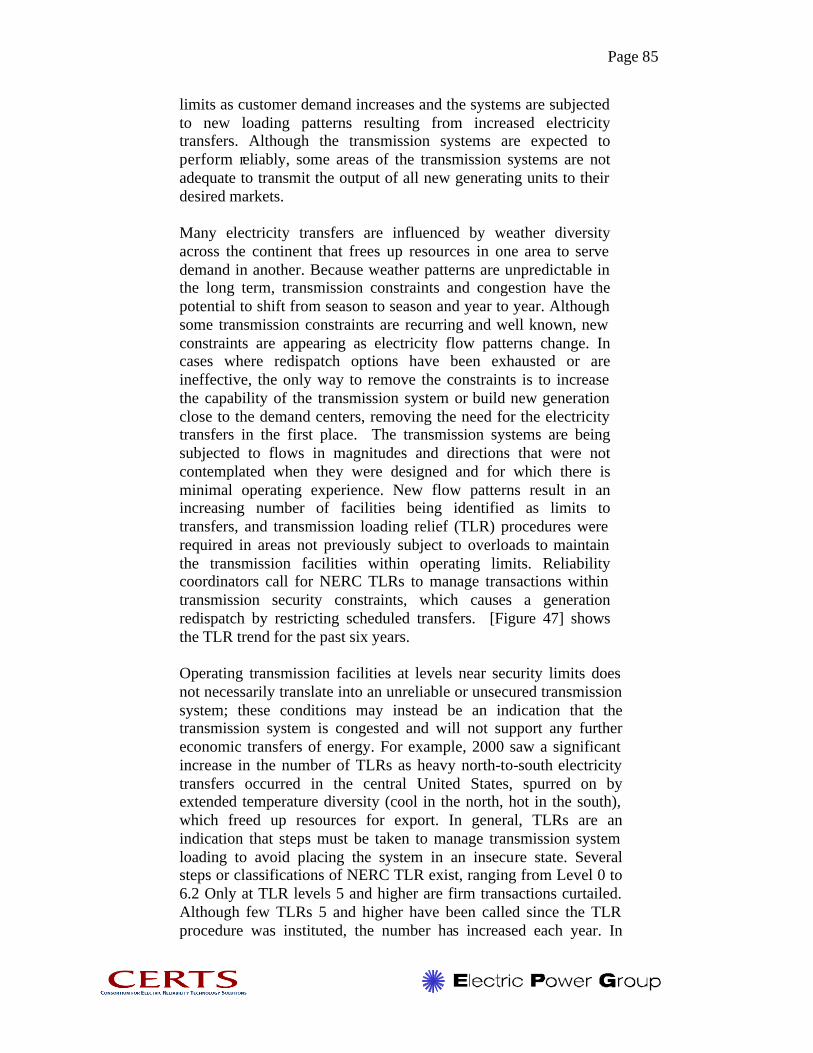
Page 85
limits as customer demand increases and the systems are subjected to new loading patterns resulting from increased electricity transfers. Although the transmission systems are expected to perform reliably, some areas of the transmission systems are not adequate to transmit the output of all new generating units to their desired markets. Many electricity transfers are influenced by weather diversity across the continent that frees up resources in one area to serve demand in another. Because weather patterns are unpredictable in the long term, transmission constraints and congestion have the potential to shift from season to season and year to year. Although some transmission constraints are recurring and well known, new constraints are appearing as electricity flow patterns change. In cases where redispatch options have been exhausted or are ineffective, the only way to remove the constraints is to increase the capability of the transmission system or build new generation close to the demand centers, removing the need for the electricity transfers in the first place. The transmission systems are being subjected to flows in magnitudes and directions that were not contemplated when they were designed and for which there is minimal operating experience. New flow patterns result in an increasing number of facilities being identified as limits to transfers, and transmission loading relief (TLR) procedures were required in areas not previously subject to overloads to maintain the transmission facilities within operating limits. Reliability coordinators call for NERC TLRs to manage transactions within transmission security constraints, which causes a generation redispatch by restricting scheduled transfers. [Figure 47] shows the TLR trend for the past six years.
Operating transmission facilities at levels near security limits does not necessarily translate into an unreliable or unsecured transmission system; these conditions may instead be an indication that the transmission system is congested and will not support any further economic transfers of energy. For example, 2000 saw a significant increase in the number of TLRs as heavy north-to-south electricity transfers occurred in the central United States, spurred on by extended temperature diversity (cool in the north, hot in the south), which freed up resources for export. In general, TLRs are an indication that steps must be taken to manage transmission system loading to avoid placing the system in an insecure state. Several steps or classifications of NERC TLR exist, ranging from Level 0 to 6.2 Only at TLR levels 5 and higher are firm transactions curtailed. Although few TLRs 5 and higher have been called since the TLR procedure was instituted, the number has increased each year. In
Page 86
[Figure 48], the 2002 TLRs listed represent those called through July 2002.
Figure 47 - Total Number of Level Two or Higher TLR Logs
Operating transmission facilities at levels near security limits does not necessarily translate into an unreliable or unsecure transmission system; these conditions may instead be an indication that the transmission system is congested and will not support any further economic transfers of energy. For example, 2000 saw a significant increase in the number of TLRs as heavy north-to-south electricity transfers occurred in the central United States, spurred on by extended temperature diversity (cool in the north, hot in the south), which freed up resources for export. In general, TLRs are an indication that steps must be taken to manage transmission system loading to avoid placing the system in an insecure state. Several steps or classifications of NERC TLR exist, ranging from Level 0 to 6.2 Only at TLR levels 5 and higher are firm transactions curtailed. Although few TLRs 5 and higher have been called since the TLR procedure was instituted, the number has increased each year. In [Figure 48], the 2002 TLRs listed represent those called through July 2002.

Page 87
Figure 48 - Number of Level Five and Higher TLRs per Year
About 10,100 new circuit miles of transmission facilities (230 kV and higher) are planned for construction throughout North America [see Table 15] over the next ten years; the majority of these additions are planned for the first five years, reflecting uncertainty in long-term planning. This amount represents a 5% increase in total installed circuit miles (230 kV and higher) over the ten-year period; most of these additions are intended to address local transmission concerns or to connect proposed new generators to the transmission grid and will not have a significant impact on its capability to transfer electricity over long distances. This table does not include circuit upgrades or reconductoring of existing lines. New transmission line construction is not the only means of ensuring transmission adequacy. In the long term, reliable transmission will depend upon the close coordination of generation and transmission planning and construction.

Page 88
Table 15 - Transmission Circuit Miles 230 kV and Above*
*Note: Circuit miles of transmission are not an absolute indicator of the reliability of the transmission systems or their ability to transfer electricity.
Transmission Planning Although the North American transmission systems are expected to perform reliably, in some areas the transmission grid is not adequate to transmit the output of all new generating units to their desired markets. 10,300 miles of transmission lines, 230 kV and higher are planned to be added, while an estimated 159,000–286,000 MW of new generation may be added by 2011. The planned additions represent an increase of about 30% in generating capacity over currently installed levels compared to a 5% increase in transmission. This mismatch of additions of new transmission lines and new generators may be attributed to a number of factors. Ø First, because of the cost and siting requirements associated with
transmission line construction, transmission is not built on a speculative basis; transmission owners will build transmission sufficient to serve their customer demands only when they can demonstrate a clear need to regulators and the public.
Ø Second, little planned transmission line construction is likely to occur to accommodate economic transfers, even if such additions
Page 89
may benefit large numbers of customers. This reluctance to construct new transmission facilities is similar to the tragedy of the commons in which costs and other negative impacts are concentrated on a limited number of parties, although the benefits are distributed to all parties. With industry restructuring and the development of regional wholesale markets, new transmission lines may be economically beneficial to all parties, including the consumers of electricity, but their costs are incurred by only one or several entities. As a result, those entities may be reluctant to build the needed transmission facilities.
Planning Issues - As the electric industry continues to restructure, identifying those responsible for maintaining adequate electricity supplies is becoming more difficult. Indeed, the very definition of what constitutes an adequate electric supply may change in the future. Transmission expansion as measured by new circuit miles continues to lag the growth of both the demand for electricity and the addition of new generating plants. However, alternatives to new transmission lines exist to maintain the reliability of the system. Impact of Generation Siting The siting of new [generation], whether utility or merchant built can clearly have an impact on the reliability of the interconnected electric systems. For example, locating new generators electrically close to demand centers will cause less of a burden on the transmission systems than generators built in remote locations. In some instances, constructing new generators near demand centers may actually reduce transmission system loadings. The availability of adequate transmission facilities and the cost of building new facilities to integrate new generators into the system are factors that help determine where new generation will be located. Many developers request only an interconnection to the transmission system (the minimum transmission investment) with the intent of operating only in the hourly spot market and do not request firm transmission service to deliver the output of their plants to customers because this could trigger costly transmission infrastructure reinforcements. Although large amounts of new generating capacity will be installed in the next few years, RAS questions its contribution to NERC-wide adequacy in cases where capacity will be isolated due to transmission system constraints [see Figure 49].

Page 90
Figure 49 - Projected New Generation Additions
As a result of the many changes taking place in the electric industry future transmission planning must be accomplished through different means than in the past and involve the coordination among many different market participants. Market signals and regulatory decisions will dictate the location and timing of generating capacity additions, and will influence the construction of new transmission facilities.
5.4 Edison Electric Institute (EEI) Information in this subsection comes from the EEI website is www.eei.org
The following is an excerpt of the paper “Strengthening The Critical Link” by David K. Owens, executive vice president of the business operations group at EEI.
While it represents just 11 percent of the national average cost of delivered electric power, transmission is the vital link to the establishment of robustly competitive wholesale markets. Originally designed as a highway to link generators to loads and to enhance reliability through interconnections with other utilities, the transmission system is being asked to perform functions never intended—to operate as a superhighway.
Well functioning wholesale markets, with robust transmission networks, will lead to an increase in the diversity of supply sources available to evolving retail markets, benefiting customers.
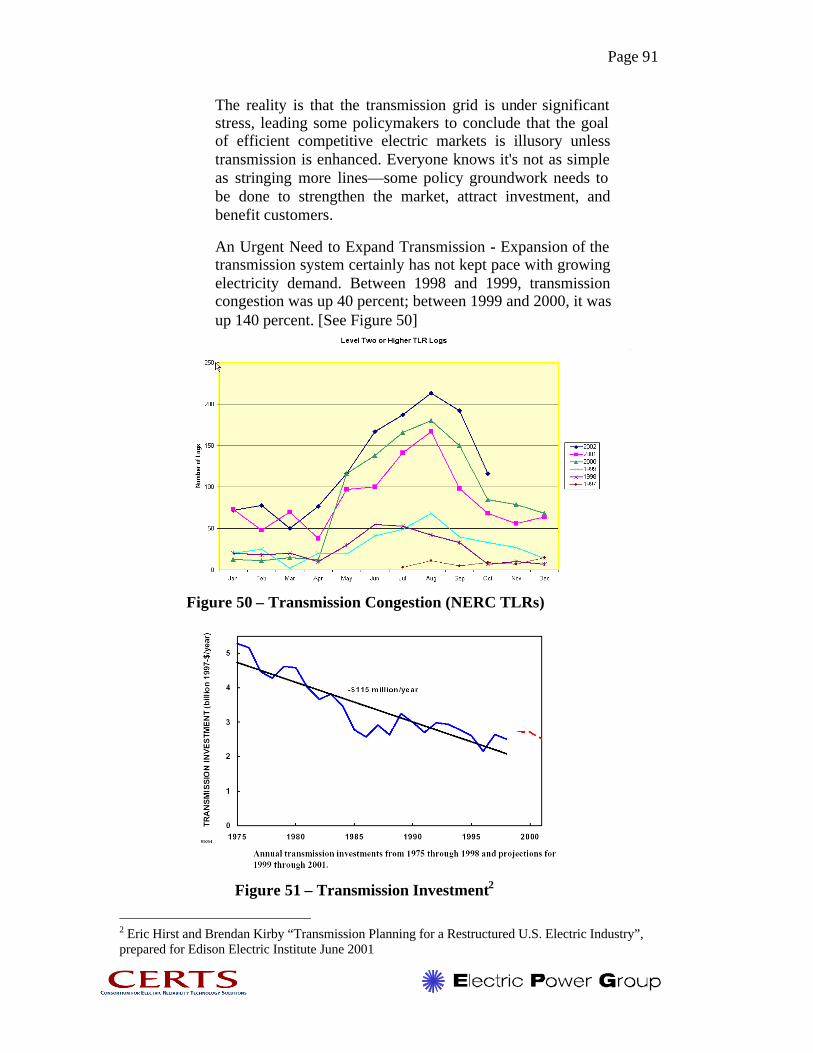
Page 91
The reality is that the transmission grid is under significant stress, leading some policymakers to conclude that the goal of efficient competitive electric markets is illusory unless transmission is enhanced. Everyone knows it's not as simple as stringing more lines—some policy groundwork needs to be done to strengthen the market, attract investment, and benefit customers.
An Urgent Need to Expand Transmission - Expansion of the transmission system certainly has not kept pace with growing electricity demand. Between 1998 and 1999, transmission congestion was up 40 percent; between 1999 and 2000, it was up 140 percent. [See Figure 50]
Figure 50 – Transmission Congestion (NERC TLRs)
Figure 51 – Transmission Investment2
2 Eric Hirst and Brendan Kirby “Transmission Planning for a Restructured U.S. Electric Industry”, prepared for Edison Electric Institute June 2001
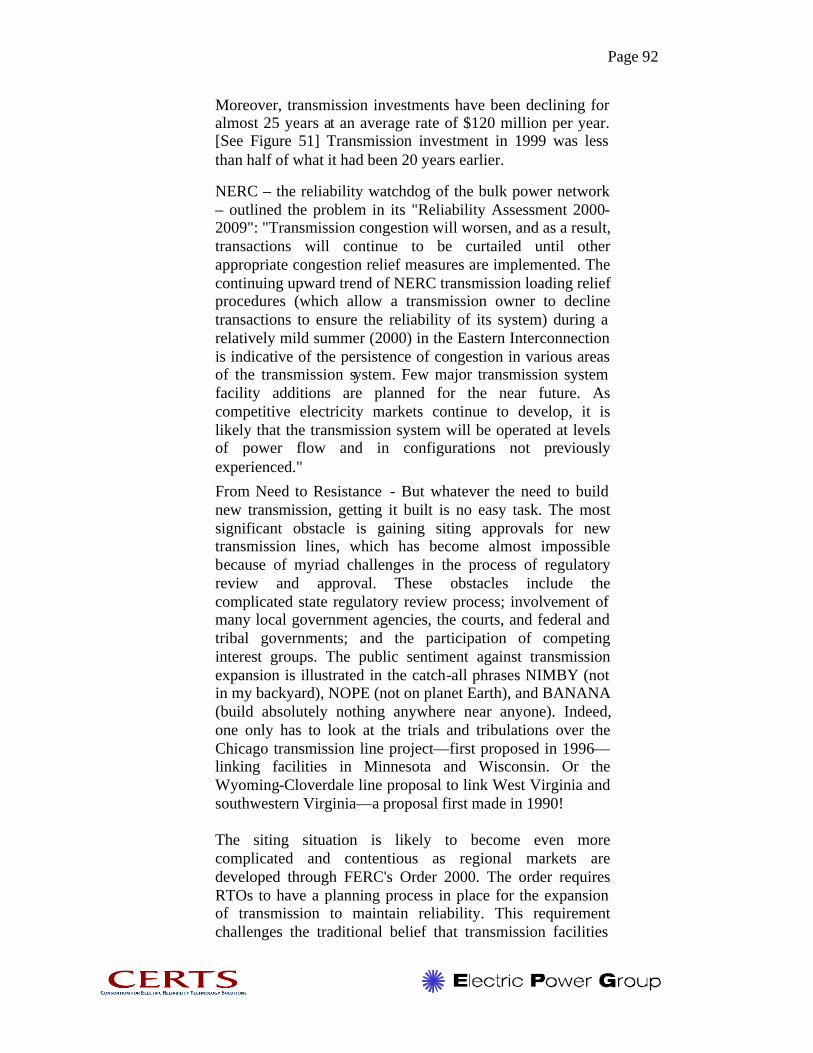
Page 92
Moreover, transmission investments have been declining for almost 25 years at an average rate of $120 million per year. [See Figure 51] Transmission investment in 1999 was less than half of what it had been 20 years earlier.
NERC – the reliability watchdog of the bulk power network – outlined the problem in its "Reliability Assessment 2000-2009": "Transmission congestion will worsen, and as a result, transactions will continue to be curtailed until other appropriate congestion relief measures are implemented. The continuing upward trend of NERC transmission loading relief procedures (which allow a transmission owner to decline transactions to ensure the reliability of its system) during a relatively mild summer (2000) in the Eastern Interconnection is indicative of the persistence of congestion in various areas of the transmission system. Few major transmission system facility additions are planned for the near future. As competitive electricity markets continue to develop, it is likely that the transmission system will be operated at levels of power flow and in configurations not previously experienced." From Need to Resistance - But whatever the need to build new transmission, getting it built is no easy task. The most significant obstacle is gaining siting approvals for new transmission lines, which has become almost impossible because of myriad challenges in the process of regulatory review and approval. These obstacles include the complicated state regulatory review process; involvement of many local government agencies, the courts, and federal and tribal governments; and the participation of competing interest groups. The public sentiment against transmission expansion is illustrated in the catch-all phrases NIMBY (not in my backyard), NOPE (not on planet Earth), and BANANA (build absolutely nothing anywhere near anyone). Indeed, one only has to look at the trials and tribulations over the Chicago transmission line project—first proposed in 1996—linking facilities in Minnesota and Wisconsin. Or the Wyoming-Cloverdale line proposal to link West Virginia and southwestern Virginia—a proposal first made in 1990! The siting situation is likely to become even more complicated and contentious as regional markets are developed through FERC's Order 2000. The order requires RTOs to have a planning process in place for the expansion of transmission to maintain reliability. This requirement challenges the traditional belief that transmission facilities
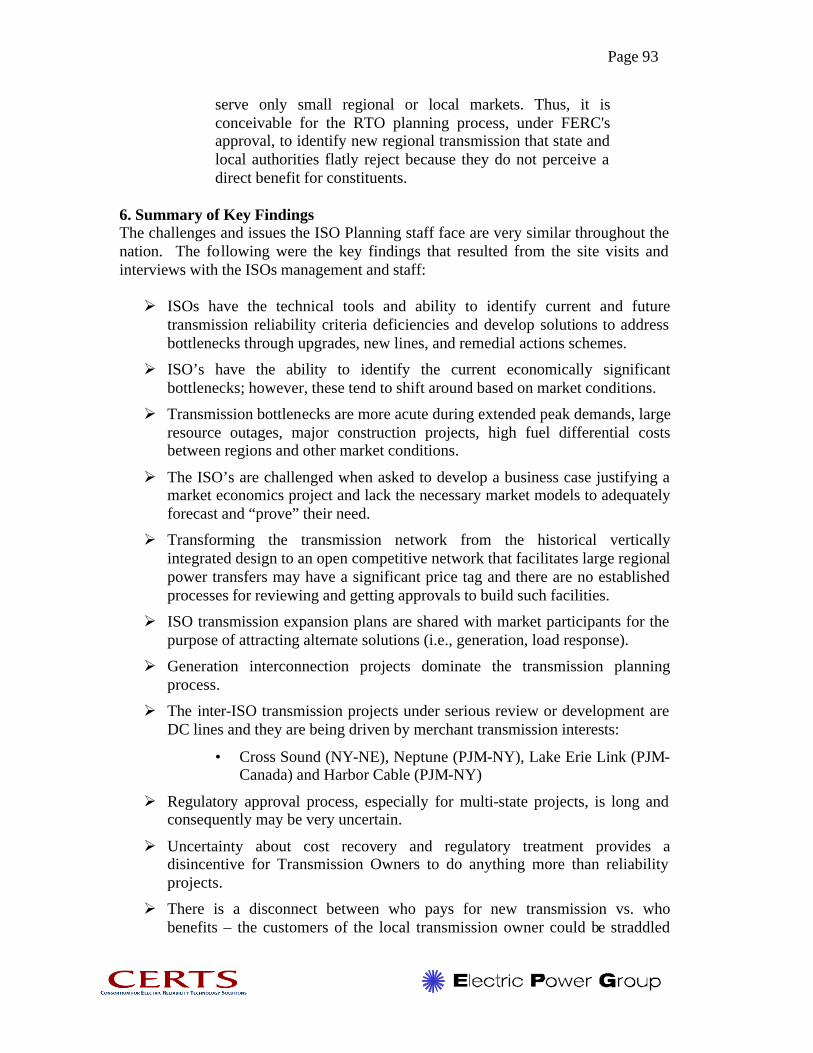
Page 93
serve only small regional or local markets. Thus, it is conceivable for the RTO planning process, under FERC's approval, to identify new regional transmission that state and local authorities flatly reject because they do not perceive a direct benefit for constituents.
6. Summary of Key Findings The challenges and issues the ISO Planning staff face are very similar throughout the nation. The following were the key findings that resulted from the site visits and interviews with the ISOs management and staff: Ø ISOs have the technical tools and ability to identify current and future
transmission reliability criteria deficiencies and develop solutions to address bottlenecks through upgrades, new lines, and remedial actions schemes.
Ø ISO’s have the ability to identify the current economically significant bottlenecks; however, these tend to shift around based on market conditions.
Ø Transmission bottlenecks are more acute during extended peak demands, large resource outages, major construction projects, high fuel differential costs between regions and other market conditions.
Ø The ISO’s are challenged when asked to develop a business case justifying a market economics project and lack the necessary market models to adequately forecast and “prove” their need.
Ø Transforming the transmission network from the historical vertically integrated design to an open competitive network that facilitates large regional power transfers may have a significant price tag and there are no established processes for reviewing and getting approvals to build such facilities.
Ø ISO transmission expansion plans are shared with market participants for the purpose of attracting alternate solutions (i.e., generation, load response).
Ø Generation interconnection projects dominate the transmission planning process.
Ø The inter-ISO transmission projects under serious review or development are DC lines and they are being driven by merchant transmission interests:
• Cross Sound (NY-NE), Neptune (PJM-NY), Lake Erie Link (PJM-Canada) and Harbor Cable (PJM-NY)
Ø Regulatory approval process, especially for multi-state projects, is long and consequently may be very uncertain.
Ø Uncertainty about cost recovery and regulatory treatment provides a disincentive for Transmission Owners to do anything more than reliability projects.
Ø There is a disconnect between who pays for new transmission vs. who benefits – the customers of the local transmission owner could be straddled

Page 94
with the costs of fixing bottlenecks while those benefiting may be located several states away.
Ø A market design that does not include LMP creates disincentives in many cases – congestion costs added to uplift are spread over all users of transmission.
Ø The minimum interconnection standard for new generators does not ensure deliverability and as a result it creates stranded generation pockets, does not address regional adequacy issues and puts the planning process in a reactionary mode.
Ø Generation solutions have shorter lead times versus those for transmission projects and can provide a quicker fix to many bottlenecks, but recent generation project cancellations around the nation are creating challenges for the grid planners and eventually customers.
Ø There is limited data available on planned new generation projects to support ISO long term planning studies.
Ø Among the six ISOs there is not a common definition or method of monitoring and tracking congestion.
7. Transmission Bottlenecks Sorted and Prioritized
The Electricity Advisory Board’s report states that “‘A National Interest Transmission Bottleneck’ must meet at least one of the following criteria”: Ø The bottleneck jeopardizes national security Ø The bottleneck creates a risk of widespread grid reliability problems or the
likelihood that major customer load centers will be without adequate electricity supplies
Ø The bottleneck creates the risk of significant consumer cost increases in electricity markets that could have serious consequences for the national or a broad regional economy or the risk of significant consumer cost increases over an area or region
In addition to the “national interest” criteria specified above, the subcommittee believes that the following factors could appropriately be used to provide additional support for particular facilities being identified as a “National Interest Transmission Bottleneck”: Ø Does the level of congestion result in an unacceptable number of
transmission loading relief (“TLR”) events? Ø Does the level of congestion result in unacceptably high price differentials
across an interface? Ø Does the transmission deficiency increase the likelihood that market
power will be exercised in a manner contrary to the public interest? Using the criteria noted above and supplemental information from each ISO, the bottlenecks identified by the ISOs were sorted according to their impacts on grid
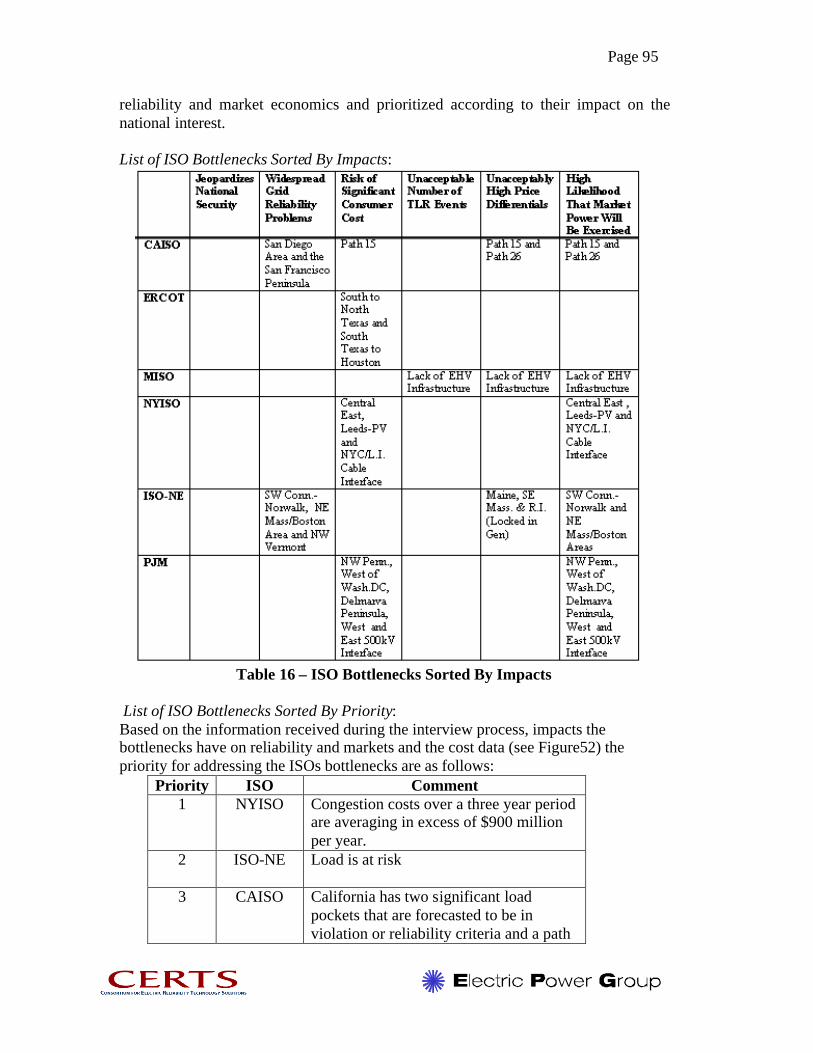
Page 95
reliability and market economics and prioritized according to their impact on the national interest. List of ISO Bottlenecks Sorted By Impacts:
Table 16 – ISO Bottlenecks Sorted By Impacts
List of ISO Bottlenecks Sorted By Priority: Based on the information received during the interview process, impacts the bottlenecks have on reliability and markets and the cost data (see Figure52) the priority for addressing the ISOs bottlenecks are as follows:
Priority ISO Comment 1 NYISO Congestion costs over a three year period
are averaging in excess of $900 million per year.
2 ISO-NE Load is at risk
3 CAISO California has two significant load pockets that are forecasted to be in violation or reliability criteria and a path

Page 96
that has inhibited transactions between the northern and southern portions of the state.
4 PJM PJM’s congestion costs continue a four year trend of almost doubling each year, but the majority of 2002 increase is a result of adding PJM West to its market.
5 MISO At this time, the true congestion costs are unknown. Region will have difficulty operating an efficient market with the limited EVH infrastructure in the region.
6 ERCOT ERCOT will need to expand its transfer capability to accommodate new generation and achieve market efficiency.
Table 17 – ISO Bottlenecks Sorted By Priority
Figure 52 - ISO Congestion Costs by Year List of Transmission Project Costs: Table 18 below indicates the costs associated with some of the proposed transmission projects to relieve congestion:
ISO Project Cost (Million)
CAISO Path 26 $306 Imports into San Diego $252
ERCOT Two 345 kV lines from West Texas to North Texas
$140

Page 97
MISO Vision EHV Infrastructure $7,000
Gains Substation – add a second 345/138 kV transformer bank – needed to serve load growth in the area of Grand Rapids, Michigan
$7
NYISO Marcy-New Scotland 345 kV circuit – line
originally built for 765 kV could be converted from single to double circuit
$75
Rebuild two 115 kV lines out of Leeds to 345 kV $225
ISO-NE Build a 345 kV loop around the Southwestern Connecticut area (Phase 1 and 2)
$600
Reinforce Northwest Vermont load pocket $125
PJM Adding 500/230 kV transformers at Doubs Substation (Northwest of Washington, DC)
$22
Table 18 – Transmission Project Costs
Page 98
8. References [1] “National Transmission Grid Study” - U.S. Department of Energy, May 2002.
Available on the Internet at http://tis.eh.doe.gov/ntgs/ [2] “Transmission Grid Solutions Report” – DOE Electricity Advisory Board,
Transmission Grid Solution Subcommittee report to DOE, September 2002. Available on the Internet at http://www.eab.energy.gov/
[3] California Independent System Operator’s web site home page is
www.caiso.com and Transmission Planning information is located at www1.caiso.com/thegrid/planning
[4] Armando Pereze’s rebuttal testimony on behalf of the CAISO before the CPUC,
for a Certificate of Public Convenience and Necessity Authorizing the Construction of the Los Banos-Gates 500 kV Transmission Project, November 15, 2001
[5] Electric Reliability Council of Texas web site home page is www.ercot.com/
and Transmission Planning information is located at -www.ercot.com/Participants/SystemPlanning.htm
[6] “2002 Report on Existing and Potential Electric System Constraints and Needs
within the ERCOT Region”, presented by Kenneth A. Donohoo, ERCOT’s Manager System Planning Transmission Services, November 5, 2002
[7] Midwest ISO’s web site home page is www.midwestiso.org and its
Transmission Planning information is located at www.midwestiso.org/plan_inter/index.shtml
[8] “Power the Plaines” presentation by Dale Osborn, MISO, in his on Sept. 9,
2002, [9] New York Independent System Operator’s web site home page is
www.nyiso.com and the Transmission Planning site is www.nyiso.com/services/planning.html
[10] NPCC’s Guidelines for Area Transmission Reviews, revision date November
7, 2001 www.nyiso.com/services/planning.html [11] “The TX-Factor in the Development of Competitive Electricity Markets”, Prepared by
the New York Independent System Operator for the New York State Public Service Commission Version 2, 11/26/2002
[12] New England Independent System Operator web site home page is www.iso-
ne.com and the URL for the Regional Transmission Expansion Plan (RETEP02) is www.iso-ne.com/transmission/Regional_Transmission_Expansion_ Plan/Transmission_ Expansion_Advisory_Committee/
Page 99
[13] PJM Interconnection web site home page is www.pjm.com and the Regional
Transmission Expansion Plan can be located by selecting “Regional Transmission Expansion Planning” on the home page.
[14] PJM’s “State of the Market Report, Section 1, 2002”, -
http://www.pjm.com/market_monitoring/reports/mar/20030305_som_final_web.pdf [15] FERC’s Northeast Energy Infrastructure Conference, Overview of Energy
Infrastructure by Jeff Wright, Office of Energy Projects, FERC, New York, New York, January 31, 2002. Available on the Internet at www.ferc.gov
[16] FERC’s Midwest Energy Infrastructure Conference, Overview of Energy
Infrastructure by Jeff Wright, Office of Energy Projects, FERC, Chicago, Illinois, November 13, 2002. Available on the Internet at www.ferc.com
[17] FERC’s Southeast Energy Infrastructure Conference, Overview of Energy
Infrastructure by Jeff Wright, Office of Energy Projects, FERC, Orlando, Florida, May 9, 2002. Available on the Internet at www.ferc.com
[18] “Conceptual Plans for Electricity Transmission in the West Report” to the
Western Governors’ Association, August 2001. The WGA’s website is www.westgov.org.
[19] “Reliability Assessment 2002-2011 Report” to the North American Electric
Reliability Council (NERC) Board. Available on the Internet at NERC’s website is www.nerc.com
[20] “Strengthening the Critical Link” – David Owens, Edison Electric Institute
report, 2001. Available on the Internet at EEI’s website www.eei.org