conservation genetics and phylogeography of endangered and
TRANSCRIPT

RESEARCH ARTICLE Open Access
Conservation genetics and phylogeographyof endangered and endemic shrub Tetraenamongolica (Zygophyllaceae) in Inner Mongolia,ChinaXue-Jun Ge1†, Chi-Chuan Hwang2†, Zin-Huang Liu3†, Chi-Chun Huang4†, Wei-Hsiang Huang3, Kuo-Hsiang Hung5,Wei-Kuang Wang4*, Tzen-Yuh Chiang4*
Abstract
Background: Tetraena mongolica (Zygophyllaceae), an endangered endemic species in western Inner Mongolia,China. For endemic species with a limited geographical range and declining populations, historical patterns ofdemography and hierarchical genetic structure are important for determining population structure, and alsoprovide information for developing effective and sustainable management plans. In this study, we assess geneticvariation, population structure, and phylogeography of T. mongolica from eight populations. Furthermore, weevaluate the conservation and management units to provide the information for conservation.
Results: Sequence variation and spatial apportionment of the atpB-rbcL noncoding spacer region of thechloroplast DNA were used to reconstruct the phylogeography of T. mongolica. A total of 880 bp was sequencedfrom eight extant populations throughout the whole range of its distribution. At the cpDNA locus, high levels ofgenetic differentiation among populations and low levels of genetic variation within populations were detected,indicating that most seed dispersal was restricted within populations.
Conclusions: Demographic fluctuations, which led to random losses of genetic polymorphisms from populations,due to frequent flooding of the Yellow River and human disturbance were indicated by the analysis of BEASTskyline plot. Nested clade analysis revealed that restricted gene flow with isolation by distance plus occasional longdistance dispersal is the main evolutionary factor affecting the phylogeography and population structure of T.mongolica. For setting a conservation management plan, each population of T. mongolica should be recognized asa conservation unit.
BackgroundGenetic variation within and among natural populationsis crucial for the long-term survival of a species. Anaccurate estimate of the level and distribution of geneticdiversity of threatened species provides fundamentalinformation in designing conservation programs [1,2].Tetraena mongolica Maxim, a monotypic genus of theZygophyllaceae, is endemic to the western part of InnerMongolia around the basin of the Yellow River [3], and
is also subjected as nationally endangered in China [4].Plants of T. mongolica, up to 0.5 m in height, flowerfrom mid-May till early June, and set fruits in July. Thespecies is restrictedly distributed in the western Gobi,the largest desert in Asia characterized by extreme lowannual rainfall [3], where T. mongolica with a fullydeveloped root system is well adapted and becomeslocally dominant. T. mongolica plays an important eco-logical role as windbreak for stabilizing river bank [5].Nevertheless, it has been used as firewood, locally calledas “oil firewood” because its stems are combustible evenin fresh state due to containing high levels of triacylgly-cerol [6]. Human’s overexploitation has inevitablycaused a dramatic decline of the species.
* Correspondence: [email protected]; [email protected]† Contributed equally4Department of Life Sciences, National Cheng-Kung University, Tainan 701,TaiwanFull list of author information is available at the end of the article
Ge et al. BMC Genetics 2011, 12:1http://www.biomedcentral.com/1471-2156/12/1
© 2011 Ge et al; licensee BioMed Central Ltd. This is an Open Access article distributed under the terms of the Creative CommonsAttribution License (http://creativecommons.org/licenses/by/2.0), which permits unrestricted use, distribution, and reproduction inany medium, provided the original work is properly cited.

Previous studies have been focusing on the biologicalcharacters causing the population decline of T. mongo-lica. As the high rate of ovule abortion after anthesis[7], the seed-set of T. mongolica was quite low (1.3 -2.8%) in the natural populations [8,9]. Previous popula-tion genetic researches based on allozyme and ISSR datarevealed medium levels of genetic differentiation amongpopulations of T. mongolica [3,10].Understanding levels and spatial partitioning of
genetic polymorphisms in an endangered species pro-vides sufficient information for conservation practices.This kind of researches has become increasingly popularin the recent years, with the development of analyticalmethods to take phylogenetic distinctiveness intoaccount when setting conservation priorities [11,12].During the past few decades, the theoretical frameworkof population genetics and empirical data gathered withthe help of molecular genetic methods have been widelyused in conservation biology [13]. Given a haploid nat-ure and a low frequency of genetic recombination,molecular markers of organelle DNA have been longused for phylogenetic reconstruction at various taxo-nomic levels, conservation genetics, and assessing themigratory routes of species [14,15]. Although chloroplastDNA evolves relatively slowly, moderate to high levels ofgenetic variation have frequently been detected in somenoncoding spacers within and among species [16-18].With maternal inheritance [19], cpDNA is suitable forinvestigating processes associated with seed dispersal,such as range expansions [20] and the contribution ofseed movement to total gene flow [21,22].For endemic species with a limited geographical range
and declining populations, historical patterns of demo-graphy and hierarchical genetic structure are importantfor determining population structure, and also provideinformation for developing effective and sustainablemanagement plans [23]. In this study, we investigatedgenetic variation, population structure, and phylogeogra-phy of T. mongolica from eight populations throughoutthe entire distribution range. Several aims are pursued:1) to examine the levels of genetic variation within andbetween populations, 2) to reconstruct phylogeographi-cal patterns and examine the extent of genetic differen-tiation among populations, and 3) to identify theconservation and management units based on geneticevidence, to provide the information for the develop-ment of effective and efficient conservation practices forthis species.
ResultsGenetic diversity and cpDNA phylogeny of T. mongolicaNo within-individual variation was detected in the non-coding spacer between atpB and rbcL genes of thechloroplast DNA. Identical sequences were obtained
from five clones derived from the same amplificationreaction, indicating no PCR artifacts caused by Taqpolymerase or sequencing errors. The atpB-rbcL inter-genic region of cpDNA in T. mongolica varied from 872to 880 base pairs (bp) in length. The cpDNA sequenceswere aligned with a consensus length of 881 bp, ofwhich 46 sites (5.2%) were variable.The chloroplast spacer is A/T rich with an average
content of 73.6%, which is consistent with the nucleo-tide composition of most noncoding spacers and pseu-dogenes because of low functional constraints [24]. Intotal, 38 haplotypes (GenBank accession numbers ofHQ142910-HQ142986) were identified from 77 indivi-duals of T. mongolica, with an estimated haplotypediversity of h = 0.962 ± 0.009 (Table 1; Figure 1). Exceptfor the monomorphic population of YKBLG, haplotypediversity varied across populations, ranging between0.378 (GLS) and 1.000 (HN). Low levels of nucleotidedifference were detected within the whole species (θ =0.00447 ± 0.0003) and within populations, ranging fromθ = 0.00099 (TST) to 0.00405 (HN).A neighbor-joining tree obtained using MEGA recov-
ered eight cpDNA clades (Figure 2). Most of the popu-lations contained only one clade in the geneticcomposition, except for the populations XD and HN.Apparently, most genetic variation resides between popu-lations of T. mongolica.
Nested clade analysis, phylogeography and populationdifferentiationA nested clade analysis was accomplished by linkingnucleotide haplotypes in a hierarchical manner basedon mutational changes. After linking the haplotypesinto a clade, closely related clades were linked furtherto form a higher-level group; via such hierarchical link-ing, a nested network was drawn (Figure 3). In total, 38haplotypes (H1-H38) and 8 clades, 1-1 to 1-8, wereidentified. The distribution of haplotypes and clades inpopulations was indicated in Tables 2 and 3. Clades 1-1 to 1-3 were clustered into clade 2-1, which wasfurther grouped with clade 2-2 into a higher-level clade3-1. Likewise, clades 2-3 and 2-4, which consisted ofclades 1-4 to 1-5 and 1-6 to 1-7, respectively, wereclustered and nested with clade 2-5 in the higher-levelclade 3-2. Clades 3-1 and 3-2 corresponding to cladesG-H and A-E of the NJ tree, respectively, were identi-fied. The former is distributed in the southern part ofthe distributional range, while the latter is in the north-ern part. The topology showing geographical division isshared by the minimum spanning network and the NJtree. Most populations were genetically differentiated,as most haplotypes were private within populationsexcept for H11, which were shared by populations TSTand HN (Table 2).
Ge et al. BMC Genetics 2011, 12:1http://www.biomedcentral.com/1471-2156/12/1
Page 2 of 12

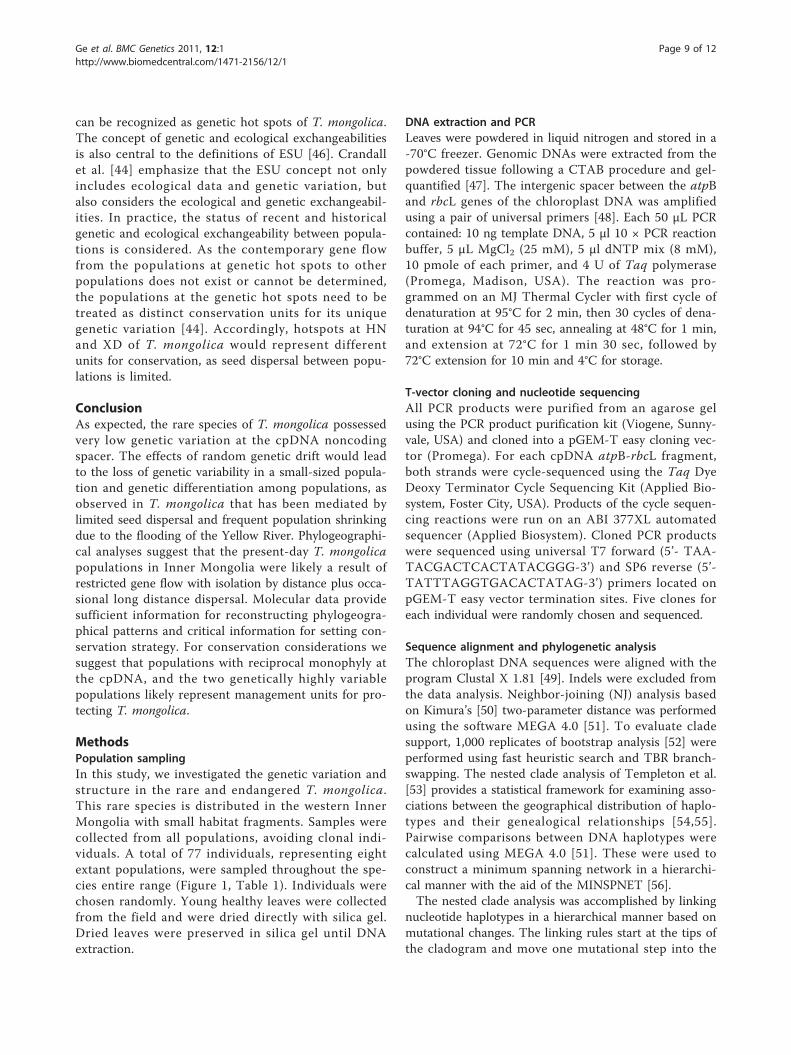
A nested contingency analysis detected significant geo-graphical associations within several clades (2-1, 2-3,2-4, 3-1 and 3-2) and the whole cladogram. The phylo-geographical inferences are listed in Figure 4. Most tip-clades were restricted to unique regions, whereas basalinterior clade 1-4 was widespread (Table 3, Figure 3).The results agree with the hypothesis of constrainedseed dispersal of the species. The deduced Nm of 0.04-0.71 and FST of 0.38-0.90 indicated high levels of geneticdifferentiation between all populations, with threeexceptional pairs of HN-TST, HN-XD and XD-TST
(Table 4). An “isolation by distance” model across eightpopulations of the species was supported by a regressiontest between Nm values and geographical distance (R =0.772, P < 0.05).Relative values of Dc and Dn for each clade represent-
ing contemporary distributions of haplotypes were usedto interpret historical and contemporary gene flow pro-cesses (Figure 4). Restricted gene flow with isolation bydistance was the primary process responsible for thepresent-day distribution in Inner Mongolia (total clado-gram), also inferred for clade 2-3. While some other
Table 1 Population locations, numbers of sample size and site coordinate of Tetraena mongolica, the estimates ofhaplotype diversity (h) and nucleotide difference (θ) within populations on cpDNA sequences.
Population Code Site coordinate Elevation Samplesize (N)
Number ofhaplotypes
Polymorphicsites (S)
h ± SD θ ± SD
1. Shizuishan SZS 106°49’E 39°25’N 1130 m 10 4 4 0.733 ± 0.120 0.00146 ± 0.00037
2. Hainanqu HN 106°54’E 39°33’N 1280 m 10 10 9 1.000 ± 0.045 0.00405 ± 0.00041
3. Qianlishan GLS 106°50’E 39°50’N 1170 m 10 3 7 0.378 ± 0.181 0.00160 ± 0.00105
4. Xindi XD 106°46’E 39°52’N 1090 m 10 7 9 0.933 ± 0.062 0.00334 ± 0.00069
5. Yikebulage YKBLG 106°49’E 40°05’N 1070 m 8 1 0 0.000 ± 0.000 0.00000 ± 0.00000
6. Taositu TST 106°54’E 40°09’N 1070 m 10 4 3 0.644 ± 0.152 0.00099 ± 0.00030
7. Muoshigou MSG 107°04’E 40°07’N 1380 m 10 4 3 0.733 ± 0.101 0.00110 ± 0.00025
8. Balagong BLG 107°03’E 40°16’N 1100 m 9 6 9 0.833 ± 0.016 0.00249 ± 0.00066
Overall 77 38 44 0.962 ± 0.009 0.00447 ± 0.00030
Figure 1 Map showing population locations of Tetraena mongolica sampled. Population names are 1. Shizuishan, 2. Hainanqu, 3.Qianlishan, 4. Xindi, 5. Yikebulage, 6. Taosita, 7. Muoshigou, 8. Balagong.
Ge et al. BMC Genetics 2011, 12:1http://www.biomedcentral.com/1471-2156/12/1
Page 3 of 12

different inferences, like long distance colonization andpast fragmentation were detected at clade clades 3-1and 3-2, respectively. This result shows limited seed dis-persal of this species, while with occasional long dis-tance dispersal [25].
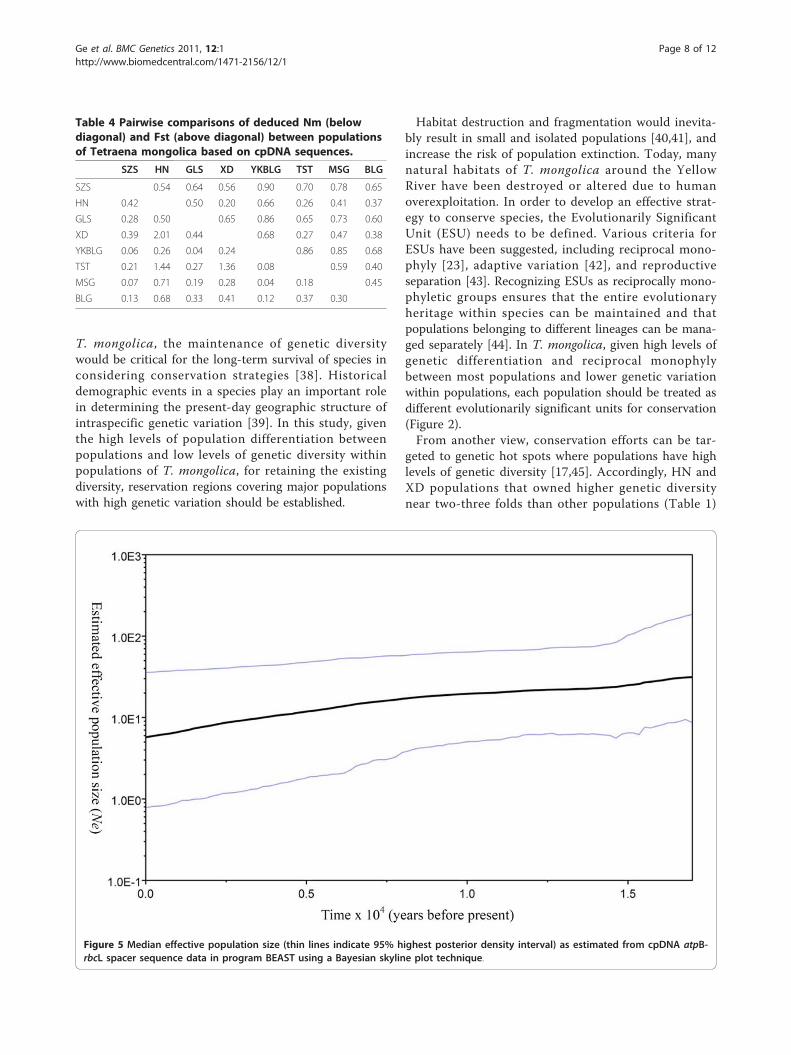
Population demography pattern of T. mongolicaHistorical population dynamics of T. mongolica was esti-mated using Bayesian skyline plots, a coalescent Markovchain Monte Carlo method that does not require anassumed parametric model of demographic history.
Figure 2 Neighbor-joining tree of Tetraena mongolica based on sequences of the atpB-rbcL intergenic spacer of cpDNA. Numbers atnodes are bootstrap values. See Table 1 for the acronyms of population names.
Ge et al. BMC Genetics 2011, 12:1http://www.biomedcentral.com/1471-2156/12/1
Page 4 of 12

The skyline diagrams, which summarize instantaneousestimates of effective population size, showed recentpopulation decline for T. mongolica over the last sixteenthousand years (Figure 5). The shape of the skyline dia-gram conforms to its known history. That is, habitatdestruction and misapplication of human activity andthe frequent flooding of the Yellow River may havecaused a decline in T. mongolica population size.
DiscussionGenetic variation of the atpB-rbcL noncoding spacer ofcpDNA in T. mongolicaIn this study, we investigated the phylogeographical pat-tern and population structure of endangered T. mongo-lica in western Inner Mongolia. In total, 38 haplotypeswere detected at the cpDNA atpB-rbcL locus in T. mon-golica. The level of genetic variation of cpDNA is com-parable to that of other endangered shrub plants, e.g.,Dunnia sinensis (θ = 0.0022) [26], and Hygrophilapogoncalyx (θ = 0.00343) [17], but is lower compared toother endangered species, e.g., θ = 0.01018 for thecpDNA trnD-trnT spacer of Cunninghamia konishii[27], and θ = 0.01268 for the cpDNA atpB-rbcL spacerof Cycas taitungensis [28]. The twofold lower nucleotidediversity to above endangered species in T. mongolica
may be ascribed to its extremely small effective popula-tion size associated with the low seed set in wild (1.3-2.8%) [9].Recent habitat loss has reduced the number and size
of T. mongolica populations [10]. Small populations ofnarrowly distributed species are expected to exhibit lowlevels of genetic variation, but high levels of genetic dif-ferentiation among populations, which were all detectedin this species (Table 4) [2]. Interestingly, different levelsof genetic variation were detected in different popula-tions. The HN and XD populations possessed more hap-lotypes and higher genetic diversity than others, whereasYKBLG population displayed genetic homogeneity(Table 1). The lack of genetic variability in some popu-lations, e.g. SZS, MSG and TST, near threefold lower innucleotide diversity, was likely associated with frequentlyhuman activities. In contrast, some populations ofT. mongolica experienced relatively little disturbancedue to low accessibilities [3,10].Our previous study revealed medium levels of genetic
differentiation among populations of T. mongolica basedon ISSR data [10]. In contrast, in cpDNA spacer highergenetic differentiation was detected between populationsthan in ISSR fingerprinting. The difference may behighly associated with the reproductive characteristics of
Figure 3 Minimum-spanning network based on mutations between haplotypes of the atpB-rbcL noncoding spacer of cpDNA ofTetraena mongolica.
Ge et al. BMC Genetics 2011, 12:1http://www.biomedcentral.com/1471-2156/12/1
Page 5 of 12

the species. It has been known that gene flow of seedplants occurs either via pollen prior to fertilization orseeds. In this study, T. mongolica is primarily pollinatedby insects [29]. Gene flow between populations via pol-len would be limited by the migratory capacity of polli-nators. In addition, seed dispersal of seeds fromschizocarp, a dry fruit developing from four carpels, isconstrained by gravity [29], likely resulting in most seeddispersal confined to short distances. With maternal
inheritance and haploid nature, chloroplast DNA issuitable for estimating the contribution of seed move-ment to total gene flow [21], whereas, ISSRs representnuclear DNA, mostly carried and dispersed by pollendispersal [30]. In this study, higher genetic differentia-tion between all populations in cpDNA than in ISSR islikely ascribed to limited seed dispersal.The BEAST skyline plot for cpDNA spacer identified a
recent population decline ever since sixteen thousandyears before present likely associated with humandestruction as T. mongolica has long been used as fire-wood (Figure 5) [6]. Ecologically, this plant is still oneof the dominant shrubs in Inner Mongolia. Through theanalysis of skyline plot, we were able to recover the his-tory of a long term human disturbance that caused adecline in population size of T. mongolica.Another major factor that shaped the phylogeography
and population demography is the frequent flooding ofthe Yellow River, the second longest river in China [31].The floods not only eroded river banks, but resulted inmany habitats submerged, inevitably leading to popula-tion extinction. In addition to bank erosion, the YellowRiver is well known for its heavy load of silt. Soil depos-its elevate the riverbed and cause flows between naturallevees. The river may break out of the levees into thesurrounding lower flood plain and adopt a new route.Records indicate that the events have occurred aboutonce every century [32]. Such devastations caused dra-matic changes of flora and fauna along the Yellow River.Geological records indicate that the river’s levees werebreached more than 1,500 times and its course changed26 times in the last 3,000 years [32]. Given such fre-quent flooding, T. mongolica would have experienceddemographic fluctuations over and over. That is, severeperiodical population bottlenecks followed by subse-quent demographic expansion would elevate geneticdrift effects and lead to a loss of genetic variation[33,34].
Phylogeography and conservation of T. mongolicaIn this study, gene genealogy of cpDNA in T. mongolicawas recovered (Figures 2 and 3). Eight cpDNA cladeswere identified in the NJ tree. Most of the populationscontained only one clade in the genetic composition,displaying a pattern of most genetic variation residingbetween populations. Nested contingency analysis discri-minating the geographical associations of haplotypesand clades provides further insights into historicalevents that shaped the phylogeography (Figure 4). Atthe total cladogram, restricted levels of Dc vs. a largeDn illustrates restricted gene flow with isolation by dis-tance as the primary process responsible for the pre-sent-day distribution of T. mongolica in Inner Mongolia.As cpDNA is maternally inherited, this inference
Table 2 Individual number and geographical distributionof haplotypes in populations of Tetraena mongolicabased on cpDNA data.
SZS HN GLS XD YKBLG TST MSG BLG Total
H01 1 1
H02 8 8
H03 1 1
H04 1 1
H05 1 1
H06 1 1
H07 1 1
H08 1 1
H09 1 1
H10 2 2
H11 1 6 7
H12 1 1
H13 1 1
H14 1 1
H15 1 1
H16 2 2
H17 2 2
H18 2 2
H19 1 1
H20 4 4
H21 1 1
H22 4 4
H23 1 1
H24 1 1
H25 4 4
H26 1 1
H27 1 1
H28 1 1
H29 1 1
H30 8 8
H31 1 1
H32 1 1
H33 1 1
H34 5 5
H35 1 1
H36 2 2
H37 2 2
H38 1 1
Total 10 10 10 10 8 10 10 9 77
Ge et al. BMC Genetics 2011, 12:1http://www.biomedcentral.com/1471-2156/12/1
Page 6 of 12

indicates limited seed dispersal. Besides, long distancecolonization was also observed in clade 3-1, a commonphenomenon occurring over glacial maxima [25].Furthermore, past fragmentation observed in clade 3-2was likely associated with the Yellow River flooding.It is expected that endangered species that are nar-
rowly distributed and own a small population size
would have high risks of extinction, especially whengene flow between populations is restricted [1,35].Another consequence of a small-sized population is thesusceptibility to inbreeding, which reduces heterozygos-ity and the performance of various fitness-related traits,thereby substantially increasing the probability of extinc-tion [36,37]. Given small sizes in the wild populations of
S: significantly small L: significantly large
Clade Clade Key InferencesClade 2-1 1.2.11.12.13: Yes Long distance colonization Clade 2-3 1.2.3.4: No Restricted gene flow with isolation by distanceClade 2-4 1.2.11.12.13: Yes Long distance colonization Clade 3-1 1.2.11.12: No Contiguous range expansion Clade 3-2 1.2.3.4.9: No Past fragmentationTotal cladogram 1.2.11.17.4: No Restricted gene flow with isolation by distance
Clade Dc Dn Tip/interior Clade Dc Dn Tip/interior Clade Dc Dn Tip/interior
1-1 0 S 65.7 L Tip 2-1 63.4 L 59.2 L Tip 3-1 55.3 S 95.8 L Tip1-2 0 S 61.3 L Interior 2-2 0 S 43.6 S InteriorI / T 0 S -4.8 I / T -63.4 S -15.7 S
1-4 61.4 70.8 L Interior 2-3 69.9 71.3 L Interior1-5 42.6 S 67.0 TipI / T 18.9 3.8
1-6 30.4 S 59.4 L Tip 2-4 59.9 62.3 Tip 3-3 65.6 S 82.4 S Tip1-7 0 S 60.5 L Interior 2-5 0 S 57.2 TipI / T -30.4 S 1.1 I / T 30.0 L 10.7 L
Figure 4 Result of the nested clade analysis. Clade (Dc) and nesting clade (Dn) distances are given for each level of the nesting design.Superscripts refer to significantly small (S) or large (L) clade and nested clade distances. Inferences of current population structure and populationhistory based on nested clade analysis and the interpretation key given in Templeton et al. (1995) are indicated at the bottom of the figure.
Table 3 Number of individuals and geographical distribution of clades in populations of Tetraena mongolica based oncpDNA data.
Cladea Individual (n) SZS HN GLS XD YKBLG TST MSG BLG
1-1 10 10
1-2 10 10
2-1 20 (26.0%) 10 10
1-3 6 6
2-2 6 (7.8%) 6
3-1 26 (33.8%) 10 6 10
1-4 12 2 10
1-5 9 2 7
2-3 21 (27.3%) 4 7 10
1-6 11 3 8
1-7 9 9
2-4 20 (25.9%) 3 8 9
1-8 10 10
2-5 10 (13.0%) 10
3-2 51 (66.2%) 4 10 8 10 10 9
Total 77 10 10 10 10 8 10 10 9
Ge et al. BMC Genetics 2011, 12:1http://www.biomedcentral.com/1471-2156/12/1
Page 7 of 12
T. mongolica, the maintenance of genetic diversitywould be critical for the long-term survival of species inconsidering conservation strategies [38]. Historicaldemographic events in a species play an important rolein determining the present-day geographic structure ofintraspecific genetic variation [39]. In this study, giventhe high levels of population differentiation betweenpopulations and low levels of genetic diversity withinpopulations of T. mongolica, for retaining the existingdiversity, reservation regions covering major populationswith high genetic variation should be established.
Habitat destruction and fragmentation would inevita-bly result in small and isolated populations [40,41], andincrease the risk of population extinction. Today, manynatural habitats of T. mongolica around the YellowRiver have been destroyed or altered due to humanoverexploitation. In order to develop an effective strat-egy to conserve species, the Evolutionarily SignificantUnit (ESU) needs to be defined. Various criteria forESUs have been suggested, including reciprocal mono-phyly [23], adaptive variation [42], and reproductiveseparation [43]. Recognizing ESUs as reciprocally mono-phyletic groups ensures that the entire evolutionaryheritage within species can be maintained and thatpopulations belonging to different lineages can be mana-ged separately [44]. In T. mongolica, given high levels ofgenetic differentiation and reciprocal monophylybetween most populations and lower genetic variationwithin populations, each population should be treated asdifferent evolutionarily significant units for conservation(Figure 2).From another view, conservation efforts can be tar-
geted to genetic hot spots where populations have highlevels of genetic diversity [17,45]. Accordingly, HN andXD populations that owned higher genetic diversitynear two-three folds than other populations (Table 1)
Figure 5 Median effective population size (thin lines indicate 95% highest posterior density interval) as estimated from cpDNA atpB-rbcL spacer sequence data in program BEAST using a Bayesian skyline plot technique.
Table 4 Pairwise comparisons of deduced Nm (belowdiagonal) and Fst (above diagonal) between populationsof Tetraena mongolica based on cpDNA sequences.
SZS HN GLS XD YKBLG TST MSG BLG
SZS 0.54 0.64 0.56 0.90 0.70 0.78 0.65
HN 0.42 0.50 0.20 0.66 0.26 0.41 0.37
GLS 0.28 0.50 0.65 0.86 0.65 0.73 0.60
XD 0.39 2.01 0.44 0.68 0.27 0.47 0.38
YKBLG 0.06 0.26 0.04 0.24 0.86 0.85 0.68
TST 0.21 1.44 0.27 1.36 0.08 0.59 0.40
MSG 0.07 0.71 0.19 0.28 0.04 0.18 0.45
BLG 0.13 0.68 0.33 0.41 0.12 0.37 0.30
Ge et al. BMC Genetics 2011, 12:1http://www.biomedcentral.com/1471-2156/12/1
Page 8 of 12
can be recognized as genetic hot spots of T. mongolica.The concept of genetic and ecological exchangeabilitiesis also central to the definitions of ESU [46]. Crandallet al. [44] emphasize that the ESU concept not onlyincludes ecological data and genetic variation, butalso considers the ecological and genetic exchangeabil-ities. In practice, the status of recent and historicalgenetic and ecological exchangeability between popula-tions is considered. As the contemporary gene flowfrom the populations at genetic hot spots to otherpopulations does not exist or cannot be determined,the populations at the genetic hot spots need to betreated as distinct conservation units for its uniquegenetic variation [44]. Accordingly, hotspots at HNand XD of T. mongolica would represent differentunits for conservation, as seed dispersal between popu-lations is limited.
ConclusionAs expected, the rare species of T. mongolica possessedvery low genetic variation at the cpDNA noncodingspacer. The effects of random genetic drift would leadto the loss of genetic variability in a small-sized popula-tion and genetic differentiation among populations, asobserved in T. mongolica that has been mediated bylimited seed dispersal and frequent population shrinkingdue to the flooding of the Yellow River. Phylogeographi-cal analyses suggest that the present-day T. mongolicapopulations in Inner Mongolia were likely a result ofrestricted gene flow with isolation by distance plus occa-sional long distance dispersal. Molecular data providesufficient information for reconstructing phylogeogra-phical patterns and critical information for setting con-servation strategy. For conservation considerations wesuggest that populations with reciprocal monophyly atthe cpDNA, and the two genetically highly variablepopulations likely represent management units for pro-tecting T. mongolica.
MethodsPopulation samplingIn this study, we investigated the genetic variation andstructure in the rare and endangered T. mongolica.This rare species is distributed in the western InnerMongolia with small habitat fragments. Samples werecollected from all populations, avoiding clonal indi-viduals. A total of 77 individuals, representing eightextant populations, were sampled throughout the spe-cies entire range (Figure 1, Table 1). Individuals werechosen randomly. Young healthy leaves were collectedfrom the field and were dried directly with silica gel.Dried leaves were preserved in silica gel until DNAextraction.
DNA extraction and PCRLeaves were powdered in liquid nitrogen and stored in a-70°C freezer. Genomic DNAs were extracted from thepowdered tissue following a CTAB procedure and gel-quantified [47]. The intergenic spacer between the atpBand rbcL genes of the chloroplast DNA was amplifiedusing a pair of universal primers [48]. Each 50 μL PCRcontained: 10 ng template DNA, 5 μl 10 × PCR reactionbuffer, 5 μL MgCl2 (25 mM), 5 μl dNTP mix (8 mM),10 pmole of each primer, and 4 U of Taq polymerase(Promega, Madison, USA). The reaction was pro-grammed on an MJ Thermal Cycler with first cycle ofdenaturation at 95°C for 2 min, then 30 cycles of dena-turation at 94°C for 45 sec, annealing at 48°C for 1 min,and extension at 72°C for 1 min 30 sec, followed by72°C extension for 10 min and 4°C for storage.
T-vector cloning and nucleotide sequencingAll PCR products were purified from an agarose gelusing the PCR product purification kit (Viogene, Sunny-vale, USA) and cloned into a pGEM-T easy cloning vec-tor (Promega). For each cpDNA atpB-rbcL fragment,both strands were cycle-sequenced using the Taq DyeDeoxy Terminator Cycle Sequencing Kit (Applied Bio-system, Foster City, USA). Products of the cycle sequen-cing reactions were run on an ABI 377XL automatedsequencer (Applied Biosystem). Cloned PCR productswere sequenced using universal T7 forward (5’- TAA-TACGACTCACTATACGGG-3’) and SP6 reverse (5’-TATTTAGGTGACACTATAG-3’) primers located onpGEM-T easy vector termination sites. Five clones foreach individual were randomly chosen and sequenced.
Sequence alignment and phylogenetic analysisThe chloroplast DNA sequences were aligned with theprogram Clustal X 1.81 [49]. Indels were excluded fromthe data analysis. Neighbor-joining (NJ) analysis basedon Kimura’s [50] two-parameter distance was performedusing the software MEGA 4.0 [51]. To evaluate cladesupport, 1,000 replicates of bootstrap analysis [52] wereperformed using fast heuristic search and TBR branch-swapping. The nested clade analysis of Templeton et al.[53] provides a statistical framework for examining asso-ciations between the geographical distribution of haplo-types and their genealogical relationships [54,55].Pairwise comparisons between DNA haplotypes werecalculated using MEGA 4.0 [51]. These were used toconstruct a minimum spanning network in a hierarchi-cal manner with the aid of the MINSPNET [56].The nested clade analysis was accomplished by linking
nucleotide haplotypes in a hierarchical manner based onmutational changes. The linking rules start at the tips ofthe cladogram and move one mutational step into the
Ge et al. BMC Genetics 2011, 12:1http://www.biomedcentral.com/1471-2156/12/1
Page 9 of 12

interior, uniting all haplotypes connected by this proce-dure into a ‘1-step clade’. Following pruning off theinitial 1-step clades from the tips, the procedure isrepeated on the more interior portions of the haplotypetree until all haplotypes have been placed into 1-stepclades. The next level of nesting uses the 1-step cladesas units, rather than individual haplotypes. The linkingrules are the same; however, ‘2-step clades’ are nowformed. The nesting procedure is repeated until a nest-ing level is reached such that the next higher nestinglevel would result in only a single category spanning theentire original haplotype network; via such hierarchicallinking, a nested network was drawn.
Population genetic analysis of the cpDNALevels of inter- and intra-population genetic diversitybased on cpDNA were quantified by indices of haplotypediversity (h) [57] and estimates of nucleotide difference (θ)[58] using DnaSP (Version 5) [59]. Patterns of geographi-cal subdivision and gene flow were also estimated hier-archically with the aid of DnaSP. Gene flow within andamong regions or populations was approximated as Nm,the number of female migrants per generation betweenpopulations. Nm was estimated using the expression FST =1/(1 + 2 Nm), where N is the female effective populationsize and m is the female migration rate [60].A model of “isolation by distance” was assessed by
plotting pairwise Nm values against geographical dis-tance [60]. The correlation between Nm and distancewas determined by a regression of F-test over distancesusing SPSS program version 6.0 [61]. Geographical asso-ciations of haplotypes and clades within the minimumspanning network were tested using the program Geo-Dis [62]. Two statistics were calculated: 1) the clade dis-tance, Dc, a measure of the geographical spread of aclade, and 2) the nested clade distance, Dn, a measureof the geographical distribution of a clade relative toother clades in the same higher level nesting category.These measures of geographical distribution were usedto infer historical processes following the methods ofTempleton et al. [53]. The nested clade analysis (NCA)has been recently challenged with serious flaws, such asignorance of the type I error [63]. The debates [64-66]have been lasting. In this study, we used this analysis togenerate a phylogeography hypothesis.To estimate the population demographic trends for T.
mongolica, we analyzed the cpDNA noncoding spacerdata with BEAST v1.4 [67]. Bayesian skyline plot modelwas used to infer past demographic dynamics throughtime, which uses standard Markov chain Monte Carlo(MCMC) sampling procedures calculated from a sampleof molecular sequences estimate a posterior distributionof effective population size without dependence on apre-specified parametric model of demographic history
[68]. In the study, an evolutionary rate for the chloro-plast atpB-rbcL spacer of 3 × 10⁻⁹ substitutions per siteper year was used [69,70]. The Bayesian skyline plotincludes credibility intervals for the estimated effectivepopulation size at every point in time, back to the mostrecent common ancestor of the gene sequences. Thecredibility intervals represent both phylogenetic and coa-lescent uncertainty.
AcknowledgementsThis study was supported by the National Science Council of Taiwan, andthe CAS Important direction for knowledge innovation project of ChineseAcademy of Sciences (No.KZCX2-EW-305).
Author details1Key Laboratory of Plant Resources Conservation and Sustainable Utilization,South China Botanical Garden, Chinese Academy of Sciences, Guangzhou510650, PR China. 2Department of Engineering Science, National Cheng-Kung University, Tainan 701, Taiwan. 3Department of Biological Sciences,National Sun Yat-Sen University, Kaohsiung 804, Taiwan. 4Department of LifeSciences, National Cheng-Kung University, Tainan 701, Taiwan. 5GraduateInstitute of Bioresources, Pingtung University of Science and Technology,Pingtung 912, Taiwan.
Authors’ contributionsTYC designed and conceived this study. XJG collected the samples andanalyzed the data. WKW, ZHL, CCH, KHH and WHH collected the geneticdata. WKW and TYC analyzed the data and wrote the manuscript. All authorsread and approved the final manuscript.
Received: 18 March 2010 Accepted: 4 January 2011Published: 4 January 2011
References1. Frankham R, Ballou JD, Briscoe DA: Introduction to Conservation Genetics
Cambridge, UK: Cambridge University Press; 2002.2. Hamrick JL, Godt MJW: Conservation genetics of endemic plant species.
In Conservation genetics: case histories from nature. Edited by: Avise JC,Hamrick JL. New York: Chapman and Hall; 1996:281-304.
3. Zhang YJ, Yang C: Comparative analysis of genetic diversity in theendangered shrub Tetraena mongolica and its related congenerZygophyllum xanthoxylon. Acta Phytoecologica Sinica 2000, 24:425-429.
4. Fu LG: The Red Book of Chinese Plants–Rare and Endangered Plants Beijing:Science Press; 1992.
5. Zhang YF, Yang C, Li B, Chen JK: Interpopulation difference in growth andreproduction of endemic species Tetraena mongolica in Ordos Plateau.Acta Ecologica Sinica 2003, 23:436-443.
6. Wang G, Lin Q, Xu Y: Tetraena mongolica Maxim can accumulate largeamounts of triacylglycerol in phloem cells and xylem parenchyma ofstems. Phytochemistry 2007, 68:2112-2117.
7. Liu GH, Zhou SQ, Thang L, Ren L: Study on the biological characteristicsand the endangering factors of the Tetraena mongolica. J Inner MongoliaForestry College 1993, 2:33-39.
8. Wang YC, Ma H, Zheng R: Studies on the reproductive characteristics ofTetraena mongolica Maxim. Acta Botanica Boreal Occident Sinica 2000,20:661-665.
9. Xu Q, Jiang C, Liu S, Guo Q: Study on pollination ecology of endangeredplant Tetraena mongolica population. Forest Res 2003, 16:391-397.
10. Ge XJ, Yu Y, Zhao NX, Chen HS, Qi WQ: Genetic variation in theendangered Inner Mongolia endemic shrub Tetraena mongolica Maxim.(Zygophyllaceae). Biol Conserv 2003, 111:427-434.
11. Moritz C: Uses of molecular phylogenies for conservation. Phil Trans R SocLond B Biol Sci 1995, 349:113-118.
12. Moritz C, Faith DP: Comparative phylogeography and the identificationof genetically divergent areas for conservation. Mol Ecol 1998, 7:419-429.
13. Haig SM: Molecular contributions to conservation. Ecology 1998,79:413-425.
Ge et al. BMC Genetics 2011, 12:1http://www.biomedcentral.com/1471-2156/12/1
Page 10 of 12

14. Ouborg NJ, Piquot Y, van Groenendael JM: Population genetics, molecularmarkers and the study of dispersal of plants. J Ecol 1999, 87:551-568.
15. Provan J, Powell W, Hollingsworth PM: Chloroplast microsatellites: new toolsfor studies in plant ecology and evolution. Trends Ecol Evol 2001, 16:142-147.
16. Chiang TY, Hung KH, Hsu TW, Wu WL: Lineage sorting andphylogeography in Lithocarpus formosanus and L. dodonaeifolius(Fagaceae) from Taiwan. Ann Mo Bot Gard 2004, 91:207-222.
17. Huang JC, Wang WK, Peng CI, Chiang TY: Phylogeography andconservation genetics of Hygrophila pogonocalyx (Acanthaceae) basedon atpB-rbcL noncoding spacer cpDNA. J Plant Res 2005, 118:1-11.
18. Kanno M, Yokoyama J, Suyama Y, Ohyama M, Itoh T, Suzuki M:Geographical distribution of two haplotypes of chloroplast DNA in fouroak species (Quercus) in Japan. J Plant Res 2003, 116:311-317.
19. Birky CW: The inheritance of genes in mitochondria and chloroplasts:Laws, mechanisms, and models. Ann Rev Genet 2001, 35:125-148.
20. Cruzan MB, Templeton AR: Paleoecology and coalescence:phylogeographic analysis of hypotheses from the fossil record. TrendsEcol Evol 2000, 15:491-496.
21. Orive ME, Asmussen MA: The effects of pollen and seed migration onnuclear-dicytoplasmic systems. II. A new method for estimating plantgene flow from joint nuclear-cytoplasmic data. Genetics 2000,155:833-854.
22. Song BH, Wang XQ, Wang XR, Sun LJ, Hong DY, Peng PH: Maternallineages of Pinus densata, a dipoid hybrid. Mol Ecol 2002, 11:1057-1063.
23. Moritz C: Defining ‘evolutionarily significant units’ for conservation.Trends Ecol Evol 1994, 9:373-375.
24. Li WH: Molecular evolution Sinauer: Sunderland; 1997.25. Lü XM, Fu YX, Zhang YP: Evolution of mitochondrial cytochrome B
pseudogene in genus Nycticebus. Mol Biol Evol 2002, 19:2337-2341.26. Ge XJ, Chiang YC, Chou CH, Chiang TY: Nested clade analysis of Dunnia
sinensis (Rubiaceae), a monotypic genus from China based on organelleDNA sequences. Conserv Genet 2002, 3:351-362.
27. Lu SY, Peng CI, Cheng YP, Hong KH, Chiang TY: Chloroplast DNAphylogeography of Cunninghamia konishii (Cupressaceae), an endemicconifer of Taiwan. Genome 2001, 44:797-807.
28. Huang S, Chiang YC, Schaal BA, Chou CH, Chiang TY: Organelle DNAphylogeography of Cycas taitungensis, a relict species in Taiwan. Mol Ecol2001, 10:2669-2681.
29. Zhen JH, Liu GH: Research advance in rare and endemic plant Tetraenamongolica Maxim. Chin J Appl Ecol 2008, 19:433-440.
30. Zietkiewicz E, Rafalski A, Labuda D: Genome fingerprinting by SimpleSequence Repeat (SSR)-anchored polymerase chain reactionamplification. Genomics 1994, 20:176-183.
31. Sinclair K: The Yellow River: A 5000 Year Journey Through China Chatswood,Sydney, Australia: Child & Associates Publishing; 1987.
32. Leung G: Reclamation and Sediment Control in the Middle Yellow RiverValley. Water International 1996, 21:12-19.
33. Barker JS, Frydenberg J, González J, Davies HI, Ruiz A, Sørensen JG,Loeschcke V: Bottlenecks, population differentiation and apparentselection at microsatellite loci in Australian Drosophila buzzatii. Heredity2009, 102:389-401.
34. Whitehouse AM, Harley EH: Post-bottleneck genetic diversity of elephantpopulations in South Africa, revealed using microsatellite analysis. MolEcol 2001, 10:2139-2149.
35. Hanski IA, Gilpin ME: Metapopulation biology: ecology, genetics, and evolutionOrlando: Academic Press; 1997.
36. Fischer M, Matthies D: Mating structure and inbreeding and outbreedingdepression in the rare plant Gentianella germanica (Gentianaceae). Am JBot 1997, 84:1685-1692.
37. Reed DH, Frankham R: Correlation between fitness and genetic diversity.Conserv Biol 2003, 17:230-237.
38. Frankel OH: The place of management in conservation. In Genetics andConservation. Edited by: Schonewald-Cox CM, Chambers SM, MacBryde B,Thomas L. Menlo Park, Calif: Benjamin-Cummings; 1983:1-14.
39. Hewitt GM: Some genetic consequences of ice ages, and their role indivergence and speciation. Biol J Linn Soc 1996, 58:247-276.
40. Ledig FT, Hodgskiss PD, Jacob-Cervantes V: Genetic diversity, matingsystem, and conservation of a Mexican subalpine relict, Picea mexicanaMartinez. Conserv Genet 2002, 3:113-122.
41. Nakagawa M: Genetic diversity of fragmented populations of Polygalareinii (Polygalaceae) a perennial herb endemic to Japan. J Plant Res 2004,117:355-361.
42. Ryder OA: Species conservation and systematics: the dilemma ofsubspecies. Trends Ecol Evol 1986, 1:9-10.
43. Waples RS: Pacific Salmon, Oncorhynchus spp. and the definition of“species” under the endangered species act. Mar Fish Rev 1991, 53:11-22.
44. Crandall KA, Bininda-Emonds OR, Mace GM, Wayne RK: Consideringevolutionary processes in conservation biology. Trends Ecol Evol 2000,15:290-295.
45. Aoki K, Suzuki T, Hsu TW, Murakami N: Phylogeography of the componentspecies of broad-leaved evergreen forests in Japan, based onchloroplast DNA. J Plant Res 2004, 117:77-94.
46. Rader RB, Belk MC, Shiozawa DK, Crandall KA: Empirical tests for ecologicalexchangeability. Anim Conserv 2005, 8:239-247.
47. Doyle JJ, Doyle JL: A rapid isolation procedure for small quantities offresh leaf tissue. Phytochem Bull 1987, 19:11-15.
48. Chiang TY, Schaal BA, Peng CI: Universal primers for amplification andsequencing a noncoding spacer between atpB and rbcL genes ofchloroplast DNA. Bot Bull Acad Sin 1998, 39:245-250.
49. Thompson JD, Gibson TJ, Plewniak F, Jeanmougin F, Higgins DG: TheClustal X windows interface: flexible strategies for multiple sequencealignment aided by quality analysis tools. Nucleic Acids Res 1997,24:4876-4882.
50. Kimura M: A simple method for estimating evolutionary rates of basesubstitutions through comparative studies of nucleotide sequences. JMol Evol 1980, 16:111-120.
51. Tamura K, Dudley J, Nei M, Kumar S: MEGA4: Molecular EvolutionaryGenetics Analysis (MEGA) software version 4.0. Mol Biol Evol 2007,24:1596-1599.
52. Felsenstein J: Confidence limits on phylogenies: an approach using thebootstrap. Evolution 1985, 39:783-791.
53. Templeton AR, Routman E, Phillips CA: Separating population structurefrom population history: a cladistic analysis of the geographicaldistribution of mitochondrial DNA haplotypes in the tiger salamander,Ambystoma tigrinum. Genetics 1995, 140:767-782.
54. Templeton AR: Nested clade analyses of phylogeographic data: testinghypotheses about gene flow and population history. Mol Ecol 1998,7:381-397.
55. Avise JC: Phylogeography: the history and formation of species Cambridge:Harvard University Press; 2000.
56. Excoffier L, Smouse PE: Using allele frequencies and geographicsubdivision to reconstruct gene trees within a species: molecularvariance parsimony. Genetics 1994, 136:343-359.
57. Nei M, Tajima F: Maximum likelihood estimation of the number ofnucleotide substitutions from restriction sites data. Genetics 1983,105:207-217.
58. Watterson GA: On the number of segregating sites in genetical modelswithout recombination. Theor Pop Biol 1975, 7:256-276.
59. Librado P, Rozas J: DnaSP v5: A software for comprehensive analysis ofDNA polymorphism data. Bioinformatics 2009, 25:1451-1452.
60. Slatkin M: Isolation by distance in equilibrium and nonequilibriumpopulations. Evolution 1993, 47:264-279.
61. Noruis MJ: SPSS for Windows, version 6.0 Englewood Cliffs: Prentice Hall;1994.
62. Posada D, Crandall KA, Templeton AR: GeoDis: a program for the cladisticnested analysis of the geographical distribution of genetic haplotypes.Mol Ecol 2000, 9:487-488.
63. Knowles LL, Maddison WP: Statistical phylogeography. Mol Ecol 2002,11:2623-2635.
64. Knowles LL: Why does a method that fails continue to be used? Evolution2008, 62:2713-2717.
65. Templeton AR: Why does a method that fails continue to be used? Theanswer. Evolution 2009, 63:807-812.
66. Templeton AR: Statistical hypothesis testing in intraspecificphylogeography: nested clade phylogeographic analysis vs. approximateBayesian computation. Mol Ecol 2009, 18:319-331.
67. Drummond AJ, Rambaut A: BEAST: Bayesian evolutionary analysis bysampling trees. BMC Evol Biol 2007, 7:214.
Ge et al. BMC Genetics 2011, 12:1http://www.biomedcentral.com/1471-2156/12/1
Page 11 of 12

68. Drummond AJ, Rambaut A, Shapiro B, Pybus OG: Bayesian coalescentinference of past population dynamics from molecular sequences. MolBiol Evol 2005, 22:1185-1192.
69. Wolfe KH, Sharp PM, Li WH: Rates of nucleotide substitution vary greatlyamong plant mitochondrial, chloroplast, and nuclear DNAs. Proc NatlAcad Sci USA 1987, 84:9054-9058.
70. Graur D, Li WH: Fundamentals of molecular evolution Sunderland,Massachusetts: Sinauer Press; 2000.
doi:10.1186/1471-2156-12-1Cite this article as: Ge et al.: Conservation genetics andphylogeography of endangered and endemic shrub Tetraena mongolica(Zygophyllaceae) in Inner Mongolia, China. BMC Genetics 2011 12:1.
Submit your next manuscript to BioMed Centraland take full advantage of:
• Convenient online submission
• Thorough peer review
• No space constraints or color figure charges
• Immediate publication on acceptance
• Inclusion in PubMed, CAS, Scopus and Google Scholar
• Research which is freely available for redistribution
Submit your manuscript at www.biomedcentral.com/submit
Ge et al. BMC Genetics 2011, 12:1http://www.biomedcentral.com/1471-2156/12/1
Page 12 of 12