phylogeography of eleotris fusca (teleostei: gobioidei ... · conservation genetics 1 3 area...
TRANSCRIPT

Vol.:(0123456789)1 3
Conservation Genetics https://doi.org/10.1007/s10592-018-1063-x
RESEARCH ARTICLE
Phylogeography of Eleotris fusca (Teleostei: Gobioidei: Eleotridae) in the Indo-Pacific area reveals a cryptic species in the Indian Ocean
Marion I. Mennesson1 · Céline Bonillo2 · Eric Feunteun1 · Philippe Keith1
Received: 13 March 2017 / Accepted: 22 March 2018 © Springer Science+Business Media B.V., part of Springer Nature 2018
AbstractIndo-Pacific insular freshwater systems are mainly dominated by amphidromous species. Eleotris fusca is a widespread one, its life cycle is characterised by a marine pelagic larval phase allowing the species to disperse in the ocean and then to recruit to remote island rivers. In the present study, the population structure of E. fusca over its Indo-Pacific distribution range (Western Indian Ocean to French Polynesia, Pacific Ocean) was evaluated. We analysed a section of mitochondrial COI of 557 individuals sampled from 28 islands to visualise the population structure. Haplotypes diversity (Hd) was between 0.458 and 1 and, nucleotide diversity (π) was between 0.001 and 0.02. Two distinct genetic groups appeared, one in the Indian Ocean and the other in the Pacific Ocean (FST mean = 0.901; 5.2% average divergence). Given these results, complete mitogenomes (mtDNA) were sequenced and combined with the nuclear Rhodopsin (Rh) gene for a subset of individuals. The two phylogenetic trees based on each analysis showed the same genetic pattern: two different groups belonging to the Indian and the Pacific oceans (6.6 and 1.6% of divergence for mtDNA and Rh gene respectively), which supported species level differentiation. These analyses revealed the presence of two sister species confounded until present under the name of Eleotris fusca. One of them is cryptic and endemic of the Indian Ocean and the other one is the true E. fusca, which keeps, nevertheless, its status of widespread species.
Keywords Freshwater fish · Amphidromous · Complete mitogenome · Nuclear gene
Introduction
The Indo-Pacific is the largest biogeographic region in the world, which includes unnumbered islands (Ekman 1953; Briggs 1974; Spalding et al. 2007). Insular freshwater sys-tems are known to be perilous habitats because they are sub-ject to extreme climatic and hydrological seasonal variations
such as drought or cyclonic flood events. To colonise these systems species have developed a specific life cycle: dia-dromy (Myers 1949). Diadromous species spend a part of their life cycle in the sea and a part in freshwater systems (McDowall 1992). Among diadromous species, amphidro-mous ones mainly dominate these habitats and are the big-gest contributors to the diversity of the freshwater communi-ties (Nelson et al. 1997; Watson et al. 2007; Keith and Lord 2011; Keith et al. 2015). Amphidromous species spawn in freshwater; after hatching, larvae drift downstream to the sea where they undergo a planktonic phase. After this marine phase, individuals return to rivers to grow and reproduce (McDowall et al. 1994; Keith et al. 2008). With the marine larval phase, amphidromous species are able to disperse and colonise new islands (Keith 2003).
The colonization of insular rivers is influenced by numer-ous factors such as species dispersal abilities, distances between islands, spatial and temporal characteristics of ocean currents and the presence of past or actual barriers (Lord et al. 2012; Pous et al. 2010; Feutry et al. 2013; Cas-telin et al. 2013; Taillebois et al. 2013). The Indo-Pacific
Electronic supplementary material The online version of this article (https ://doi.org/10.1007/s1059 2-018-1063-x) contains supplementary material, which is available to authorized users.
* Marion I. Mennesson [email protected]
1 Muséum national d’Histoire naturelle, UMR 7208 BOREA (MNHN-CNRS-Sorbonne Université-IRD-UCBN-UA), 43, rue Cuvier, CP 026, 75231 Paris Cedex 05, France
2 Département Systématique et Evolution, UMS 2700 “Outils et Méthodes de la Systématique Intégrative” MNHN-CNRS, Service de Systématique Moléculaire, Muséum national d’Histoire naturelle, 43, rue Cuvier, CP 026, 75231 Paris Cedex 05, France
Conservation Genetics
1 3
area presents several such physical barriers that are the con-sequence of past geologic activity and they played a role in the limitation of dispersal (Gaither et al. 2011). These barriers emerged during various geologic periods, particu-larly in the Pleistocene. The repeated lowering of sea level during Pleistocene glacial cycles created a nearly complete barrier between the Indian and Pacific oceans, the Indo-Pacific Barrier (IPB) situated across the Sunda Shelf, and led to intraspecific genetic divergence in many taxa, and ulti-mately the formation of pairs of sister species on either side of the barrier (Barber et al. 2006; Gaither and Rocha 2013; Ludt and Rocha 2015). Currently, major phylogeographic breaks are observed between populations in the Pacific and the Indian oceans across the IPB (Briggs 1974; De Bruyn et al. 2004; De Bruyn and Mather 2007; Crandall et al. 2008) while other breaks are observed between some regions of the Central West Pacific across the Torres Strait (Mirams et al. 2011; Taillebois et al. 2013). Several studies have investi-gated population genetic and phylogeographic patterns in the Indo-Pacific region (Keyse et al. 2014), but mainly have focused on marine organisms and rarely including the entire geographic range of the species studied; furthermore, few exist on diadromous species (Lord et al. 2012; Castelin et al. 2013; Taillebois et al. 2013).
In amphidromous fishes, the Eleotris genus (Eleotridae), with the most widespread species Eleotris fusca Bloch and Schneider, 1801, is particularly interesting to such a large-scale phylogeographic study. This species is found in the Indo-Pacific area, from the Western Indian Ocean to New Caledonia, Vanuatu and French Polynesia (Keith et al. 2006, 2010, 2013; Mennesson et al. 2015). Its life cycle is charac-terised by a marine pelagic larval phase allowing the species to disperse in the ocean and then to recruit in remote island rivers (Mennesson et al. 2015). In these rivers, it is a com-mon carnivorous species distributed primarily in freshwater (Maeda and Tachihara 2004, 2006). This species is is found in brackish waters, but mainly in the lower part of freshwa-ter areas. It prefers to be close to the riverbank where the current is slow, or in the lentic zones (Keith et al. 2010). Eleotris fusca experiences pressures linked to the loss of the hydrological corridor and habitat degradation (Keith et al. 2013). No threats are clearly identify at the international scale due to a lack of investigations on this species. But due to the association of habitat loss and post-larvae fisheries in the Reunion Island (Mascarene), E. fusca was listed as an “Endangered” species on the French IUCN red List of Endangered Species in France (IUCN France et al. 2013). Because of its importance in the freshwater ecosystem and in local fisheries, it is important to understand the life cycle and the phylogeography of this species to help managers to implement conservation measures.
The aim of the present study was to explore the popula-tion structure of E. fusca within its entire distribution range,
the Indo-Pacific region, using a phylogeographic approach. First, the population structure was explored through COI barcoding of 557 individuals sampled from 28 islands. Then, we used the results to select a subset of samples (32 indi-viduals from 18 islands) that were sequenced for the com-plete mitogenome and the nuclear Rhodopsin (Rh) gene to assess E. fusca phylogeography in order to see if there was evidence of genetic structure across the IPB and/or other barriers.
Materials and methods
Sample collections
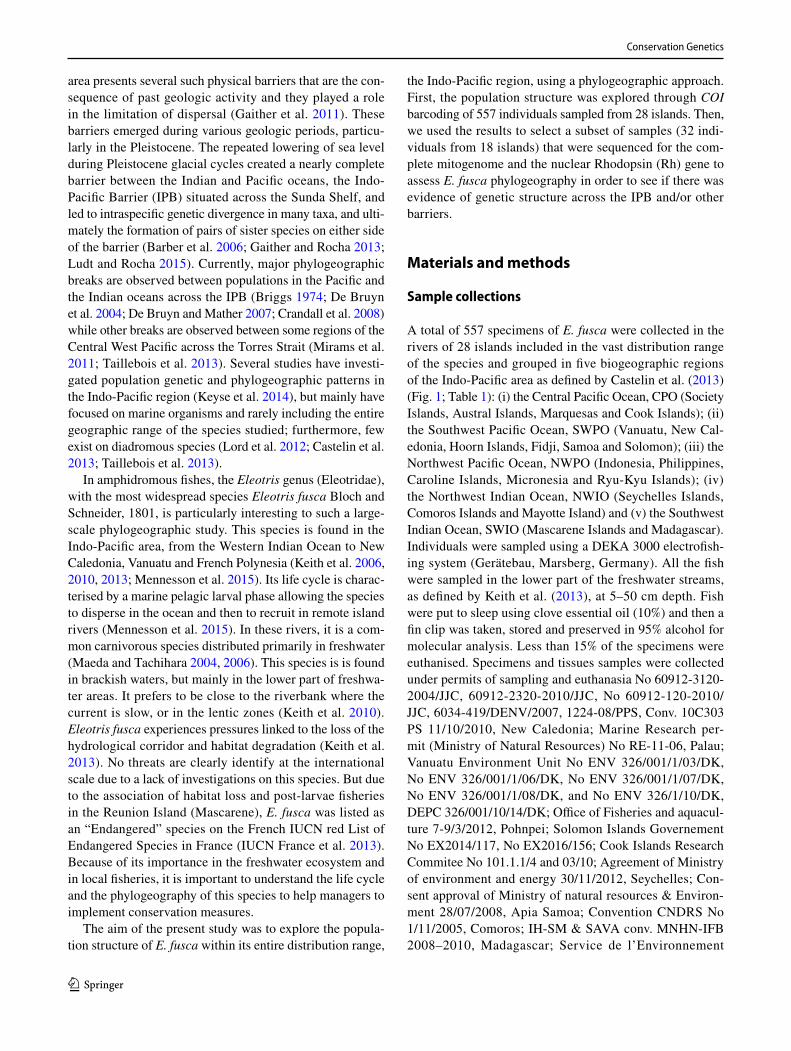
A total of 557 specimens of E. fusca were collected in the rivers of 28 islands included in the vast distribution range of the species and grouped in five biogeographic regions of the Indo-Pacific area as defined by Castelin et al. (2013) (Fig. 1; Table 1): (i) the Central Pacific Ocean, CPO (Society Islands, Austral Islands, Marquesas and Cook Islands); (ii) the Southwest Pacific Ocean, SWPO (Vanuatu, New Cal-edonia, Hoorn Islands, Fidji, Samoa and Solomon); (iii) the Northwest Pacific Ocean, NWPO (Indonesia, Philippines, Caroline Islands, Micronesia and Ryu-Kyu Islands); (iv) the Northwest Indian Ocean, NWIO (Seychelles Islands, Comoros Islands and Mayotte Island) and (v) the Southwest Indian Ocean, SWIO (Mascarene Islands and Madagascar). Individuals were sampled using a DEKA 3000 electrofish-ing system (Gerätebau, Marsberg, Germany). All the fish were sampled in the lower part of the freshwater streams, as defined by Keith et al. (2013), at 5–50 cm depth. Fish were put to sleep using clove essential oil (10%) and then a fin clip was taken, stored and preserved in 95% alcohol for molecular analysis. Less than 15% of the specimens were euthanised. Specimens and tissues samples were collected under permits of sampling and euthanasia No 60912-3120-2004/JJC, 60912-2320-2010/JJC, No 60912-120-2010/JJC, 6034-419/DENV/2007, 1224-08/PPS, Conv. 10C303 PS 11/10/2010, New Caledonia; Marine Research per-mit (Ministry of Natural Resources) No RE-11-06, Palau; Vanuatu Environment Unit No ENV 326/001/1/03/DK, No ENV 326/001/1/06/DK, No ENV 326/001/1/07/DK, No ENV 326/001/1/08/DK, and No ENV 326/1/10/DK, DEPC 326/001/10/14/DK; Office of Fisheries and aquacul-ture 7-9/3/2012, Pohnpei; Solomon Islands Governement No EX2014/117, No EX2016/156; Cook Islands Research Commitee No 101.1.1/4 and 03/10; Agreement of Ministry of environment and energy 30/11/2012, Seychelles; Con-sent approval of Ministry of natural resources & Environ-ment 28/07/2008, Apia Samoa; Convention CNDRS No 1/11/2005, Comoros; IH-SM & SAVA conv. MNHN-IFB 2008–2010, Madagascar; Service de l’Environnement
Conservation Genetics
1 3
Conv. 5-23/10/2004, Futuna; Direction Départementale de l’Agriculture et de la Forêt Conv. ARDA/MNHN/DAF 05/2003 & 2006, Mayotte; DIREN Conv. Réunion-ARDA 2007 & 2012; Conv. Délégation à l’environnement-EPHE-MNHN, French Polynesia.
DNA extraction and amplification
Pectoral fin tissue was used to extract total genomic DNA from the 557 individuals using the Macherey and Nagel NucleoSpin® Tissue kits following the manufacturer’s instructions on an Eppendorf EpMotion 5075.
COI gene
Genetic diversity and patterns of genetic connectivity were investigated using a 585 bp fragment of mtDNA cytochrome oxidase (COI). To amplify the partial COI gene specific fish primers TelF1 and TelR1 were used (Table 2). DNA amplifi-cation was performed by PCR in a final 20 µL volume con-taining 5% DMSO, 1 µL of dNTP 6.6 µM, 0.15 µL of Qiagen Taq DNA polymerase, using 2 µL of the buffer provided by the manufacturer, and 0.4 µL of each of the two primers at 10 pM; 1.2 µL of DNA extract was added. After denatura-tion for 2 min at 94 °C, the PCR was run for 55 cycles of
(25 s, 94 °C; 25 s, 54 °C; 55 s, 72 °C) on a Bio-Rad C1000 Touch Thermal Cycler. Successful PCRs were selected on ethidium-bromide stained agarose gels. Sanger sequencing was performed in both directions by a commercial company (Eurofins; http://www.eurofi ns.fr) using the same primers as before.
Complete mitogenome and Rh gene
The population structure observed with the mtDNA COI data was tested using the complete mitogenome (NGS), with a subset of 29 E. fusca individuals: 21 for the Pacific Ocean and 8 for the Indian Ocean, and 3 outgroups (E. acantho-poma, E. melanosoma and E. bosetoi), following the pro-tocol established by Hinsinger et al. (2015) and using spe-cific fish primers listed in Table 2. Hinsinger et al. (2015) developed a specific framework for the sequencing and multiplexing of mitogenomes on NGS platforms following 3 steps: (i) a universal long-range PCR-based amplification technique; (ii) a two-level multiplexing approach and (iii) a dedicated demultiplexing assembling script from an Ion Torrent sequencing platform. With this method, obtaining complete or almost complete mitogenome sequences is now easier and low cost. Moreover, having an extensive dataset for each specimen (i.e. 13 coding genes, 22 tRNA, 2 rRNA
Seychelles
Comores
Reunion
Bali
Okinawa
PohnpeiPalau
Panay
PapuaSolomon
New Caledonia
Vanuatu Fidji
Futuna Samoa Rarotonga
Moorea
Rurutu
Tubuai
Marquesas
Madagascar
800 km
NWIO
SWIO
NWPO
SWPO CPO
N=51
N=30
N=83
N=272N=121
Fig. 1 Map of the Indo-Pacific showing sampled localities

Conservation Genetics
1 3
and the control region; namely, around 17,000 bp) allows (i) to easily compare the data obtained with those available
in GenBank, (ii) to have the best precision of the species genetic history by targeting the most variable genes.
Table 1 Details of tissue samples of Eleotris fusca specimens. Samples size of each island (N) and abbreviated names of each analysed population
Specimens from Philippines and Micronesia were not used for the AMOVA because of their small sample size
Regions Countries Islands N Populations
Central Pacific Ocean (CPO) Society Islands Moorea 42 SOCAustral Islands Rurutu 54 AUS− Tubuai 2Marquesas Ua huka 4 MARCook Islands Rarotonga 19 COO
Southwest Pacific Ocean (SWPO) Vanuatu Maewo 11 VAN− Santo 37− Malakula 1− Epi 7− Gaua 8New Caledonia Grande Terre 71 NCAHoorn Islands Futuna 4 HOOFidji Taveuni 4 FIDSamoa Upolu 14 SAMSolomon Choiseul 20 SOL− Kolobangara 95
Northwest Pacific Ocean (NWPO) Indonesia Bali 17 I-BA− Papua 33 I-PAPhilippines Panay 1 −Caroline Islands Palau 3 CAR Micronesia Pohnpei 2 −Ryū-Kyū Islands Okinawa 27 RKI
Northwest Indian Ocean (NWIO) Seychelles Island Silhouette 2 −Comoros Islands Anjouan 2 COM− Moheli 11Mayotte Island Mayotte 36 MAY
Southwest Indian Ocean (SWIO) Mascarene Islands Reunion 25 MASMadagascar Madagascar 5 MAD
Total 557
Table 2 List of the primers used in this study for short and long PCR
Gene Primer name 5′-3′ sequence Publication
COI Tel F1 TCG ACT AAT CAY AAA GAY ATY GGC AC Dettai et al. (2011)COI Tel R1 ACT TCT GGGTGNCCA AAR AAT CAR AA Dettai et al. (2011)Complete mitogenome 12S-L1091R AAA CTG GGA TTA GAT ACC CCA CTA T Kocher et al. (1989)Complete mitogenome MtH7061 GGG TTA TGT GGC TGG CTT GAAAC Hinsinger et al. (2015)Complete mitogenome MtL5231 TAG ATG GGA AGG CTT CGA TCC TAC A Hinsinger et al. (2015)Complete mitogenome MtH11944 CAT AGC TTT TAC TTG GAT TTG CAC CA Hinsinger et al. 2015Complete mitogenome MtL11910 CAG CTC ATC CAT TGG TCT TAG GAA C Hinsinger et al. (2015)Complete mitogenome 12S-H1478 TGA CTG CAG AGG GTG ACG GGC GGT GTGT Hinsinger et al. 2015Rh F193 CAR TGG TGC TAC CTSTGCGA Chen et al. (2003)Rh R1039 CGT GGT CYT TCC KGAA GCG Chen et al. (2003)

Conservation Genetics
1 3
We amplified the mitogenome with 3 overlapping frag-ments (primers used are in Table 2). A HotStart LongAmp® Taq DNA Polymerase (New England Biolabs, Ipswich MA) modified protocol was used. The 3 fragments amplification were performed by PCR in a final 18 µL volume including 5X LongAmp Taq Reaction Buffer, 0.4 ng/µL Bovine Serum Albumin, 3.5% DMSO, 300 nM of each primer, 300 µM of dNTPs, and 1 unit of LongAmp Taq polymerase. After an initial denaturation of 30 s at 94 °C, the DNA was ampli-fied through 45 cycles of 20 s at 94 °C, 30 s at 62.5 °C, and 15 min at 65 °C, with a terminal elongation for 15 min at 65 °C (Hinsinger et al. 2015) on a Bio-Rad C1000 Touch Thermal Cycler. Successful PCRs were selected on ethid-ium-bromide stained agarose gels.
The nuclear rhodopsin gene (Rh) was used to add support to the population structure observed with the mtDNA data. We used F193 and R1039 as primers (Chen et al. 2003) (Table 2), DNA amplification, from 37 specimens, by PCR was the same as COI and then, PCR were sequenced with the Ion Torrent following the protocol of Hinsinger et al. (2015).
COI analysis
For mtDNA COI gene (585 bp), data processing and sequence assembly were done in Geneious 9.0.5 (Kearse et al. 2012), all sequences were aligned with Muscle Align-ment (implemented in Geneious) and compared (p-dis-tances) (Geneious). Arlequin v.3.11 (Excoffier et al. 2005) was used to measure the genetic diversity in the population
of E. fusca in the Indo-Pacific area. Different indices, such as number of haplotypes (h), haplotype diversity (Hd) and mean nucleotide diversity (π) were calculated.
A median-joining network was built from the COI dataset using Network v.5 (Bandelt et al. 1999) with equal weight for variable. We applied a maximum of parsimony algorithm and the criterion “frequency > 1” to simplify the complex branching pattern and to generate a network representing all the most parsimonious intraspecific phylogenies.
To study the partitioning of genetic variance within and among populations, analyses of molecular variance (AMOVA, Excoffier et al. 1992) were performed using Arle-quin v.3.11. Samples were first partitioned into 18 countries (Table 3); Philippines, Micronesia and Seychelles samples weren’t added to the analysis because of their small size. Secondly, to have a large view, samples were assembled into the five defined regions (CPO, SWPO, NWPO, SWIO and NWIO) (Table 4).
Pairwise FST values were calculated between each pair of populations to assess to the genetic differentiation (Arlequin v.3.11) (Tables 5, 6). Significance of F-statistics was calcu-lated from 10,000 replicate analyses based on the samples drawn randomly and alpha value of 0.05. To test for isola-tion by distance, the Mantel test implemented in XLSTAT (1000 permutations) was performed between genetic (FST) and geographic distances (km, calculated with Google Earth v7.3.0.3832).
The demographic history of E. fusca was analysed with Arlequin v.3.11 using the Fu’s Fs-statistic (Fu 1997); genetic
Table 3 Molecular diversity indices for mtDNA COI sequences for each analysed population
Sample size (N), haplotype diversity (Hd), number of haplotypes (h), nucleotide diversity (π), Fu’s Fs-statistics. Fs values Significant (p value ≤ 0.05) are in bold
Regions Countries Population N Hd h π Fs
Central Pacific Ocean (CPO) Society Islands SOC 42 0.558 5 0.001 − 0.79Austral Islands AUS 56 0.458 7 0.001 − 4.18Marquesas MAR 4 − 1 − −Cook Islands COO 19 0.725 6 0.002 − 2.26
Southwest Pacific Ocean (SWPO) Vanuatu VAN 64 0.875 27 0.004 − 22.84New Caledonia NCA 68 0.914 28 0.004 − 25.47Hoorn Islands HOO 4 0.5 2 0.002 1.1Fidji FID 4 1 4 0.004 − 1.51Samoa SAM 14 0.912 9 0.002 − 3.77Solomon SOL 118 0.864 51 0.02 − 14.37
Northwest Pacific Ocean (NWPO) Indonesia—Bali I-BA 17 0.868 9 0.004 − 3.46Indonesia—Papua I-PA 33 0.934 11 0.004 − 18.64Caroline Islands CAR 3 0.667 2 0.001 0.2Ryū-Kyū Islands RKI 27 0.915 18 0.004 − 15.27
Northwest Indian Ocean (NWIO) Comoros Islands COM 13 0.897 8 0.003 − 4.5Mayotte Island MAY 36 0.844 18 0.006 − 8.1
Southwest Indian Ocean (SWIO) Mascarene Islands MAS 25 0.76 9 0.01 1.17Madagascar MAD 5 0.9 4 0.002 − 1.65

Conservation Genetics
1 3
pattern expected under demographic expansion are indicated with significant negative values of Fu’s Fs.
Complete mtDNA and Rh gene analyses
To reconstruct the mitochondrial genome of each individual, we used as a starting reference the Eleotris acanthopoma mtDNA (Miya et al. 2003) available on MitoFish (Mitochon-drial Genome Database of Fish; Iwasaki et al. 2013). The consensus of each mitogenome was primarily checked man-ually (assembly success, coverage assessment, comparison to avaible COI sequences for the same specimen, BLAST searches; Altschul et al. 1997) in Geneious 9.0.5 (Kearse et al. 2012). Then the consensus sequence was annotated using MitoAnnotator (Iwasaki et al. 2013) and each gene was quality checked for coding sequences, stop codons, posi-tion of the SNPs. After checking the content and the order of each gene, mitogenomes were aligned with MAFFT 7.309 (implemented in Geneious).
In the present study, we decided to use the 13 protein-coding genes and not the complete mitogenome (11 516 vs. 16 510 bp) because the 22 tRNA, the 2 rRNA and the control region were not informative enough; percentages of divergence were under 2% while for protein-coding genes they were higher than 2% (except for ATPase 8) and one mitogenome presented an incomplete tRNA-Asn. However, we also performed an analysis in the complete mitogenome dataset to check whether the results were the same.
A phylogenetic tree based on the thirteen concatenated genes was performed using Bayesian inference (MrBayes v.3.2; Ronquist et al. 2012). The best-fitting models of evolu-tion were computed in PartitionFinder (Lanfear et al. 2012). The analysis was realised using the three-codon positions for each genes as partition (Table 7) and was run for 10 mil-lion generations, sampling every 200 generations with two independent runs to access convergence.
For Rh gene (803 bp), data processing and sequence assembly were done in Geneious 9.0.5 (Kearse et al. 2012) and all sequences were aligned with Muscle Alignment (implemented in Geneious). A phylogenetic tree was per-formed using Bayesian inference (MrBayes v.3.2; Ronquist
et al. 2012). Three models computed in PartitionFinder (Lanfear et al. 2012) (1st position, JC model; 2nd position, HKY model; 3rd position, HKY + I model) were run for 10 million generations, sampling every 100 generations with two independent runs to access convergence.
For each analysis, run convergence was checked using TRACER v.1.6.0 (Rambaut and Drummond 2007). Trees were summarised using the 50% majority rule method after discarding the first 25% of the sample as burnin and visualised using FigTree v.1.4.2 (Rambaut 2007). The per-centage of differences between sequences and the num-ber of bases, which are not identical were calculated on Geneious 9.0.5 (Tables 8, 9 in Supplementary material).
For each bayesian tree, three other species of Eleotris were used as outgroups: E. acanthopoma Bleeker, 1853, E. melanosoma Bleeker, 1852 and E. bosetoi Mennesson et al. 2016. The corresponding mtDNA and Rh sequences were generated for this study.
Results
Gene diversity for mtDNA COI
A total of 585 bp of mtDNA COI from 557 individuals were obtained from E. fusca and deposited in GenBank (Accession Numbers: MH497864–MH498420). The num-ber of individuals sequenced (N), haplotypes diversity (Hd), number of haplotypes (h) and nucleotides diver-sity (π) for each country and each region are provided in Tables 3 and 4.
Haplotypes diversity (Hd) in the 18 populations was between 0.458 and 1 (Table 3) and, nucleotide diversity (π) was between 0.001 and 0.02. Same results were observed when the analysis was performed for the populations grouped by regions (Table 4) i.e., the lowest haplotype and nucleotide diversities were found for the CPO (Hd = 0.573; π = 0.002) while all the others—SWPO, NWPO, NWIO, SWIO—have an haplotype diversity around 0.8 and a nucleotide diversity between 0.004 and 0.011.
Table 4 Molecular diversity indices for mtDNA COI sequences for each analysed population grouped into 5 regions
Sample size (N), haplotype diversity (Hd), number of haplotypes (h), nucleotide diversity (π), Fu’s Fs-statistics. Fs values Significant (p-value ≤ 0.05) are in bold
Regions Population N Hd h π Fs
Central Pacific Ocean CPO 121 0.573 14 0.002 − 7.12Southwest Pacific Ocean SWPO 271 0.886 87 0.011 − 24.61Northwest Pacific Ocean NWPO 85 0.884 35 0.004 − 27.15Northwest Indian Ocean NWIO 30 0.805 12 0.009 − 0.84Southwest Indian Ocean SWIO 53 0.820 23 0.005 − 14.97

Conservation Genetics
1 3
Tabl
e 5
Pai
rwis
e F S
T va
lues
for t
he m
tDN
A C
OI h
aplo
type
s of
the
18 p
opul
atio
ns (b
elow
dia
gona
l) an
d as
soci
ated
p v
alue
s (a
bove
dia
gona
l; si
gnifi
cant
p v
alue
s ar
e in
dica
ted
with
the
sym
bol
“+”)
Sign
ifica
nt p
airw
ise
F ST
valu
es a
re g
iven
bol
d (p
val
ue ≤
0.05
)
MA
DM
AY
MA
SCO
MI-
BAR
KI
CAR
I-
PAVA
NN
CAFI
DH
OO
SAM
SOL
COO
AU
SSO
CM
AR
MA
D−
−−
++
++
++
++
++
++
++
MA
Y−
0.04
2−
−+
++
++
++
++
++
++
+M
AS
0.10
30.
010
−+
++
++
++
++
++
++
+CO
M0.
039
− 0.
019
0.015
++
++
++
++
++
++
++
I-BA
0.935
0.900
0.849
0.937
−−
−−
−−
−−
−+
++
+R
KI
0.929
0.901
0.858
0.931
− 0.
020
−−
−−
−−
−−
++
++
CAR
0.963
0.892
0.816
0.952
0.04
3−
0.03
8−
++
−−
−−
++
++
I-PA
0.926
0.902
0.862
0.928
− 0.
004
0.00
1−
0.11
6−
−−
−−
−+
++
+VA
N0.927
0.909
0.881
0.928
0.00
50.024
− 0.
149
0.00
0−
−−
−−
++
++
NCA
0.932
0.913
0.887
0.933
0.01
00.023
− 0.
121
− 0.
009
0.00
2−
−−
++
++
+FI
D0.941
0.889
0.816
0.942
− 0.
061
− 0.
058
− 0.
055
− 0.
070
− 0.
043
− 0.
058
−−
++
++
+H
OO
0.960
0.892
0.820
0.951
− 0.
001
− 0.
026
0.26
8−
0.00
90.
008
0.03
10.
000
−−
++
++
SAM
0.928
0.894
0.838
0.932
− 0.
019
0.00
5−
0.06
50.
008
0.00
70.
023
− 0.
092
− 0.
032
−+
++
+SO
L0.705
0.728
0.683
0.716
− 0.
001
0.01
0−
0.14
40.
013
0.027
0.028
− 0.
095
− 0.
084
− 0.
002
++
++
COO
0.968
0.920
0.881
0.963
0.736
0.704
0.823
0.688
0.673
0.697
0.763
0.808
0.712
0.293
++
+A
US
0.982
0.948
0.930
0.978
0.836
0.802
0.900
0.785
0.748
0.765
0.869
0.891
0.826
0.364
0.04
8+
+SO
C0.974
0.937
0.913
0.970
0.779
0.746
0.845
0.729
0.700
0.721
0.804
0.833
0.763
0.324
− 0.
015
0.03
0+
MA
R0.975
0.901
0.835
0.960
0.723
0.685
0.953
0.673
0.679
0.700
0.800
0.909
0.699
0.248
0.891
0.936
0.902

Conservation Genetics
1 3
Phylogeographic analysis for mtDNA COI
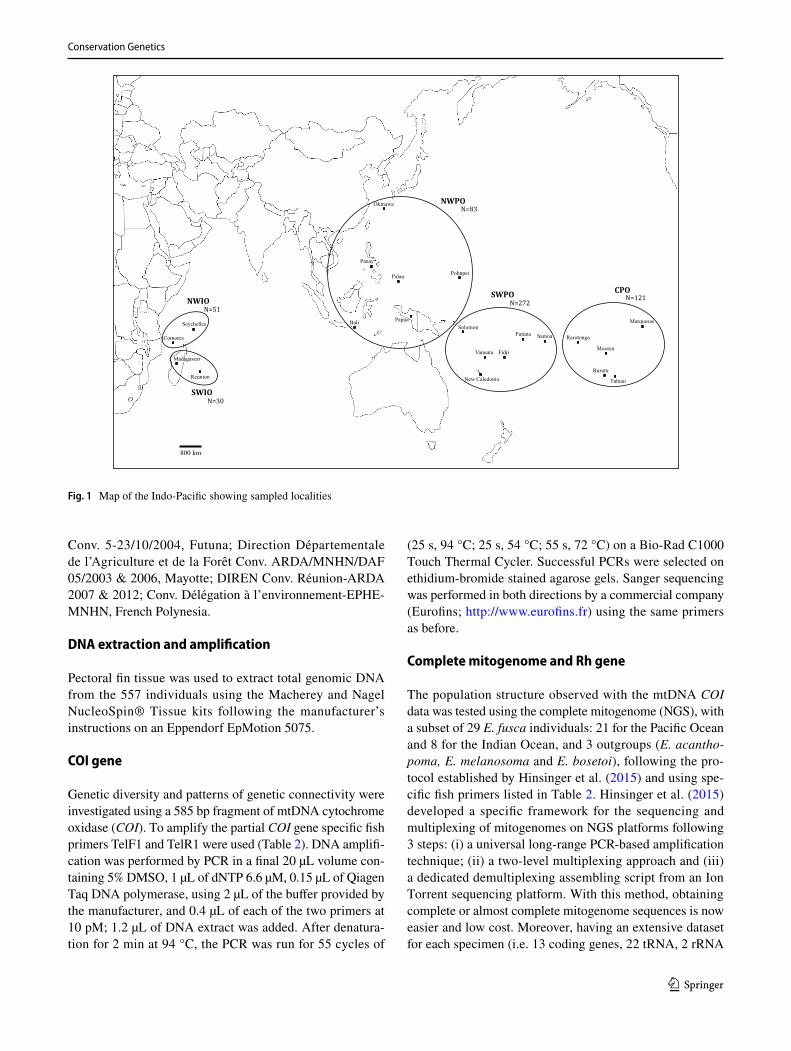
The haplotype network from mtDNA COI showed two main distinct haplogroups separated by 25 nucleotide substitutions (5.2% average divergence, p-distance) plus 3 median vec-tors (Fig. 2). The individuals sampled in the Indian Ocean (NWIO and SWIO) were included in the first haplogroup, which exhibited a star-like topology with no obvious geo-graphic patterns (Fig. 2). The second haplogroup was com-posed of samples from the Pacific Ocean (NWPO, SWPO and CPO) and a geographical structuration is obvious;
Table 6 Pairwise FST values for the mtDNA COI haplotypes of the 5 biogeographic regions (below diagonal) and associated p values (above diagonal; significant p values are indicated with the symbol “+”)
Significant pairwise FST values are given in bold (p value ≤ 0.05)
CPO SWPO NWPO SWIO NWIO
CPO + + + +SWPO 0.461 − + +NWPO 0.723 0.005 + +SWIO 0.936 0.794 0.895 −NWIO 0.949 0.823 0.921 0.013
Table 7 Details of BIC models used for the three-codon positions for each gene
BIC model Gene_codon positions
HKY + I ATP6_1, ATP6_2, ATP8_1, ATP8_2, Cytb_1, Cytb_2,_ND1_1, ND1_2, ND2_1, ND2_2, ND3_1, ND3_2, ND4L_1, ND4L_2, ND4_1, ND4_2, ND5_1, ND5_2, COIII_2, COII_2, COI_2
GTR + I + G ATP6_3, ATP8_3, COII_3, COII_3, Cytb_3, ND1_3, ND3_3, ND4L_3, ND4_3, ND5_3GTR + I ND2_1, ND2_3K80 + I COIII_1, COII_1, COI_1GTR + G ND6_1HKY + I + G ND6_2, ND6_3
Fig. 2 Median-joining network for E. fusca from the mtDNA COI. Circles represent individual haplotypes and are color-coded on geo-graphical locations. Circles are sized proportionally to the haplotype
frequencies. All haplotypes are separated by one mutational step; cross-bars on branches indicate when mutation steps are higher than one nucleotide. Each little red circle represents a median vector
Conservation Genetics
1 3
the NWPO and SWPO are pooled in a sub-group, and the CPO is in fringe of it (Fig. 2). Two individuals sampled in the Indian Ocean (both from Reunion Island) and one from Moorea (French Polynesia) were included in the NWPO–SWPO sub-group. One specimen from Mayotte Island and one from Vanuatu were found in the CPO sub-group, Marquesas formed an isolated group and shared no haplotypes with any other location (Fig. 2).
The AMOVA permitted to calculate FST values. The observation of significant FST values (p ≤ 0.05) revealed different genetic divergence patterns across among the 18 countries (Table 6). No significant genetic differentiation (p > 0.05) was observed within the Indian Ocean countries. The comparison of Indian and Pacific oceans countries indi-cated a strong and significant genetic differentiation (FST mean = 0.901; 5.2% average divergence). Within the Pacific Ocean countries, we observed that few FST were significant between NWPO and SWPO, those that were significant presented a comparatively lower genetic differentiation levels (FST VAN–RKI = 0.024; FST NCA–RKI = 0.023; FST VAN–SOL = 0.027; FST NCA–SOL = 0.028). A high level of population structure between CPO and the sub-group NWPO–SWPO was found (FST mean = 0.725; 0.5% aver-age divergence); however this structuration level was less high when we compared CPO to Solomon Islands (FST mean = 0.307). Within the CPO, Marquesas presented high genetic structure (FST mean = 0.910; 1.4% average diver-gence) with the other CPO islands (i.e. Rarotonga [Cook Islands], Rurutu, Tubuai and Moorea [French Polynesia]). When countries were grouped by region, we still observe a strong significant genetic structure between the Indian and Pacific Ocean (0.794 ≤ FST ≤ 0.949) (Table 6) and that CPO region is less genetically differentiated from SWPO (FST = 0.461) than NWPO (FST = 0.723). The majority of Fu’s Fs values were significantly negative (Table 3) that could be evidence for recent demographic expansion for some of the 18 countries. For the 5 regions of the Indo-Pacific, all Fu’s Fs values were significantly negative except for the NWIO (Table 4).
The Mantel test showed a positive and significant cor-relation between genetic and geographic distances when we focused on the 5 regions (r = 0.83; p value = 0.002); and geography explained 68% of the genetic structuration. How-ever, when the test was based on the 18 countries (r = 0.36; p value < 10− 4) geography explained only 13% of the genetic structuration among populations.
Phylogenetic analyses: complete mtDNA and Rh gene
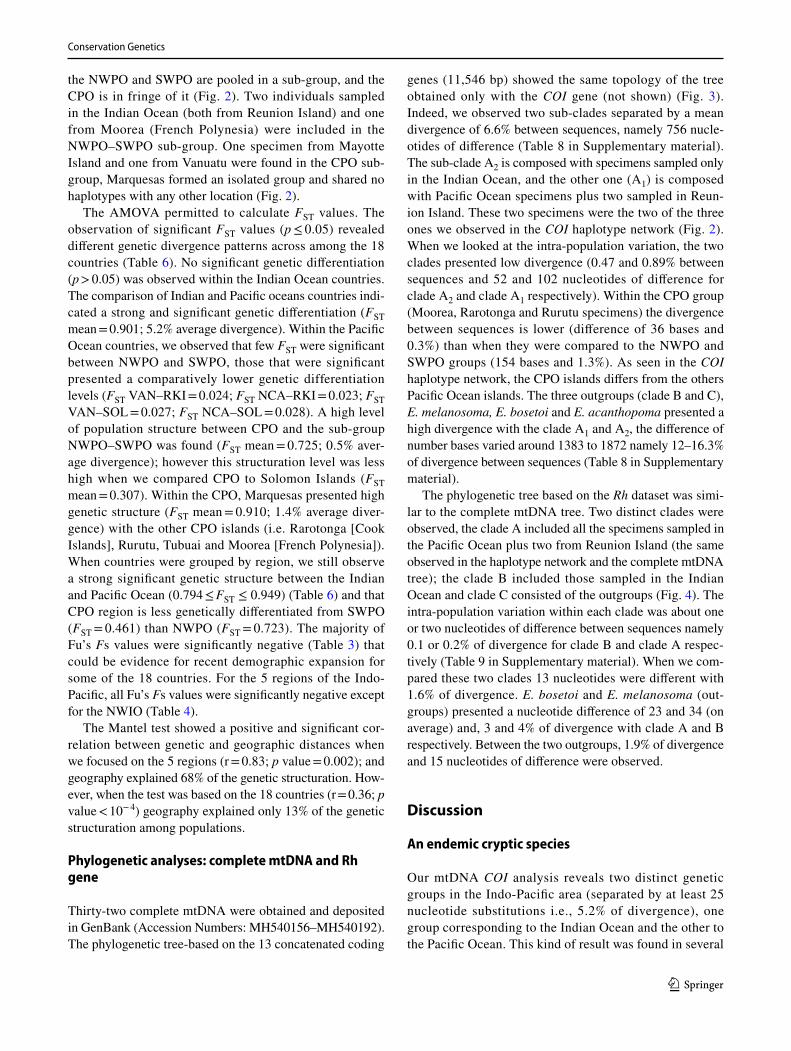
Thirty-two complete mtDNA were obtained and deposited in GenBank (Accession Numbers: MH540156–MH540192). The phylogenetic tree-based on the 13 concatenated coding
genes (11,546 bp) showed the same topology of the tree obtained only with the COI gene (not shown) (Fig. 3). Indeed, we observed two sub-clades separated by a mean divergence of 6.6% between sequences, namely 756 nucle-otides of difference (Table 8 in Supplementary material). The sub-clade A2 is composed with specimens sampled only in the Indian Ocean, and the other one (A1) is composed with Pacific Ocean specimens plus two sampled in Reun-ion Island. These two specimens were the two of the three ones we observed in the COI haplotype network (Fig. 2). When we looked at the intra-population variation, the two clades presented low divergence (0.47 and 0.89% between sequences and 52 and 102 nucleotides of difference for clade A2 and clade A1 respectively). Within the CPO group (Moorea, Rarotonga and Rurutu specimens) the divergence between sequences is lower (difference of 36 bases and 0.3%) than when they were compared to the NWPO and SWPO groups (154 bases and 1.3%). As seen in the COI haplotype network, the CPO islands differs from the others Pacific Ocean islands. The three outgroups (clade B and C), E. melanosoma, E. bosetoi and E. acanthopoma presented a high divergence with the clade A1 and A2, the difference of number bases varied around 1383 to 1872 namely 12–16.3% of divergence between sequences (Table 8 in Supplementary material).
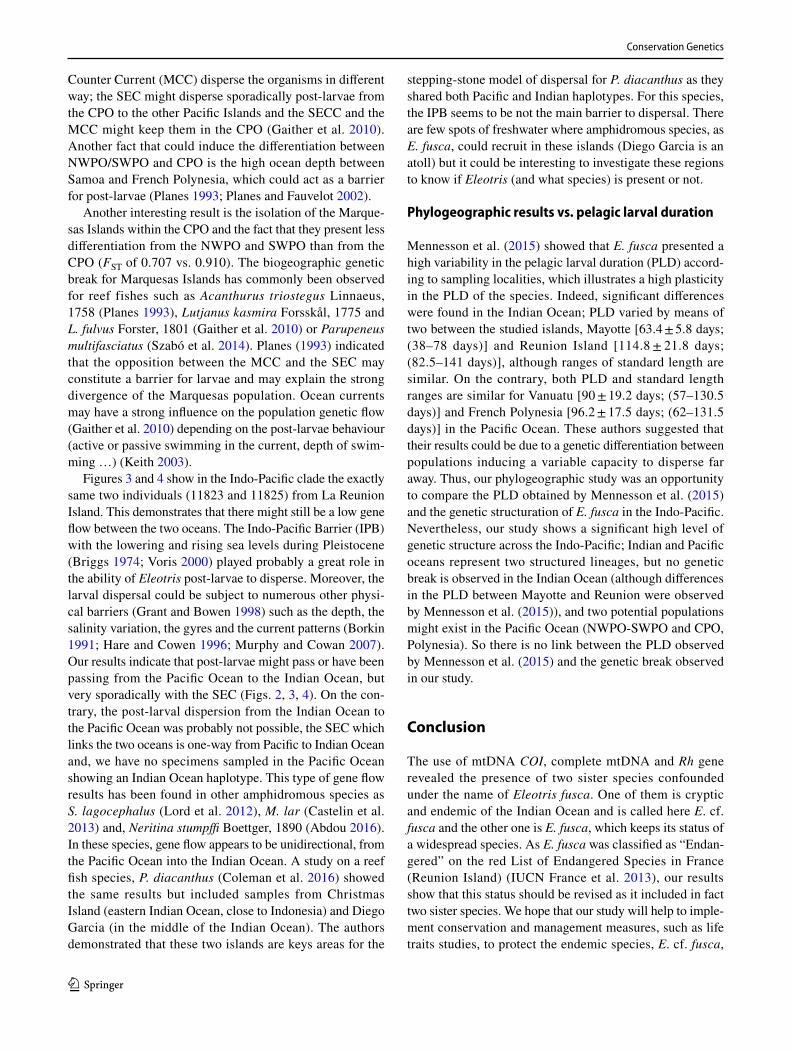
The phylogenetic tree based on the Rh dataset was simi-lar to the complete mtDNA tree. Two distinct clades were observed, the clade A included all the specimens sampled in the Pacific Ocean plus two from Reunion Island (the same observed in the haplotype network and the complete mtDNA tree); the clade B included those sampled in the Indian Ocean and clade C consisted of the outgroups (Fig. 4). The intra-population variation within each clade was about one or two nucleotides of difference between sequences namely 0.1 or 0.2% of divergence for clade B and clade A respec-tively (Table 9 in Supplementary material). When we com-pared these two clades 13 nucleotides were different with 1.6% of divergence. E. bosetoi and E. melanosoma (out-groups) presented a nucleotide difference of 23 and 34 (on average) and, 3 and 4% of divergence with clade A and B respectively. Between the two outgroups, 1.9% of divergence and 15 nucleotides of difference were observed.
Discussion
An endemic cryptic species
Our mtDNA COI analysis reveals two distinct genetic groups in the Indo-Pacific area (separated by at least 25 nucleotide substitutions i.e., 5.2% of divergence), one group corresponding to the Indian Ocean and the other to the Pacific Ocean. This kind of result was found in several

Conservation Genetics
1 3
marine and diadromous widespread species as Nerita albi-cilla Linnaeus, 1758 (Crandall et al. 2008) a gasteropod and, three fish species, Kuhlia rupestris Lacepède, 1802 (Feutry et al. 2013), Sicyopterus lagocephalus Pallas, 1770 (an amphidromous goby) (Lord et al. 2012) and Cepha-lopholis argus Schneider, 1801 (Gaither et al. 2011). However, in these studies, according to their results and low percentages of divergence, the authors concluded to the structuration in two different populations, one in the Indian Ocean and the other in the Pacific Ocean. mtDNA COI is commonly used for Barcoding and molecular tax-onomy and it is generally accepted that 3% of divergence between two groups, is enough to assume two different species (Dettai et al. 2011). Especially as the species level differentiation is also supported by morpho-meritics anal-yses with a difference in scales series (Mennesson and Keith 2017). In our study, the complete mtDNA and the
Rh gene also supported species level differentiation i.e., they supported the same groups including the same speci-mens with respectively 756 and 13 nucleotide substitutions (6.6 and 1.6% of mean divergence; Table 8 in Supplemen-tary material). One lineage is composed by the real E. fusca [type locality CPO, French Polynesia], specimens of Pacific Ocean and two sampled in Reunion Island [clade A1 (Fig. 3) and clade A (Fig. 4)] and the other lineage is composed by a cryptic species present only in the Indian Ocean and named here E. cf. fusca [clade A2 (Fig. 3) and clade B (Fig. 4)].
Few studies on widespread Pacific species found also cryptic species such as within the fish Acanthurus nigro-ris Valenciennes, 1835 (Dibattista et al. 2011) (25 muta-tions and 4.1% of divergence) between Hawaii specimens and the remaining of the Pacific Ocean or, within the shrimp Parupeneus multifasciatus Quoy and Gaimard,
0.04
E_melanosoma_12487_Solomon
E_cf_fusca_78_Moheli
E_fusca_16117_Vanuatu
E_cf_fusca_75_Anjouan
E_fusca_13956_Okinawa
E_fusca_28_Samoa
E_fusca_11763_Moorea
E_fusca_13955_Okinawa
E_fusca_16079_Samoa
E_fusca_115_Futuna
E_cf_fusca_74_Anjouan
E_fusca_16001_Rarotonga
E_fusca_104_New-Caledonia
E_fusca_16118_Vanuatu
E_fusca_16002_Rarotonga
E_bosetoi_13528_Solomon
E_fusca_16082_Samoa
E_fusca_103_New-Caledonia
E_fusca_6_Papua
E_fusca_L_159_Vanuatu
E_fusca_11823_Reunion
E_fusca_132_Okinawa
E_fusca_4_Papua
E_fusca_11780_Rurutu
E_fusca_9540_Vanuatu
E_cf_fusca_103_3_Moheli
E_acanthopoma_24_Seychelles
E_fusca_16122_New-Caledonia
E_fusca_16077_Samoa
E_fusca_11825_Reunion
E_cf_fusca_22_Seychelles
E_cf_fusca_70_Madagascar
A
A1
A2
BC
Eleotris fuscaIndo-Pacific
Eleotris cf. fuscaIndian Ocean
1
1
1
1
0.74
1
0.99
1
1
0.83
1
0.58
1
1
0.77
1
0.96
1
1
0.99
0.95
1
1
0.51
0.65
1
0.63
1
Fig. 3 Bayesian tree of the complete mtDNA for sequences specimens of E. fusca. Numbers on the nodes represent posterior probabilities

Conservation Genetics
1 3
1825 (Szabó et al. 2014) (25 nucleotide substitutions (FST = 0.9) and a genetic difference of 4.12%) separat-ing the specimens from Marquesas Islands from the other Pacific islands.
The star-like pattern of the Indian Ocean group in the COI haplotype network (Fig. 2) is typically associated to a scenario of past colonisation events followed by demo-graphic expansions, which could be due to past bottlenecks after population depletions caused by climatic events [e.g. during Pleistocene with the repeated lowering sea levels (Sathiamurthy and Voris 2006)]. This star-like pattern has been observed in some studies with Lutjanus fulvus Forster, 1801, a reef fish, (Gaither et al. 2010), or S. lagocephalus (Lord et al. 2012) or Sicyopus zosterophorum Bleeker, 1856 (Taillebois et al. 2013), two amphidromous fishes.
E. fusca, a widespread species in the Indo‑Pacific
In the Pacific group, the CPO populations (Polynesia) of E. fusca are genetically differentiated from the NWPO and the SWPO populations (see COI and mtDNA results). Cas-telin et al. (2013) observed the same isolation of the CPO for Macrobrachium lar Fabricius, 1798, a widespread and amphidromous crustacean species, as Lord et al. (2012) and Coleman et al. (2016) for S. lagocephalus and Pygoplites diacanthus Boddaert, 1772 (a reef fish), respectively. This isolation of the CPO from the remaining of the Pacific might be explained by the use of different currents by the post-larvae when they disperse in the ocean (Abdou et al. 2015). Indeed, the South Equatorial Current (SEC), the South Equatorial Counter Current (SECC) and the Marquesas
0.0020
E. fusca_16002_Rarotonga
E. fusca_16122_New-Caledonia
E. fusca_16001_Rarotonga
E. melanosoma_1740_Indonesia
E. fusca_114_Palau
E. fusca_6_Papua
E. fusca_16079_Samoa
E. fusca_L-146_Papua
E. fusca_16082_Samoa
E. fusca_L-149_Papua
E. cf. fusca_84_Moheli
E. fusca_11825_Reunion*
E. fusca_115_Futuna
E. fusca_11763_Moorea
E. fusca_L-46_Moorea
E. fusca_11823_Reunion*
E. cf. fusca_103-3_Moheli
E. fusca_28_Samoa
E. cf. fusca_22_Seychelles
E. fusca_107_New-Caledonia
E. fusca_9540_Vanuatu
E. fusca_16117_Vanuatu
E. fusca_L-159_Vanuatu
E. fusca_16087_Marquesas
E. fusca_132_Okinawa
E. bosetoi_200_Solomon
E. fusca_104_New-Caledonia
E. fusca_L-140_Papua
E. fusca_13955_Okinawa
E. fusca_12444_Bali
E. fusca_4_Papua
E. fusca_16024_Samoa
E. fusca_L-144_Vanuatu
E. fusca_3_Papua
E. fusca_11780_Rurutu
E. fusca_16077_Samoa
E. fusca_16118_Vanuatu
1
1
1
1
1
Eleotris fuscaIndo-Pacific
Eleotris cf. fuscaIndian Ocean
A
B
C
Fig. 4 Bayesian tree of the Rhodopsin gene (Rh) for sequenced specimens of E. fusca. Numbers on the nodes represent posterior probabilities
Conservation Genetics
1 3
Counter Current (MCC) disperse the organisms in different way; the SEC might disperse sporadically post-larvae from the CPO to the other Pacific Islands and the SECC and the MCC might keep them in the CPO (Gaither et al. 2010). Another fact that could induce the differentiation between NWPO/SWPO and CPO is the high ocean depth between Samoa and French Polynesia, which could act as a barrier for post-larvae (Planes 1993; Planes and Fauvelot 2002).
Another interesting result is the isolation of the Marque-sas Islands within the CPO and the fact that they present less differentiation from the NWPO and SWPO than from the CPO (FST of 0.707 vs. 0.910). The biogeographic genetic break for Marquesas Islands has commonly been observed for reef fishes such as Acanthurus triostegus Linnaeus, 1758 (Planes 1993), Lutjanus kasmira Forsskål, 1775 and L. fulvus Forster, 1801 (Gaither et al. 2010) or Parupeneus multifasciatus (Szabó et al. 2014). Planes (1993) indicated that the opposition between the MCC and the SEC may constitute a barrier for larvae and may explain the strong divergence of the Marquesas population. Ocean currents may have a strong influence on the population genetic flow (Gaither et al. 2010) depending on the post-larvae behaviour (active or passive swimming in the current, depth of swim-ming …) (Keith 2003).
Figures 3 and 4 show in the Indo-Pacific clade the exactly same two individuals (11823 and 11825) from La Reunion Island. This demonstrates that there might still be a low gene flow between the two oceans. The Indo-Pacific Barrier (IPB) with the lowering and rising sea levels during Pleistocene (Briggs 1974; Voris 2000) played probably a great role in the ability of Eleotris post-larvae to disperse. Moreover, the larval dispersal could be subject to numerous other physi-cal barriers (Grant and Bowen 1998) such as the depth, the salinity variation, the gyres and the current patterns (Borkin 1991; Hare and Cowen 1996; Murphy and Cowan 2007). Our results indicate that post-larvae might pass or have been passing from the Pacific Ocean to the Indian Ocean, but very sporadically with the SEC (Figs. 2, 3, 4). On the con-trary, the post-larval dispersion from the Indian Ocean to the Pacific Ocean was probably not possible, the SEC which links the two oceans is one-way from Pacific to Indian Ocean and, we have no specimens sampled in the Pacific Ocean showing an Indian Ocean haplotype. This type of gene flow results has been found in other amphidromous species as S. lagocephalus (Lord et al. 2012), M. lar (Castelin et al. 2013) and, Neritina stumpffi Boettger, 1890 (Abdou 2016). In these species, gene flow appears to be unidirectional, from the Pacific Ocean into the Indian Ocean. A study on a reef fish species, P. diacanthus (Coleman et al. 2016) showed the same results but included samples from Christmas Island (eastern Indian Ocean, close to Indonesia) and Diego Garcia (in the middle of the Indian Ocean). The authors demonstrated that these two islands are keys areas for the
stepping-stone model of dispersal for P. diacanthus as they shared both Pacific and Indian haplotypes. For this species, the IPB seems to be not the main barrier to dispersal. There are few spots of freshwater where amphidromous species, as E. fusca, could recruit in these islands (Diego Garcia is an atoll) but it could be interesting to investigate these regions to know if Eleotris (and what species) is present or not.
Phylogeographic results vs. pelagic larval duration
Mennesson et al. (2015) showed that E. fusca presented a high variability in the pelagic larval duration (PLD) accord-ing to sampling localities, which illustrates a high plasticity in the PLD of the species. Indeed, significant differences were found in the Indian Ocean; PLD varied by means of two between the studied islands, Mayotte [63.4 ± 5.8 days; (38–78 days)] and Reunion Island [114.8 ± 21.8 days; (82.5–141 days)], although ranges of standard length are similar. On the contrary, both PLD and standard length ranges are similar for Vanuatu [90 ± 19.2 days; (57–130.5 days)] and French Polynesia [96.2 ± 17.5 days; (62–131.5 days)] in the Pacific Ocean. These authors suggested that their results could be due to a genetic differentiation between populations inducing a variable capacity to disperse far away. Thus, our phylogeographic study was an opportunity to compare the PLD obtained by Mennesson et al. (2015) and the genetic structuration of E. fusca in the Indo-Pacific. Nevertheless, our study shows a significant high level of genetic structure across the Indo-Pacific; Indian and Pacific oceans represent two structured lineages, but no genetic break is observed in the Indian Ocean (although differences in the PLD between Mayotte and Reunion were observed by Mennesson et al. (2015)), and two potential populations might exist in the Pacific Ocean (NWPO-SWPO and CPO, Polynesia). So there is no link between the PLD observed by Mennesson et al. (2015) and the genetic break observed in our study.
Conclusion
The use of mtDNA COI, complete mtDNA and Rh gene revealed the presence of two sister species confounded under the name of Eleotris fusca. One of them is cryptic and endemic of the Indian Ocean and is called here E. cf. fusca and the other one is E. fusca, which keeps its status of a widespread species. As E. fusca was classified as “Endan-gered” on the red List of Endangered Species in France (Reunion Island) (IUCN France et al. 2013), our results show that this status should be revised as it included in fact two sister species. We hope that our study will help to imple-ment conservation and management measures, such as life traits studies, to protect the endemic species, E. cf. fusca,

Conservation Genetics
1 3
in the Indian Ocean and also the widespread one, E. fusca, which seems rare in this ocean.
Acknowledgements The study was made possible by a grant given to the French Ichthyological Society in the context of the ‘Critical Ecosys-tem Partnership Fund (CEPF)’ (Melanesia hotspot). The Critical Eco-system Partnership Fund is a joint initiative of l’Agence Française de Développement, Conservation International, the Global Environment Facility, the Government of Japan, the MacArthur Foundation and the World Bank. A fundamental goal is to ensure civil society is engaged in biodiversity conservation. For the Seychelles, we would like to thank the UNDP and particularly E. Henriette and B. Santerre. Thanks to R. Fanchette, Ministry of Environment and Energy, Wildlife, Trade and Conservation section. For the Comoros, we would like to thank Yahaya Ibrahim (CNDRS), for Madagascar, J. Aride from Madagascar National Parks the Manager of Masoala National Parc and the DIAM-SOI team. For Reunion and Mayotte, we thank the Environnement Office, the Agriculture Office, and ARDA. For the Solomon Islands, we would like to acknowledge the customary landowners, villages and tribes, ESSI and the Solomon Islands’ Government. For Vanuatu, we would like to acknowledge the Department of Environmental Protec-tion and Conservation and D. Kalfatak. For Samoa, we acknowledge the Samoan Ministry of Natural Resources Environment and Meteorol-ogy and Conservation International. For the Cook Islands, we would like to thank the Office of the Prime Minister. For French Polynesia, we want to thank the Research Delegation (especially J.Y. Meyer), and the Environment Delegation. For the loan of specimens, we thank: P. Pruvost, R. Causse, Z. Gabsi, C. Ferrara, M. Hautecœur (MNHN). Finally, we would like to thank the “Service de systématique molécu-laire” of the MNHN (CNRS UMS 2700) for the laboratory access and the assistance provided.
References
Abdou A (2016) Amphidromie et phylogéographie des Neritidae amphidromes de l’Indo-Pacifique. PhD dissertation, EPHE, Perpignan
Abdou A, Keith P, Galzin R (2015) Freshwater neritids (Mollusca: Gastropoda) of tropical islands, amphidromy as a life cycle, a review. Revue d’Ecologie (Terre et Vie) 70:387–397
Altschul SF, Madden TL, Schäffer AA, Zhang J, Zhang Z, Miller W, Lipman DJ (1997) Gapped BLAST and PSI-BLAST: a new gen-eration of protein dataset search programs. Nucleic Acids Res 25:3389–3402
Bandelt HJ, Forster P, Röhl A (1999) Median-joining networks for inferring intraspecific phylogenies. Mol Biol Evol 16:37–48
Barber PH, Erdmann MV, Palumbi SR (2006) Comparative phyloge-ography of three codistributed stomatopods: origins and timing of regional lineage diversification in the Coral Triangle. Evolution 60:1825–1839
Borkin IV (1991) Ichthyoplankton of western Spitzbergen coastal waters. J Ichthyol 31:680–685
Briggs JC (1974) Marine zoogeography. McGraw-Hill, New YorkCastelin M, Feutry P, Hautecoeur M, Marquet G, Wowor D, Zimmer-
mann G, Keith P (2013) New insight on population genetic con-nectivity of widespread amphidromous prawn Macrobrachium lar (Fabricius, 1789) (Crustacea: Decapoda : Palaeminidae). Mar Biol. https ://doi.org/10.1007/s0022 7-013-2191-y
Chen WJ, Bonillo C, Lecointre G (2003) Repeatability of clades as a criterion of reliability: a case study for molecular phylogeny of Acanthomorpha (Teleostei) with larger number of taxa. Mol Phyl Evol 26:262–288
Coleman RR, Eble JA, Dibatiista JD, Rocha LA, Randall JE (2016) Regal phylogeography: Range-wide survey of the marine angelfish Pyroplites diacanthus reveals evolutionary partitions between the Red Sea, Indian Ocean, and the Pacific Ocean. Mol Phyl Evol 100:243–253
Crandall ED, Frey MA, Grosberg RK, Barber PH (2008) Contrast-ing demographic history and phylogeographical patterns in two Indo-Pacific gastropods. Mol Ecol 17:611–626
De Bruyn M, Mather PB (2007) Molecular signatures of Pleistocene sea-level changes that affected connectivity among freshwater shrimp in Indo-Australian waters. Mol Ecol 16:4295–4307
De Bruyn M, Wilson JA, Mather PB (2004) Huxley’s line demar-cates extensive genetic divergences between eastern and western forms of the giant freshwater prawn, Macrobrachium rosenber-gii. Mol Phyl Evol 30:251–257
Dettai A, Lautredou AC, Bonillo C, Goimbault E, Busson F, Causse R, Couloux A, Cruaud C, Duhamel G, Denys G (2011) The Actinopterygian diversity of the CEAMARC cruises: barcoding and molecular taxonomy as a multi-level tool for new findings. Deep Sea Res II 58:250–263
Dibattista JD, Wilcox C, Craig MT, Rocha LA, Bowen BW (2011) Phylogeography of the Pacific Blueline Surgeonfish, Acanthu-rus nigroris, reveals high genetic connectivity and a cryptic endemic species in the Hawaiian Archipelagos. J Mar Biol Article ID 839134:1–17. https ://doi.org/10.1155/2011/83913 4
Ekman S (1953) Zoogeography of the sea. Sidgwick and Jackson, London
Excoffier L, Smouse PE, Quattro JM (1992) Analysis of molecu-lar variance inferred from metric distances among DNA hap-lotypes: application to human mitochondrial DNA restriction data. Genetic 131:479–491
Excoffier L, Laval G, Schneider S (2005) Arlequin ver. 3.0: An inte-grated software package for population genetics data analysis. Evol Bioinform Online 1:47–50
Feutry P, Vergnes A, Broderick D, Lambourdiere J, Keith P (2013) Stretched to the limit; can a short pelagic larval duration con-nect adult populations of an Indo-Pacific diadromous fish (Kuh-lia rupestris)? Mol Ecol 22:1518–1530
Fu YX (1997) Statistical tests of neutrality of mutations against pop-ulation growth, hitchhiking and background selection. Genetics 147:915–925
Gaither MR, Rocha LA (2013) Origins of species richness in the Indo-Malay-Philippine biodiversity hotspot: evidence for the centre of overlap hypothesis. J Biogeogr 40:1638–1648
Gaither MR, Toonen R, Robertson D, Planes S, Bowen BW (2010) Genetic evaluation of marine biogeographical barriers: perspec-tives from two widespread Indo-Pacific snappers (Lutjanus kas-mira and Lutjanus fulvus). J Biogeogr 37:133–147
Gaither M, Bowen B, Bordenave T, Rocha L, Newman SJ, Gomez J, Herwerden L, Craig M (2011) Phylogeography of the reef fish Cephalopholis argus (Epinephelidae) indicates Pleistocene iso-lation across the indo-pacific barrier with contemporary over-lap in the coral triangle. BMC Evol Biol 11:189. https ://doi.org/10.1186/1471-2148-11-189
Grant WS, Bowen BW (1998) Shallow population histories in deep evolutionary lineages of marine fishes: insights from sardines and anchovies and lessons for conservation. J Hered 89:415–426
Hare JA, Cowen RK (1996) Transport mechanisms of larval and pelagic juvenile bluefish (Pomatomus saltarix) from South Atlantic Bight spawning grounds to Middle Atlantic Bight nurs-ery habitats. Limnol Oceanogr 41:1264–1280
Hinsinger DD, Debruyne R, Thomas M, Denys GP, Mennesson M, Utge J, Dettai A (2015) Fishing for barcoding in the Torrent: from COI to complete mitogenomes on NGS platforms. DNA Barcodes 3:170–186

Conservation Genetics
1 3
IUCN France, MNHN, SEOR, ARDA, Insectarium de La Réunion, GLOBICE and Kélonia (2013) La liste rouge des espèces men-acées en France - Faune de la Réunion. Paris, France. http://www.uicn.fr/Liste -rouge -faune -Reuni on.html
Iwasaki W, Fukunaga T, Isagozawa R, Yamada K, Maeda Y, Satoh TP, Sado T, Mabuchi K, Takeshima H, Miya M, Nishida M (2013) MitoFish and MitoAnnotator: a mitochondrial genome database of fish with an accurate and automatic annotation pipeline. Mol Biol And Evol 30:2531–2540
Kearse M, Moir R, Wilson A, Stones-Havas S, Cheung M, Sturrock S, Buxton S, Cooper A, Markowitz S, Duran C, Thierer T, Ashton B, Mentjies P, Drummond A (2012) Geneious Basic: an integrated and extendable desktop software platform for the organization and analysis of sequence data. Bioinformatics 28:1647–1649
Keith P (2003) Biology and ecology of amphidromous Gobiidae in the Indo-Pacific and the Caribbean regions. J Fish Biol 63:831–847
Keith P, Lord C (2011) Tropical freshwater gobies: amphidromy as a life cycle. In: The biology of Gobies, Science Publishers & CRC Press, pp 243–277
Keith P, Lord C, Vigneux E (2006) In vivo observations on post-larval development of freshwater gobies and eleotrids from French Poly-nesia and New Caledonia. Ichthyol Explor Freshw 17:187–191
Keith P, Hoareau TB, Lord C, Ah-Yane O, Gimmoneau G, Robinet T, Valade P (2008) Characterisation of post-larval to juvenile stages, metamorphosis and recruitments of an amphidromous goby, Sicy-opterus lagocephalus (Pallas) (Teleostei: Gobiidae: Sicydiinae). Mar freshwater Res 59:876–889
Keith P, Marquet G, Lord C. Kalfatak D, Vigneux E (2010) Pois-sons et crustacés d’eau douce du Vanuatu. Société Française d’Ichtyologie, Paris, p 253
Keith P, Marquet G, Gerbeaux P, Vigneux E, Lord C (2013) Pois-sons et crustacés d’eau douce de Polynésie. Société Française d’Ichtyologie, Paris, p 282
Keith P, Lord C, Maeda K (2015) Indo-Pacific Sicydiine Gobies: biodiversity, life traits and conservation. Société Française d’Ichtyologie, Paris, p 256
Keyse J, Crandall E, Toonen RJ, Meyer CP, Treml EA, Riginos C (2014) The scope of published population genetic data for Indo-Pacific marine fauna and future research opportunities in the region. Bull Mar Sci 90:47–78
Kocher TD, Thomas WK, Meyer A, Edwards SV, Pääbo S, Villablanca FX et al (1989) Dynamics of mitochondrial DNA evolution in animals: amplification and sequencing with conserved primers. Proc Natl Acad Sci USA 86:6196–6200
Lanfear R, Calcott B, Ho SYW, Guindon S (2012) PartitionFinder: combined selection of partitioning schemes and substitution mod-els for phylogenetic analyses. Mol Biol Evol 29:1695–1701
Lord C, Lorion J, Dettai A, Watanabe S, Tsukamoto K, Cruaud C, Keith P (2012) From endemism to widespread distribution: phylo-geography of three amphidromous Sicyopterus species (Teleostei: Gobioidei: Sicydiinae). Mar Ecol Prog Ser 455:269–285
Ludt WB, Rocha LA (2015) Shifting seas: the impacts of Pleistocene sea-level fluctuations on the evolution of tropical marine taxa. J Biogeogr 42:25–38
Maeda K, Tachihara K (2004) Instream distributions and feeding habits of two species of sleeper, Eleotris acanthopoma and Eleotris fusca in the Teima River, Okinawa Island. Ichthyol Res 51:233–240
Maeda K, Tachihara K (2006) Fish fauna in the Teima Stream, Okinawa Island. Biol Mag Okinawa 44:7–25
McDowall RM (1992) Diadromy: origins and definition of terminol-ogy. Copeia 1:248–251
McDowall RM, Mitchell CP, Brothers EB (1994) Age at migration from the sea of juvenile Galaxias in New Zealand (Pisces: Galaxi-idae). Bull Mar Sci 54:385–402
Mennesson MI, Keith P (2017) Evidence of two species currently under the name of Eleotris fusca (Gobioidei: Eleotridae) in the Indian Ocean. Cybium 41:213–220
Mennesson MI, Tabouret H, Pécheyran C, Feunteun E, Keith P (2015) Amphidromous life cycle of Eleotris fusca (Gobioidea: Eleotri-dae), a widespread species from the Indo-Pacific studied by otolith analysis. Cybium 39:249–260
Miya M, Takeshima H, Endo H, Ishiguro NB, Inoue JG, Mukai T, Satoh TP, Yamaguchi M, Kawaguchi A, Mabuchi K, Shirai SM, Nishida M (2003) Major patterns of higher teleostean phylog-enies: a new perspective based on 100 complete mitochondrial DNA sequences. Mol Phyl Evol 26:121–138
Mirams AGK, Treml EA, Shields JL, Liggins L, Riginos C (2011) Vicariance and dispersal across an intermittent barrier: population genetic structure of marine animals across the Torres Strait land bridge. Coral Reefs 30:937–949
Murphy CA, Cowan JHJR. (2007) Production, marine larval retention or dispersal, and recruitment of amphidromous Hawaiian gob-ioids: issues and implications. In: Evenhuis NL, Fitzsimons JM, Biology of Hawaiian Streams and Estuaries. Bishop Museum Bul-letin in Cultural Environmental Studies vol 3, pp 63–74
Myers GS (1949) Usage of anadromous, catadromous and allied terms for migratory fishes. Copeia 2:89–97
Nelson SG, Parham JE, Tibatts RB, Camacho FA, Lebere T, Smith BD (1997) Distribution and microhabitats of the amphidromous gobies in streams of Micronesia. Micronesica 30:83–91
Planes S (1993) Genetic differentiation in relation to restricted lar-val dispersal of the convict surgeonfish Acanthurus triostegus in French Polynesia. Mar Ecol 98:237–246
Planes S, Fauvelot C (2002) Isolation by distance and vicariance drive genetic structure of a coral reef fish in the Pacific Ocean. Soc Study Evol 56:378–399
Pous S, Feunteun E, Ellien C (2010) Investigation of tropical eel spawning area in the south-western indian ocean: influence of the oceanic circulation. Prog Oceanogr 86:396–413
Rambaut A (2007) FigTree v1.3.1. Available at http://tree.bio.ed.ac.uk/softw are/figtr ee/
Rambaut A, Drummond AJ (2007) Tracer v1.4, Available at http://beast .bio.ed.ac.uk/Trace r
Ronquist F, Teslenko M, Van der Mark P, Ayres DL, Darling A, Ho ̈hna S, Larget B, Liu L, Suchard MA, Huelsenbeck JP (2012) MrBayes 3.2: efficient Bayesian phylogenetic inference and model choice across a large model space. Syst Biol 61:1–4
Sathiamurthy E, Voris HK (2006) Maps of Holocene sea level trans-gression and submerged lakes on the Sunda Shelf. Nat Hist J Chu-lalongkorn Univ 2:1–43
Spalding MD, Fox HE, Halpern BS, McManus MA, Molnar J, Allen GR, Davidson N, Jorge ZA, Lombana AL, Lourie SA et al (2007) Marine ecoregions of the world: a bioregionalization of coastal and shelf areas. Bioscience 57:573–583
Szabó Z, Smelgrove B, Craig MT, Rocha LA, Bowen BW (2014) Phy-logeography of the manybar goatfish, Parupeneus multifasciatus, reveals isolation of the Hawaiian Archipelago and a cryptic spe-cies in the Marquesas Islands. Bull Mar Sci 90:493–512
Taillebois L, Castellin M, Ovenden JR, Bonillo C, Keith P (2013) Contrasting genetic structure among populations of two amphi-dromous fish species (Sicydiinae) in the Central West Pacific. Plos ONE 8:e75465
Voris HK (2000) Maps of Pleistocene sea levels in Southeast Asia: shorelines, river systems and time durations. J Biogeogr 27:1153–1167
Watson RE, Keith P, Marquet G (2007) Akihito vanuatu, a new genus and new species of freshwater goby from the South Pacific (Tel-eostei: Gobioidei: Sicydiinae). Cybium 31:341–349