connecticut department of energy and environmental protection · 2015-12-08 · connecticut...
TRANSCRIPT

Connecticut Department of Energy and Environmental Protection
Connecticut Department of Energy and Environmental Protection
GC3 Analysis, Data, and Metrics Working
Group Meeting
December 3, 2015 2:30—4:30 p.m.
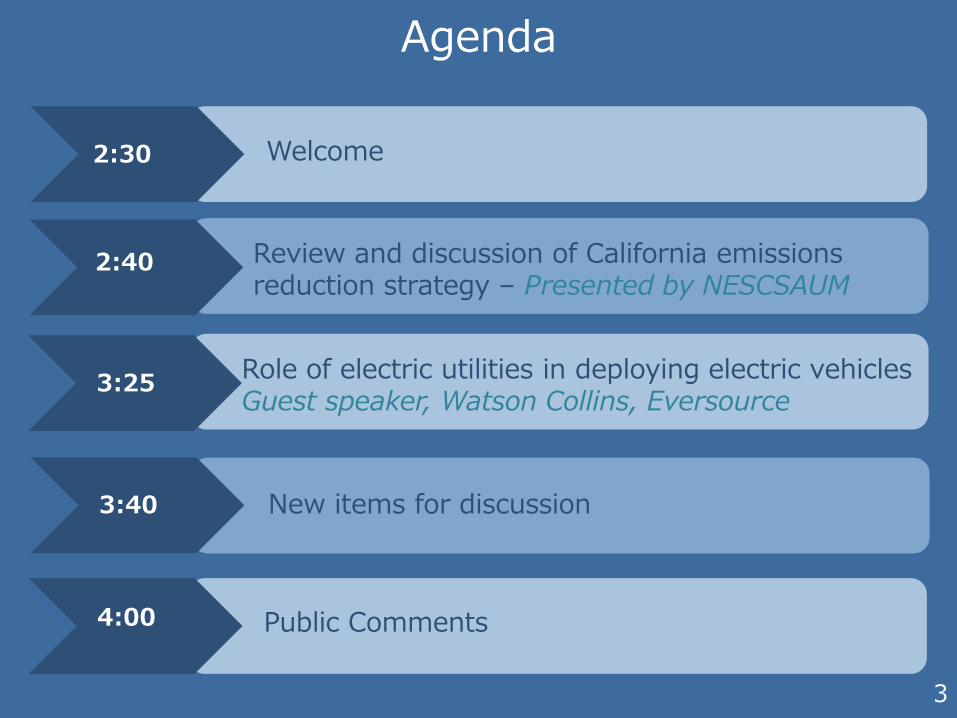
Agenda
3
Welcome
Review and discussion of California emissions reduction strategy – Presented by NESCSAUM
Role of electric utilities in deploying electric vehicles Guest speaker, Watson Collins, Eversource
2:30
2:40
3:25
New items for discussion 3:40
Public Comments 4:00

Agenda
4
Welcome
Review and discussion of California emissions reduction strategy – Presented by NESCSAUM
Role of electric utilities in deploying electric vehicles Guest speaker, Watson Collins, Eversource
2:30
2:40
3:25
New items for discussion 3:40
Public Comments 4:00
Meeting Goals
• Review of GHG contributors and broad strategies for reducing emissions
• Summarize the foundation in place in CT to promote the technology transformation needed to achieve climate goals
• Insights from CA PATHWAYS analysis
5

CT GHG Emissions 2012

4 Key Energy Transitions
1. Efficiency and conservation across all energy use sectors (includes VMT, building energy use, vehicle efficiency, etc.)
2. Fuel switching in transportation/buildings
3. Decarbonize electricity
4. Decarbonize fuels (gas/liquids)
Source: E3, California PATHWAYS, 2015

CT Has Building Blocks in Place
• ZEV mandate and incentives programs
• RGGI
• Renewable portfolio standard
• Solar installations
• Energy efficiency programs
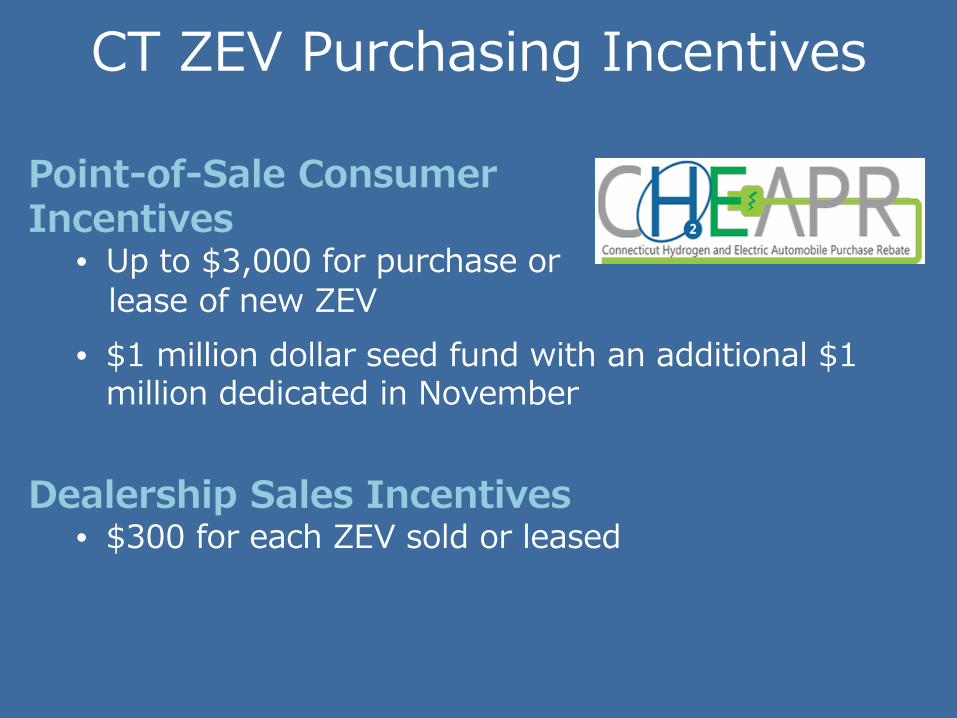
Point-of-Sale Consumer Incentives
• Up to $3,000 for purchase or
CT ZEV Purchasing Incentives
lease of new ZEV • $1 million dollar seed fund with an additional $1
million dedicated in November
Dealership Sales Incentives • $300 for each ZEV sold or leased

CT Charging Infrastructure Incentives Fleet and Workplace Charging Incentive Program
• Available to state agencies and municipalities • A reimbursement of up to $15,000 per vehicle and
up to $10,000 per charger
Charging Station Incentive Program for Businesses
• Awards of $2,000 to $5,000 per charging station
• Must be available to public free of charge
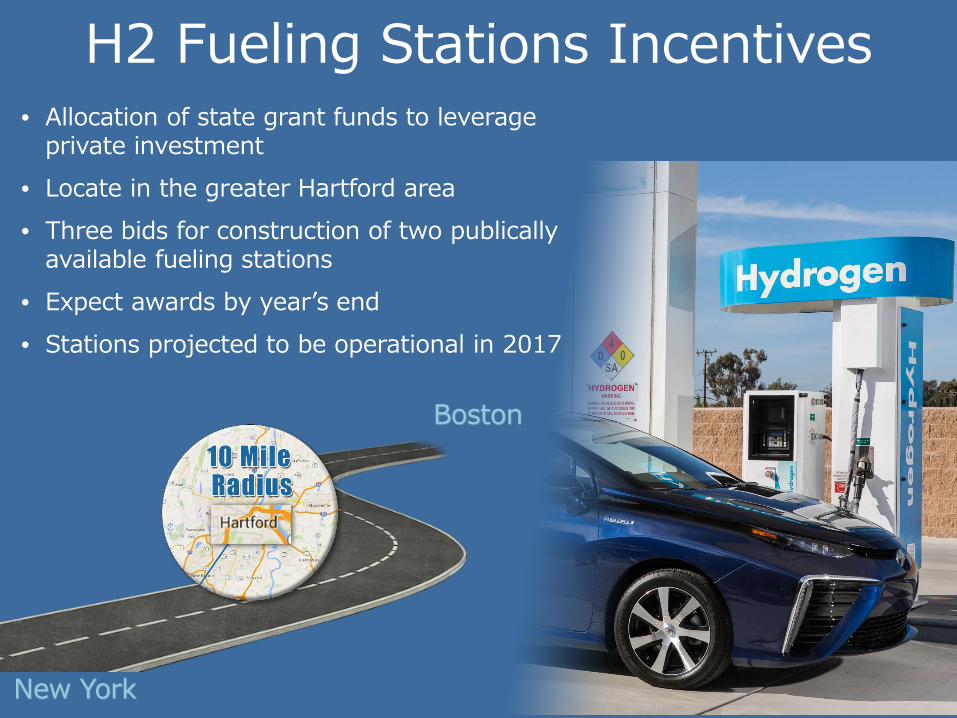
H2 Fueling Stations Incentives
New York
Boston
• Allocation of state grant funds to leverage private investment
• Locate in the greater Hartford area • Three bids for construction of two publically
available fueling stations • Expect awards by year’s end • Stations projected to be operational in 2017

Role and Opportunities for Utilities in Transportation Electrification
• Charging infrastructure deployment
• Variable rate pricing
• New demand to make up for downward trend
• More efficient generation through load balancing

RGGI Power Sector CO2 Emissions
Source: RGGI and UCS
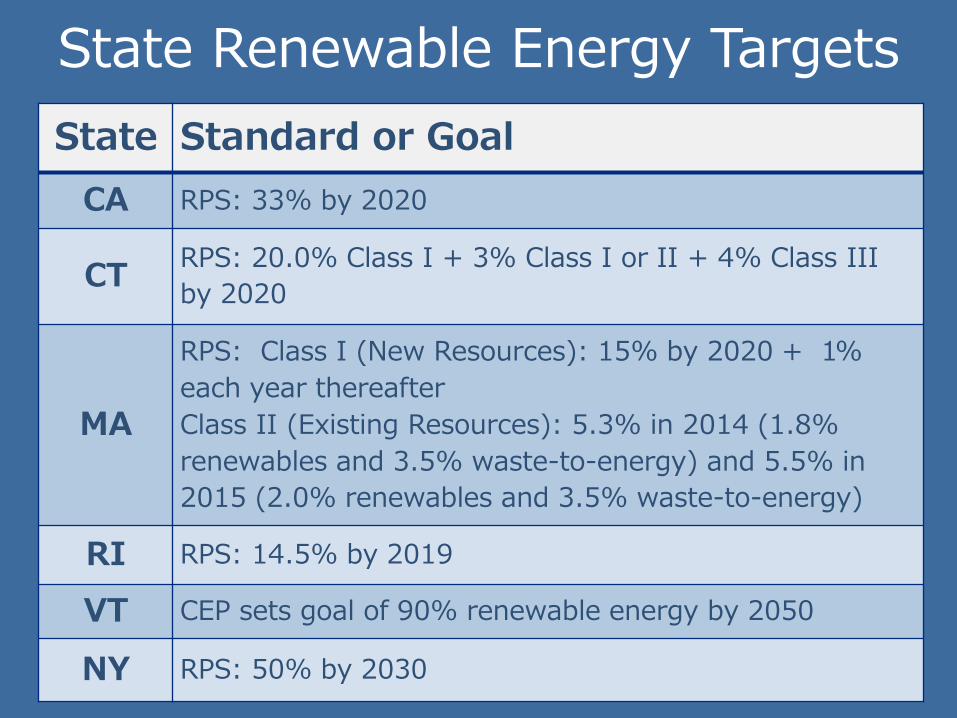
State Renewable Energy Targets State Standard or Goal
CA RPS: 33% by 2020
CT RPS: 20.0% Class I + 3% Class I or II + 4% Class III by 2020
MA
RPS: Class I (New Resources): 15% by 2020 + 1% each year thereafter Class II (Existing Resources): 5.3% in 2014 (1.8% renewables and 3.5% waste-to-energy) and 5.5% in 2015 (2.0% renewables and 3.5% waste-to-energy)
RI RPS: 14.5% by 2019
VT CEP sets goal of 90% renewable energy by 2050
NY RPS: 50% by 2030

State Solar PV Installation and Capacity Rankings
State National Rank Installed Systems
National Rank Capacity (MW)
CA 1 1 CT 6 12 MD 9 13 MA 4 4 NJ 3 2 NY 5 5
Source: NREL, The Open PV Project, Dec. 2015 (https://openpv.nrel.gov/rankings)
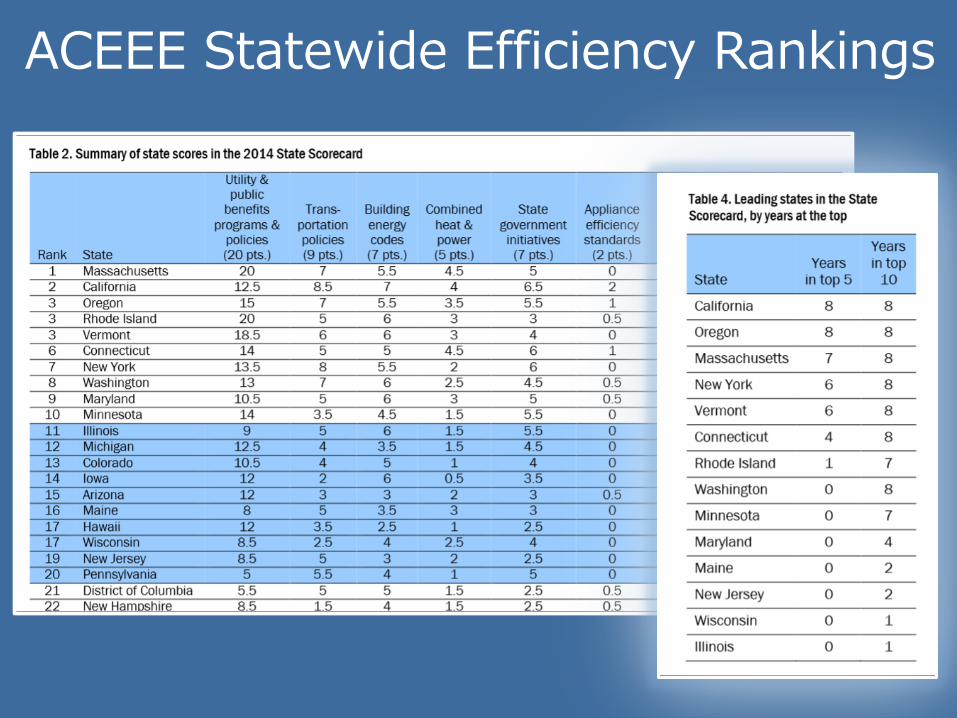
ACEEE Statewide Efficiency Rankings

Path Forward
• 2050 climate goals require fundamental restructuring of CT’s energy system
• Rate of GHG reductions must significantly increase to meet 2050 goal
• Insights from CA PATHWAYS approach

Key Assumptions in CA PATHWAYS • Continuation of current lifestyle & economic growth
• Technological conservatism, plus key emerging technologies with low carbon intensity
• Natural retirement of equipment (not early replacement) and penetration of new technology consistent with history
• Biomass use is limited based on DOE estimate of sustainable supply
• Advanced biofuels are assumed to have net-zero carbon emissions

CA PATHWAYS Approach Four major energy transformations needed to meet CA’s 2050 climate goals:
• Total energy-use efficiency needs to improve by additional 1.3%/year over 30 years
• Electricity supply is nearly decarbonized
• Most existing direct fuel use needs to be electrified
• Fuel-switching, with some “forks in the road”
- Electrification vs. biogas in buildings?
- All-electric vehicles vs. hydrogen fuel cell?
→ Without electrification, no feasible way to meet the GHG reduction target
Sources: Williams, J. et al. 2011; Energy + Environmental Economics 2015

CA PATHWAYS Electricity Supply Three forms of decarbonized electricity each of which has potential to dominate CA electricity production:
Renewable energy (intermittent) - 74% max. feasible Nuclear (baseload) Carbon capture and storage (CCS) (dispatchable)
Each source also has varying need for: supporting infrastructures, transmission, energy storage, land/water, and siting
RE has highest needs for installed capacity, transmission, and storage
Nuclear needs largest export market and fuel cycle infrastructure
CCS requires construction of CO2 transport and storage

CA PATHWAYS Cost Assumptions Core analysis uses conservative estimates of future costs of technology
Key uncertainties exist in future costs of technologies, fossil fuels, and cost of capital:
Solar PV: -50% Electric heat pumps: -20% LED lighting: -20% Grid electrolysis: -20% Wind power: -5% Fuel cell vehicles: -5% Battery and plug-in electric vehicles: -5% Electric boilers: -5%

CA PATHWAYS Costs for 2030 and 2050
2030 2050

CA Vision 2 Scenario (2015)
• 100% ZEV sales share by 2050 • 2050 LDV in-use fleet mix:
- 67% FCVs, BEVs, and PHEVs - 33% high-efficiency ICEs
• Slower introduction of ZEVs, but still meets 2050 GHG targets • PHEVs play greater role, but require high all-electric range • Assumes more efficient ICEs based on recent NAS estimates

Concluding Thoughts
• CT has developed a strong foundation to build upon
• CT’s approach parallels California’s
• Deeper efficiency across all sectors and decarbonization of fuels is necessary
• Sequencing of strategies can lead to lower costs
• A regional approach will help to tackle difficult to implement strategies

Agenda
31
Welcome
Review and discussion of California emissions reduction strategy – Presented by NESCSAUM
2:30
2:40
New items for discussion 3:40
Public Comments 4:00
3:25 Role of electric utilities in deploying electric vehicles Guest speaker, Watson Collins, Eversource

Role of electric utilities in deploying electric vehicles
Governor’s Council on Climate Change (GC3) Analysis, Data and Metrics Working Group Meeting
December 3, 2015

Carbon Emissions by Source
Regional discussion around carbon has focused on power generation, the largest source of GHG emissions in the US…but only the third largest source of
emissions in New England and Massachusetts.
47.5% 33.3%
28.5%
9.5%
17.4%
39.0%
6.6% 18.3%
0%
20%
40%
60%
80%
100%
New England US
2013 Energy Carbon Emissions by Source New England vs. US
Transportation
Space heating
Power generation
Industrial
Source: EIA.

Carbon Emissions Trajectory
0
50
100
150
200
250
New England Energy CO2 Emissions Millions of metric tons of CO2
Source: EIA.
Change
‘90 to ’13
Total (11%)
Space Heating
(13%)
Transportation
13%
Power Generation (39%)
Industrial (26%)
Since 1990, New England has already reduced emissions by 11%, driven primarily by a reduction of power generation sector emissions of 40%. In the
same time, the transportation sector has increased emissions by 13%.
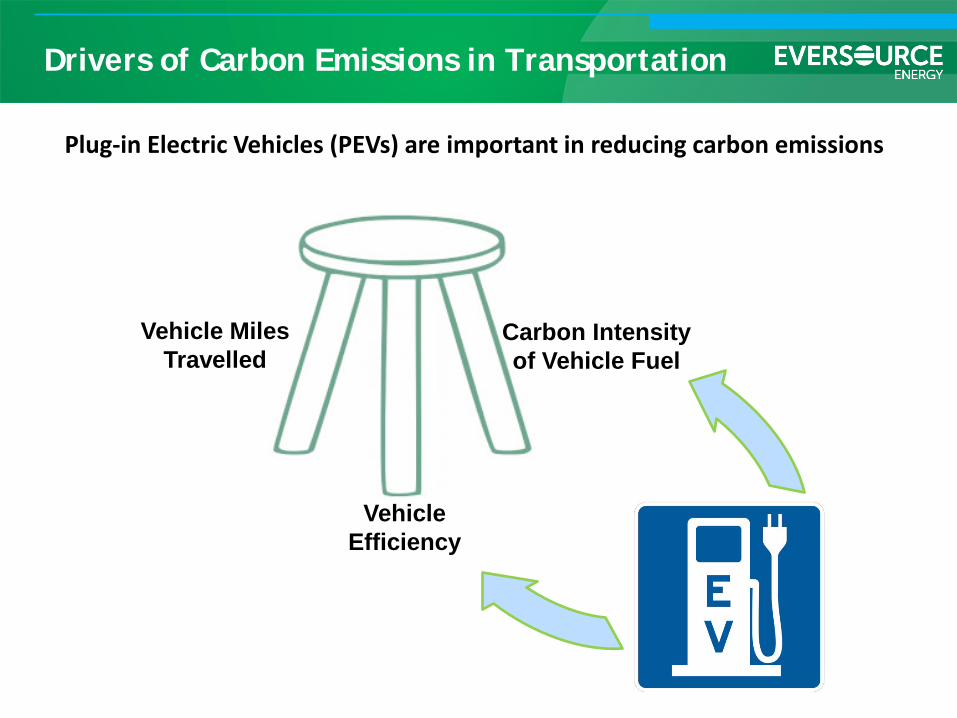
Drivers of Carbon Emissions in Transportation
Vehicle Miles Travelled
Vehicle Efficiency
Carbon Intensity of Vehicle Fuel
Plug-in Electric Vehicles (PEVs) are important in reducing carbon emissions

PEVs Will Lead to Deep Reductions in Carbon Emissions
Source: EPRI & NRDC
Lifetime Greenhouse Gas Emissions
75-80% reduction

PEV Charging Segments
The infrastructure and integration with the grid is different for each of these segments

Home: EV Integration Pilot
38
Pilot Description Pilot for 105 residential customers in the
eastern Massachusetts service territory Participants get a “grid aware” charging
station for a discounted price of $500 The “grid aware” charging station can
manage the timing of charging (hour of the day) but more importantly it can also manage the speed of charging (kW).
Now two aspects of PEV charging, timing and speed of charging, can be used combination to integrate PEVs into the grid.
While not the focus of the pilot, the Plug My Ride @ Home hardware can also be used for demand response
Enables the PEV to be made grid friendly today while still being future ready

Multi-Family Home: Infrastructure Studies

Workplace & DC Fast Charging: Infrastructure and EV Integration
Over 30 charging spots at Eversource locations, 25 added in 2015
Deploying DC Fast Chargers in collaboration with Connecticut DEEP and DOT
DC Fast Charger Technical Planning Study in Massachusetts
Rate Pilot for DC Fast Chargers in Connecticut

Outreach
www.PlugMyRide.org
855-463-6438
@PlugMyRide

Moving Forward
Achieving scale Threshold issues Infrastructure needs Economic value EV grid integration Awareness

Agenda
43
Welcome
Review and discussion of California emissions reduction strategy – Presented by NESCSAUM
2:30
2:40
New items for discussion 3:40
Public Comments 4:00
3:25 Role of electric utilities in deploying electric vehicles Guest speaker, Watson Collins, Eversource

Agenda
44
Welcome
Review and discussion of California emissions reduction strategy – Presented by NESCSAUM
2:30
2:40
New items for discussion 3:40
Public Comments 4:00
3:25 Role of electric utilities in deploying electric vehicles Guest speaker, Watson Collins, Eversource