concrete pavement mixture design and analysis (mda...
TRANSCRIPT

Concrete Pavement Mixture Design and Analysis (MDA):
Effect of Aggregate Systems on Concrete Mixture Properties
Technical ReportJuly 2012
Sponsored throughFederal Highway Administration (DTFH61-06-H-00011 (Work Plan 25))Pooled Fund Study TPF-5(205): Colorado, Iowa (lead state), Kansas, Michigan, Missouri, New York, Oklahoma, Texas, Wisconsin

About the National CP Tech Center
The mission of the National Concrete Pavement Technology Center is to unite key transportation stakeholders around the central goal of advancing concrete pavement technology through research, tech transfer, and technology implementation.
Disclaimer Notice
The contents of this report reflect the views of the authors, who are responsible for the facts and the accuracy of the information presented herein. The opinions, findings and conclusions expressed in this publication are those of the authors and not necessarily those of the sponsors.
The sponsors assume no liability for the contents or use of the information contained in this document. This report does not constitute a standard, specification, or regulation.
The sponsors do not endorse products or manufacturers. Trademarks or manufacturers’ names appear in this report only because they are considered essential to the objective of the document.
Iowa State University Non-Discrimination Statement
Iowa State University does not discriminate on the basis of race, color, age, religion, national origin, sexual orientation, gender identity, genetic information, sex, marital status, disability, or status as a U.S. veteran. Inquiries can be directed to the Director of Equal Opportunity and Compliance, 3280 Beardshear Hall, (515) 294-7612.
Iowa Department of Transportation Statements
Federal and state laws prohibit employment and/or public accommodation discrimination on the basis of age, color, creed, disability, gender identity, national origin, pregnancy, race, religion, sex, sexual orientation or veteran’s status. If you believe you have been discriminated against, please contact the Iowa Civil Rights Commission at 800-457-4416 or the Iowa Department of Transportation affirmative action officer. If you need accommodations because of a disability to access the Iowa Department of Transportation’s services, contact the agency’s affirmative action officer at 800-262-0003.
The preparation of this report was financed in part through funds provided by the Iowa Department of Transportation through its “Second Revised Agreement for the Management of Research Conducted by Iowa State University for the Iowa Department of Transportation” and its amendments.
The opinions, findings, and conclusions expressed in this publication are those of the authors and not necessarily those of the Iowa Department of Transportation or the U.S. Department of Transportation Federal Highway Administration.
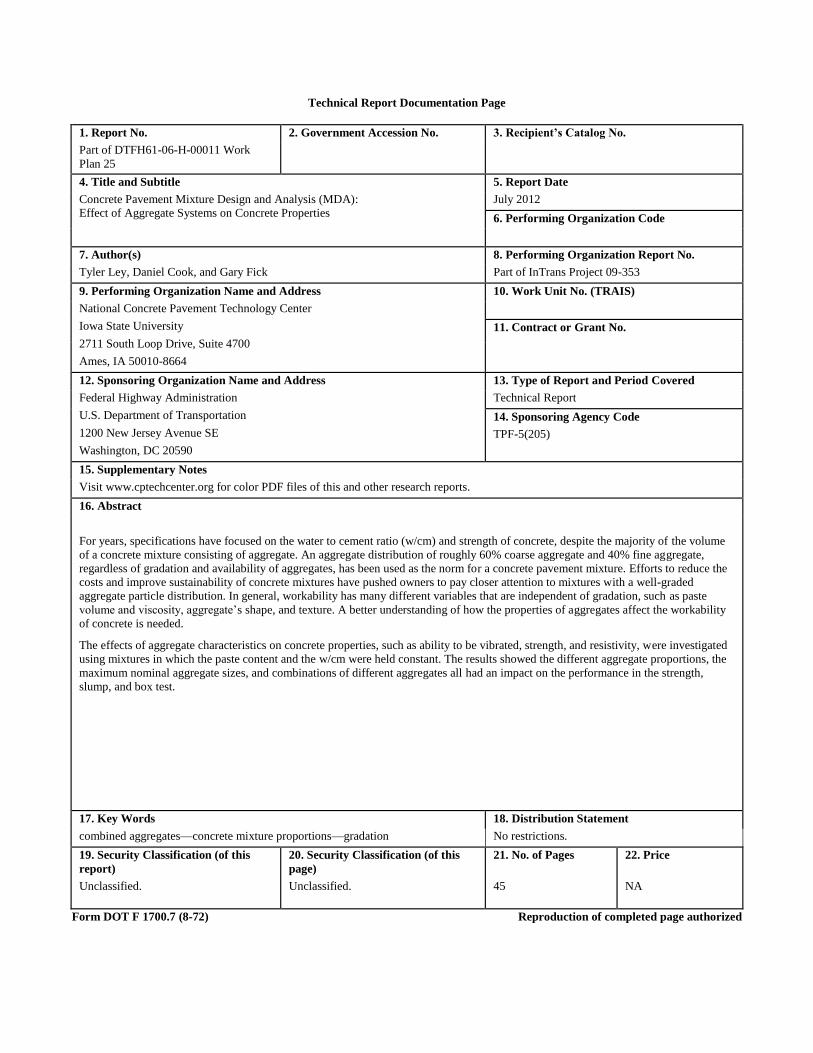
Technical Report Documentation Page
1. Report No. 2. Government Accession No. 3. Recipient’s Catalog No.
Part of DTFH61-06-H-00011 Work
Plan 25
4. Title and Subtitle 5. Report Date
Concrete Pavement Mixture Design and Analysis (MDA):
Effect of Aggregate Systems on Concrete Properties
July 2012
6. Performing Organization Code
7. Author(s) 8. Performing Organization Report No.
Tyler Ley, Daniel Cook, and Gary Fick Part of InTrans Project 09-353
9. Performing Organization Name and Address 10. Work Unit No. (TRAIS)
National Concrete Pavement Technology Center
Iowa State University
2711 South Loop Drive, Suite 4700
Ames, IA 50010-8664
11. Contract or Grant No.
12. Sponsoring Organization Name and Address 13. Type of Report and Period Covered
Federal Highway Administration
U.S. Department of Transportation
1200 New Jersey Avenue SE
Washington, DC 20590
Technical Report
14. Sponsoring Agency Code
TPF-5(205)
15. Supplementary Notes
Visit www.cptechcenter.org for color PDF files of this and other research reports.
16. Abstract
For years, specifications have focused on the water to cement ratio (w/cm) and strength of concrete, despite the majority of the volume
of a concrete mixture consisting of aggregate. An aggregate distribution of roughly 60% coarse aggregate and 40% fine aggregate,
regardless of gradation and availability of aggregates, has been used as the norm for a concrete pavement mixture. Efforts to reduce the
costs and improve sustainability of concrete mixtures have pushed owners to pay closer attention to mixtures with a well-graded
aggregate particle distribution. In general, workability has many different variables that are independent of gradation, such as paste
volume and viscosity, aggregate’s shape, and texture. A better understanding of how the properties of aggregates affect the workability
of concrete is needed.
The effects of aggregate characteristics on concrete properties, such as ability to be vibrated, strength, and resistivity, were investigated
using mixtures in which the paste content and the w/cm were held constant. The results showed the different aggregate proportions, the
maximum nominal aggregate sizes, and combinations of different aggregates all had an impact on the performance in the strength,
slump, and box test.
17. Key Words 18. Distribution Statement
combined aggregates—concrete mixture proportions—gradation No restrictions.
19. Security Classification (of this
report)
20. Security Classification (of this
page)
21. No. of Pages 22. Price
Unclassified. Unclassified. 45 NA
Form DOT F 1700.7 (8-72) Reproduction of completed page authorized


CONCRETE PAVEMENT MIXTURE DESIGN AND
ANALYSIS (MDA):
EFFECT OF AGGREGATE SYSTEMS ON CONCRETE
MIXTURE PROPERTIES
Technical Report
July 2012
Principal Investigator
Peter Taylor, Associate Director
National Concrete Pavement Technology Center
Iowa State University
Authors
Tyler Ley, Daniel Cook, and Gary Fick
Sponsored by
the Federal Highway Administration (FHWA)
DTFH61-06-H-00011 Work Plan 25
FHWA Pooled Fund Study TPF-5(205): Colorado, Iowa (lead state), Kansas, Michigan,
Missouri, New York, Oklahoma, Texas, Wisconsin
Preparation of this report was financed in part
through funds provided by the Iowa Department of Transportation
through its Research Management Agreement with the
Institute for Transportation
(InTrans Project 09-353)
A report from
National Concrete Pavement Technology Center
Iowa State University
2711 South Loop Drive, Suite 4700
Ames, IA 50010-8664
Phone: 515-294-8103
Fax: 515-294-0467
www.cptechcenter.org

v
TABLE OF CONTENTS
ACKNOWLEDGMENTS ............................................................................................................ vii
INTRODUCTION ...........................................................................................................................1
MATERIALS ...................................................................................................................................3
Mixture Design ....................................................................................................................7 Concrete Mixture and Testing Procedures .........................................................................16 Box Test .............................................................................................................................16
RESULTS ......................................................................................................................................21
DISCUSSION ................................................................................................................................33
CONCLUSIONS............................................................................................................................35
Next Steps ..........................................................................................................................35
REFERENCES ..............................................................................................................................37
Standards and Specifications .............................................................................................37

vi
LIST OF FIGURES
Figure 1. Shilstone chart ..................................................................................................................2 Figure 2. Sieve analysis for each aggregate type .............................................................................6 Figure 3. Sieve analysis for 3/4 in. crushed limestone and river sand .............................................8
Figure 4. Sieve analysis for 3/4 in. river rock and river sand ..........................................................9 Figure 5. Sieve analysis for 3/4 in. crushed limestone and manufactured sand ............................10 Figure 6. Sieve analysis for 3/4 in. river rock and manufactured sand ..........................................11 Figure 7. Sieve analysis for 1.5 in. crushed limestone and river sand ...........................................12 Figure 8. Sieve analysis for 1.5 in. river rock and river sand ........................................................13
Figure 9. Sieve analysis for 1.5 in. crushed limestone and manufactured sand ............................14 Figure 10. Sieve analysis for 1.5 in. river rock and manufactured sand ........................................15 Figure 11. Items in the box test ......................................................................................................16
Figure 12. Box dimensions ............................................................................................................17 Figure 13. No sphere of influence ..................................................................................................19 Figure 14. Sphere of influence almost to corners ..........................................................................20
Figure 15. Mixture passed the box test ..........................................................................................20 Figure 16. The results of the 3/4 in. crushed limestone and river sand plotted on the Shilstone
chart....................................................................................................................................25 Figure 17. The results of the 3/4 in. river rock and river sand plotted on the Shilstone chart .......25 Figure 18. The results of the 1.5 in. river rock and river sand plotted on the Shilstone chart .......26
Figure 19. The results of the 1.5 in. river rock and man sand plotted on the Shilstone chart ........26 Figure 20. The results of the 1.5 in. crushed limestone and man sand plotted on the Shilstone
chart....................................................................................................................................27 Figure 21. The results of the 1.5 in. crushed limestone and river sand plotted on the Shilstone
chart....................................................................................................................................27
Figure 22. The results of the 3/4 in. crushed limestone and man sand plotted on the Shilstone
chart....................................................................................................................................28 Figure 23. The results of the 3/4 in. river rock and man sand plotted on the Shilstone chart .......28 Figure 24. Gradation compared to the amount of WR to pass the box test ...................................29
Figure 25. Gradation compared to slump measured when passing the box test ............................30 Figure 26. Gradation compared to the 7-day compressive strength ..............................................31
Figure 27. Gradation compared to the 28-day compressive strength ............................................32
LIST OF TABLES
Table 1. Aggregate description ........................................................................................................4
Table 2. Properties and sieve analysis of each aggregate type ........................................................5 Table 3. Cement oxide analysis: Type 1 cement .............................................................................7 Table 4. Gradation description. ........................................................................................................7 Table 5. Box test ............................................................................................................................18
Table 6. Box test ranking scale ......................................................................................................19 Table 7. Results of the mixtures with 3/4 in. maximum nominal aggregates ................................22 Table 8. Results of the mixtures with 1.5 in. maximum nominal aggregates ................................23
Table 9. Wenner probe and WR dosage ........................................................................................24

vii
ACKNOWLEDGMENTS
This research was conducted under Federal Highway Administration (FHWA) DTFH61-06-H-
00011 Work Plan 25 and the FHWA Pooled Fund Study TPF-5(205), involving the following
state departments of transportation:
Colorado
Iowa (lead state)
Kansas
Michigan
Missouri
New York
Oklahoma
Texas
Wisconsin
The authors would like to express their gratitude to the National Concrete Pavement Technology
(CP Tech) Center, the FHWA, the Iowa Department of Transportation (DOT), and the other
pooled fund state partners for their financial support and technical assistance.


1
INTRODUCTION
For years, specifications have focused on the water to cement ratio (w/cm) and strength of
concrete, despite the majority of the volume of a concrete mixture consisting of aggregate. An
aggregate distribution of roughly 60% coarse aggregate and 40% fine aggregate, regardless of
gradation and availability of aggregates, has been used as the norm for a concrete pavement
mixture.
Efforts to reduce the costs and improve sustainability of concrete mixtures have pushed owners
to pay closer attention to all aspects of their concrete mixtures. This has led many owners to
specify concrete mixtures with a well-graded aggregate particle distribution. This mixture tries to
blend coarse, intermediate, and fine aggregates to pack as much aggregate in a mixture while
minimizing the paste volume.
Shilstone has been a longtime supporter of optimized graded concrete, and he purports that these
mixtures have improvements in durability, strength, and resistance to abrasion and erosion.
Shilstone believed an optimized gradation of concrete would help control the workability,
pumpability, and response to vibration of concrete (Shilstone 1989).
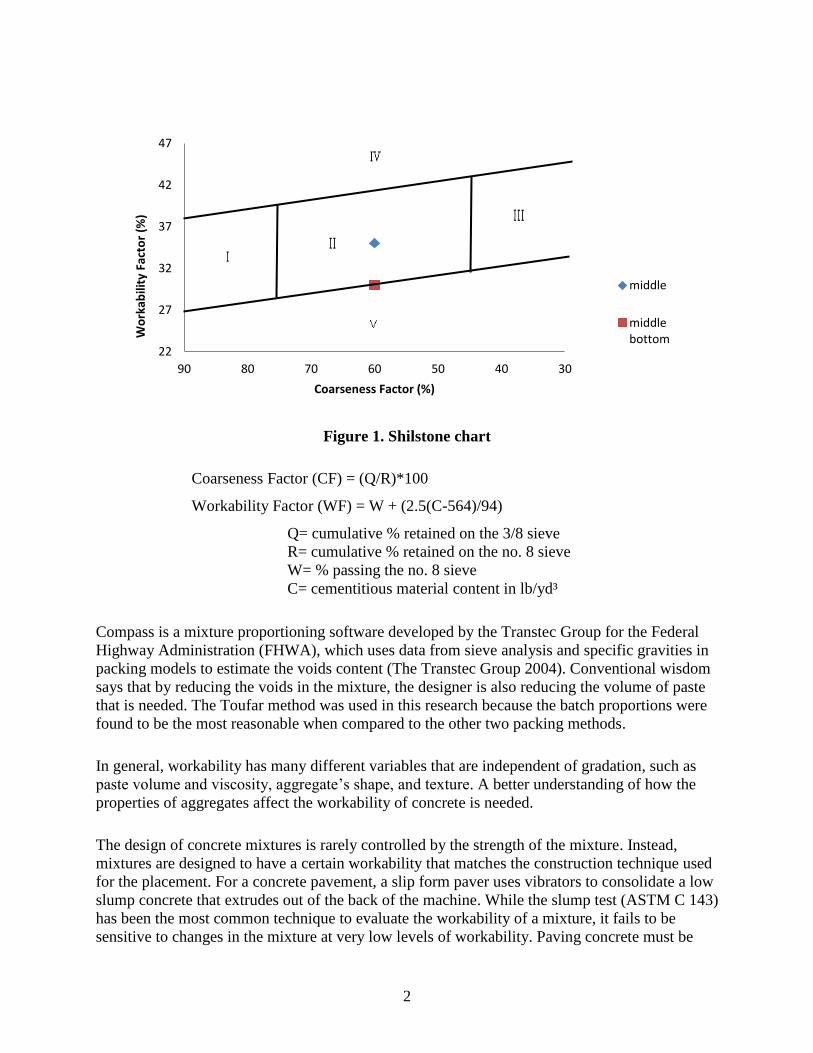
Shilstone developed a graphical method to design a concrete mixture based on his experiences
that used volumes and gradations of the coarse, intermediate, and fine aggregates as shown in
Figure 1. The graphical method used equations called the Coarseness Factor and Workability
Factor (Shilstone 1990). In the Shilstone chart, different zones were thought to correspond with
different application’s workability.
When designing optimized concrete, many current Department of Transportations (DOTs)
reference the middle of the Shilstone chart or Zone 2 as the best location for a mixture design.
While this seems logical, no actual data supports this. Even Shilstone suggested that paving
mixtures do not need the same workability as other mixtures, and therefore values with lower
workability factors could be used (Richard 2005). Mixtures with a lower workability factor are
located near the bottom of the Shilstone chart.
2
Figure 1. Shilstone chart
Coarseness Factor (CF) = (Q/R)*100
Workability Factor (WF) = W + (2.5(C-564)/94)
Q= cumulative % retained on the 3/8 sieve
R= cumulative % retained on the no. 8 sieve
W= % passing the no. 8 sieve
C= cementitious material content in lb/yd³
Compass is a mixture proportioning software developed by the Transtec Group for the Federal
Highway Administration (FHWA), which uses data from sieve analysis and specific gravities in
packing models to estimate the voids content (The Transtec Group 2004). Conventional wisdom
says that by reducing the voids in the mixture, the designer is also reducing the volume of paste
that is needed. The Toufar method was used in this research because the batch proportions were
found to be the most reasonable when compared to the other two packing methods.
In general, workability has many different variables that are independent of gradation, such as
paste volume and viscosity, aggregate’s shape, and texture. A better understanding of how the
properties of aggregates affect the workability of concrete is needed.
The design of concrete mixtures is rarely controlled by the strength of the mixture. Instead,
mixtures are designed to have a certain workability that matches the construction technique used
for the placement. For a concrete pavement, a slip form paver uses vibrators to consolidate a low
slump concrete that extrudes out of the back of the machine. While the slump test (ASTM C 143)
has been the most common technique to evaluate the workability of a mixture, it fails to be
sensitive to changes in the mixture at very low levels of workability. Paving concrete must be
22
27
32
37
42
47
30405060708090
Wo
rkab
ility
Fac
tor
(%)
Coarseness Factor (%)
middle
middlebottom

3
able to be placed and consolidated by the paver and not lose its edge as it leaves the paver. The
best way to evaluate the performance of a mixture is to use a paver with the material.
Unfortunately, no current lab test exists to evaluate the ability to place and consolidate a
pavement mixture. Since a paver uses a vibrator as the focal point of consolidation, a test to
evaluate the response of a mixture to a vibrator has been developed and is presented. The
research team realizes that the developed test may not truly replicate the complicated processes
of a concrete paver, but they feel that this test does give an indication of the mixture’s response
to vibration.
MATERIALS
The river rock and manufactured sand were from Texas and the crushed limestone and river sand
were from Oklahoma. Table 1 gives a coarse and fine aggregate description.
A sieve analysis for each of the aggregates was completed in accordance with ASTM C 136.
Each of the aggregates has a maximum nominal aggregate size, as shown in Table 2.
Absorption and specific gravity of each aggregate followed ASTM C 127 for a coarse aggregate
or ASTM C 128 for a fine aggregate. In Table 2 and Figure 2, the properties and sieve analysis
of each aggregate are provided.
The lignosulfonate mid-range WR met ASTM C 494. All the concrete mixtures described in this
paper were prepared using a Type 1 cement that meets the requirements of ASTM C 150. The
oxide analysis is shown below in Table 3. No fly ash was used in the testing.

4
Table 1. Aggregate description
Aggregate Photo of Aggregate Description
Crushed
Limestone
Combination of low and high sphericity
with a mid-angularity
River Gravel
Combination high and low sphericity
with a well-rounded angularity
River Sand
Fines with very few intermediate
particles
Manufactured
Sand
Angular fines with intermediate
particles

5
Table 2. Properties and sieve analysis of each aggregate type
*note: limestone was crushed limestone and man sand was manufactured sand
Aggregate Type
1.5 in. Nominal Max Coarse
3/4 in. Nominal Max Coarse
3/8 in. Intermediate Fine
Limestone* River Rock Limestone*
River Rock Limestone*
River Rock
River Sand
Man Sand*
Pro
per
ties
Fineness Modulus 5.71 3.32 3.32 3.76 5.92 5.81 2.55 2.94
Bulk Specific Gravity (SSD) 2.74 2.64 2.70 2.65 2.72 2.62 2.65 2.63
Absorption(%) 0.45 1.55 0.66 1.26 0.58 1.95 0.55 0.70
Pe
rcen
t P
assi
ng
the
Siev
e N
um
ber
1.5 in. 95.5 96.8 100 100 100 100 100 100
1 in. 28.1 59.5 100 96.2 100 100 100 100
3/4 in. 5.2 49.0 94.4 77.5 100 100 100 100
1/2 in. 0.3 30.6 48.2 36.3 100 100 100 100
3/8 in. 0.1 18.1 22.8 13.5 93.3 99.8 97.5 100
#4 0.1 4.6 3.1 0.2 11.3 17.6 96.7 91.8
#8 0 3.2 0.0 0.0 1.5 0.7 95.0 82.7
#16 0 0 0 0 0.7 0.2 83.0 74.6
#30 0 0 0 0 0.5 0.1 52.7 56.7
#50 0 0 0 0 0.5 0.1 17.2 12.4
#100 0 0 0 0 0.3 0.1 3.3 2.4
Pan 0 0 0 0 0 0 0 0

6
Figure 2. Sieve analysis for each aggregate type
0
10
20
30
40
50
60
70
80
90
100
1.5"1"3/4"1/2"3/8"#4#8#16#30#50#100Pan
Per
cen
tage
Pas
sin
g(%
)
Sieve Number
1.5 inch Crushed Limestone 3/4 inch Crushed Limestone 3/8 inch Crushed Limestone
1.5 inch River Rock 3/4 inch River Rock 3/8 inch River Rock
Manufactured Sand River Sand

7
Table 3. Cement oxide analysis: Type 1 cement
Mixture Design
Each mixture had the equivalent of five sacks (470 lbs) of cement per cubic yard of concrete and
211.5 lbs of water. The w/cm was held constant at 0.45 and therefore the paste content at 7.03
ft³/yd³, or 26% of the mixture’s volume.
Each aggregate pair was evaluated using five different gradations. These included combinations
that were at the center and bottom center of the Shilstone chart, with minimum voids contents as
determined by the Toufar method within Compass (The Transtec Group 2004), a mixture close
to the power 45 line, and mixture with 60% of the largest aggregate size and 40% of the fine
aggregate size.
Table 4 gives a summary of the gradations. Figure 2 shows a comparison of the gradations of
individual aggregates. In Figures 3 through 10, a comparison is made of the gradations for the
individual aggregates and the mixtures investigated. A separate figure is created for each
aggregate combination investigated.
These experiments were designed to intentionally hold the paste constant and vary the gradations
of the mixtures. This allowed the impact of aggregate gradations on the workability and response
to vibration, as well as the strength of the mixtures to be investigated. This will allow different
methods of aggregate gradation design to be directly compared.
Table 4. Gradation description.
Gradation Description
Middle of
Shilstone
Located in the middle of the Shilstone chart in Zone 2 as shown in Figure1.
The middle of Shilstone has a coarseness factor of 60 and a workability of
35.
Bottom of
Shilstone
As shown in Figure 1 with the coarseness factor of 60 and workability of
30, the bottom middle is located in Zone 2 on the Shilstone chart.
60% CA, 40%
FA
With no intermediate aggregate added, the gradation uses 60% of coarse
aggregate and 40% of the fine aggregate by volume.
Power 45 Gradation follows the power 45 line.
Minimum Voids The gradation that produces the minimum voids content as per the Toufar
Method implemented by Compass.
SiO2 Al2O3 Fe2O3 CaO MgO SO3 Na2O K2O C3S C2S C3A C4AF
21.1% 4.7% 2.6% 62.1% 2.4% 3.2% 0.21% 0.34% 56.7% 17.8% 8.2% 7.8%

8
Figure 3. Sieve analysis for 3/4 in. crushed limestone and river sand
0%
5%
10%
15%
20%
25%
30%
35%
40%
1.5"1"3/4"1/2"3/8"#4#8#16#30#50#100#200
% R
etai
ned
3/4" Crushed Limestone and River Rock
Middle of Box
Bottom of Box
60%CA, 40%FA
Minimum Voids
Power 45
Sieve No.
9
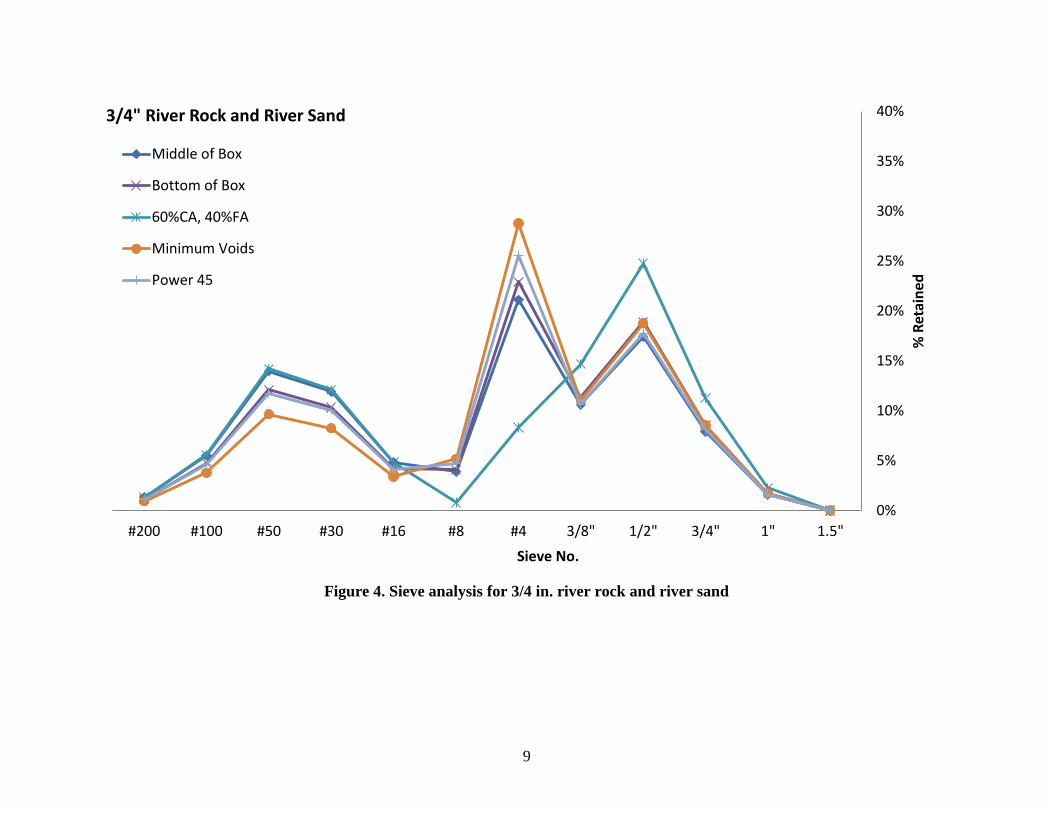
Figure 4. Sieve analysis for 3/4 in. river rock and river sand
0%
5%
10%
15%
20%
25%
30%
35%
40%
1.5"1"3/4"1/2"3/8"#4#8#16#30#50#100#200
% R
etai
ned
3/4" River Rock and River Sand
Middle of Box
Bottom of Box
60%CA, 40%FA
Minimum Voids
Power 45
Sieve No.

10
Figure 5. Sieve analysis for 3/4 in. crushed limestone and manufactured sand
0%
5%
10%
15%
20%
25%
30%
35%
40%
1.5"1"3/4"1/2"3/8"#4#8#16#30#50#100#200
% R
etai
ned
3/4" Crushed Limestone and Man Sand
Middle of Box
Bottom of Box
60%CA, 40%FA
Minimum Voids
Power 45
Sieve No.

11
Figure 6. Sieve analysis for 3/4 in. river rock and manufactured sand
0%
5%
10%
15%
20%
25%
30%
35%
40%
1.5"1"3/4"1/2"3/8"#4#8#16#30#50#100#200
% R
etai
ned
3/4" River Rock and Man Sand
Middle of Box
Bottom of Box
60%CA, 40%FA
Minimum Voids
Power 45
Sieve No.

12
Figure 7. Sieve analysis for 1.5 in. crushed limestone and river sand
0%
5%
10%
15%
20%
25%
30%
35%
40%
45%
1.5"1"3/4"1/2"3/8"#4#8#16#30#50#100#200
% R
etai
ned
1.5" Crushed Limestone and River Sand
Middle of Box
Bottom of Box
60%CA, 40%FA
Minimum Voids
Power 45
Sieve No.

13
Figure 8. Sieve analysis for 1.5 in. river rock and river sand
0%
5%
10%
15%
20%
25%
30%
35%
40%
1.5"1"3/4"1/2"3/8"#4#8#16#30#50#100#200
% R
etai
ned
1.5" River Rock and River Sand
Middle of Box
Bottom of Box
60%CA, 40%FA
Minimum Voids
Power 45
Sieve No.

14
Figure 9. Sieve analysis for 1.5 in. crushed limestone and manufactured sand
0%
5%
10%
15%
20%
25%
30%
35%
40%
45%
1.5"1"3/4"1/2"3/8"#4#8#16#30#50#100#200
% R
etai
ned
1.5" Crushed Limestone and Man Sand
Middle of Box
Bottom of Box
60%CA, 40%FA
Minimum Voids
Power 45
Sieve No.

15
Figure 10. Sieve analysis for 1.5 in. river rock and manufactured sand
0%
5%
10%
15%
20%
25%
30%
35%
40%
1.5"1"3/4"1/2"3/8"#4#8#16#30#50#100#200
% R
etai
ned
1.5" River Rock and Man Sand
Middle of Box
Bottom of Box
60%CA, 40%FA
Minimum Voids
Power 45
Sieve No.

16
Concrete Mixture and Testing Procedures
Aggregates are collected from outside storage piles and brought into a temperature-controlled
laboratory room at 73°F (23°C) for at least 24 hours before mixing. Aggregates were placed in a
mixing drum and spun, and a representative sample was taken for a moisture correction. At the
time of mixing, all aggregate was loaded into the mixer along with approximately two-thirds of
the mixing water. This combination was mixed for three minutes to allow the aggregates to
approach the saturated surface dry (SSD) condition and ensure that the aggregates were evenly
distributed.
Next, the cement and the remaining water was added and mixed for three minutes. The resulting
mixture rested for two minutes while the sides of the mixing drum were scraped. After the rest
period, the mixer was turned on and mixed for three minutes. The initial testing of the mixture
included air content (ASTM C 231), slump (ASTM C 143), unit weight (ASTM C 138), and a
novel test method to examine the response to vibration called the box test.
Box Test
The box test evaluated the performance of a mixture’s response to vibration. This was done by
taking a controlled volume of concrete and measuring the amount of surface voids after
vibration. A vibrator uses stress waves to separate air from the mixture and force the mortar into
the voids. If the concrete has large amounts of surface voids after vibration then the mortar was
not able to flow to this surface and the mixture was declared to be unacceptable.
The box test used a 1/2 in. plywood base and 1 ft² sides with clamps to hold the box together.
Figure 11 shows the different pieces of the box test.
Figure 11. Items in the box test

17
Placed on the base, a 1 ft³ wooden formed box was constructed and held together by clamps as
shown in Figure 12. Concrete was uniformly hand-scooped without consolidation into the box up
to a height of 9.5 in. Care was taken to not consolidate the concrete during placement.
Figure 12. Box dimensions
A handheld 1 in. head WYCO model number 922A electric vibrator with a measured speed of
8000 vibrations per minute was used to consolidate the concrete by inserting it at the center of
the box. The vibrator was lowered over three seconds to the bottom of the box and then raised
over three seconds.
The clamps were removed from the side of the box and the side walls were removed. Each step
of the process was shown in Table 5.

18
Table 5. Box test
Step 1 Step 2
Construct box and place clamps tightly
around box. Hand scoop mixture into box
until the concrete is 9.5 in.
Vibrate downward for 3 seconds and
upward for 3 seconds.
Step 3 Step 4
Remove vibrator.
After removing clamps and the forms,
inspect the sides for surface voids and edge
slumping.
The response of the mixture to vibration was evaluated by comparing the sides of the box to the
ranking scale in Table 6. An average score was found for the box test. A ranking of 2 was
determined to be sufficient to pass the box test.
Observations were recorded about the sphere of influence of vibrator and any imperfections left
on the surface by the vibrator. Figure 13 shows where the vibrator gave no sphere of influence
and left a hole. Figure 14 shows that the vibrator had a 5 in. radius sphere of influence that left
the corners unconsolidated. In Figure 15, the vibrator had a sphere of influence that reached the
entire concrete sample, and the edges were straight.
9.5
”

19
Table 6. Box test ranking scale
4 3
Sides held an edge, but had over
50% overall amounts of surface
voids.
Sides had a between 30-50%
overall surface voids. Corners
were not consolidated.
2 1
Sides and corners had between 10
and 30% overall amounts of
surface voids.
Sides had less than 10% overall
amount of surface voids.
Figure 13. No sphere of influence

20
Figure 14. Sphere of influence almost to corners
Figure 15. Mixture passed the box test
If the concrete was found to fail the box test, the material used in the slump test and the box test
was placed back into the mixer. The material used to test the air content was discarded as water
was added. The mixer was turned on and charged with a mid-range water-reducing agent and
mixed for three minutes. By adding the mid-range, the viscosity of the mixture was decreased, or
the workability was increased.
After mixing the slump, unit weight and box test was conducted again. The air content was not
tested again until the mixture was found to pass the box test. This was done to hold the mixture
volume constant throughout the addition of the WR. If the box test failed again, slump, unit
weight, and box test material was placed back into the mixer, charged with more mid-range
water-reducing agent, and mixed for three minutes.
The process of adding water-reducing agent, testing slump, unit weight, and box test continued
until the mixture passed the box test. Since the mixture has a limited time frame before initial set,
if the mixture exhibited a loss in slump, or surpassed 45 minutes from initial mixing, the mixture
was discarded.
At the point of the process where the box test passed, the air content was tested. The slump and
box test material was placed back into the mixer and agitated for 30 seconds. Finally, 4x8”
21
concrete specimens were made according to ASTM C 192. The concrete specimens were tested
at 7- and 28-day strength using ASTM C39 and with the surface resistivity meter or Wenner
probe. On the longitudinal side of the saturated cylinder, the Wenner probe measured the
resistivity at eight different places. During the testing, the Wenner probe broke causing some
data not to be collected.
Varying the WR dosage of the mixture until a mixture is able to show satisfactory performance
in the box test provided a quantitative method to compare the different aggregate gradations.
Since more WR was required in certain mixtures, these mixtures would not be as desirable as
mixtures that did not need as high a dosage of WR. This was a useful method of comparison for
this research.
Many of the admixture dosages investigated were higher than would be recommended in
practice. This suggests that the paste content should be increased in these mixtures. This was not
done as it was not the goal of this work to develop concrete mixtures, but instead to compare the
performances of different aggregate gradations with a constant paste content.
RESULTS
Tables 7 and 8 are a compilation of the results from the fresh and harden properties of the
mixtures completed. Table 9 compares the electrical resistivity of each mixture to the WR
dosage to pass the box test. Figures 16 through 23 compare the Shilstone chart to each mixture’s
WR dosage required to pass the box test. Figures 24 through 28 compare the WR dosage needed
to pass the box test, compressive strength at 7 and 28 days, and the slump of the mixture when it
passed the box test for the different investigated gradations.

22
Table 7. Results of the mixtures with 3/4 in. maximum nominal aggregates
Aggregate Coarse
Fine
Shilstone
Center
Shilstone
Bottom 60/40 Power 45
Compass
Min Voids
WR (oz/cwt) 20.8 19.2 21.3 85.9 31.0Slump (inches) 0.50 1.75 1.00 0.50 1.257 day fc (psi) 5160 4270 5080 6240 5040
28 day fc (psi) 5820 5370 5930 8250 6340Air Content 2.5% 2.4% 3.2% 2.7% 2.9%
Unit Wt 152.1 150.6 150.2 151.1 152.6
Coarse 1553 1684 2015 1100 1561Intermediate 508 554 0 907 656
Fine 1280 1107 1321 1338 1129CF WF 60 35 60 30 76.3 40 46.2 36.9 56.7 30.7
WR (oz/cwt) 15.3 17.9 17.2 18.6 6.7Slump (inches) 1.75 2.00 1.75 2.25 1.25
7 day fc (psi) 4110 4710 4250 4850 439028 day fc (psi) 4950 5220 5020 5100 4970
Air Content 4.9% 3.4% 4.6% 3.4% 2.1%
Unit Wt 147.8 148.7 147.3 149.4 151.0Coarse 1396 1516 1981 1427 1508
Intermediate 597 650 0 770 885Fine 1302 1127 1321 1096 899
CF WF 60 35 60 30 85.3 35.5 55.8 29.1 54.2 23.5
WR (oz/cwt) 23.0 35.6 32.2 31.8 31.8Slump (inches) 0.75 1.00 1.75 0.75 0.757 day fc (psi) 4800 4920 4250 5010 5010
28 day fc (psi) 5860 5660 5070 6140 6140Air Content 6.8% 4.9% 8.5% 3.9% 3.9%
Unit Wt 145.3 147.1 141.5 148.2 148.2Coarse 1627 1749 2015 1599 1599
Intermediate 236 319 0 665 665Fine 1461 1262 1311 1075 1075
CF WF 60 35 60 30 69.1 31 52.5 25.4 52.5 25.4
WR (oz/cwt) 21.5 21.0 20.9 20.1 20.4Slump (inches) 1.00 1.50 1.50 1.50 1.757 day fc (psi) 3880 3990 3870 4260 4300
28 day fc (psi) 4450 4240 4110 4550 4660Air Content 7.8% 7.3% 8.0% 7.9% 5.0%
Unit Wt 142.6 140.5 141.3 141.8 145.8Coarse 1438 1553 1994 1348 1584
Intermediate 370 454 0 481 686Fine 1478 1280 1297 1455 1016
CF WF 60 35 60 30 77.6 30.4 55.4 34.4 55.4 34.4
River Rock
Man Sand
3/4"
nom
inal
max
imum
siz
e ag
greg
ate
Gradation
Crushed
Limestone
River Sand
Crushed
Limestone
Man Sand
Properties
River Rock
River Sand
Unit weight was measured in lbs/ft³ and aggregate types were measured in lbs/yd³

23
Table 8. Results of the mixtures with 1.5 in. maximum nominal aggregates
Aggregate Coarse
Fine
Shilstone
Center
Shilstone
Bottom 60/40 Power 45
Compass
Min Voids
WR (oz/cwt) 32.0 34.0 13.7 31.8 31.8
Slump (inches) 1.25 1.50 1.00 1.50 1.507 day fc (psi) 5420 5250 4520 4700 4700
28 day fc (psi) 5970 5470 5430 6020 6020
Air Content 3.5% 3.1% 3.7% 3.8% 3.8%Unit Wt 150.6 151.7 149.8 148.7 148.7
Coarse 1205 1306 2046 1258 1258
Intermediate 894 972 0 736 736Fine 1266 1092 1322 1369 1369
CF WF 60 35 60 30 98.2 25.1 65.1 26.7 65.1 26.7
WR (oz/cwt) 22.2 26.6 26.1 25.1 25.1Slump (inches) 1.75 2.00 1.75 2.00 2.00
7 day fc (psi) 5240 5160 4630 4980 4980
28 day fc (psi) 5910 5990 5480 6070 6070Air Content 4.8% 3.2% 4.3% 2.3% 2.3%
Unit Wt 147.8 150.0 147.6 151.2 151.2
Coarse 1470 1596 1978 1631 1596Intermediate 522 569 0 846 569
Fine 1288 1116 1307 802 1116
CF WF 60 35 60 30 80.8 35.4 56.3 26.6 56.3 26.6
WR (oz/cwt) 27.9 20.8 20.4 31.8 31.8
Slump (inches) 1.0 1.5 1.5 1.5 1.5
7 day fc (psi) 3870 4520 4140 4600 4600
28 day fc (psi) 4300 5300 4980 6530 6530
Air Content 8.3% 5.9% 5.4% 1.8% 1.8%
Unit Wt 138.3 145.5 146.7 154.2 154.2
Coarse 1263 1356 2044 1515 1515
Intermediate 644 756 0 892 892Fine 1443 1244 1315 961 961
CF WF 60 35 60 30 89.1 31.5 60.9 22.8 60.9 22.8
WR (oz/cwt) 19.5 19.3 21.0 19.3 25.9
Slump (inches) 1.50 2.50 1.50 2.50 1.25
7 day fc (psi) 4350 4080 4480 4080 4660
28 day fc (psi) 4930 4740 5380 5630 5630
Air Content 8.5% 3.7% 4.9% 2.3% 2.3%
Unit Wt 141.4 149.3 146.7 151.0 149.3
Coarse 1470 1596 1978 1596 1631
Intermediate 522 569 0 569 846Fine 1288 1116 1307 1116 802
CF WF 60 35 60 30 80.8 35.5 60 30 53.8 21
Properties
Gradation
1.5"
nom
inal
max
imum
siz
e ag
greg
ate
Crushed
Limestone
River Sand
River Rock
River Sand
Crushed
Limestone
Man Sand
River Rock
Man Sand
Unit weight was measured in lbs/ft³ and aggregate types were measured in lbs/yd³

24
Table 9. Wenner probe and WR dosage
Aggregate Coarse
Fine
Shilstone
Center
Shilstone
Bottom 60/40 Power 45
Compass
Min
7 day Wenner 5.8 4.4 5.6 4.0 5.3
28 day Wenner 6.7 7.2 6.6 8.3 6.8
WR (oz/cwt) 20.8 19.2 21.3 85.9 31.0
7 day Wenner 5.8 5.3 6.1 5.2 5.328 day Wenner 6.8 6.5 6.8
WR (oz/cwt) 15.3 17.9 17.2 18.6 6.7
7 day Wenner 5.5 5.8 5.3 5.1 5.8
28 day WennerWR (oz/cwt) 21.5 21.0 20.9 20.1 20.4
7 day Wenner 5.6 4.7 5.8
28 day WennerWR (oz/cwt) 32.0 34.0 13.7 31.8 31.8
7 day Wenner 4.9 4.6 4.6 4.9 4.9
28 day WennerWR (oz/cwt) 22.2 26.6 26.1 25.1 25.1
7 day Wenner 5.3 5.5 4.9 5.5 5.3
28 day WennerWR (oz/cwt) 19.5 19.3 21.0 19.3 25.9
River Rock
Man Sand
Properties
Gradation
Crushed
Limestone
River Sand
Crushed
limestone
River Sand
River Rock
River Sand
River Rock
Man Sand
River Rock
River Sand
3/4"
nom
inal
max
siz
e1.
5" n
omin
al m
ax s
ize
Wenner probe data reported in kOhms-cm

25
Figure 16. The results of the 3/4 in. crushed limestone and river sand plotted on the
Shilstone chart
The numbers shown are the WR (oz/cwt) required for the mixture to pass the box test.
Figure 17. The results of the 3/4 in. river rock and river sand plotted on the Shilstone chart
The numbers shown are the WR (oz/cwt) required for the mixture to pass the box test.
20.8
19.2
21.3
85.9
31
22
27
32
37
42
47
304050607080
Wo
rkab
ility
Fac
tor
(%)
Coarseness Factor (%)
middle
middle bottom
60% CA, 40% FA
power 45
min voids
15.3
17.9 17.2
18.6
6.7 22
27
32
37
42
47
30405060708090
Wo
rkab
ility
Fac
tor
(%)
Coarseness Factor (%)
middle
middle bottom
60% CA, 40% FA
power 45
min voids
3/4" River Rock and River Sand

26
Figure 18. The results of the 1.5 in. river rock and river sand plotted on the Shilstone chart
The numbers shown are the WR (oz/cwt) required for the mixture to pass the box test.
Figure 19. The results of the 1.5 in. river rock and man sand plotted on the Shilstone chart
The numbers shown are the WR (oz/cwt) required for the mixture to pass the box test.
22.2
26.6 26.1
25.1
22
27
32
37
42
47
30405060708090
Wo
rkab
ility
Fac
tor
(%)
Coarseness Factor (%)
middle
middle bottom
60% CA, 40% FA
power45& minvoid
1.5" River Rock and River Sand
19.5
19.3
21
22
27
32
37
42
47
30405060708090
Wo
rkab
ility
Fac
tor
(%)
Coarseness Factor (%)
middle
middle bottom &power 45
60% CA, 40% FA
min voids
1.5" River Rock and Manufactured Sand

27
Figure 20. The results of the 1.5 in. crushed limestone and man sand plotted on the
Shilstone chart
The numbers shown are the WR (oz/cwt) required for the mixture to pass the box test.
Figure 21. The results of the 1.5 in. crushed limestone and river sand plotted on the
Shilstone chart
The numbers shown are the WR (oz/cwt) required for the mixture to pass the box test.
27.9
20.8 20.4
31.8 22
27
32
37
42
47
30405060708090
Wo
rkab
ility
Fac
tor
(%)
Coarseness Factor (%)
middle
middle bottom
60% CA, 40% FA
Power 45 & MinVoids
1.5" Crushed Limestone and Manufactured Sand
32
34
13.7 31.8
22
27
32
37
42
47
30405060708090100
Wo
rkab
ility
Fac
tor
(%)
Coarseness Factor (%)
middle
middle bottom
60% CA, 40% FA
Power 45 & MinVoids
1.5" Crushed Limestone and River Sand

28
Figure 22. The results of the 3/4 in. crushed limestone and man sand plotted on the
Shilstone chart
The numbers shown are the WR (oz/cwt) required for the mixture to pass the box test.
Figure 23. The results of the 3/4 in. river rock and man sand plotted on the Shilstone chart
The numbers shown are the WR (oz/cwt) required for the mixture to pass the box test.
23
35.6
32.2
31.8
22
27
32
37
42
47
304050607080
Wo
rkab
ility
Fac
tor
(%)
Coarseness Factor (%)
middle
middle bottom
60% CA, 40% FA
Power 45 & MinVoids
3/4" Crushed Limestone and Manufactured Sand
21.5
21
20.9
20.1
20.4 22
27
32
37
42
47
304050607080
Wo
rkab
ility
Fac
tor
(%)
Coarseness Factor (%)
middle
middle bottom
60% CA, 40% FA
power 45
min voids
3/4" River Rock and Manufactured Sand

29
Figure 24. Gradation compared to the amount of WR to pass the box test
Note: 3/4 in. crushed limestone and river sand with a power 45 had an 85.9 oz/cwt.
0
5
10
15
20
25
30
35
40W
R (
oz/
cwt)
Gradation
3/4"Crushed LimestoneRiver Sand
3/4"River Rock River Sand
3/4"Crushed LimestoneManufactured Sand
3/4"River RockManufactored Sand
1.5"Crushed LimestoneRiver Sand
1.5"River Rock River Sand
1.5"Crushed LimestoneManufactured Sand
1.5"River RockManufactored Sand
Shilstone Center
Shilstone Bottom
60/40 Power 45 Minimum Voids

30
Figure 25. Gradation compared to slump measured when passing the box test
Note: 3/4 in. crushed limestone and river rock using river sand had the same slump.
0
0.5
1
1.5
2
2.5
3Sl
um
p (
in)
3/4"Crushed LimestoneRiver Sand
3/4"River Rock River Sand
3/4"Crushed LimestoneManufactured Sand
3/4"River RockManufactured Sand
1.5"Crushed LimestoneRiver Sand
1.5"River Rock River Sand
1.5"Crushed LimestoneManufactured Sand
1.5"River RockManufactured Sand
Shilstone Center
Shilstone Bottom
60/40 Power 45 Minimum Voids
Gradation

31
Figure 26. Gradation compared to the 7-day compressive strength
3500
4000
4500
5000
5500
6000
6500
70007
day
Co
mp
ress
ive
Str
en
gth
(p
si)
3/4"Crushed LimestoneRiver Sand
3/4"River Rock RiverSand
3/4"Crushed LimestoneManufactured Sand
3/4"River RockManufactured Sand
1.5"Crushed LimestoneRiver Sand
1.5"River Rock River Sand
1.5"Crushed LimestoneManufactured Sand
1.5"River RockManufactured Sand
Minimum Voids
Power 45 60/40 Shilstone Bottom
Shilstone Center
Gradation

32
Figure 27. Gradation compared to the 28-day compressive strength
Note: 3/4 in. crushed limestone and river sand with a power 45 had a 28-day compressive strength of 8250 psi.
3500
4000
4500
5000
5500
6000
6500
70002
8 d
ay C
om
pre
ssiv
e S
tre
ngt
h (
psi
) 3/4"Crushed LimestoneRiver Sand
3/4"River Rock River Sand
3/4"Crushed LimestoneManufactured Sand
3/4"River RockManufactured Sand
1.5"Crushed LimestoneRiver Sand
1.5"River Rock River Sand
1.5"Crushed LimestoneManufactured Sand
1.5"River RockManufactured Sand
Shilstone Center
Shilstone Bottom
60/40 Power 45 Minimum Voids
Gradation
33
DISCUSSION
After each mixture passed the box test, the slump ranged between 0.5 in. and 2.5 in., which
corresponds to slumps found in conventional pavement. The results from the slump and box test
did not always correlate. Shown graphically in Figure 25, the 1.5 in. river rock and manufactured
sand had a 2.25 in. slump, but could not pass the box test while 3/4 in. crushed limestone and
river sand passed the box test with a 0.5 in. slump. When the same 3/4 in. crushed limestone and
river sand was used with a gradation that matched the power 45, the mixture required 85 oz/cwt
of WR for the mixture to pass the box test and the slump was only 0.5 in.
It was found that different slumps were required for different aggregate gradation strategies to
pass the box test. For example when looking at the gradations for mixtures in the middle of the
Shilstone chart with different aggregates, the slump ranged from 0.5 in. to 1.75 in., while the WR
dosage varied from 15.3 to 32 oz/cwt to pass the box test.
These results reinforce that the box and slump test measure two different phenomena. While the
box test measures the response to vibration, the slump test only measures the movement of the
concrete downward from its own weight. Shilstone (1989) had the following to say:
“The highly regarded slump test should be recognized for what it is: a measure of the
ability of a given batch of concrete to sag.”
Depending on the application for the concrete, the slump or box test may be useful to evaluate
the performance. For slip-formed pavement applications, we feel that the response to vibration or
the box test is more useful. However, the slump test may be better for hand-placed mixtures.
This non-uniform behavior between the tests is intriguing and suggests that one should not
assume that concretes of the same slump will respond the same way to vibration and vice versa
with mixtures that respond well to vibration. Instead, it is important to understand what
properties of the mixture proportions, aggregate gradation, and characteristics lead to these
differences in performance. It is clear that more work is needed.
Looking at Figure 25, several general trends can be observed with different aggregate types. In
order to pass the box test, the river rock required a higher slump than the crushed limestone. All
combinations of the 1.5 in. coarse aggregate required a higher slump than the 3/4 in. coarse
aggregate to pass the box test.
For the aggregates and gradations investigated, the Shilstone chart was not able to predict how a
mixture would perform in the box test. For example, in Figure 23, the five mixture gradations
using 3/4 in. river rock and manufactured sand were in different locations on the Shilstone chart,
but needed similar amounts of WR to pass the box test. In general, aggregate combinations in the
middle of the Shilstone chart were able to pass the box test with the lowest slump. As shown in
Figure 24, in five of the eight aggregate combinations there was no difference in WR required to
pass the box test for gradations in the middle of the Shilstone chart and the mixtures with 60%

34
coarse and 40% fine aggregate. This suggests that including the intermediate aggregates in the
concrete mixture did not have a consistent impact on the WR results of the box test. However,
mixtures at the middle of the Shilstone chart had the ability to hold an edge, while the 60%
coarse and 40% fine aggregate had a noticeable edge slump.
Several gradations were separated by an aggregate weight difference of only one hundred lbs/cy,
but performed completely different. Shown in Tables 7 and 8, the 3/4 in. crushed limestone and
river rock gradation of minimum voids and bottom of the Shilstone chart generate very similar
weight amounts of sand, intermediate, and coarse aggregates, but used a difference of 11.8
oz/cwt. On the other hand, 3/4 in. river rock and manufactured sand gradation of power 45 and
bottom of the Shilstone chart produced very similar weight amounts of sand, intermediate, and
coarse aggregates, but required only a slight difference in WR dosage. In fact, 3/4 in. river rock
and manufactured sand receive similar WR dosages for all the gradations.
Useful visual observations about the ability to finish and shovel the mixtures were made during
the sample creation, but were not easily quantified. The mixtures in the center of the Shilstone
chart and with the 60/40 gradation were the easiest to place and finish. Also, mixtures with river
rock flowed better in the mixer than those with crushed limestone. It should be noted that the
power 45 with 3/4 in. river rock and sand required the least amount of WR used when compared
to the other mixtures, as shown in Figure 24. However, this mixture was very stiff and would be
very difficult to place and finish.
Looking at Figure 26, the mixtures using gradations with intermediate aggregates all had a 7-day
strength over 3800 psi. The mixtures containing 1.5 in. river rock were stronger than those with
3/4 in. river rock. As shown in Figure 27, the minimum voids and/or power 45 had the highest
compressive strength for each combination, while the 60/40 gradation mixtures had a
consistently lower compressive strength. Both the middle and bottom of the Shilstone chart
mixtures had compressive strengths that varied widely.
After failing the box test with a WR dosage above 85 oz/cwt, the 28-day strength of the power
45 mixture with 3/4 in. crushed limestone and river sand was higher than 8200 psi. The
compressive strength of the mixture could be affected by the power 45 gradation or the high WR
dosage. The extremely high dosage of WR delayed final set of the compression cylinders for five
days. The set delay did not have an extreme impact on the 7-day compressive strength.
The concrete’s resistance to an electric current was measured using the Wenner probe.
Unfortunately, the Wenner probe broke during the testing time frame and was not able to be
repaired. A new one was purchased and measurements were resumed after it arrived. Table 9
shows the Wenner probe results of the different aggregate combinations. Neither the WR,
gradation, nor type of rock combinations had a noticeable variation in resistance from the limited
amount of data available.
Using amounts more than 1200 lbs/cy of manufactured sand gave high air contents and low unit
weights. Also, both 1.5 in. and 3/4 in. river rock and river sand combinations resulted in 4% or
35
higher air content for the Shilstone middle of box and 60/40 gradation. The cause was not found
during this testing.
CONCLUSIONS
The effects of aggregate characteristics on concrete properties, such as ability to be vibrated,
strength, and resistivity, were investigated using mixtures in which the paste content and the
water/cement ratio were held constant. The results showed the different aggregate proportions,
the maximum nominal aggregate sizes, and combinations of different aggregates all impacted the
performance in the strength, slump, and box test. Based on the data collected, the following have
been found:
The location in the Shilstone chart did not correlate to the response of a concrete
mixture to vibration.
Aggregate gradations in the middle of the Shilstone chart and 60/40 gradations
consistently required the lowest dosage of WR to show satisfactory response to
vibration.
Little difference between the WR dosage required for satisfactory response to
vibration between mixtures with gradations in the middle of the Shilstone chart and
60/40 gradation. This suggests that concrete that responds well to vibration is not
strongly dependent on the presence of the intermediate aggregates in a mixture.
By using intermediate sizes in a concrete mixture, the compressive strength increases.
A distinct increase in the slump was observed with the majority of river rock
compared to crushed limestone. The crushed limestone’s slump ranged from 0.5 in. to
1.5 in., while the river rock’s slump ranged from 1 in. to 2.5 in.
Next Steps
Better quantitative techniques are needed to evaluate the performance of a concrete mixture for
different applications. For this work, the ability of the mixture to be vibrated and placed by a
paver was investigated. This was done with a novel test method created by the research team.
This work led to many improvements in the test and sparked future work that will continue to
improve this important need.
The research team plans on investigating the box test by using accelerometers placed between
the vibrator and the walls of the container. As the concrete is vibrated, the accelerometers should
describe the rate of mortar movement. This would provide a more quantitative measurement than
the current visual inspection of the box test. Also, the box test will be correlated with field
performance of a slip-formed paver. These field correlations will help to better understand what
limits should be placed on the test.
The findings in this work showed little difference in workability for mixtures with and without
intermediate aggregate sizes and the same paste content. This implies that specifications
requiring a contractor to use an intermediate aggregate size will not allow a reduction in paste

36
volume over mixtures without these aggregates intentionally being added for paving mixtures if
the goal is to find a mixture that will respond to vibration.
Data on other ongoing research suggests that the shape and texture of aggregates play an
important role in their response to vibration. Unfortunately, these parameters are not currently
measured in the design of concrete mixtures. More work is ongoing.

37
REFERENCES
Richard, David N., “Aggregate Gradation Optimization,” Literature Search. Missouri
Department of Transport. Jefferson, Missouri. January 2005.
Shilstone, James M., “A Hard Look at Concrete,” Civil Engineering, January 1989, pages 47-49.
Shilstone, James M., Sr., “Concrete Mixture Optimization,” Concrete International, American
Concrete Institute, Farmington Hills, Michigan, June 1990, pages 33-39.
The Transtec Group, Inc. (2004). Concrete Mixture Performance Analysis System (Version
1.00.0022) [computer software]. Texas.
Standards and Specifications
ASTM C 39, “Standard Test Method for Compressive Strength of Cylindrical Concrete
Specimens”, American Society for Testing and Materials, West Conshohocken,
Pennsylvania.
ASTM C 127, “Standard Test Method for Density, Relative Density (Specific Gravity), and
Absorption of Coarse Aggregate”, American Society for Testing and Materials, West
Conshohocken, Pennsylvania.
ASTM C 128, “Standard Test Method for Density, Relative Density (Specific Gravity), and
Absorption of Fine Aggregate”, American Society for Testing and Materials, West
Conshohocken, Pennsylvania.
ASTM C 136, “Standard Test Method for Sieve Analysis of Fine and Coarse Aggregates”,
American Society for Testing and Materials, West Conshohocken, Pennsylvania.
ASTM C 138, “Standard Test Method for Unit Weight, Yield, and Air Content (Gravimetric) of
Concrete”, American Society for Testing and Materials, West Conshohocken,
Pennsylvania.
ASTM C 143/C 143M-03, “Standard Test Method for Slump of Hydraulic Cement Concrete”,
American Society for Testing and Materials, West Conshohocken, Pennsylvania.
ASTM C 150, “Standard Specification for Portland Cement, American Society for Testing and
Materials”, West Conshohocken, Pennsylvania.
ASTM C 192, “Standard Practice for Making and Curing Concrete Test Specimens in the
Laboratory”, American Society for Testing and Materials, West Conshohocken,
Pennsylvania.
ASTM C 231-04, “Standard Test Method for Air Content of Freshly Mixed Concrete by the
Pressure Method”, American Society for Testing and Materials, West Conshohocken,
Pennsylvania.
ASTM C 494-05, “Standard Specification for Chemical Admixtures for Concrete”, American
Society for Testing and Materials, West Conshohocken, Pennsylvania.