concrete pavement mixture design and analysis (mda...
TRANSCRIPT

Concrete Pavement Mixture Design and Analysis (MDA):
Assessment of Air Void System Requirements for Durable Concrete
Technical ReportJune 2012
Sponsored throughFederal Highway Administration (DTFH61-06-H-00011 (Work Plan 25))Pooled Fund Study TPF-5(205): Colorado, Iowa (lead state), Kansas, Michigan, Missouri, New York, Oklahoma, Texas, Wisconsin

About the National CP Tech Center
The mission of the National Concrete Pavement Technology Center is to unite key transportation stakeholders around the central goal of advancing concrete pavement technology through research, tech transfer, and technology implementation.
Disclaimer Notice
The contents of this report reflect the views of the authors, who are responsible for the facts and the accuracy of the information presented herein. The opinions, findings and conclusions expressed in this publication are those of the authors and not necessarily those of the sponsors.
The sponsors assume no liability for the contents or use of the information contained in this document. This report does not constitute a standard, specification, or regulation.
The sponsors do not endorse products or manufacturers. Trademarks or manufacturers’ names appear in this report only because they are considered essential to the objective of the document.
Iowa State University Non-Discrimination Statement
Iowa State University does not discriminate on the basis of race, color, age, religion, national origin, sexual orientation, gender identity, genetic information, sex, marital status, disability, or status as a U.S. veteran. Inquiries can be directed to the Director of Equal Opportunity and Compliance, 3280 Beardshear Hall, (515) 294-7612.
Iowa Department of Transportation Statements
Federal and state laws prohibit employment and/or public accommodation discrimination on the basis of age, color, creed, disability, gender identity, national origin, pregnancy, race, religion, sex, sexual orientation or veteran’s status. If you believe you have been discriminated against, please contact the Iowa Civil Rights Commission at 800-457-4416 or the Iowa Department of Transportation affirmative action officer. If you need accommodations because of a disability to access the Iowa Department of Transportation’s services, contact the agency’s affirmative action officer at 800-262-0003.
The preparation of this report was financed in part through funds provided by the Iowa Department of Transportation through its “Second Revised Agreement for the Management of Research Conducted by Iowa State University for the Iowa Department of Transportation” and its amendments.
The opinions, findings, and conclusions expressed in this publication are those of the authors and not necessarily those of the Iowa Department of Transportation or the U.S. Department of Transportation Federal Highway Administration.

Technical Report Documentation Page
1. Report No. 2. Government Accession No. 3. Recipient’s Catalog No.
Part of DTFH61-06-H-00011 Work
Plan 25
4. Title and Subtitle 5. Report Date
Concrete Pavement Mixture Design and Analysis (MDA):
Assessment of Air Void System Requirements for Durable Concrete
June 2012
6. Performing Organization Code
7. Author(s) 8. Performing Organization Report No.
Tyler Ley, Robert Felice and John Michael Freeman Part of InTrans Project 09-353
9. Performing Organization Name and Address 10. Work Unit No. (TRAIS)
National Concrete Pavement Technology Center
Iowa State University
2711 South Loop Drive, Suite 4700
Ames, IA 50010-8664
11. Contract or Grant No.
12. Sponsoring Organization Name and Address 13. Type of Report and Period Covered
Federal Highway Administration
U.S. Department of Transportation
1200 New Jersey Avenue SE
Washington, DC 20590
Technical Report
14. Sponsoring Agency Code
TPF-5(205)
15. Supplementary Notes
Visit www.cptechcenter.org for color PDF files of this and other research reports.
16. Abstract
Concrete will suffer frost damage when saturated and subjected to freezing temperatures. Frost-durable concrete can be produced if a
specialized surfactant, also known as an air-entraining admixture (AEA), is added during mixing to stabilize microscopic air voids.
Small and well-dispersed air voids are critical to produce frost-resistant concrete.
Work completed by Klieger in 1952 found the minimum volume of air required to consistently ensure frost durability in a concrete
mixture subjected to rapid freezing and thawing cycles. He suggested that frost durability was provided if 18 percent air was created in
the paste. This is the basis of current practice despite the tests being conducted on materials that are no longer available using tests that
are different from those in use today.
Based on the data presented, it was found that a minimum air content of 3.5 percent in the concrete and 11.0 percent in the paste should
yield concrete durable in the ASTM C 666 with modern AEAs and low or no lignosulfonate water reducers (WRs). Limited data
suggests that mixtures with a higher dosage of lignosulfonate will need about 1 percent more air in the concrete or 3 percent more air in
the paste for the materials and procedures used. A spacing factor of 0.008 in. was still found to be necessary to provide frost durability
for the mixtures investigated.
17. Key Words 18. Distribution Statement
air void system—concrete durability—mix design No restrictions.
19. Security Classification (of this
report)
20. Security Classification (of this
page)
21. No. of Pages 22. Price
Unclassified. Unclassified. 30 NA
Form DOT F 1700.7 (8-72) Reproduction of completed page authorized


CONCRETE PAVEMENT MIXTURE DESIGN AND
ANLAYSIS (MDA): ASSESSMENT OF AIR VOID
SYSTEM REQUIREMENTS FOR DURABLE CONCRETE
Technical Report
June 2012
Principal Investigator
Peter Taylor, Associate Director
National Concrete Pavement Technology Center
Iowa State University
Authors
Tyler Ley, Robert Felice, and Michael Freeman
Department of Civil and Environmental Engineering
Oklahoma State University
Sponsored by
the Federal Highway Administration (FHWA)
DTFH61-06-H-00011 Work Plan 25
FHWA Pooled Fund Study TPF-5(205): Colorado, Iowa (lead state), Kansas, Michigan,
Missouri, New York, Oklahoma, Texas, Wisconsin
Preparation of this report was financed in part
through funds provided by the Iowa Department of Transportation
through its Research Management Agreement with the
Institute for Transportation
(InTrans Project 09-353)
A report from
National Concrete Pavement Technology Center
Iowa State University
2711 South Loop Drive, Suite 4700
Ames, IA 50010-8664
Phone: 515-294-8103
Fax: 515-294-0467
www.cptechcenter.org


v
TABLE OF CONTENTS
ACKNOWLEDGMENTS ............................................................................................................ vii
INTRODUCTION ...........................................................................................................................1
MATERIALS ...................................................................................................................................2
EXPERIMENTAL METHODS.......................................................................................................3
Mixture Design ....................................................................................................................3 Concrete Mixture Procedure ................................................................................................3 Sampling and Testing ..........................................................................................................4 Hardened Air Sample Preparation .......................................................................................4
RESULTS ........................................................................................................................................6
DISCUSSION ................................................................................................................................17
Required Air Content for Frost Durable Concrete .............................................................17
Impact of Admixtures on Spacing Factor ..........................................................................17 Spacing Factor Limits ........................................................................................................17 Varying w/cms and Frost Durability..................................................................................18
PRACTICAL IMPLICATIONS ....................................................................................................18
CONCLUSIONS............................................................................................................................19
REFERENCES ..............................................................................................................................21
Standards and Specifications .............................................................................................22

vi
LIST OF FIGURES
Figure 1. Satisfactorily lapped sample .............................................................................................5 Figure 2. Finished sample ................................................................................................................6 Figure 3. Measured percent expansions ...........................................................................................9
Figure 4. Measured percent mass change ......................................................................................10 Figure 5. Concrete air contents measured by pressure meter and spacing factor for
all mixtures......................................................................................................................11 Figure 6. Concrete paste air contents calculated from C231 pressure meter readings
and spacing factor for all mixtures..................................................................................12
Figure 7. Concrete air contents measured by pressure meter and specific surface for
all mixtures......................................................................................................................14 Figure 8. Concrete paste air contents calculated from C231 pressure meter readings and
specific surface for all mixtures ......................................................................................15 Figure 9. Spacing factors versus C 231 concrete air contents for mixtures with and
without water reducer .....................................................................................................16
LIST OF TABLES
Table 1. Cement Oxide Analysis - Type I/II Cement ......................................................................2
Table 2. Admixture Reference .........................................................................................................2 Table 3. SSD Mixture Proportions...................................................................................................3
Table 4. Mixtures with different AEAs and w/cm ...........................................................................7
Table 5. Mixtures with a lignosulfonate (midrange) water reducer .................................................8

vii
ACKNOWLEDGMENTS
This research was conducted under Federal Highway Administration (FHWA) DTFH61-06-H-
00011 Work Plan 25 and the FHWA Pooled Fund Study TPF-5(205), involving the following
state departments of transportation:
Colorado
Iowa (lead state)
Kansas
Michigan
Missouri
New York
Oklahoma
Texas
Wisconsin
The authors would like to express their gratitude to the National Concrete Pavement Technology
(CP Tech) Center, the FHWA, the Iowa Department of Transportation (DOT), and the other
pooled fund state partners for their financial support and technical assistance.


1
INTRODUCTION
Concrete will suffer frost damage when saturated and subjected to freezing temperatures. Frost-
durable concrete can be produced if a specialized surfactant, also known as an air-entraining
admixture (AEA), is added during mixing to stabilize microscopic air voids. Small and well-
dispersed air voids are critical to produce frost-resistant concrete. The spacing and size
distribution of the bubbles are thought to be more important than the volume of air. Air void
characterization is currently made in hardened concrete with ASTM C 457, “Microscopical
Determination of Parameters of the Air-Void System in Hardened Concrete.” The spacing factor
and specific surface are the common parameters determined from the ASTM C 457 technique.
These parameters were first determined by Powers (1954a, 1954b). The ACI 201 document,
“Guide to Concrete Durability” (ACI 2008) suggests that a spacing factor of 0.008 in. and a
specific surface of 600 in.-1
be used to determine if a concrete is frost susceptible. The Canadian
Standards Association (CSA 2009) has suggested that a spacing factor from a lot can be no
higher than 0.010 in. as long as the average for the element is below 0.009 in.
Currently there is no quality control test that can accurately measure the air void size and
distribution in the fresh concrete. In the absence of an adequate test, researchers have reverted to
measuring the total volume of air in a concrete mixture. Past research has shown that as the
volume of air increases, the average spacing between voids in the paste, or the spacing factor,
decreases (Pigeon and Pleau 1995, Ley 2007). This leads to an improvement in frost durability.
Work completed by Klieger (1952, 1956) found the minimum volume of air required to
consistently ensure frost durability in a concrete mixture subjected to rapid freezing and thawing
cycles. These tests were carried out by systematically changing the volume of air in the concrete
mixture and then evaluating the freeze thaw performance of the mixture. Kleiger’s work was
completed without the aid of any hardened air void analysis and ultimately suggested that
throughout all of the mixtures investigated, frost durability was provided if 18% air was created
in the paste. ACI 318 has adopted these recommendations by assuming a paste volume based on
the maximum nominal aggregate size and specifying a recommended volume. Others commonly
just specify a total volume of air such as 6% air in the concrete.
However, if one reviews the details of Klieger’s past research, they will realize that the
characteristics of the materials Klieger investigated are not representative of modern concrete
mixtures. For example, in every mixture in Kleiger’s research the only admixture used was a
Vinsol resin AEA. At the time of the testing, a Vinsol resin was the only AEA admixture widely
used in concrete. Since this time, several other AEAs have been introduced. Also, in modern
mixtures it is common to use combinations of chemical admixtures with water reducers (WRs).
Little work has been done to quantify how the interaction between AEAs and WRs impact the
frost durability of the mixture (Plante et al. 1989). Furthermore, the test Klieger used to
investigate frost durability does not match the modern test method to investigate bulk freeze
thaw damage, ASTM C 666 “Resistance of Concrete to Rapid Freezing and Thawing.” There
were differences in curing, freezing and thawing rate, and failure evaluation.

2
Despite all of these differences, these recommendations are still used. However, there have been
a number of workers who have suggested that these recommendations may need to change based
on the large changes in materials and testing procedures (Gay 1982 and 1985, Jana et al. 2005,
Ley 2007). The validity of spacing factor limits of 0.008 in. has also been challenged.
The goal of this work is to evaluate the bulk freeze thaw performance (ASTM C 666) and
hardened air void systems (ASTM C 457) of modern concrete mixtures with similar
methodologies as used by Klieger. This work used three different AEAs (synthetic, wood rosin,
and Vinsol resin), a lignosulfonate WR, and different w/cms to evaluate performance.
These findings provide many useful insights into requirements for the frost durability of modern
concrete mixtures.
MATERIALS
All of the concrete mixtures described in this report were prepared using a typical Type I/II
cement that meets the requirements of ASTM C 150. The oxide analysis is shown below in
Table°1.
Table 1. Cement Oxide Analysis - Type I/II Cement
SiO2 Al2O3 Fe2O3 CaO MgO SO3 Na2O K2O C3S C2S C3A C4AF
20.1% 4.8% 2.9% 63.0% 2.0% 3.0% 0.3% 0.3% 58.0% 14.1% 7.9% 9.1%
Total Na2O equivalent alkali content was 0.5%
The aggregates used were locally available crushed limestone and sand used in commercial
concrete. The maximum nominal aggregate size was 3/4 in., and both the rock and sand met
ASTM C 33 “Standard Specification of Concrete Aggregates.” All admixtures met ASTM C 260
and C 494 and are described in Table 2.
Table 2. Admixture Reference
Short Hand Description Application
WROS Wood rosin Air entrainer
SYNTH Synthetic chemical combination Air entrainer
VR Vinsol resin Air entrainer
WRA-L
WRA-H
Lignosulfonate
Lignosulfonate
3.7oz/cwt Midrange water reducer
10.2oz/cwt Midrange water reducer

3
A wood rosin (WROS), synthetic (SYNTH), and vinsol resin (VR) were investigated in the
research. All mixtures prepared with a lignosulfonate water reducer used wood rosin as the AEA.
Rapid freezing and thawing tests (ASTM C 666) and hardened air void analyses (ASTM C 457)
were used to study the concrete air void systems.
EXPERIMENTAL METHODS
Mixture Design
Mixture designs with constant cement content and varying w/cms were used for this research.
The 0.41 and 0.45 w/cms mixtures were chosen, as they bracket the range of typical w/cm used
in low slump mixtures without the use of a water reducer. To investigate the effect of a water
reducer, mixtures with a w/cm of 0.41 and 0.38 were investigated. A higher dosage of WRA,
10.2 oz/cwt, was used in the 0.38 and 0.41 w/cm mixtures. This dosage will be referred to as
WRA-H. A lower dosage of 3.7 oz/cwt was used in the 0.41 w/cm mixture. This dosage will be
referred to as WRA-L. Different dosages were used to simulate the different ranges of typical
WRA dosages used in the field and the impact of changes in w/cm. All of these dosages were
within the manufacturer recommended limits.
The addition of WRA also allowed for lower w/cms to be investigated. Powers hypothesized
with hydraulic pressure theory that the permeability and tensile strength of the paste may affect
freeze thaw performance (Powers 1949). Table 3 shows the mixture design proportions.
Table 3. SSD Mixture Proportions
Concrete Mixture Procedure
Aggregates are collected from outside storage piles and brought into a temperature-controlled
room at 73°F for at least 24 hours before mixing. Aggregates were placed in mixer and spun, and
a representative sample was taken for a moisture correction. At the time of mixing, all aggregate
was loaded into the mixer along with approximately two-thirds of the mixing water. This
combination was mixed for three minutes to allow the aggregates to approach the saturated
surface dry (SSD) condition and ensure that the aggregates were evenly distributed.
Next, the cement and the remaining water was added and mixed for three minutes. The resulting
mixture rested for two minutes while the sides of the mixing drum were scraped.
w/c Paste Content Water Cement Coarse Fine
ratio (%) lb/yd3
lb/yd3
lb/yd3
lb/yd3
0.38 26 232 611 1950 1203
0.41 28 250.5 611 1900 1129
0.45 29 275 611 1850 1203

4
After the rest period, the mixer was turned on and charged with admixtures. The water-reducing
agent was added first (if applicable) and was allowed to incorporate into the mixture for 15-30
seconds, and then the AEA was added. After the addition of admixtures the concrete was mixed
for three minutes.
Sampling and Testing
After mixing, the material was tested for slump (ASTM C 143), unit weight (ASTM C 138), and
fresh concrete air content (ASTM C 231). Once the fresh properties were determined to be
acceptable, samples were prepared for freeze thaw durability testing (ASTM C 666) and
hardened air void analysis (ASTM C 457). For each mixture, two ASTM C 666 beams and an
ASTM C 457 sample were created. Freeze thaw prisms were cured for one day in steel molds
while covered with wet burlap and then in saturated limewater for the remainder of the 14-day
curing period, as per ASTM C666.
Next, the freeze thaw beams were placed inside a temperature controlled water bath and brought
to 40F. Once the prisms were at 40F, the length, mass, and dynamic modulus were measured.
The soaked prisms were then investigated in the ASTM C 666 test for 300 cycles. As per ASTM
C 666, dynamic modulus, expansion, and mass change were measured every 36 cycles or before.
If the durability factor decreased below 80%, dynamic modulus was no longer measured, but
expansion and mass measurements continued through 300 cycles with two exceptions. The 0.41
+ VR and 0.38 + WROS + WRA-H specimens with target concrete air contents near 2.5%
cracked down the middle in the short direction and measurement was not possible after 96 and
240 cycles, respectively. Based on the trends prior to specimen failure, both the expansion and
mass loss would have increased if the specimens would have continued in the test.
ASTM C 666 does not clearly define freeze thaw failure; however, some guidance is given in
admixture standards ASTM C 260, ASTM C 494, and ASTM C 1017. These standards
recommend that the ASTM C 666 durability factor of a mixture with and without an admixture
should not differ by more than 20%. If this criterion is used to evaluate the performance of a
mixture in the ASTM C 666 test, then the limiting durability factor would be between 70% and
80% (Ley 2007). For this paper, a specimen was determined failed if the durability factor
decreased below 80% at any point during the testing cycle.
Hardened Air Sample Preparation
The hardened air samples were cut into 3/4 in. thick slices using a self-propelled concrete saw
with an 18 in. diameter continuous rim blade with oil based cutting fluid. The sample was
cleaned with water and then dried under a fan. An equal parts mixture of lacquer and acetone
was applied to harden the surface and protect the rims of the air voids. An 18 in. concrete lapper
with magnetically bonded diamond discs of decreasing grit size were used to prepare the samples
for testing. The samples were prepared as per ASTM C 457.

5
After the lapping was complete, each sample was inspected under a stereomicroscope to ensure
aggregates and paste had been lapped to the same elevation, and that there was a high quality
finish on the specimen. After the specimen had received an acceptable polish, they were soaked
in acetone to remove the lacquer. After soaking in acetone, the prepared sample surface was
colored solid with a black permanent marker, then, dried for three hours. A second coat of black
marker was then applied in the perpendicular direction to the first coat and the sample dried for
eight hours. A thin layer of barium sulfate, a white powder with a particle size less than 3.94 x
10-5
in. (< 1 um), was pressed on the colored surface twice with a rubber stopper to force the
white powder into the voids. This technique is described in EN 480-11. This left the surface of
the concrete black and the voids stained white. Since the analysis is concerned with the voids in
the paste, the voids in the aggregate must be masked. To do this, the voids within the aggregate
were colored with a fine permanent ink pen under a stereomicroscope. Once completed, a final
inspection was made of the surface to ensure that voids in the paste were white and all other
areas in the sample were black. A sufficiently polished sample and a finished sample can be seen
in Figures 1 and 2.
This technique is outlined in detail in Ley (2007) and has been used by several other researchers
(Jakobsen et al. 2006, Sutter 2002, Carlson 2005, Peterson et al. 2007).
Figure 1. Satisfactorily lapped sample

6
Figure 2. Finished sample
Once the voids in the paste have been preferentially marked it is possible to use this contrast to
determine the air void parameters of the mixture. The research team used the Rapid Air 457 from
Concrete Experts, Inc. This machine completes an automated linear traverse analysis on the
sample by using a CCD camera to image the surface, and an automated stage for precise
movement. Image analysis is then used to discern voids (white) from other portions of the
sample (dark). A single threshold value of 145 was used for all of the samples, which has been
shown to be satisfactory with the sample preparation materials and processes used (Ley 2007).
This technique requires that the volume of paste be given. This was determined from the batch
weights for each concrete mixture design. For the results of the hardened air void analysis
reported in this paper, chords smaller than 30 µm were not included in the analysis as they are
not easily detected by a human during an ASTM C 457 analysis. By excluding these chords, the
air void parameters determined by the hardened air void analysis are better comparable to
previously reported values of ASTM C 457 results. This has been done previously by many
researchers (Jakobsen et al. 2006, Ley 2007, Peterson et al. 2009, Ramezanianpour and Hooton
2010).
RESULTS
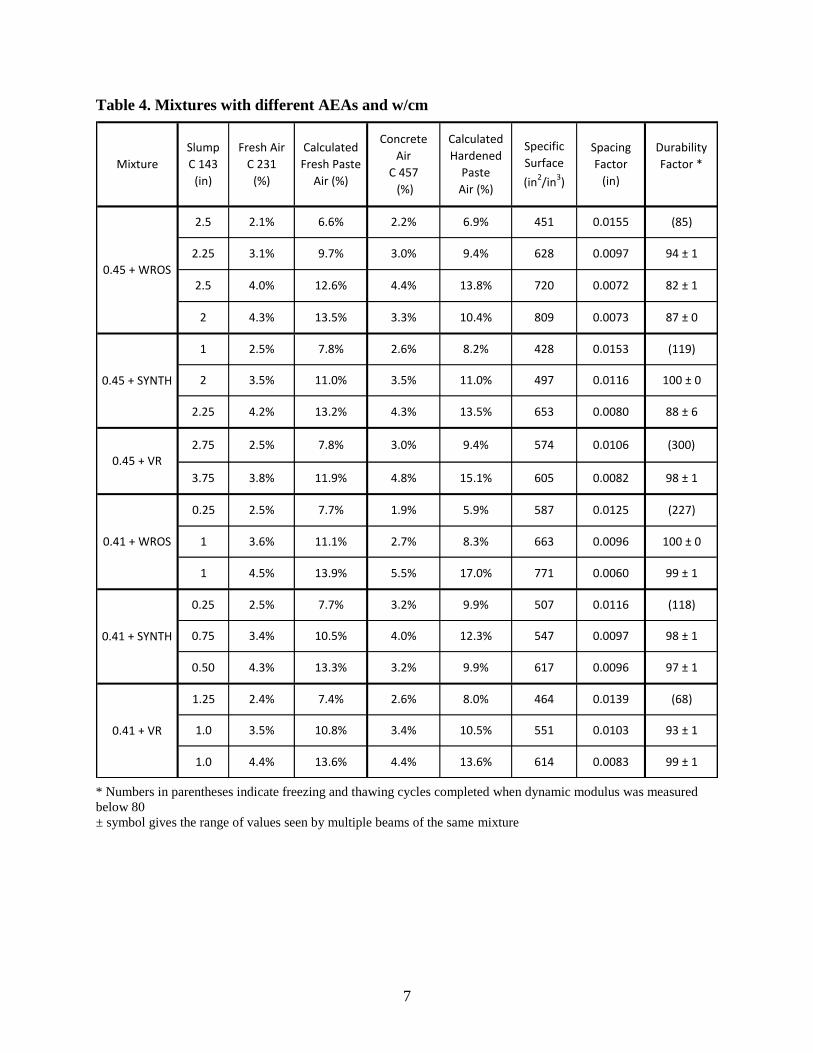
The results have been separated into two different groups. Table 4 shows the mixtures made with
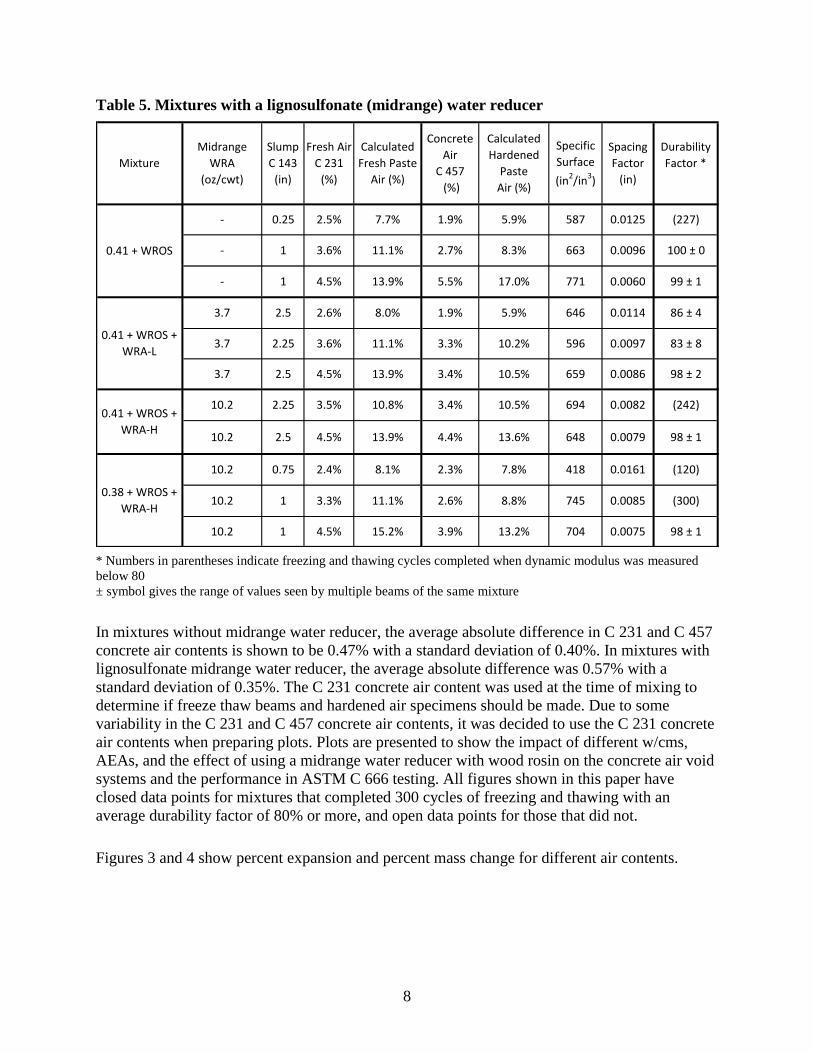
three types of AEAs at different w/cm ratios. Table 5 shows mixtures made with wood rosin
AEA at different w/cms and a lignosulfonate midrange water reducer. The paste air contents
were determined by using the measured air contents and the concrete batch weights. Tables 4 and
5 show C 231 and C 457 concrete air contents.
7
Table 4. Mixtures with different AEAs and w/cm
* Numbers in parentheses indicate freezing and thawing cycles completed when dynamic modulus was measured
below 80
± symbol gives the range of values seen by multiple beams of the same mixture
428
0.45 + WROS
2.5 2.1%
9.4% 628
6.6% 6.9% 451
2 4.3% 13.5% 10.4% 809
12.6% 13.8% 7202.5
2.25
11.0%
2.5% 7.8% 8.2%
0.0155 (85)
0.0097 94 ± 1
4.0% 0.0072 82 ± 1
3.1% 9.7%
0.0153 (119)
0.0073 87 ± 0
0.0116 100 ± 0
88 ± 62.25 4.2% 13.2%
2.75 2.5% 7.8% 9.4% 574
98 ± 1
0.45 + VR
100 ± 01
0.0106 (300)
8.3% 663 0.0096
587 0.0125 (227)
0.41 + WROS
0.25 2.5% 7.7% 5.9%
11.9% 15.1%
0.50 4.3%
99 ± 1
0.41 + SYNTH
0.25 2.5%
0.75 3.4% 10.5% 12.3% 547
7.7% 9.9% 507 0.0116
771 0.0060
99 ± 1
93 ± 1
97 ± 1
3.4%
4.4%1.0 4.4% 13.6% 13.6% 614 0.0083
10.5% 551 0.01030.41 + VR
(68)
(118)
Durability
Factor *
Calculated
Fresh Paste
Air (%)
Fresh Air
C 231
(%)
Slump
C 143
(in)
5.5%
3.2%
4.0%
3.2%
2.6%
0.0097 98 ± 1
1.25 2.4% 7.4% 8.0%
13.3% 9.9% 617 0.0096
605 0.00823.75 3.8%
13.5%
Mixture
Calculated
Hardened
Paste
Air (%)
Specific
Surface
(in2/in
3)
Spacing
Factor
(in)
1.0 3.5% 10.8%
464 0.0139
3.6% 11.1%
1 4.5% 13.9% 17.0%
2.7%
653 0.0080
4970.45 + SYNTH
1
2 3.5% 11.0%
Concrete
Air
C 457
(%)
2.2%
3.0%
4.4%
3.3%
2.6%
3.5%
4.3%
3.0%
4.8%
1.9%
8
Table 5. Mixtures with a lignosulfonate (midrange) water reducer
* Numbers in parentheses indicate freezing and thawing cycles completed when dynamic modulus was measured
below 80
± symbol gives the range of values seen by multiple beams of the same mixture
In mixtures without midrange water reducer, the average absolute difference in C 231 and C 457
concrete air contents is shown to be 0.47% with a standard deviation of 0.40%. In mixtures with
lignosulfonate midrange water reducer, the average absolute difference was 0.57% with a
standard deviation of 0.35%. The C 231 concrete air content was used at the time of mixing to
determine if freeze thaw beams and hardened air specimens should be made. Due to some
variability in the C 231 and C 457 concrete air contents, it was decided to use the C 231 concrete
air contents when preparing plots. Plots are presented to show the impact of different w/cms,
AEAs, and the effect of using a midrange water reducer with wood rosin on the concrete air void
systems and the performance in ASTM C 666 testing. All figures shown in this paper have
closed data points for mixtures that completed 300 cycles of freezing and thawing with an
average durability factor of 80% or more, and open data points for those that did not.
Figures 3 and 4 show percent expansion and percent mass change for different air contents.
Calculated
Fresh Paste
Air (%)
Durability
Factor *
3.4%
4.4%
2.3%
2.6%
Mixture
Midrange
WRA
(oz/cwt)
Slump
C 143
(in)
Fresh Air
C 231
(%)
0.41 + WROS
1.9%
3.3%
3.4%
- 1 4.5%
646 0.0114 86 ± 4
771 0.0060 99 ± 1
98 ± 2
100 ± 0
5.9%
13.9% 17.0%
-
0.41 + WROS +
WRA-H
10.2 2.25 3.5%
10.2 2.5 4.5% 13.9% 13.6% 648
10.8% 10.5% 694 0.0082 (242)
0.41 + WROS +
WRA-L
3.7 2.5 2.6%
2.5%
418 0.0161 (120)
0.0079 98 ± 1
0.38 + WROS +
WRA-H
10.2 0.75
10.2 1 3.3% 11.1% 8.8%
2.4% 8.1% 7.8%
745 0.0085 (300)
13.2% 704 0.0075 98 ± 110.2 1 4.5% 15.2% 3.9%
Specific
Surface
(in2/in
3)
Spacing
Factor
(in)
(227)
83 ± 8
1 3.6% 11.1% 8.3% 663
7.7% 5.9% 587 0.0125
0.0096
10.2% 596 0.00972.25 3.6% 11.1%
8.0%
Concrete
Air
C 457
(%)
1.9%
2.7%
5.5%
Calculated
Hardened
Paste
Air (%)
- 0.25
3.7 2.5 4.5% 13.9% 10.5% 659 0.0086
3.7

9
Figure 3. Measured percent expansions
-0.030%
0.020%
0.070%
0.120%
0.170%
0.220%
0.270%
0.320%
0.370%
0.420%
0.470%
0.520%
2.0% 2.5% 3.0% 3.5% 4.0% 4.5%
Exp
ansi
on
Du
rin
g 3
00
Fre
ezin
g an
d T
haw
ing
Cyc
les
- p
erce
nt
Air Content of Concrete (Pressure)
0.41/WROS
0.41/SYNTH
0.41/VR
0.41/WROS/WRA-L
0.41/WROS/WRA-H
0.38/WROS/WRA-H
Min. Concrete Air(Frost Durable)

10
Figure 4. Measured percent mass change
The data point symbols indicate the w/cm with a square being 0.41, and the triangle being 0.38.
A vertical line was added at 3.5% concrete air content to highlight a break in the data in frost
durability. This will be discussed later in the document. Open data points indicate unsatisfactory
freeze thaw performance.
Spacing factors were determined for all mixtures and can be found in Figures 5 and 6 relative to
C 231 concrete air contents and calculated paste air contents.
-5.600%
-5.100%
-4.600%
-4.100%
-3.600%
-3.100%
-2.600%
-2.100%
-1.600%
-1.100%
-0.600%
-0.100%
0.400%
2.0% 2.5% 3.0% 3.5% 4.0% 4.5%
Mas
s C
han
ge D
uri
ng
30
0 F
reez
ing
and
Th
awin
g C
ycle
s -
per
cen
t
Air Content of Concrete (Pressure)
0.41/WROS
0.41/SYNTH
0.41/VR
0.41/WROS/WRA-L
0.41/WROS/WRA-H
0.38/WROS/WRA-H
Min. Concrete Air(Frost Durable)

11
Figure 5. Concrete air contents measured by pressure meter and spacing factor for all mixtures
0.006
0.008
0.010
0.012
0.014
0.016
2.0% 2.5% 3.0% 3.5% 4.0% 4.5%
Spac
ing
Fact
or
(in
)
Concrete Air Content (%) - Pressure Meter
0.45/WROS0.45/SYNTH0.45/VR0.41/WROS0.41/SYNTH0.41/VR0.41/WROS/WRA-L0.41/WROS/WRA-H0.38/WROS/WRA-HACI 201 LimitCSA LimitMin. Concrete Air (Frost Durable)

12
Figure 6. Concrete paste air contents calculated from C231 pressure meter readings and spacing factor for all mixtures
0.006
0.008
0.010
0.012
0.014
0.016
6.0% 8.0% 10.0% 12.0% 14.0% 16.0%
Spac
ing
Fact
or
(in
)
Calculated Paste Air Content (%)
0.45/WROS0.45/SYNTH0.45/VR0.41/WROS0.41/SYNTH0.41/VR0.41/WROS/WRA-L0.41/WROS/WRA-H0.38/WROS/WRA-HACI 201 LimitCSA LimitMin. Paste Air (Frost Durable)

13
CSA recommends a limit of 0.010 in. as an individual spacing factor for any given lot of
concrete and is represented by a short dashed line. The ACI 201 limit on spacing factor is shown
as a long dashed line at 0.008 in. The data symbols are unique to the w/cms (i.e. a diamond is for
0.45 w/cm). Open data symbols represent unsatisfactory freeze thaw performance. Lines connect
the spacing factors measured at the different fresh air contents observed. A vertical line was
drawn at 3.5% concrete air content and 11% paste air content to highlight a break in the data.
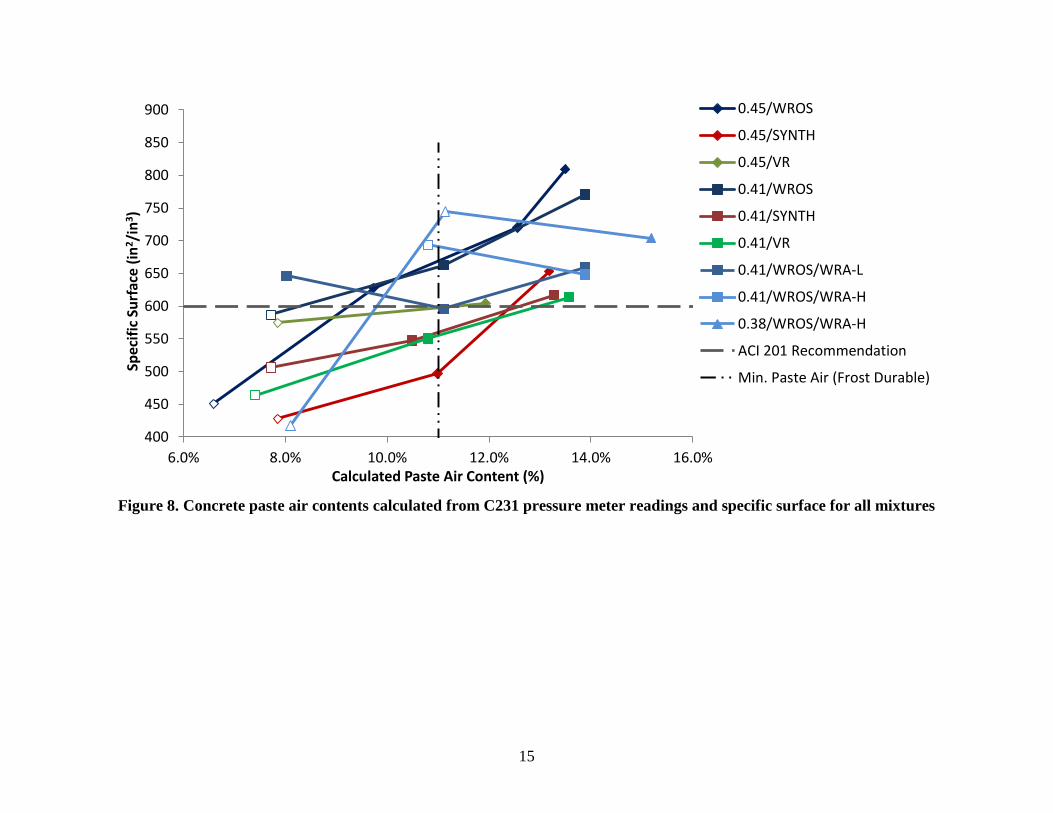
Specific surface values were measured for all mixtures and can be found in Figures 7 and 8
relative to C 231 concrete air contents and calculated paste air contents.
ACI 201 recommends specific surface to be greater than or equal to 600 in.2/in.
3 and is shown as
a long dashed line. The data symbols are unique to the w/cms (i.e. a diamond is for 0.45 w/cm).
Open data symbols represent unsatisfactory freeze thaw performance. Straight solid lines connect
specific surface values measured at the different fresh air contents observed. A vertical line was
drawn at 3.5% concrete air content and 11.0% paste air content to highlight a break in the data.
Mixtures made with and without water reducer are shown in Figure 9.
The square, diamond, and triangle symbols represent the mixtures made as part of this study.
Open data points represent unsatisfactory freeze thaw performance. The CSA recommendation
of 0.010 in. as an individual spacing factor for any given lot of concrete and is represented by a
short dashed line, and the ACI 201 limit on spacing factor is shown as a long dashed line at
0.008 in. A vertical line was drawn at 3.5% concrete air content to highlight a break in the data.
A trend line is shown for mixtures that contain only AEA.

14
Figure 7. Concrete air contents measured by pressure meter and specific surface for all mixtures
400
450
500
550
600
650
700
750
800
850
900
2.0% 2.5% 3.0% 3.5% 4.0% 4.5%
Spec
ific
Su
rfac
e (
in2/i
n3)
Concrete Air Content (%) - Pressure Meter
0.45/WROS0.45/SYNTH0.45/VR0.41/WROS0.41/SYNTH0.41/VR0.41/WROS/WRA-L0.41/WROS/WRA-H0.38/WROS/WRA-HACI 201 RecommendationMin. Concrete Air (Frost Durable)
15
Figure 8. Concrete paste air contents calculated from C231 pressure meter readings and specific surface for all mixtures
400
450
500
550
600
650
700
750
800
850
900
6.0% 8.0% 10.0% 12.0% 14.0% 16.0%
Spec
ific
Su
rfac
e (
in2/i
n3)
Calculated Paste Air Content (%)
0.45/WROS
0.45/SYNTH
0.45/VR
0.41/WROS
0.41/SYNTH
0.41/VR
0.41/WROS/WRA-L
0.41/WROS/WRA-H
0.38/WROS/WRA-H
ACI 201 Recommendation
Min. Paste Air (Frost Durable)

16
Figure 9. Spacing factors versus C 231 concrete air contents for mixtures with and without water reducer
0.006
0.008
0.010
0.012
0.014
0.016
2.0% 2.5% 3.0% 3.5% 4.0% 4.5% 5.0%
Spac
ing
Fact
or
(in
)
Concrete Air Content (%) - Pressure
AEA
AEA + WRA-L
AEA + WRA-H
ACI 201 Limit
CSA Limit
Min. Concrete Air (Frost Durable)

17
DISCUSSION
Required Air Content for Frost Durable Concrete
Figures 3 through 8 show satisfactory performance in ASTM C 666 was achieved when air
contents were near or above 3.5% in the concrete or 11% air in the paste and spacing factors
were below 0.010 in. for mixtures without lignosulfonate WR. A linear trend line drawn for AEA
mixtures without WR highlights this finding. This observation was true regardless of the AEA
used in the mixture. For mixtures that used lignosulfonate WR at 3.7 oz/cwt and wood rosin
AEA, this same air content seems to be satisfactory. However, for mixtures that contain 10.2
oz/cwt of lignosulfonate WR and wood rosin AEA, 1% more air was needed in the concrete or
3% more in the paste for satisfactory performance in ASTM C 666.
Impact of Admixtures on Spacing Factor
Based on work by Gay (1982 and 1985) and Jana et al. (2005), it was expected that synthetic
AEAs would provide a smaller bubble distribution and therefore lower spacing factor and higher
specific surface than the other AEAs for a given volume of air. If this was true, Figures 5 and 6
would show that the synthetic AEA would contain a lower spacing factor, and Figures 7 and 8 a
higher specific surface for the same volume of air. This was not observed with the mixtures and
materials used in this research. While there may be some differences in the quality of air void
system at a given air volume, the experiments found that, regardless of AEA type, 3.5% air
volume or 11% air in the paste provided satisfactory frost durability as evaluated by ASTM C
666 testing.
Spacing Factor Limits
As shown in Figure 9, all mixtures containing only an AEA or lignosulfonate with 3.7 oz/cwt
and wood rosin AEA were found to be frost durable when the spacing factor was at or below
0.010 in. This matches the suggested values for the CSA limits. However, mixtures that
contained 10.2 oz/cwt of lignosulfonate and a wood rosin AEA required a spacing factor of
0.008 in. for frost durability. This matches the suggestions of ACI 201. Based on the limited
data, it appears the CSA recommendations of using a spacing factor below 0.010 in. was not
conservative for the mixtures expected to pass the ASTM C 666 test that contain higher dosages
of lignosulfonate.
This is clear from Figure 9 by comparing the samples with a 3.5% volume of air. The mixtures
with 10.2 oz/cwt of lignosulfonate (triangles shown in Figure 9) have similar air volumes,
improved spacing factors, but different frost durability than the other mixtures investigated. This
suggests that other important parameters besides volume of air and spacing factor are critical to
frost durability performance for these mixtures. One of these possible differences may be
changes in the hydration shell immediately around the surface of the air void in concrete
containing AEAs. The porosity of this shell has been speculated as being important to frost
durability by Scherer and Valenza (2005). This shell has been observed to change based on the
18
mixture ingredients by others (Rashad and Williamson 1991a and 1991b, Ley et al. 2009a, Ley et
al. 2009 b).
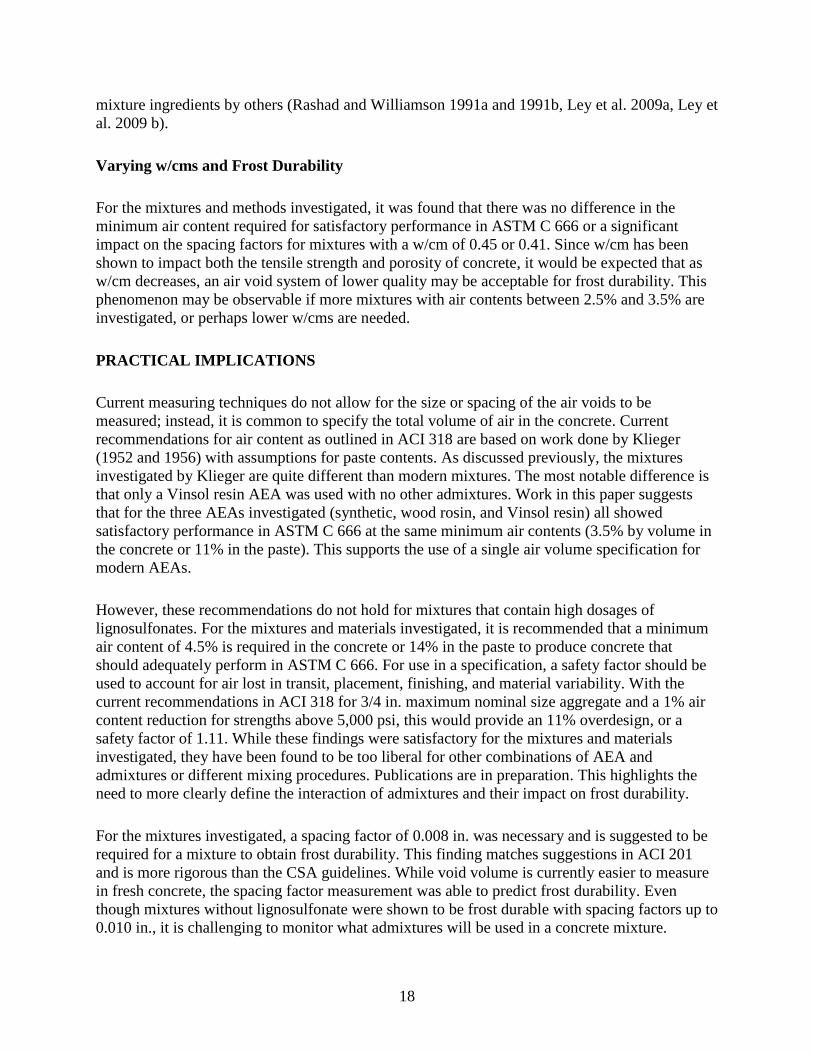
Varying w/cms and Frost Durability
For the mixtures and methods investigated, it was found that there was no difference in the
minimum air content required for satisfactory performance in ASTM C 666 or a significant
impact on the spacing factors for mixtures with a w/cm of 0.45 or 0.41. Since w/cm has been
shown to impact both the tensile strength and porosity of concrete, it would be expected that as
w/cm decreases, an air void system of lower quality may be acceptable for frost durability. This
phenomenon may be observable if more mixtures with air contents between 2.5% and 3.5% are
investigated, or perhaps lower w/cms are needed.
PRACTICAL IMPLICATIONS
Current measuring techniques do not allow for the size or spacing of the air voids to be
measured; instead, it is common to specify the total volume of air in the concrete. Current
recommendations for air content as outlined in ACI 318 are based on work done by Klieger
(1952 and 1956) with assumptions for paste contents. As discussed previously, the mixtures
investigated by Klieger are quite different than modern mixtures. The most notable difference is
that only a Vinsol resin AEA was used with no other admixtures. Work in this paper suggests
that for the three AEAs investigated (synthetic, wood rosin, and Vinsol resin) all showed
satisfactory performance in ASTM C 666 at the same minimum air contents (3.5% by volume in
the concrete or 11% in the paste). This supports the use of a single air volume specification for
modern AEAs.
However, these recommendations do not hold for mixtures that contain high dosages of
lignosulfonates. For the mixtures and materials investigated, it is recommended that a minimum
air content of 4.5% is required in the concrete or 14% in the paste to produce concrete that
should adequately perform in ASTM C 666. For use in a specification, a safety factor should be
used to account for air lost in transit, placement, finishing, and material variability. With the
current recommendations in ACI 318 for 3/4 in. maximum nominal size aggregate and a 1% air
content reduction for strengths above 5,000 psi, this would provide an 11% overdesign, or a
safety factor of 1.11. While these findings were satisfactory for the mixtures and materials
investigated, they have been found to be too liberal for other combinations of AEA and
admixtures or different mixing procedures. Publications are in preparation. This highlights the
need to more clearly define the interaction of admixtures and their impact on frost durability.
For the mixtures investigated, a spacing factor of 0.008 in. was necessary and is suggested to be
required for a mixture to obtain frost durability. This finding matches suggestions in ACI 201
and is more rigorous than the CSA guidelines. While void volume is currently easier to measure
in fresh concrete, the spacing factor measurement was able to predict frost durability. Even
though mixtures without lignosulfonate were shown to be frost durable with spacing factors up to
0.010 in., it is challenging to monitor what admixtures will be used in a concrete mixture.

19
Because of this, it is recommended to require a spacing factor of 0.008 in. if the concrete would
be expected to pass the ASTM C 666 test.
It is widely accepted that the environments and freezing rates of the ASTM C 666 test are more
aggressive than field exposure of concrete (Pigeon and Pleau 1995). However, the ASTM C 666
test is the most widely specified test method to evaluate the bulk frost durability of a concrete
mixture. Satisfactory performance in ASTM C 666 should lead to satisfactory performance in
almost all field applications.
CONCLUSIONS
Concrete mixtures were prepared with different modern AEAs with and without lignosulfonate
WRs at different air contents. Hardened air void analysis and freezing and thawing tests as per
ASTM C 666 were used to investigate their performance. Based on the data presented, the
following have been found:
A minimum air content of 3.5% in the concrete and 11.0% in the paste should yield
concrete durable in the ASTM C 666 with modern AEAs and low (3.7oz/cwt) or no
lignosulfonate WRs. This minimum air content was the same for a synthetic, wood
rosin, and Vinsol resin AEA.
Limited data suggests that mixtures with a higher dosage of lignosulfonate will need
about 1% more air in the concrete or 3% more air in the paste for the materials and
procedures used.
Despite similar air void volume and better spacing factors, there were differences in
performance in ASTM C 666 for mixtures with a high dosage (10.2 oz/cwt) of
lignosulfonate and those without. This suggests that there are other critical parameters
besides air void volume and spacing that govern performance in ASTM C 666.
A spacing factor of 0.008 in. was found to be necessary to provide frost durability for
the mixtures investigated.
There was no noticeable difference in performance in ASTM C 666 or changes in the
quality of the air void system as measured by ASTM C 457 for mixtures with a w/cm
of 0.45 or 0.41 with the AEAs investigated.
While the methods and materials were limited, several useful and very practical observations
were made that address the volume and spacing factor required for modern AEAs. Furthermore,
this work provides great insight for several unknowns in the literature. Findings also highlight a
need for greater understanding of the interactions between AEAs and other admixtures on
performance in freezing and thawing environments.


21
REFERENCES
Carlson, J., Sutter, L., Peterson, K., Van Dam, T. “An update on application of a flat-bed scanner
for performing ASTM C 457,” Proceedings of the 27th International Conference on
Cement Microscopy, Victoria, British Columbia, Canada, 2005.
Gay, F. T., “A Factor Which May Affect Differences in the Determined Air Content of Plastic
and Hardened Air-Entrained Concrete,” Proceedings of the Fourth International
Conference on Cement Microscopy, Las Vegas, Int. Cem. Microscopy Assoc., 286-292,
1982.
Gay, F.T., “The Effect of Mix Temperature on Air Content and Spacing Factors of Hardened
Concrete Mixes with Standardized Additions of Air-Entraining Agent,” Proceedings,
Seventh International Conference on Cement Microscopy, Fort Worth, International
Cement Microscopy Assoc., Duncanville, TX, pp. 305-315, 1985.
Jakobsen, U. H., Pade, C., Thaulow, N., Brown, D., Sahu, S., Magnusson, O., De Buck, S., and
De Schutter, G., “Automated air void analysis of hardened concrete - a round robin
study,” Cement and Concrete Research, Vol. 36, pp. 1444-1452, 2006.
Jana, D., Erlin, B., Pistilli, M., “A Closer Look at Entrained Air in Concrete,” Concrete
International, V27, 07, July 2005.
Klieger, P., “Effect of Entrained Air on Strength and Durability of Concrete Made with Various
Maximum Sizes of Aggregate,” Proceedings, Highway Research Board, Vol. 31, 1952,
pp. 177-201;Bulletin No. 40, Research and Development Laboratory, Portland Cement
Association, Skokie, IL.
Klieger, P., “Further Studies on the Effect of Entrained Air on Strength and Durability of
Concrete with Various Sizes of Aggregate,” Proceedings, Highway Research Board,
1956, pp. 16-17; Bulletin No. 77, Research and Development Laboratory, Portland
Cement Association, Skokie, IL.
Ley, M. T., “The Effects of Fly Ash on the Ability to Entrain and Stabilize Air in Concrete,”
Dissertation, University of Texas at Austin, August 2007a.
Ley, M. T., Folliard, K. J., Hover, K.C., “Observations of Air-Bubbles Escaped from Fresh
Cement Paste,” Cement Concrete Research, doi:10.1016/j.cemconres.2009.01.019,
2009a.
Ley, M. T, Chancey, R., Juenger, M., and Folliard, K. J., “The Physical and Chemical
Characteristics of the Shell of Air-Entrained Bubbles in Cement Paste,” Cement Concrete
Research, doi:10.1016/j.cemconres.2009.01.018, 2009b.
Peterson, K., Sutter, L. and Radlinski, M., ‘‘The Practical Application of a Flatbed Scanner for
Air-Void Characterization of Hardened Concrete,’’ J. ASTM Intl.,Vol. 6, No. 9.
doi:10.1520/JAI102446.
Peterson, K. W., Thaulow, N., Baumgart, C. W., Furuichi, H., and Jana, D., “A Round Robin
Test on Measurements of Air Void Parameters in Hardened Concrete by Various
Automated Image Analyses and ASTM C 457 Methods,” Proceedings of the twenty-ninth
conference on cement microscopy, Quebec City, PQ, Canada, 2007.
Pigeon, M., and Pleau, R., “Durability of Concrete in Cold Climates,” London; New York: E &
FN Spon, 1995.
Plante, P., Pigeon, M., and Saucier, F. (1989). “Air-Void Stability, Part ii: Influence of
Superplasticizers and Cement,” ACI Materials Journal, 581-589.

22
Powers, T. C., with discussion by Willis, T. F., “The Air Requirement of Frost Resistant
Concrete,” Proceedings, Highway Research Board, vol. 29, 1949, pp. 184–211; Bulletin
No. 33, Research and Developments Laboratories of the Portland Cement Association.
Powers, T. C., “Void Spacing as a Basis for Producing Air-Entrained Concrete,” ACI Journal,
Proc. V. 50, (1954) 741-760.
Powers, T. C., “Void Spacing as a Basis for Producing Air-Entrained Concrete,” ACI Journal,
Part 2, Proc. V. 50 (1954) 760-6-760-15.
Ramezanianpour, A. M., and Hooton, R. D. (2010). “Evaluation of Two Automated Methods for
Air-Void Analysis of Hardened Concrete. Journal of ASTM International, 7(2),
http://www.astm.org/DIGITAL_LIBRARY/JOURNALS/JAI/PAGES/JAI102476.htm.
Rashed, A. I., Williamson, R.B., “Microstructure of Entrained Air Voids in Concrete: Part I,” J.
Mater. Res. 6 (9) (1991a) pp. 2004-2012.
Rashed, A. I., Williamson, R. B., “Microstructure of Entrained Air Voids in Concrete: Part II,” J.
Mater. Res. 6 (11) (1991b) pp. 2474-2483.
Scherer, G. W., and Valenza II, J. J., “Mechanisms of Frost Damage,” pp. 209-246 in Materials
Science of Concrete, Vol. VII, eds. J. Skalny and F. Young (American Ceramic Society,
2005).
Standards and Specifications
American Concrete Institute (ACI) (2008). “Guide to Durable Concrete.” ACI Manual of
Concrete Practice—Part 1.ACI 201.2R-08. American Concrete Institute, Farmington
Hills, MI. ASTM C 33-03, “Standard Specification for Concrete Aggregates,” American Society for
Testing and Materials, West Conshohocken, Pennsylvania.
ASTM C 138, “Standard Test Method for Unit Weight, Yield, and Air Content (Gravimetric) of
Concrete,” American Society for Testing and Materials, West Conshohocken,
Pennsylvania.
ASTM C 143/C 143M-03, “Standard Test Method for Slump of Hydraulic Cement Concrete,”
American Society for Testing and Materials, West Conshohocken, Pennsylvania.
ASTM C 150, “Standard Specification for Portland Cement, American Society for Testing and
Materials,” West Conshohocken, Pennsylvania.
ASTM C 231-04, “Standard Test Method for Air Content of Freshly Mixed Concrete by the
Pressure Method,” American Society for Testing and Materials, West Conshohocken,
Pennsylvania.
ASTM C 494-05, “Standard Specification for Chemical Admixtures for Concrete,” American
Society for Testing and Materials, West Conshohocken, Pennsylvania.
ASTM C 666-03, “Standard Test Method for Resistance of Concrete to Rapid Freezing and
Thawing,” American Society for Testing and Materials, West Conshohocken,
Pennsylvania.
ASTM C 1017-07, “Standard Specification for Chemical Admixtures for Use in Producing
Flowing Concrete,” American Society for Testing and Materials, West Conshohocken,
Pennsylvania.
CSA A23.2-09 “Test Methods and Standard Practices for Concrete,” Canadian Standards
Association, Toronto, Canada. 2009. European Standard, EN 480-11, “Admixtures for Concrete, Mortar and Grout – Test Methods –
Part 11: Determination of Air Void Characteristics in Hardened Concrete.”