computation of water-surface profiles in open channels · pdf filel computation of...
TRANSCRIPT
Techniques of Water-Resources Investigations of the United States Geological Survey
Chapter Al5
l COMPUTATION OF WATER-SURFACE PROFILES IN OPEN CHANNELS
By Jacob Davidian
Book 3 APPLICATIONS OF HYDRAULICS
12 TECHNIQUES OF WATER-RESOURCES INVESTIGATIONS
stances should a computation be accepted if there is reason to suspect the existence of a distinct hydraulic jump, as in figures 11A and llB, where Froude number would be about 1.5 or 1.7, and higher. A solution forced through a transition depicted in figure llC, where the Froude number is less than 1.5 and where only one or two cross sections are involved might, after close examination, prove to be acceptable.
Alternate depths
Once the water-surface profile has been computed in a reach involving a control section, a steep slope, and a hydraulic jump, such as the profiles in figure 11, it is pertinent to investi- gate other possible water-surface profiles in the same reach for the same discharge. Each supercritical-flow condition has an alternate subcritical depth at which the same discharge can flow. A tree or any other large object could lodge in the channel and trigger subcritical flow, or the location of the hydraulic jump could be shifted upstream. The result, in terms of figure 11, could be the elimination or drown- ingout of the critical or supercritical elevations through the steep-slope middle subreach. Those profiles could be superseded by a completely subcr’itical transition between the M2 curve on the upstream mild slope to the normal-depth line on the downstream mild slope, somewhat akin to the transition curve shown in figure 5.
The approach and getaway depths associated with hydraulic jumps are called conjugate depths. The depth after the jump is called the sequent depth. Determination of these depths requires analysis of the hydrostatic pressure and the momentum of the flow at cross sections before and after the jump. Such analyses, involving study of specific force diagrams, are explained thoroughly in hydraulics texts such as Chow (1959) and Woodward and Posey (1941).
The use of the specific energy curve rather than specific force offers a simpler approach that sacrifices little in accuracy as far as com- putation of water-surface profiles by the step- backwater method is concerned. It is rela- tively easy to develop and apply the specific energy curve. The method is described below and shown in figure 13. When this method is
used, the depth before and after the hydraulic jump are called alternate depths.
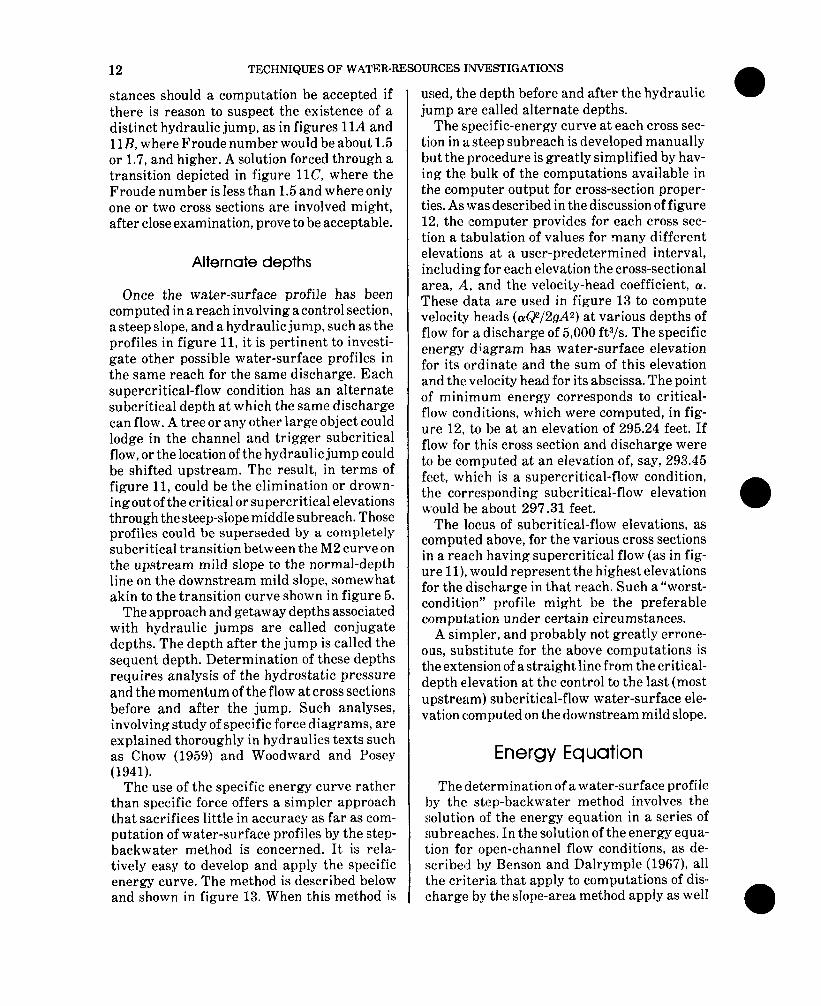
The specific-energy curve at each cross sec- tion in a steep subreach is developed manually but the procedure is greatly simplified by hav- ing the bulk of the computations available in the computer output for cross-section proper- ties. As was described in the discussion of figure 12, the computer provides for each cross sec- tion a tabulation of values for many different elevations at a user-predetermined interval, including for each elevation the cross-sectional area, A, and the velocity-head coefficient, 0~. These data are used in figure 13 to compute velocity heads ((u@/2gA2) at various depths of flow for a discharge of 5,000 ft3/s. The specific energy diagram has water-surface elevation for its ordinate and the sum of this elevation and thevelocity head for its abscissa. The point of minimum energy corresponds to critical- flow condit.ions, which were computed, in fig- ure 12, to be at an elevation of 295.24 feet. If flow for this cross section and discharge were to be computed at an elevation of, say, 293.45 feet, which is a supercritical-flow condition, the corresponding subcritical-flow elevation would be about 297.31 feet.
The locus of subcritical-flow elevations, as comput,ed above, for the various cross sections in a reach having supercritical flow (as in fig- ure II), would represent the highest elevations for the discharge in that reach. Such a “worst- condition” profile might be the preferable computation under certain circumstances.
A simpler, and probably not greatly errone- ous, substitute for the above computations is the extension of a straight line from the critical- depth elevation at the control to the last (most upstream) subcritical-flow water-surface ele- vation computed on the downstream mild slope.
Energy Equation
The Idetermination of a water-surface profile by the step-backwater method involves the solution of the energy equation in a series of subreaches. In the solution of the energy equa- tion for open-channel flow conditions, as de- scribed by Benson and Dalrymple (1967), all the criteria that apply to computations of dis- charge by the slope-area method apply as well
COMPUTATION OF WATER-SURFACE PROFILES IN OPEN CHANNELS
COMPUTATION OF ENERGY FOR A KNOWN DISCHARGE m=5000ft3/s)
13
Water-surface elevation, in feet
Area, in square feet Alpha a
2gA2 Elevation +a
2gA2 -- 292.0 226 1.42 10.81 302.81 293.0 293 1.49 6.75 299.75 294.0 363 1.57 4.63 298.63 295.0 435 1.59 3.27 298.27 296.0 511 1.63 2.43 298.43 297.0 590 1.68 1.88 298.88 298.0 673 1.84 1.58 299.58
Subcritical --------_-
Critical -------- depth
-
Super-
~
293.45 - - CrKaT -
---- ----
EXAMPLE: For a discharge of 5OOOfWs in this chan- nel, flow could either be supercritical (water-sur- face elevation=293.45 ft), or subcritical (water- surface elevation=297.31 ft)
291 I I II I I I 1 I J 296 297 298 299 300 301 302 303 304
ELEVATION +aQ2/2gA2, IN FEET
Figure 13.-Determination of alternate depths from energy diagrams for a given cross section.
to the step-backwater method. Among these criteria and assumptions are the following, which refer to each subreach of a step-back- water reach:
1. The flow must be steady. 2. The flow at both end cross sections of the
subreach, as well as through it, must be either all supercritical (F > 1.0) or all subcritical (F < 1.0). A change in the type of flow within a subreach negates the solution. An end cross section may be at critical flow (a control point, where F = 1.0) or it may be at a break in water surface, such as a hydraulic jump.
3. The slope must be small enough so that normal depths can be considered to be vertical depths.
4. The water surface across a cross section is level.
5. The effects of sediment and air-entrain- ment are negligible.
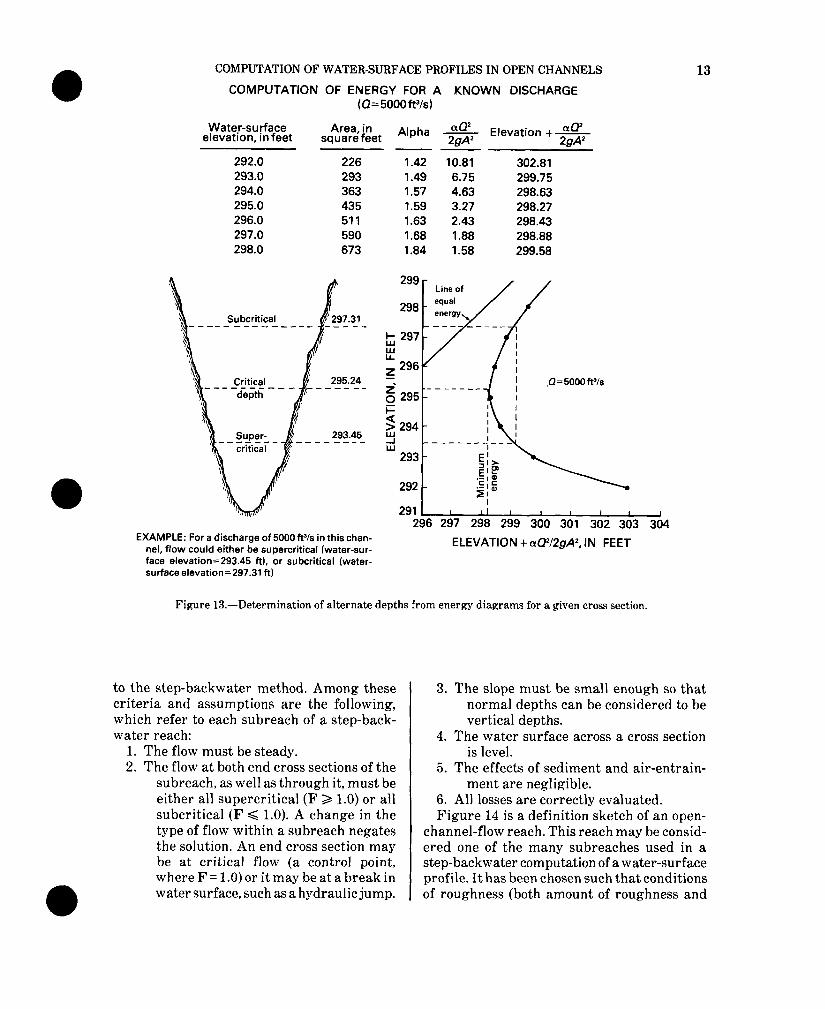
6. All losses are correctly evaluated. Figure 14 is a definition sketch of an open-
channel-flow reach. This reach may be consid- ered one of the many subreaches used in a step-backwater computation of a water-surface profile. It has been chosen such that conditions of roughness (both amount of roughness and
14 TECHNIQUES OF WATER-RESOURCES IlWE!3TIGATIONS
I I
c- Section 1
I I
--Y
-- Section 2 -I
--i PLAN VIE\N
-1 --- -r&l&
-- hf+klAh,l
h2
~--.----L----J PROFILE VIEW
Figure 14.-Definition sketch of an open-channel flow reach.
the distribution of roughness) and channel geometry (area, hydraulic radius, and depth) all are as nearly constant as possible through- out the subreach. The uniformity of flow is measured by the degree to which the water- surface profile and the energy gradient are parallel to the streambed. The energy equation for this reach is:
where h = elevation of the water surface at
the respective sections above a common datum,
h, = velocity head at the respective section = cuTn/2g,
hf = energy loss due to boundary friction in the reach,
Ah” = upstream velocity head minus the downstream velocity head,
k(.bh,)= energy loss due to acceleration or deceleration in a contracting or expanding reach, and
k = a coefficient, 0.5 for expanding reaches, and zero for contract- ing reaches.
The friction loss in the subreach is defined as
&WWG&,
COMPUTATION OF WATER-SURFACE PROFILE23 IN OPEN CHANNELS 15
where Ah is the difference in water-surface elevation at the two sections, L is the flow dis- tance through the subreach, Q is the total dis- charge, and K is the conveyance at the cross section. The mean conveyance through the sub- reach is computed as the geometric mean of the conveyance at the end sections. This proce- dure is based on the assumption that the con- veyance varies uniformly through the reach.
The velocity head (h,) at each section is com- puted as
h,=a-2If , II
where Vis the mean velocity in the section and (Y is the velocity-head coefficient. The value of IX is assumed to be 1.0 if the section is not subdi- vided. The value of 01 in subdivided channels is computed as
where the subscript i refers to the conveyance or area of the individual subsections and sub- script T refers to the area or conveyance of the entire cross section.
The energy loss, h,, due to contraction or expansion of the channel in the reach is assumed to be equal to the difference in velocity heads at the two sections (Ah,) multiplied by a coeffi- cient k. The value of k is taken to be zero for contracting reaches and 0.5 for expanding reaches. Coefficient k may also be defined as follows.
If [a~ - (Y~ (AI/A,)~] is > 0, k=O; if < 0, k=0.5. Both the procedure and the coefficient are questionable for expanding reaches, however. Major expansions therefore should be avoided, if possible, in selecting locations of cross sec- tions in a step-backwater reach. Where expan- sions are unavoidable, more frequently placed cross sections will tend to minimize the rela- tive degree of expansion between them and leave the individual subreaches more nearly uniform within themselves.
The value of Ah, is computed as the differ- ence between upstream and the downstream velocitv head: thus. the friction loss term is a computed algebraically as
hf=Ah+(AhJ2) (when Ah, is positive),
and
hf=Ah+Ah, (when Ah, is negative).
The effect of (Y on coefficient k and the fric- tion loss term should be noted. A geometrically contracting reach would have a larger velocity at the downstream end, and Ah, would be ex- pected to be negative. If the distributions of conveyance at each cross section are such, how- ever, that (~1 is larger than (~2, then the term Ah, may become positive and affect the value of h,. The opposite change may occur if (~2 is larger than CY~.
The role and importance of (Y is described in more detail in a subsequent section entitled “Velocity-Head Coefficient, (Y.”
Standard step method
Subcritical flows
The individual steps in the solution of the energy equation for tranquil flow by the step- backwater method are listed below. Reference is made to figure 14.
1. A discharge, for which the water-surface profile is to be determined, is chosen.
2. All necessary channel geometry and roughness information in the lateral, longitudinal, and vertical directions is obtained. Subdivisions are chosen and subreach lengths are computed.
3. The water-surface elevation, h2, at the downstream end is chosen.
4. For the value of hz chosen in step 3, the corresponding area, conveyance, velo- city head, and (Y values are computed for the downstream section.
5. A water-surface elevation, hl, is assumed for the upstream cross section.
6. For the value of hl chosen in step 5, the corresponding area, conveyance, velo- city head, and [Y values are computed for the upstream cross section.
7. The friction loss between sections 1 and 2 is computed, (h&=L@/KlK2.
8. The coefficient k is determined; k is 0.5 if Ah, is positive, and zero if Ah, is negative.
16 TECHNIQUES OF WATER.-RESOURCES INVESTIGATIONS
9. The energy equation is solved. If the equation is acceptably balanced, the next operation is step 12.
10. If the energy equation is not balanced within an acceptable predetermined tolerance, a new value of hi is chosen for the upstream water-surface eleva- tion.
11. Steps 5 through 10 are repeated until the energy equation is satisfactorily balanced.
12. The solution moves one step, or sub- reach, farther upstream. The value of h! at the upstream end of the first sub- reach is now equivalent to the value of h2 at the downstream end of the new subreach. This operation is equivalent to step 3, above.
13. Steps 4-12 are repeated subreach by subreach until the water-surface pro- file throughout the entire reach has been computed.
If the first value of hz in step 3 for the most downstream cross section is above the normal- depth line, the profile computed will follow an Ml curve; if h2 is started originally at an eleva- tion below normal depth, the computed profile will follow an M2 curve. To determine the normal-depth line in a channel, the procedure is to choose two or more starting values of 1h at the most downstream cross section, and, for the same discharge, compute the resultant profiles until these profiles all converge farther upstream, and thereafter give identical values of water-surface elevation at succeeding cross sections. Limitations to this method of deter- mining convergence are discussed in the sec- tion entitled “Convergence of Backwater Curves.”
Because of the trial-and-error nature of the solution of the energy equation, manually deter- mining water-surface profiles is extremely tedious. Computer programs for the determi- nation of water-surface profiles by the step- backwater method are available for subcritical- flow conditions (Shearman, 1976).
Supercritical flows
For supercritical-flow conditions, the stand- ard step method of computing water-surface profiles, as described above for subcritical
applied similarly, but in a down- stream dire&ion. With reference to figure 14, the first step is to choose the upstream eleva- tioln, hl, and then to balance the energy equa- tioln by choosing an appropriate value of h2 for the downstream cross section. The solution progresses subreach by subreach in the direc- tion of the flow until the water-surface profile is determined throughout the entire length of reach in which the flow is supercritical. It is advantageous to choose the upstream elevation of the first subreach at critical depth, because generally, supercritical-flow computations would begin at a control point in natural chan- nels.
Much of the tediousness of a manual compu- tation olf a supercritical-flow water-surface profile is alleviated by partial use of an elec- tronic computer. Computer programs for sub- critical flow provide, as part of their output, ta.bles of cross-section properties at numerous elevations for all cross sections.in a reach. For each of the elevations, values of cross-sectional area, conveyance, velocity-head coefficient (QL), tolp width, stations at left and right edges of water, and wetted perimeter are given. If a sufficiently small elevation increment is speci- fied, it is a relatively easy matter to prepare plots or to interpolate directly from these com- puter tables, so that the appropriate values of area, colnveyance, and LY can be quickly deter- mined for any elevation. The trial-and-error procedure of balancing the energy equation is thus considerably simplified. Supercritical- flow conditions usually exist for only a few subreaches; therefore, the manual procedure described above should be used from a control point to a cross section downstream from it, at which a subcritical-flow profile solution has indicated the possibility of a hydraulic jump.
Field Data
All of the channel-geometry considerations that go into the selection of sites for slope-area a.nd n-verification measurements apply as well for each subreach of a step-backwater reach. Some of these are discussed in the following paragraphs, together with the special require- rnents Iof the step-backwater method.
COMPUTATION OF WATER-SURFACE PROFILES IN OPEN CHANNELS
A stadia survey Ol- equivalent stream channel is required for each study site. The surveys are run using the same basic techniques described by Benson and Dalrym- ple (1967) for indirect discharge measure- ments. A common datum must be established by levels throughout the length of the reach. Gage datum should be used in the vicinity of gaging stations.
Maps and ground elevations from photo- grammetric methods or from topographic maps with contours at close intervals are prac- tical alternatives to field surveys. Horizontal and vertical control points throughout the reach must be established.
Total reach length
Limiting total length of reach to be surveyed to the shortest useful distance is important in keeping costs of field surveys or photogram- metry reasonable. The length of reach needed to ensure convergence of computed backwater curves depends on the slope, the roughness, and the mean depth for the largest discharge for which the normal-depth profile is desired. Because the length depends on the depth, and the depth itself is the unknown which must ultimately be determined, the total reach length must be computed by estimating the normal depth.
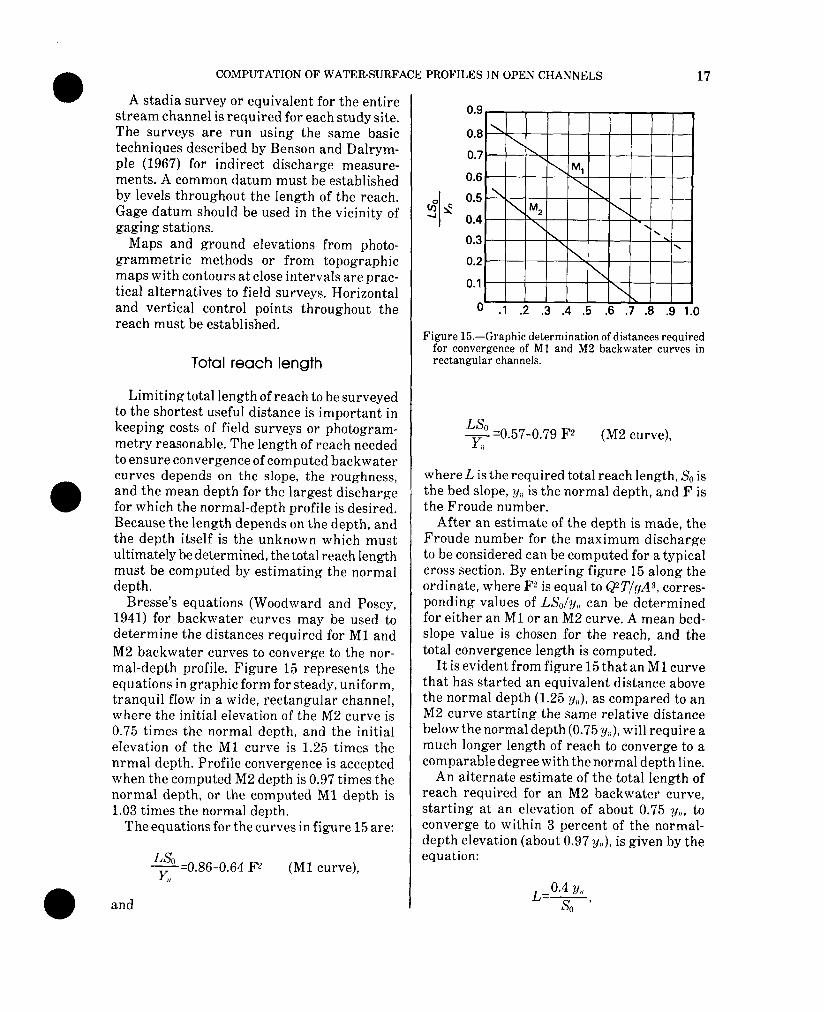
Bresse’s equations (Woodward and Posey, 1941) for backwater curves may be used to determine the distances required for Ml and M2 backwater curves to converge to the nor- mal-depth profile. Figure 15 represents the equations in graphic form for steady, uniform, tranquil flow in a wide, rectangular channel, where the initial elevation of the M2 curve is 0.75 times the normal depth, and the initial elevation of the Ml curve is 1.25 times the nrmal depth. Profile convergence is accepted when the computed M2 depth is 0.97 times the normal depth, or the computed Ml depth is 1.03 times the normal depth.
The equations for the curves in figure 15 are:
L& y=O.86-0.64 F2 (M ,I
and
.I curve),
0.8
0.6
0 .I .2 .3 .4 .5 .6 .7 .8 .9 1.0
Figure 15.-Graphic determination of distances required for convergence of Ml and M2 backwater curves in rectangular channels.
L&l y- =0.57-0.79 F2 (M2 curve), ,I
where L is the required total reach length, So is the bed slope, yl, is the normal depth, and F is the Froude number.
After an estimate of the depth is made, the Froude number for the maximum discharge to be considered can be computed for a typical cross section. By entering figure 15 along the ordinate, where F2 is equal to @T/gA3, corres- ponding values of L&/y,, can be determined for either an Ml or an M2 curve. A mean bed- slope value is chosen for the reach, and the total convergence length is computed.
It is evident from figure 15 that an Ml curve that has started an equivalent distance above the normal depth (1.25 y,!), as compared to an M2 curve starting the same relative distance below the normal depth (0.75 y),), will require a much longer length of reach to converge to a comparable degree with the normal depth line.
An alternate estimate of the total length of reach required for an M2 backwater curve, starting at an elevation of about 0.75 y,,, to converge to within 3 percent of the normal- depth elevation (about 0.97 y,,), is given by the equation:
L,O.4 YH s,’
18 TECHNIQUES OF WATER-RESOU:RCES INVESTIGATIONS
where L, y,!, and So are defined as for figure 15. This equation is equivalent to a value of F2 of about 0.2 on the M2 curve of figure 15, or a value of F of about 0.45, which is representative of most natural flows.
Because channel roughness has a minor effect on the rate of convergence of computed backwater curves, n is neglected in these approximations of total length.
Locations of cross sections
In natural stream channels, cross sections are placed at intervals which will divide a total reach into a series of subreaches each of which is as uniform in geometry and roughness as practical. Dividing a reach is a relatively easy matter in slope-area and n-verification studies, where reaches are chosen for their conformity to ideal conditions. In profile computations through long stretches of a river, one must work with conditions as they are. Frequently they are far from ideal. Fairly uniform chan- nels will require fewer cross sections than those having many irregularities in size, shape, slope, or roughness. The cross sections should be representative of the reach between them and should have nearly the same characteris- tics. They should be located to enable proper evaluation of energy losses. With reference to figure 14, cross sections should be located at such intervals that the energy gradient, the water-surface slope, and the streambed slope are all as nearly parallel to each other as possi- ble and as close to being straight lines as possi- ble. If any channel feature causes one of these three profiles to curve, break, or run unparallel to the others locally, this is a clear indication that that particular subreach should be further subdivided. If cross sections are located accord- ing to the general criteria listed below, reason- able evaluations of energy losses can be made. Many of the criteria apply equally as well to slope-area and n-verification reaches. Cross sections:
1. Should be located at all major breaks in bed profile. If old flood profiles are available, cross sections should also be placed at major breaks in the known water-surface profile.
2. Should be placed at points of minimum and maximum cross-sectional areas.
3. Should be placed at shorter intervals in expanding reaches and in bends to minimize errors, because areas with upstream flow, dead water, or flow at an angle cannot be evaluated quantita- tively. To represent flow by the relation Q=K.W, it is necessary for the distri- bution of discharge across any section to be similar to the distribution of con- veyance in that cross section. In the computations, it is further assumed that all flow is downstream and per- pendicular to the cross sections. These assumptions are violated at expansions, embayments, and bends, where eddies or dead water may exist.
4. Should be placed at shorter intervals in reaches where the conveyance changes greatly as a result of changes in width, depth, or roughness. Because friction losses within subreaches are computed with a conveyance equal to the geo- metric mean of the end conveyances, the relation between upstream con- veyance, K,, and downstream convey- ance, K2, should satisfy the criterion: 0.7 < (KJK,) < 1.4. Conveyance, if it varies between cross sections, should do so at a uniform rate.
5. Should be located at points where rough- ness changes abruptly, for example, where the flood plain is heavily vege- tated or forested in one subreach, but has been cleared and cultivated by the land user at the adjacent subreach. In such an instance, the same cross sec- tion should be used twice, once as part of the rougher reach, and once again only a foot or two away, as part of the smoother reach. Because hsL@/KIK,, and L is extremely small, the effects of the error in h, are minimized. If flow from an upstream cross section with clear flood plains reaches a cross sec- tion where the overbanks are heavily vegetated, the condition is akin to a contracted opening. Similarly, if flow from an upstream cross section with heavily vegetated flood plains reaches a cross section where the flood plains
COMPUTATION OF WATER-SURFACE PROFILES IN OPEN CHANNELS 19
are clear and the roughness coefficient is relatively much smaller, the condi- tion is akin to expanding flow at the downstream end of a constriction. There are no adequate guidelines in these two situations for properly deter- mining friction losses, contraction losses, and expansion losses, nor for computing the water-surface profiles. The use of a cross section twice, in close proximity, and with different roughness values, must suffice for the present.
6. Should be placed between sections that change radically in shape, even if the two areas and the two conveyances are nearly the same. (Consider, for exam- ple, sections that change shape from just a main channel to a main channel with overbank flow, or from triangular to rectangular.)
7. Should be placed at shorter intervals in reaches where the lateral distribution of conveyance in a cross section changes radically from one end of the reach to the other, even though the total area, total conveyance, and cross-sectional shape do not change much. In general, the cross section having more subdivi- sions will have a larger (Y. A large value of (Y can have as much effect on the magnitude of a velocity head as can a change in cross-sectional area.
8. Should be placed at shorter intervals in streams of very low gradient which are significantly nonuniform, because the computations are very sensitive to the effects of local disturbances or irregularities. These effects can be reflected far upstream. Shorter sub- reaches may help to reduce these ef- fects. See the section entitled “Local Effects on Profiles.”
9. Should be located at and near control sections, and at shorter intervals im- mediately downstream from control sections, if supercritical-flow condi- tions exist.
10. Should be located at tributaries that contribute significantly to the main stem. The cross sections should be placed such that the tributary would
enter the main stem in the middle of a subreach.
11. Should be located at bridges in the same locations as required for computations of discharge at width constrictions(see Matthai, 1967):
(a) just downstream of the bridge, across the entire valley,
(b) at the downstream end of the bridge, within the constric- tion,
(c) at the approach cross section, one bridge-opening width upstream,
(d) if there is road overflow, along the higher of either the crown or curb, including the road approaches to the bridge, and the bridge deck.
It would seem, from a perusal of the list of suggested cross-section locations above, that the effects of almost all the undesirable features of nonuniform, natural stream channels can be lessened by taking more cross sections. This is true, but consideration must also be given to the time, cost, and effort to locate and survey additional cross sections. A balance must be set between the number of cross sections deemed desirable, and the number that is practical. These criteria for cross-section loca- tions serve, therefore, to call attention to the considerations behind the need for cross sec- tions, and. to help the engineer to understand anomalies in computed profiles if cross sec- tions are omitted. Practice will provide the engineer with the experience necessary to anticipate the circumstances that would per- mit relaxation of, or elimination of, some of these criteria, and the probable nature and magnitude of resultant errors.
Individual subreach lengths
In addition to the criteria for locations of cross sections, there are a few considerations as to reach lengths and number of subreaches which will influence the selection of cross sections:
1. The total reach length should be divided into at least lo-12 subreaches to be rea- sonably sure of convergence.
20 .-
TECHNIQUES OF WATER-RESOURCES INVESTIGATIONS >i
2. No subreach should be longer than about 75-100 times the mean depth for the largest discharge to be considered, or about twice the width of the subreach: This is a maximum limit, and applies only if other considerations for cross- section locations do not control.
3. The fall in a subreach should be equal to or greater than the larger of 0.50 foot, or the velocity head, unless bed slope is so flat as to require defaulting to the second criterion in this list.
4. The subreach length should be equal to or less than the downstream depth (for the smallest discharge to be considered) divided by the bed slope.
Profile computations for a range of dis- charges may require one set of subreach lengths for all discharges within banks and another set o:f subreach lengths for discharges with pver- bank flow. Extra cross sections may be neces- sary within the main channel for the lower discharges to satisfy some of the criteria listed in the section entitled “Locations of Cross Sections.”
Cross-section attributes
5. If the bed profile is a convex or concave curve, the reach should be broken up into shorter subreaches, because the losses within the reach might not be properly accounted for. In this method of computation, straight-line variation of bed elevations between end cross sec- tions is assumed.
Up to 200 points may be used to define the shape of each cross section in the U.S. Geologi- cal Survey’s computer solution (Shearman, 1976). Data for each point are a ground eleva- tion and a transverse station number (distance from a ref’erence point on the left bank) which increases in magnitude toward the right bank. At woss sections that start with negative sta- tion numbers, the stationing would be less negative toward the right bank. The ends of the cross section must be extended higher than the expected water-surface elevation of the largest flood that is to be considered in the subreach.
Weighted length of a subreach All cross sections must be perpendicular to
If water-surface profiles for several dis- charges are to be computed, the lengths be- tween any two cross sections may have to be computed differently for different discharges. Small discharges would stay entirely within banks and follow the meanders of the main channel. The length for the subreach would be a maximum. Large discharges may have flood- plain flows, and their effective flow distances would be shorter.
the flow direction throughout the entire width of the cross section. If the flow pattern warrants a broken, or dog-legged cross section, each subsection of the cross section should be per- pendicular to the direction of flow through that subsection. All subsections of a cross sec- tion should be straight lines.
For overbank flows, a weighted or effective subreach length must be used. The centroids of conveyance in the subsections of each cross section are determined and connected through the subreach by curvilinear or straight lines. One line will follow the main channel, and the others will be along the flood plains. The length of the main channel is multiplied by the con- veyance for the main channel, and the lengths along the flood plain are multiplied by the cor- responding overbank conveyances. The sum of these products is divided by the total convey- ance to obtain the weighted subreach length.
Cross sections should not cross each other within the live-flow boundaries of the channel, nor should they ever be drawn so as to share a common subsection on one end. There must be a measurable longitudinal distance between each subsection of one cross section, and a cor- responding subsection of the adjacent cross sections, upstream and downstream.
Cross sections at. bridges and at road-over- flows are described in detail in the section entitled “Bridges.”
Subdvisions of cross sections
Criteria for subdividing cross sections are the same as those described by Benson and Dalrymple (1967) for indirect measurements
COMPUTATION OF WATER-SURFACE PROFILES IN OPEN CHANNELS 21
of discharge. Subdivision should be done marily for major breaks in cross-sectional geometry. Besides these, major changes in roughness may call for additional subdivi- sions. The roughness coefficients verified by the Geological Survey (Barnes, 1967) are based on unit cross sections that have complete or nearly complete wetted perimeters. Basic shapes that are approximately rectangular, trapezoidal, semicircular, or triangular are unit sections having complete wetted perime- ters. Subdivisions for major breaks in geometry or for major changes in roughness should, therefore, maintain these approximate basic shapes so that the distribution of flow or con- veyance is nearly uniform in a subsection.
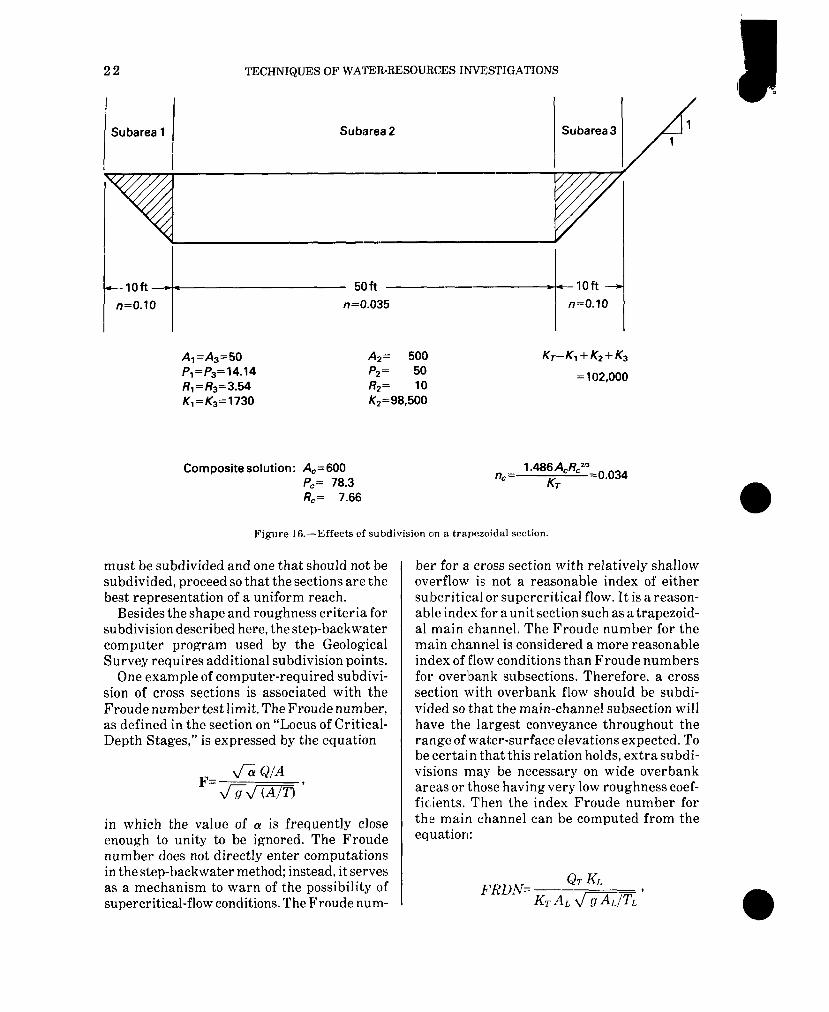
The importance of proper subdivision, as well as the effects of improper subdivision, can be illustrated very dramatically. In figure 16, a trapezoidal cross section having heavy brush and trees on the banks has been subdivided near the bottom of each bank because of the abrupt change of roughness there. A large percentage of the wetted perimeters(P) of the triangular subareas (AI and As) and possibly of the main channel (AZ) is eliminated. A smaller wetted perimeter abnormally increases the hydraulic radius (R=A/P), and this in turn results in a computed conveyance different from the conveyance determined for a section with a complete wetted perimeter. In figure 16, a conveyance (KT) has been computed for the cross section that would require a compo- site n value of 0.034. This is less than the ‘12 values of 0.035 and 0.10 that describe the roughness for the various parts of the basic trapezoidal shape. The basic shape should be left unsubdivided, and an effective value of n somewhat higher than 0.035 should be assigned to this cross section, to account for the addi- tional drag imposed by the larger roughness on the banks.
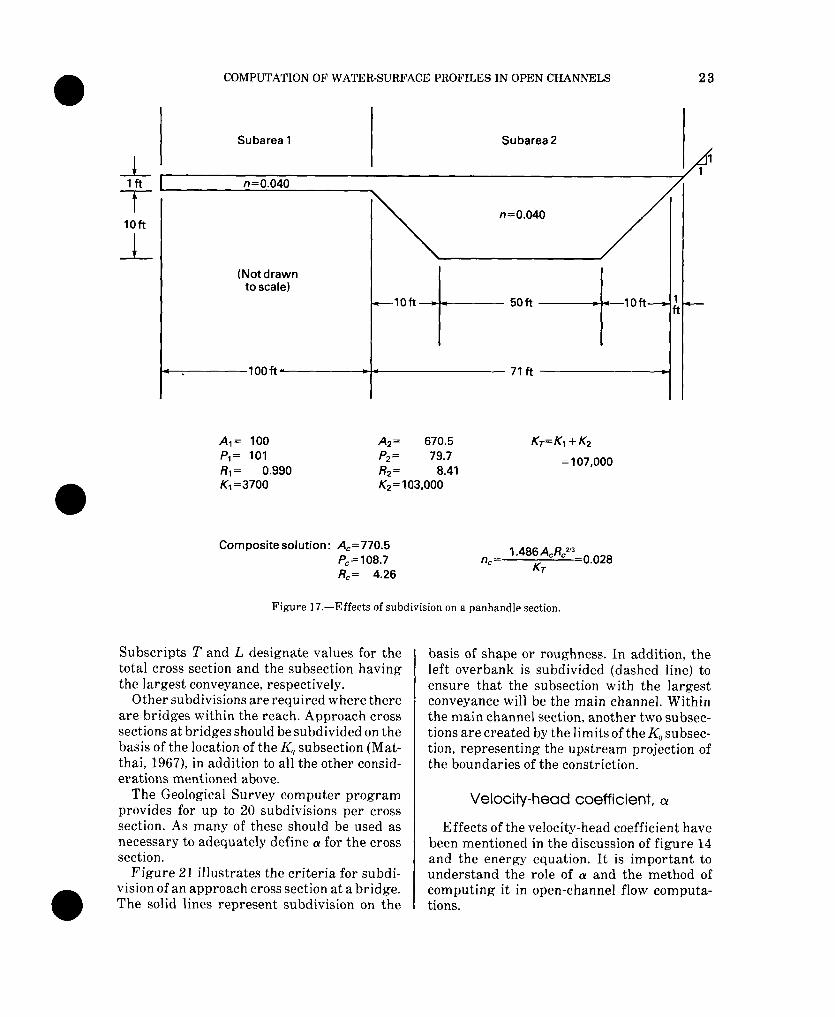
At the other extreme, the panhandle section in figure 17, having a main channel and an overflow plain, must be subdivided into two parts having nearly complete wetted perime- ters. The value of n is 0.040 throughout the section. If the section is not subdivided, the increase in wetted perimeter of the flood plain is relatively large with respect to the increase in area. The hydraulic radius is abnormally reduced, therefore, and a fictitious, lower value
of 0.028 for n is needed to obtain the conveyance equivalent to that of a unit section. It is clear that irregular cross sections such as that in figure 17 should be subdivided to create indi- vidual basic shapes.
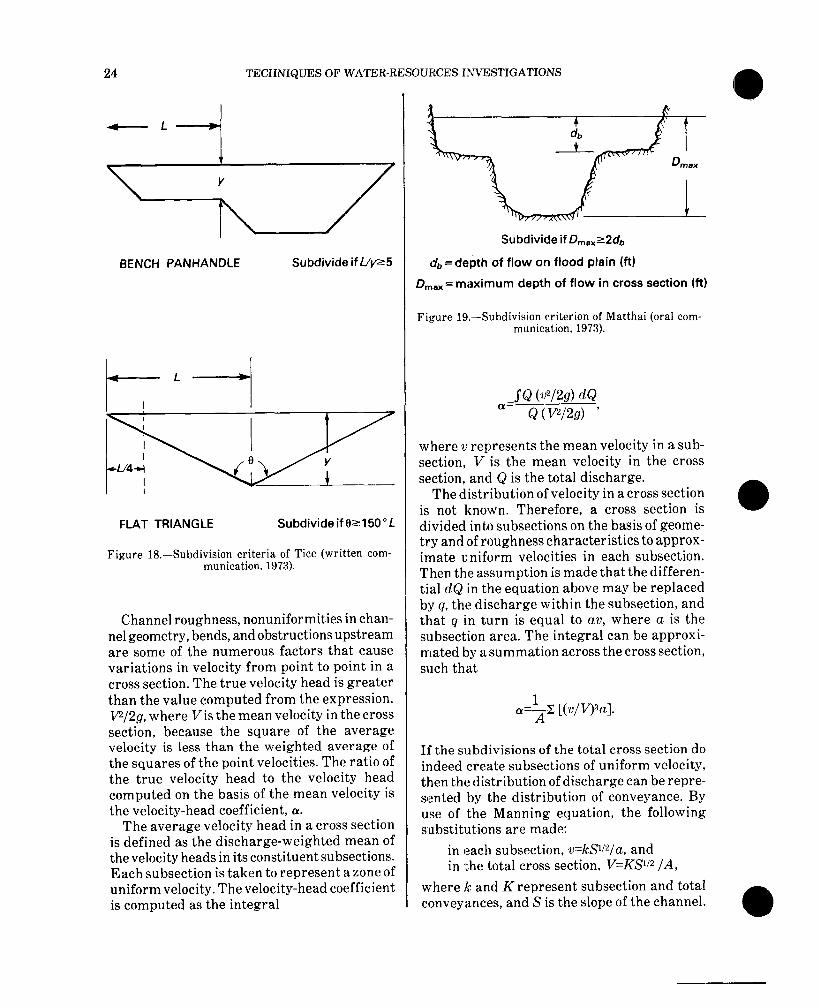
The cross section shapes in figures 16 and 17 represent two extremes of the problems asso- ciated with improper subdivision. Between these two are shapes with benches or terraces, as shown at the top of figure 18. R. H. Tice, 1973, “Subdivision and the Hydraulic Radius Term in Flood-Flow Formulas:“(written com- munication) has suggested criteria which are generally quite satisfactory for subdivision of bench panhandle shapes. He recommends sub- division if the value of the ratio L/y is 5 or greater (see figure 18). He also recommends subdivision of a large, flat triangular shape with a central angle of 150” or more, because L/y would be about 5 or greater. If the value of L/y is almost 5, he recommends that the subdi- vision be made at a distance of about L/4 from the edge of water. For L/y equal to 20 or greater, Tice recommends several subdivisions. For very large values of L/y, the cross-sectional slope would become flatter, the depth would become more uniform, and, consequently, the distribution of velocities would be more uni- form; no subdivisions would be required on the basis of shape alone, but subdivisions on the basis of roughness distribution would be permissible.
Another shape criterion for subdivision has been proposed by Matthai (oral communica- tion, 1973) and is shown in figure 19. If the main-channel depth is more than twice the depth at the stream edge of the overbank area, Matthai recommends subdivision.
Subdivision on the basis of geometry should be coordinated with the expected range in depths. For example, the cross section of fig- ure 20 should be subdivided differently for different stages, as shown in the figure.
There are borderline cases in which the decision to subdivide could go either way. Subdivisions in adjacent sections should be similar to avoid large differences in CL There- fore, if a borderline case is between sections that do not require subdivision, do not subdi- vide; if between sections that must be subdi- vided, subdivide the borderline case. Where the section in question is between one that
22 TECHNIQUES OF WATER-RESOURCES INVESTIGATIONS
Subarea 1 Subarea 2
-I_
A, =A3=50 AZ= 500 P,=P3=14.14 Pz= 50 R, = R3=3.54 Rz= 10 K,=K3=1730 K2=98,500
KT=K,+K2+K3
= 102,000
Compositesolution: A,=600 PC= 78.3 I?,= 7.66
” = ‘.-w”=o 034 c KT
Figure 16.-Effects of subdivision on a trapezoidal section.
must be subdivided and one that should not be subdivided, proceed so that the sections are the best representation of a uniform reach.
Besides the shape and roughness criteria for subdivision described here, the step-backwater computer program used by the Geological Survey requires additional subdivision points.
One example of computer-required subdivi- sion of cross sections is associated with the Froude number test limit. The Froude number, as defined in the section on “Locus of Critical- Depth Stages,” is expressed by the equation
6 Q/A *=l/zmm '
in which the value of LY is frequently close enough to unity to be ignored. The Froude number does not directly enter computations in the step-backwater method: instead, it serves as a mechanism to warn of the possibility of supercritical-flow conditions. The Froude num-
ber for a cross section with relatively shallow overflow is not a reasonable index of either subcritical or supercritical flow. It is a reason- able index for aunit section such as a trapezoid- al main (channel. The Froude number for the main channel is considered a more reasonable index of flow conditions than Froude numbers for over:bank subsections. Therefore, a cross section with overbank flow should be subdi- vided so that the main-channel subsection will have the largest conveyance throughout the range of water-surface elevations expected. To be certain that this relation holds, extra subdi- visions may be necessary on wide overbank areas or those having very low roughness coef- ficients. Then the index Froude number for th,e main channel can be computed from the equation:
E’RDN= Qr KL
K,A,m’
COMPUTATION OF WATER-SURFACE PROFILES IN OPEN CHANNELS 23
1 Ift I
t loft
1
Subarea 1
n=0.040
Subarea 2
(Not drawn to scale)
lOOft- L
A,= 100 AZ= 670.5 P,’ 101 Pz= 79.7 R,= 0.990 R2= 8.41 K,=3700 K2=103,000
KT= K, + K2
= 107,000
Compositesolution: A,=770.5 P,=108.7 R,= 4.26
n = 1.466MPz0 028 c
KT
Figure 17.-Effects of subdivision on a panhandle section.
Subscripts T and L designate values for the total cross section and the subsection having the largest conveyance, respectively.
Other subdivisions are required where there are bridges within the reach. Approach cross sections at bridges should be subdivided on the basis of the location of the K,, subsection (Mat- thai, 1967) in addition to all the other consid- erations mentioned above.
The Geological Survey computer program provides for up to 20 subdivisions per cross section. As many of these should be used as necessary to adequately define (Y for the cross section.
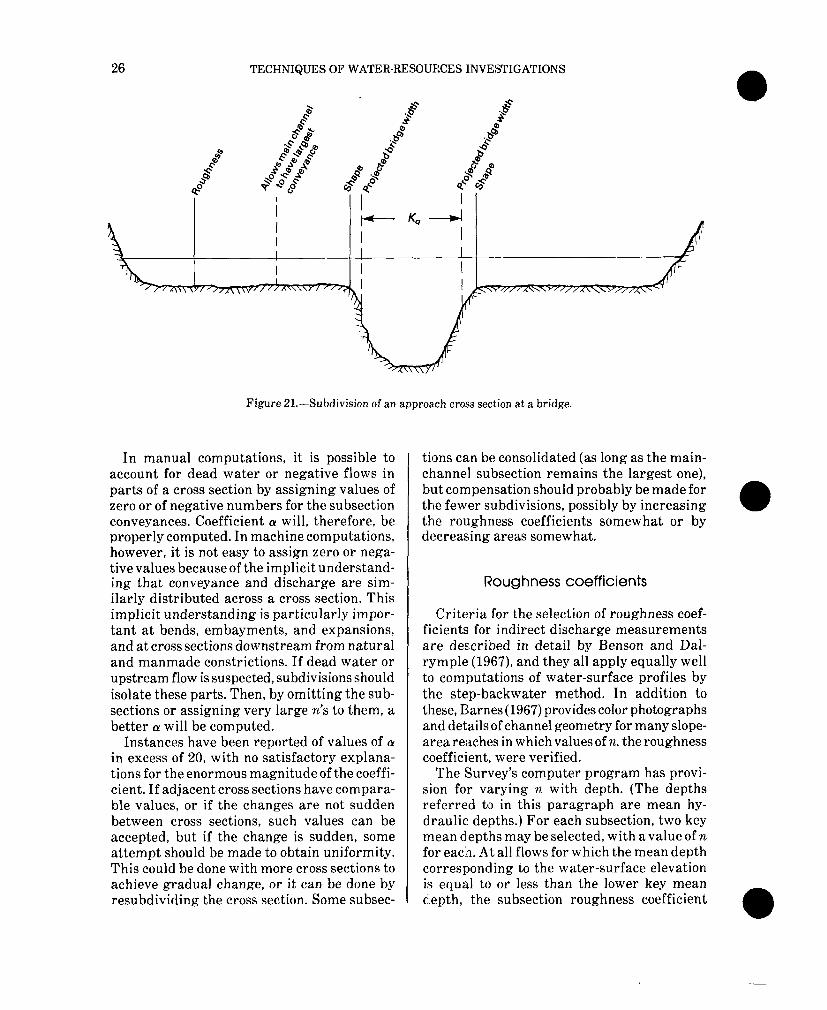
Figure 21 illustrates the criteria for subdi- vision of an approach cross section at a bridge. The solid lines represent subdivision on the
basis of shape or roughness. In addition, the left overbank is subdivided (dashed line) to ensure that the subsection with the largest conveyance will be the main channel. Within the main channel section, another two subsec- tions are created by the limits of the K,, subsec- tion, representing the upstream projection of the boundaries of the constriction.
Velocity-head coefficient, 01
Effects of the velocity-head coefficient have been mentioned in the discussion of figure 14 and the energy equation. It is important to understand the role of (Y and the method of computing it in open-channel flow computa- tions.
24 TECHNIQUES OF WATER-RESOURCES INVESTIGATIONS
BENCH PANHANDLE Subdivide if Uyr5
FLAT TRIANGLE Subdivideiftk150”L
Figure l&--Subdivision criteria of Tice (written com- munication, 1973).
Channel roughness, nonuniformities in chan- nel geometry, bends, and obstructions upstream are some of the numerous factors that cause variations in velocity from point to point in a cross section. The true velocity head is greater than the value computed from the expression, v2/2g, where Vis the mean velocity in the cross section, because the square of the average velocity is less than the weighted average of the squares of the point velocities. The ratio of the true velocity head to the velocity head computed on the basis of the mean velocity is the velocity-head coefficient, (Y.
The average velocity head in a cross section is defined as the discharge-weighted mean of thevelocity heads in its constituent subsections. Each subsection is taken to represent a zone of uniform velocity. The velocity-head coefficient is computed as the integral
Subdivide if Dmaxz2db
db = depth of flow on flood plain (ft)
D m,8X= maximum depth of flow in cross section (ft)
Figure 19.4ubdivision criterion of Matthai (oral com- munication, 1973).
azSQ (v2/2d dQ Q (W2.d '
where v represents the mean velocity in a sub- section, V is the mean velocity in the cross section, and Q is the total discharge.
The distribution of velocity in a cross section is not known. Therefore, a cross section is divided into subsections on the basis of geome- try and (of roughness characteristics to approx- innate uniform velocities in each subsection. Then the assumption is made that the differen- tial dQ in the equation above may be replaced by 4, the discharge within the subsection, and that 4 in turn is equal to av, where a is the subsection area. The integral can be approxi- mated by a summation across the cross section, such th,at
a=+ [(vlvyal. If the subdivisions of the total cross section do indeed create subsections of uniform velocity, then the distribution of discharge can be repre- sented by the distribution of conveyance. By use of the Manning equation, the following substitutions are made:
in each subsection, v=kW/a, and in the total cross section, V=KSI2 /A,
where k and K represent subsection and total conveyances, and S is the slope of the channel.

COMPUTATION OF WATER-SURFACE PROFILES IN OPEN CHANNELS 25
1C
C .,
8
7
ii f 6
z .
g E
P !Y 4 Lu
3
2
1
C
I-
i-
i-
I-
, _
1
‘,
I
10 20 30 40
STATION, IN FEET
Range of water-surface
Substation
elevation, in feet Station 20 Station 10 o-2 No - 2-4 Yes - 4-6 No -
6-8 No Yes 8-10 No No
Figure ZO.--Cross section in which subdivision could be dependent on expected elevations of water surface.
The latter is assumed to be identical in each subsection. The expression for the velocity-head coefficient thus reduces to the familiar form,
In general, the more subdivisions in a cross section, the larger (Y will become. Because of the effect (Y has in the velocity-head term, (~v2/29, the cross section should be subdivided, as needed, to validate as nearly as possible the assumptions mentioned.
26 TECHNIQUES OF WATER-RESOUFCCES INVESTIGATIONS
Figure 21.~Subdivision of an approa.ch cros:; section at a bridge.
In manual computations, it is possible to account for dead water or negative flows in parts of a cross section by assigning values of zero or of negative numbers for the subsection conveyances. Coefficient LY will, therefore, be properly computed. In machine computations, however, it is not easy to assign zero or nega- tive values because of the implicit understand- ing that conveyance and discharge are sim- ilarly distributed across a cross section. This implicit understanding is particularly impor- tant at bends, embayments, and expansions, and at cross sections downstream from natural and manmade constrictions. If dead water or upstream flow is suspected, subdivisions should isolate these parts. Then, by omitting the sub- sections or assigning very large n’s to them, a better (Y will be computed.
Instances have been reported of values of (Y in excess of 20, with no satisfactory explana- tions for the enormous magnitude of the coeffi- cient. If adjacent cross sections have compara- ble values, or if the changes are not sudden between cross sections, such values can be accepted, but if the change is sudden, some attempt should be made to obtain uniformity. This could be clone with more cross sections to achieve gradual change, or it can be done by resubdividing the cross section. Some subsec-
tions can be consolidated (as long as the main- channel subsection remains the largest one), but compensation should probably be made for the fewer subdivisions, possibly by increasing the roughness coefficients somewhat or by decreasing areas somewhat.
Roughness coefficients
Criteria for the selection of roughness coef- ficients for indirect discharge measurements are described in detail by Benson and Dal- rymple (1967), and they all apply equally well to computations of water-surface profiles by the step-backwater method. In addition to these, B’arnes (1967) provides color photographs and details of channel geometry for many slope- area reaches in which values of n, the roughness c’oefficient, were verified.
The Survey’s computer program has provi- sion for varying n with depth. (The depths referred to in this paragraph are mean hy- draulic depths.) For each subsection, two key mean depths may be selected, with a value of n for each. At all flows for which the mean depth corresponding to the water-surface elevation is equal to or less than the lower key mean depth, the subsection roughness coefficient
COMPUTATION OF WATER-SURFACE PROFILES IN OPEN CHANNELS 27
will have the value selected for that key depth. At all flows for which the mean depth corres- ponding to the water-surface elevation is equal to or greater than the higher key mean depth, the subsection roughness coefficient will have the value selected for that key depth. For a flow whose mean depth corresponding to the water-surface elevation lies between the two key mean depths, the value of the roughness coefficient is interpolated. The coefficient of the larger key mean depth can be set equal to, larger than, or smaller than that at the smaller key mean depth, thus providing for considera- ble flexibility in defining the roughness char- acteristics of the subsection.
Before any water-surface profiles are com- puted in some regions, a decision must be made as to whether the profile should be for a summer flood or for a winter flood, because of seasonal changes in vegetation. A summer flood, when vegetation is at its peak, will require larger values of roughness coefficients, which in turn will raise the elevation of the computed profile.
Special Field Conditions
Verified reaches
Where high-water marks can be found to define flood elevations at several locations for known or estimated discharges, profiles for these events should be computed. When the computed profiles match the high-water marks, the computations can be used to evaluate roughness coefficients selected, number and locations of cross sections, and adequacy of subdivisions. Then the final profiles for the selected discharges should be computed, and they should be more reliable.
Short reaches
The part of the total surveyed reach that is used in the “convergence” phase of backwater- profile computations is generally not used to establish the normal water-surface elevation within that part of the reach. The interest is usually in the profile at a point upstream or in a reach upstream from the point of conver- gence. Sometimes, however, the water-surface
profile is desired for a reach that is short and that cannot be extended farther downstream for physical reasons. If the reach is long enough to enable any two curves from among the Ml- M2 family to converge at the normal depth at the upper end of the surveyed reach, a closer estimate of the elevation of normal depth at the downstream end is possible (see figure 22). A new pair of M curves, closer toy,,, can be com- puted. These will converge in a shorter distance and will verify the previously computed nor- mal depth at the upper end. In this way the normal-depth profile is established for a greater part of the reach, and more benefit accrues from the data collected.
A manual computation of the profile in the downstream end of a short reach is also possi- ble. The individual steps in the solution of the energy equation by the standard step-back- water method are described in the section en- titled “Subcritical Flows.” Many of the other- wise tedious trial-and-error operations of a manual computation are reduced by the infor- mation from the initial computer run that has established the normal depth at the upstream end of the reach. All necessary cross-section properties will be available. Although step- backwater computations on a mild slope should progress in an upstream direction, if the normal depth is known at the upstream end of a reach, the solution for the normal- depth profile can progress in a downstream direction. Once the normal depth is estab- lished at the upper end of a subreach, the ele- vation computed at the downstream end of it will be for the normal depth. The reach must be reasonably uniform, however; otherwise, the solution will be erroneous.
Crossing profiles
Occasionally the profiles for several Ml or several M2 curves for a given discharge will cross each other in the reach in which they are being computed to establish convergence with the normal-depth profile. This occurs particu- larly where the cross-sectional area and CY at one elevation in the cross section are consider- ably different from those at another elevation within a foot or two. For the same discharge, the velocity and, therefore, the velocity head