surface metrology guide - surfaces and profileshtskorea.com/tech/spm/profile.pdf · surface...
TRANSCRIPT

Surface Metrology Guide
Surfaces and Profiles
Surfaces
Types of Surfaces
Surface
A surface is a boundary that separates an object from another object or substance.
Nominal Surface
A nominal surface is the intended surface. The shape and extent of a nominal surface are usually shown and dimensioned on a drawing. The nominal surface does not include intended surface roughness.
Real Surface
A real surface is the actual boundary of an object. It deviates from the nominal surface as a result of the process that created the surface. The deviation also depends on the properties, composition, and structure of the material the object is made of.
Measured Surface
A measured surface is a representation of the real surface obtained with some measuring instrument. This distinction is made because no measurement will give the exact real surface. Later portions of this manual describe many different types of measuring instruments.
Surface Geometry
Surface geometry and geometric dimensioning and tolerancing are large subfields of metrology which parallel or exceed surface finish in scope and complexity. This is the realm of coordinate measuring machines and roundness measuring instruments and contouring instruments. However, there is an increasing overlap between geometric measurements and surface finish measurements, so it is helpful to be aware of some basic concepts in geometric measurement.
Form
Form refers to the intentional shape of a surface which differs from a flat line.
Dimension
Dimensions are the macroscopic sizes of a part, e.g. diameter or length.
Tolerance
A tolerance is an allowable range for a dimension to take, a specified interval of dimensions where the part will still function acceptably.
Surface Finish Imperfections
Form Error
Form error encompasses the long wavelength deviations of a surface from the corresponding nominal surface. Form errors result from large scale problems in the manufacturing process such as errors in machine tool ways, guides, or spindles, insecure clamping, inaccurate alignment of a workpiece, or uneven wear in machining equipment. Form error is on the dividing line in size scale between geometric errors and finish errors.
Texture
Surface texture is the combination of fairly short wavelength deviations of a si4rface from the nominal surface. Texture includes roughness, waviness, and lay, that is, all of the deviations that are shorter in wavelength than form error deviations.
Surface Metrology Guide - Surfaces and Profiles

Roughness
Roughness includes the finest (shortest wavelength) irregularities of a surface. Roughness generally results from a particular production process or material condition.
Waviness
Waviness includes the more widely spaced (longer wavelength) deviations of a surface from its nominal shape. Waviness errors are intermediate in wavelength between roughness and form error. Note that the distinction between waviness and form error is not always made in practice, and it is not always clear how to make it. New standards are emerging that define this distinction more rigorously as developed in later sections.
Lay
Lay refers to the predominant direction of the surface texture. Ordinarily lay is determined by the particular production method and geometry used.
Turning, milling, drilling, grinding, and other cutting tool machining processes usually produce a surface that has lay: striations or peaks and valleys in the direction that the tool was drawn across the surface. The shape of the lay can take one of several forms as shown below. Other processes produce surfaces with no characteristic direction: sand casting, peening, and grit blasting. Sometimes these surfaces are said to have a non-directional, particulate, or protuberant lay.
Lay (or the lack thereof) is important for optical properties of a surface. A smooth
Surface texture includes roughness and waviness. Many surfaces have lay: directional striations across the surface.
Several different types of lay are possible depending on the manufacturing and machining processes.
Surface Metrology Guide - Surfaces and Profiles

finish will look rough if it has a strong lay. A rougher surface will look more uniform if it has no lay (it will have more of a matte look).
Flaws
Flaws are unintentional and unwanted problems with a surface. Usually the term flaw refers to individual and unusual features such a scratches, gouges, burrs, etc. According to the ANSI B46.1 standard a flaw is defined when agreed upon in advance by buyer and seller, leaving open all sorts of other types of surface problems. The ANSI 13211.1 standard defines a number of specific types of physical flaws including pits, cracks, craters, and fractures. That standard also defines a number of material or chemical problems that occur in surfaces but are outside the realm of surface finish.
Surface Profiles
Types of Profiles
Profile
A profile is, mathematically, the line of intersection of a surface with a sectioning plane which is (ordinarily) perpendicular to the surface. It is a two-dimensional slice of the three-dimensional surface. Almost always profiles are measured across the surface in a direction perpendicular to the lay of the surface.
Nominal Profile
The nominal profile is the straight or smoothly curved line of intersection of the nominal surface with a plane which is (ordinarily) perpendicular to the surface. The nominal profile has a known mathematical shape for a known part (most often a straight line or a circle).
Real Profile
A real profile is a profile of the real surface. It is the (idealized) shape of the intersection of a surface with a perpendicular sectioning plane.
Measured Profile
A measured profile is a representation of the real profile obtained with some measuring instrument This distinction between "real" and "measured" is made because no measurement will give the exact real surface. Later portions of this manual describe many different types of measuring instruments, emphasizing profiling instruments.
Profiling Methods
A profiling method is a means of measuring a profile of a surface. The result of the method is a two-dimensional graph of the shape of the surface in the sectioning plane created by the profiling instrument.
The most common type of profiling instrument draws a diamond stylus across the surface and measures its vertical displacement as a function of position. Chapter 5 describes profiling instruments in detail.
A profile is a two-dimensional picture of a three dimensional surface that may be thought of as the result of a sectioning place cutting the surface. Profiles are ordinarily taken perpendicular to the lay.
Surface Metrology Guide - Surfaces and Profiles

Modified Profiles
Modified Profile
A modified profile is a measured profile that has been modified by mechanical, electrical, optical, or digital filtering. The filtering is ordinarily done to minimize certain surface characteristics while emphasizing others. A modified profile differs from a measured profile in the sense that the real profile is intentionally modified as part of the measurement. The details of the modification are typically selectable by the user of an instrument. A measured profile is an unintentional modification of the real profile resulting from the limitations of the measuring instrument.
Traced Profile
An instrument's raw trace of a surface is always relative to some reference plane. The traced profile is the raw measured profile with profile height measured relative to a zero line which is parallel to the instrument's reference plane.
Since an instrument's set-up will vary from measurement to measurement, the traced profile has little value except as the starting point for leveling or other form removal.
Form Profile
The form profile is the nominal profile in the coordinate system of the traced profile. That is, it is the nominal shape of the part relative to the reference line of the profiling instrument.
Ordinarily form will be a straight line or a circle. It is most often found by a least squares fit of the traced profile with a straight line or a circle.
Primary Profile
The primary profile is the traced profile alter subtracting the form. The primary profile is thus the sum of all the deviations of the measured profile from the nominal profile. The primary profile is the sum of the form error profile, the waviness profile, and the roughness profile.
Often the primary profile is referred to as the "unfiltered profile" or the "total profile". In this case, it is the trace of the surface leveled and magnified, but otherwise unmodified.
Wavelength
Wavelength (almost universally denoted X) refers to the repeat length of a periodic function.
A real profile can be thought of as the sum of many different individual functions, each with its own wavelength.
Filter
A filter (for purposes of surface finish measurement) is an electronic, mechanical, optical, or mathematical transformation of a profile to attenuate (remove) wavelength components of the surface outside the range of interest for a measurement.
Form Error Profile
The form error profile encompasses the very long wavelength deviations of the traced profile from the nominal profile. Form error is the modified profile obtained by filtering the measured profile to attenuate medium and short wavelength components associated with waviness and roughness.
Texture Profile
Wavelength is the distance between similar points of a repeating, periodic signal.
Surface Metrology Guide - Surfaces and Profiles

The texture profile is the sum of the waviness profile and the roughness profile, i.e. the remaining medium and short wavelength deviations of the measured profile from the nominal profile after form error has been subtracted from the primary profile.
Measurement of texture is the primary domain of traditional surface finish analysis.
Waviness Profile
The waviness profile includes medium wavelength deviations of the measured profile from the nominal profile. The waviness is the modified profile obtained by filtering a measured profile to attenuate the longest and shortest wavelength components of the measured profile (i.e. the filter removes form error and roughness).
Roughness Profile
The roughness profile includes only the shortest wavelength deviations of the measured profile from the nominal profile. The roughness profile is the modified profile obtained by filtering a measured profile to attenuate the longer wavelengths associated with waviness and form error. Optionally, the roughness may also exclude (by filtering) the very shortest wavelengths of the measured profile which are considered noise or features smaller than those of interest.
Roughness is of significant interest in manufacturing because it is the roughness of a surface (given reasonable waviness and form error) that determines its friction in contact with another surface. The roughness of a surface defines how that surfaces feels, how it looks, how it behaves in a contact with another surface, and how it behaves for coating or sealing. For moving parts the roughness determines how the surface will wear, how well it will retain lubricant, and how well it will hold a load.
Reference Mean Lines
Mean Line
A mean line is a reference line from which profile deviations are measured. It is the zero level for a total or modified profile.
Least Squares Mean Line
A least squares mean line is a line through a profile such that the sum of the squares of the deviations of the profile from the mean line is minimized. In practice, this is done with a digitized profile.
An important concept in surface finish is the breaking of a surface profile into different components by wavelength. There is a hierarchy of components, as shown.
Surface Metrology Guide - Surfaces and Profiles

The most common application of a least squares mean line is to "level" the raw traced profile. The traced profile is relative to the straight line reference of the profiling instrument. Unless the instrument is perfectly aligned with the part, that reference will be tilted with respect to the measured surface. A least squares line fit through the raw traced profile may be used as a reference line to remove the misalignment.
More sophisticated instruments give greater control over this leveling process, either by providing for "releveling" or by providing alternatives to the least squares mean line. This is because a least squares mean line is distorted by flaws or unusually shaped profiles.
Filter Mean Line
A filter mean line is the mean line implicit in a profile filter. (Filters are discussed at length in Chapter 7). For example, the waviness profile may be considered the mean line of the texture profile. Another name for the filter mean line in analog instruments is the "electrical mean line".
Center Line
The center line of a profile is the line drawn through a segment (usually a sample length) of the profile such that the total areas between the line and the profile are the same above and below the line.
This concept is little used in modern instruments; it mainly served as a graphical method for drawing a mean line on the output of a profile recording instrument with no built-in parameter processing.
Profile Peaks and Valleys
Profile Height
The height of a profile at a particular point is the distance from the profile to its mean line. Profile height is considered positive above the mean line and negative below the mean line.
Profile Peak
A profile peak is a region of the profile that lies above the mean line and intersects the mean line at each end. In the figure below, each shaded region is a peak. The height of a peak is defined to be the point of maximum height within the region.
Profile Valley
A profile valley analogous to a profile peak is a region of the profile that lies below the mean line and intersects it at each end. The depth of a valley is the depth of the lowest point within the valley.
A least squares mean line minimizes the sum of the squares of the deviations of a set of points from the line. This method approximates how your eye would fit a line through a set of points
Profile peaks are regions above the mean line. Local peaks are regions between two local minima.
Surface Metrology Guide - Surfaces and Profiles

Profile Irregularity
Sometimes it is convenient to speak of one profile peak together with one adjacent profile valley as a profile irregularity.
Local Peak
A local peak is a region of a profile between two successive local minima in the profile.
Local Valley
A local valley is a region of a profile between two successive "high points" (local maxima) in the profile.
Few parameters say very much about local peaks or valleys, but very experienced surface finish experts can tell a great deal about a machining process by looking at the shape of local peaks and valleys within each larger peak or valley.
Spacing
Spacing
Spacing refers to the distance between features on a profile in the x direction, parallel to the nominal direction of the trace. The features that determine a spacing parameter usually relate to peaks and valleys or to average wavelengths, etc.
Profile Valleys extend below the mean line. Local valleys lie between two maxima (above or below the mean line).
Surface Metrology Guide - Surfaces and Profiles

Surface Metrology Guide
Drawing Indication of Surface Texture Specifying surface texture
The following criteria may be used in the specification of surface texture:
Surface roughness produced by common production methods (ASME B46.1-1995)
Meaning of the surface finish symbol (ASME Y14.36M-1996)
Control surface texture only when and where necessary.Experimentation and experiences are best sources of knowledge in specifying surface characteristics.In experimentation, statistical techniques have proved to be helpful for establishing correlation between surface characteristics and its intended functions.Specified surface texture can be produced and measured.
a = roughness value Ra in micrometers b = production method, treatment, coating, other text or note callout c = roughness cutoff or sampling length in millimeters d = direction of lay e = minimum material removal requirement in millimeters f = roughness value other than Ra in micrometers preceded by its parameter symbol (e.g. Rz 0.4)
Surface Metrology Guide - Drawing Indication of Surface Texture

For a detailed explanation of the individual components of the symbol, see the references listed at the end of this page.
The use of this symbol is illustrated in the next section. The lay symbols are illustrated in the following table.
Lay symbols and examples
Examples of Surface Texture Indication
Here are some examples of the surface texture symbol application:
Lay Symbol Meaning Example
Lay approximately parallel to the line representing the surface to which the symbol is applied.
Lay approximately perpendicular to the line representing the surface to which the symbol is applied.
Lay angular in both directions to the line representing the surface to which the symbol is applied.
Lay multidirectional.
Lay approximately circular relative to the center of the surface to which the symbol is applied.
Lay approximately radial relative to the center of the surface to which the symbol is applied.
Lay particulate, non-directional, or protuberant.
Basic Surface Texture Symbol. Surface may be produced by any method except when the bar or circle (Symbol b or d) is specified.
Material Removal By Machining Is Required. The horizontal bar indicates material removal by machining is required to produce the surface and material must be provided for that purpose.
Material Removal Allowance. Value in millimeters for "X" defines the minimum material removal requirement.
Material Removal Prohibited. The circle in the vee indicates the surface must be produced by processes such as casting, forging, hot finishing, cold finishing, die casting, powder metallurgy and injection molding without subsequent removal of material.
Surface Texture Symbol. To be used when any surface texture values, production method, treatment, coating or other text are specified above the horizontal line or to the right of the symbol. Surface may be produced by any method except when bar or circle (Symbol b or d) is specified or when the method is specified above the horizontal line.
Roughness average rating is placed at the left of the long leg and the roughness cutoff rating or sampling length is placed at the right. The specification of only one rating for roughness average shall indicate the maximum value and any lesser value shall be acceptable. Specify the roughness average in micrometers.
The specification of maximum and minimum roughness average values indicates a permissible range of roughness. Specify in micrometers.
Removal of material prohibited.
Roughness sampling length or cutoff rating is placed below the horizontal extension and is mandatory in all cases when values are applied to the symbol. Specify in millimeters.
Example of roughness sampling length or cutoff rating for Rz (2.5) when different than that for Ra (0.8).
Surface Metrology Guide - Drawing Indication of Surface Texture

Indication on Older Drawings
The common use of Ra is deep-rooted in surface measurement, so much so that older standards provided ways of specifying Ra only. Today's and upcoming surface texture standards aim to de-emphasize the special role that Ra has been taking and attempt to accomodate more parameters and factors affecting their characterization.
Grade Numbers
Older drawings may use roughness grade numbers to indication Ra values. The following table is given in ISO 1320:1992.
RHR - Roughness Height Range
Another practice in the specification of Ra values on drawings is using the letters "RHR" with a superscript and subscript indicating the range of Ra value permitted. The following figure illustrates this practice.
For example, the second symbol above means that Ra may fall between 10 µin and 20 µin.
References
Indication of roughness parameter other than Ra can also be specified as a range separated by a dash (i.e. 0.4-0.8).
Example of roughness sampling length or cutoff rating (2.5) applied to Rz
Lay designation is indicated by the lay symbol placed at the right of the long leg.
Example of maximum roughness spacing, Sm, placed at the right of the cutoff rating and above the lay symbol. Any lesser rating shall be acceptable. Specify in millimeters.
Material removal by machining is required to produce the surface. The minimum amount of stock provided for material removal is specified at the left of the short leg of the symbol. Also, "NOTE X" can be used to control designations other than those covered by defaults in ASME 846.1 - 1995.
Roughness values Ra Roughness Grade Numbersµm µin
50 2000 N12
25 1000 N11
12.5 500 N10
8.3 250 N9
3.2 125 N8
1.6 63 N7
0.8 32 N6
0.4 16 N5
0.2 8 N4
0.1 4 N3
0.05 2 N20.025 1 N1
Older drawings may have used this notation to express an allowable range for Ra. This notation is now obsolete.
ASME Y14.36M-1996; Surface Texture Symbols.ISO 1302:1994; Technical Drawings - Method of indicating surface texture. Watch for revisionsISO CD 1302; Geometrical Product Specifications (GPS) - Indication of Surface
Surface Metrology Guide - Drawing Indication of Surface Texture

Surface Metrology Guide
Surface Measuring Equipment
The Measurement Coordinate System
Profiling Coordinate System
Coordinate System
It Is helpful to use a standard right-handed coordinate system when referencing profile or surface topography measurements. If x and y are the coordinates in the plane of the surface and z is displacement from the surface, then the coordinate system appears as below We have chosen x to be the direction of travel of the transducer across the surface.
This coordinate system differs from the 2-D coordinate system often used in simple profiling, namely x horizontal and y vertical. By making z the vertical displacement we can use the same coordinate system whether we are discussing 2-D profiles or 3-D surfaces.
Which Way is "Up"?
In general the coordinate system above can be oriented in any way with respect to gravity or the surface of the earth (depending on the capabilities of the measuring instrument). However, when referring to surface features, it is much easier to speak of "vertical" and "horizontal", "peak" and "valley", "height" and "depth", and "up" and "down", rather than trying to express everything as x, y, and z displacements or distances. Therefore, throughout this work it is assumed that the positive z coordinate is physically "up" when using such terms, even though a particular measurement may not fit that assumption.
Units of Measure in Surface Finish
Surface heights are generally measured in microinches or micrometers. A microinch, abbreviated µin, is one millionth of an inch. Similarly, a micrometer [µm] is one millionth of a meter.
As points of reference for how small a microinch is, here are the sizes of some familiar items:
A microinch is very small!
When converting from µin to µm the conversion 25.4 mm equals 1 inch comes into play. Depending on whether you live in Europe or in the United States this conversion is exact or is good enough for all practical purposes. Our conversion is thus 39.37 µin = 1 µm, but in surface finish it is common to approximate things even further, 40 µin = 1 µm.
The coordinate system for profiling a surface has x in the trace direction, y normal to the trace in the plane of the surface, and z perpendicular to the surface. This same coordinate system is useful for both profiling and 3-D topography. In the past a simpler 2-D, x-y coordinate system was usually used for profiling.
length of a football field 3,600,000,000 µinwidth of a hand 3,000,000 - 4,000,000 µinthickness of a pane of glass 80,000 - 120,000 µindiameter of human hair 2,000 - 3,000 µinthickness of paper 1,000-2,000 µindiameter of a spider web strand 100 - 200 µinwavelength of visible light 16 - 30 µin"diameter" of a hydrogen atom 0.004 µin
Surface Metrology Guide - Instruments

Magnification in Surface Traces
To be of any use to humans, surface traces are magnified moderately in the horizontal direction and significantly in the vertical direction in order to be presented on a computer screen or a piece of paper. As a typical example, a 0.15" trace with a 300 µin height from highest peak to lowest valley might be expanded to fit on a 6" wide by 3" high plot. This is a 40X magnification horizontally and a 10,000X magnification vertically. This difference leads to a very sharply undulating trace that easily deceives the uninitiated as to the actual shape of the surface.
For example, here is a surface trace actual size, magnified 40X horizontally and vertically, and then magnified 40X horizontally and 10,000X times vertically:
There is no difference between the 40X vertical magnification and a straight line with tile resolution of a laser printer. Always keep in mind the extreme vertical magnification when looking at surface profiles produced by a practical instrument.
Profile Measuring Lengths
Traverse Length
The traverse length (A+B+C) of a profile measurement is the total distance traveled by the profiling instrument's pick-up during data collection.
Unit conversion in surface finish
The vertical magnification of a surface trace is ordinarily much greater than the horizontal magnification. A trace that looks jagged and rough to the eye is really a distorted view of a nearly flat surface with moderate ripples across it.
Surface Metrology Guide - Instruments
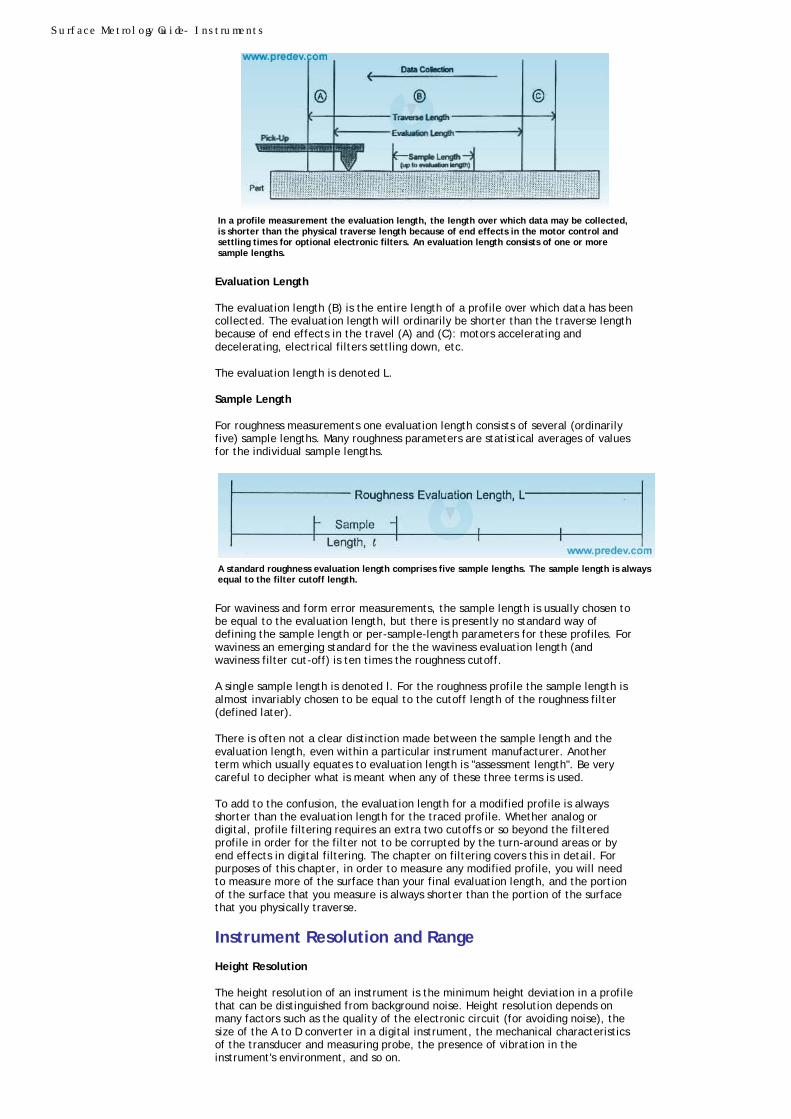
Evaluation Length
The evaluation length (B) is the entire length of a profile over which data has been collected. The evaluation length will ordinarily be shorter than the traverse length because of end effects in the travel (A) and (C): motors accelerating and decelerating, electrical filters settling down, etc.
The evaluation length is denoted L.
Sample Length
For roughness measurements one evaluation length consists of several (ordinarily five) sample lengths. Many roughness parameters are statistical averages of values for the individual sample lengths.
For waviness and form error measurements, the sample length is usually chosen to be equal to the evaluation length, but there is presently no standard way of defining the sample length or per-sample-length parameters for these profiles. For waviness an emerging standard for the the waviness evaluation length (and waviness filter cut-off) is ten times the roughness cutoff.
A single sample length is denoted l. For the roughness profile the sample length is almost invariably chosen to be equal to the cutoff length of the roughness filter (defined later).
There is often not a clear distinction made between the sample length and the evaluation length, even within a particular instrument manufacturer. Another term which usually equates to evaluation length is "assessment length". Be very careful to decipher what is meant when any of these three terms is used.
To add to the confusion, the evaluation length for a modified profile is always shorter than the evaluation length for the traced profile. Whether analog or digital, profile filtering requires an extra two cutoffs or so beyond the filtered profile in order for the filter not to be corrupted by the turn-around areas or by end effects in digital filtering. The chapter on filtering covers this in detail. For purposes of this chapter, in order to measure any modified profile, you will need to measure more of the surface than your final evaluation length, and the portion of the surface that you measure is always shorter than the portion of the surface that you physically traverse.
Instrument Resolution and Range
Height Resolution
The height resolution of an instrument is the minimum height deviation in a profile that can be distinguished from background noise. Height resolution depends on many factors such as the quality of the electronic circuit (for avoiding noise), the size of the A to D converter in a digital instrument, the mechanical characteristics of the transducer and measuring probe, the presence of vibration in the instrument's environment, and so on.
In a profile measurement the evaluation length, the length over which data may be collected, is shorter than the physical traverse length because of end effects in the motor control and settling times for optional electronic filters. An evaluation length consists of one or more sample lengths.
A standard roughness evaluation length comprises five sample lengths. The sample length is always equal to the filter cutoff length.
Surface Metrology Guide - Instruments

One way to estimate the height resolution (or vertical resolution) of an instrument is to take a trace of air or of an optical flat- a surface that has a roughness much less than the expected resolution.
Height Range
The height range is the maximum peak to valley height that an instrument can measure accurately. The range is determined by the gain of the electronics and the electrical and mechanical limitations of the transducer and probe. Some transducers become nonlinear outside a specified range, some have mechanical constraints.
Range to Resolution Ratio
The range to resolution ratio is the ratio of the height range of an instrument to the resolution of an instrument. This is a key measure of the capability of an instrument. Some instruments allow the user to trade range for resolution, maintaining a roughly constant range to resolution ratio.
Sampling Interval
Instruments which digitize the profile and store an array of height values have a particular sampling interval. This is the interval between points in the x direction, along the trace length. Nyquist theory has as its primary result that the wavelength of an analog signal which can be represented in a digitized signal is twice the sampling interval. In practice the sampling interval is chosen to give five points in each period of the shortest wavelength that is to be measured.
Lateral Resolution
The lateral or horizontal resolution of an instrument is the size of the smallest feature that can be distinguished on a surface. Lateral resolution depends not only on the sampling interval but on the physical characteristics of the mechanical or optical probe (for example the diamond radius of a contact stylus).
The ability of an instrument to distinguish the features of a surface is a combination of its vertical and horizontal resolution.
Classifications of Instruments
Type I Profiling Contact Skidless Instruments
Type II Profiling Non-contact Instruments
Type III Profiling Nanometer-Level Scanning Microscopy
Type IV Profiling Contact Skidded Instruments
Type V Other Skidded Instruments
Type VI Area Averaging Instruments
Schematic of a Surface Profiling Instrument
The Instrument Measuring Loop
The measuring loop of an instrument comprises all of the components of the instrument and fixturing that contribute to converting the real surface profile into an electrical (analog or digital) representation of the profile.
The measuring loop of a profiling instrument consists of all the electrical and mechanical (and optical) components of the instrument involved in converting a real surface profile into an
Surface Metrology Guide - Instruments

Internal (Skid) Reference Datums
Several methods can be used to establish an instrument reference line from which profile height can be measured. The simplest approach is to use a skid riding on the surface itself as a reference. Usually the arm to which the skid is tied pivots a long distance away from the measurement. The skid assembly and transducer are designed to measure the difference in height between the skid height and the stylus tip height. The skid rides over imperfections in the surface and acts as a mechanical filter of the surface: it smoothes out longer wavelength undulations in the surface. This approach is therefore suitable for roughness profile measurement only.
Several alternatives are in use for the geometry of the skid relative to the stylus tip. A single skid can ride in front of, behind, or in line with the diamond. More commonly two skids are used that ride on either side of the diamond. A final alternative is a single skid with the diamond tip protruding down from its center.
For some applications, for example measuring round parts, it may be desirable to use two skids to establish the reference height, eliminating the pivot from the measurement.
External Reference Datums
More advanced profiling instruments measure a surface relative to an external datum as shown below.
electrical signal representing that profile. The pickup consists of the components exclusive of the traverse and guide mechanisms.
In the simplest skidded profiling instruments the stylus rides on the surface and measures height relative to a skid which also rides on the surface. The skid can be in line with the diamond or beside it as the assembly traverses the part.
Two skids are occasionally used as the reference for round or unusually shaped parts.
Surface Metrology Guide - Instruments

An external reference is necessary to get a picture of the surface not mechanically filtered by skids. The external reference is usually a lapped bar or an optical flat.
A vertical mechanical flexure provides a horizontal reference plane. This geometry has the disadvantage of short travel distance.
An optical interferometric transducer can provide a vertical reference level, or an optical transducer can be combined with a mechanical reference guide.
Surface Metrology Guide - Instruments

Surface Measurement Transducers
Several types of transducers are in use for measuring surface profiles. They fall into two general types: velocity transducers and displacement transducers.
Moving Coil Transducers
Piezoelectric Transducers
Inductive Transducers
LVDTs
Linear variable differential transformers (LVDT*s) are widely used as high quality displacement transducers in surface finish measurement.
Once a profile has been converted to an electrical signal it enters the amplifier of the instrument where it is not simply amplified, but converted to a digital representation and analyzed for all the desired surface parameters. Higher capability instruments can display and plot profiles and parameter results.
A linear variable differential transformer (LVDT) consists of two transformers. The relative efficiency of the two depends on the displacement of a ferrous core. In an actual transducer the core, primary coil, and secondary coils share a common axis.
Surface Metrology Guide - Instruments

LVDT's work by comparing the output of two parallel transformers which have a common core. As the core moves up or down, one or the other transformer becomes more efficient because of better magnetic coupling between the primary and secondary coils. In the simplest wiring scheme the two transformers are wired in series. Then the voltage out is proportional to displacement and the direction of displacement from the zero point is indicated by the phase of the output relative to the input. The output has the opposite phase in one case because the transformers are wired in opposite directions. More complicated detection electronics look at both transformers independently.
LVDT's are very linear and repeatable. They have a definite zero point and have good response as far as the highest frequency (shortest profile wavelength) they can resolve. They have the disadvantage of being somewhat larger than other surface finish transducers.
LVDTs are commonly used on profiling instruments and contouring instruments.
Surface Metrology Guide - Instruments
Surface Metrology Guide
Calibration and Reference Specimens
In order to calibrate surface finish measuring instruments, a calibration reference is needed. For profiling instruments these fall into three categories: specimens with a known parameter (Ra) value, step height specimens, and specimens designed to test the integrity of a diamond stylus.
In addition to specimens designed to calibrate instruments) one can buy specimens of varying Ra designed to be compared with a fingernail to actual surfaces.
Roughness comparison Specimens
...
Less reverent workers in surface finish refer to this type of test as a "scratch-n-sniff' test. The test is very subjective and is good only for estimates Of Ra on fairly rough surfaces.
Instrument calibration Specimens Known Ra Specimens
Triangle Waves
Sine Waves
Random Patches
Repeated Random Patches
Techniques for Creating
Stylus Check Specimens
Step Height Standards
.
Surface Metrology Guide - Calibration and Reference Specimens

Surface Metrology Guide
Surface Profile Filtering
Introduction
What Filters Do
A surface profile may be composed of a range of frequency components. The high frequency (or short wave) components correspond to those that are perceived to be rough and hence called "roughness". The low frequency (or long wave) components correspond to more gradual changes in the profile and are often associated with the terms "waviness" or even "form". Note that roughness and waviness are relative terms, just as the words "high", "low", "long" and "short".
Filtering is a procedure to separate certain frequency components of a surface profile. Depending on what component is desired, the filtering operation may be
The term "cutoff" numerically specifies the frequency bound below or above which the components are extracted or eliminated.
wave in, components attenuated, wave out
short-pass, or high-pass - letting the short wavelength (high frequency) components through, therefore the roughness profile is extracted;long-pass, or low-pass - letting the long wavelength (low frequency) components through, therefore the waviness profile is extracted;band-pass - extracting a profile of specified bandwidth by applying both high-pass and low-pass filters, allowing controlled profile data bandwidth
Surface Metrology Guide - Filtering

Frequency Response
The "frequency response" of a filter refers to how the filter attenuates (or amplifies) a sine wave input. For most useftil filters the attenuation is a ftinction of the frequency or wavelength of the input, so the frequency response of a filter is a (complicated) flinction of attenuation (often expressed as percent) versus wavelength.
Analog 2RC Filter
Background
The 2RC (or 2CR) filter is the oldest standard filter used in surface roughness measurements. It Is typically implemented as an analog electrical filter, 2 RC filters in series, separated by a buffer. It Is not phase-correct, and it has a frequency transmission of 75% at the cutoff wavelength. The 75% level was apparently chosen because the 2RC filter has a long "tail" in its frequency response, and, therefore, much of the long wavelength components above the 50% cutoff remains in the roughness. The cutoff at 75% more accurately retains the intuitive sense of being the wavelength boundary between roughness and waviness. However, in almost all others scientific domains, the "cutoff' of a filter is the 50% transmission point by definition. Newer filters in surface finish revert to the more accepted 50% definition.
Cutoff Lengths
Standard values. Table
Electrical Definition
If the height, z, of a profile that varies over x distance is translated by transducer and electronics into a DC voltage, e, that varies over time, t, then the 2RC filter can be implemented electrically with the following circuit:
Surface Metrology Guide - Filtering

The "ideal separation" may be approximated by an electronic "buffer." In practice the circuit R, and C values must be chosen to give the desired cutoff length. The values depend on the horizontal velocity of the measuring instrument's pick-up as it travels across the surface. The electrical filter is therefore only as accurate as the instrument's horizontal velocity. One can change the cutoff by switching R values or by changing the speed of the instrument.
Some in surface finish have begun to refer to the above filter as a 2CR filter because the capacitor comes before the resistor in each pair. However, electrical engineers refer to either order as an RC filter and distinguish between them by calling one a high pass filter and one a low pass filter. "Pass" refers to what frequencies make it through the filter. Thus the filter above is really a high pass 2RC filter; it lets through high frequency (short wavelength) components of the signal, i.e. the roughness of the profile the signal represents.
Mathematical Definition
Following are useful relationships between distance, velocity, frequency, and wavelength for a surface profile. Also consult the nomenclature section for definitions of variables throughout this document.
If the height of the profile is z(x), then the electrical signal corresponding to the profile is
This is the voltage, em, entering the above filter circuit. Application of Kirchoil's laws (see an electronics or physics textbook) yields a differential equation for the output voltage as a function of the input voltage for the circuit:
If we put things back in the domain of profile height versus horizontal distance, we find a corresponding differential equation for the roughness profile as a function of the texture profile:
In this equation we have also looked ahead to Section 7.4 and have made use of the identity
which comes from the criterion of 75% frequency response at the cutoff.
Frequency Response
In the following two sub-sections we rigorously show how to calculate the frequency response for the 2RC filter, but for now we simply present the result, which is part of ANSI and ISO standards.
Surface Metrology Guide - Filtering

The meaning of this graph is that wavelengths considerably smaller than the cutoff get through the filter completely, while long wavelengths are attenuated to zero. There is a gradual transition between these two extremes.
Phase Lag in the Frequency Response
Digital Filters
Advantages of Digital Filters
Modern surface finish measuring instruments no longer rely on electronics to do the roughness filtering. Instead they digitize the raw trace of the surface and mathematically (computationally) filter this raw data after it has been collected and stored in a computer memory. The first advantage of this approach is that the same raw data can be filtered multiple times with different cutoffs to compare the results. Another advantage is that it becomes possible to compare the roughness or waviness to the original surface trace which it is a part of;
Weighting Functions
The most common way of performing digital filtering is to convolve a weighting function with the raw data. A simplistic way of understanding this idea of convolution is to think of it as a sliding multiplication and integral. Take a weighting function h(x) that typically has some simple finite shape, for a particular point on the profile center the weighting function over that point, multiply it by the profile and integrate the resulting function. The result is a new value for a modified profile. Repeat this procedure for each point in the original profile.
We denote the weighting function by h(x):
h = h(x)
The waviness is then a "weighting" or convolution of the texture profile:
Digital Filters and Fourier Transform Methods
This section details the traditional method for specifying digital filters. Usually specified is the waviness weighting function as a function of distance:
Intro to Fourier ideas. How to "think" in the Fourier domain
Surface Metrology Guide - Filtering

Usually desired, however, is the Fourier transform of the weighting function (in terms of wavelength) derived from the weighting function as follows:
The advantage of this form is that the filter can be expressed as a simple multiplication in the Fourier domain:
This is a standard result for convolution. It is useful to know is the frequency response of the filter, which is just the magnitude of the Fourier transform of the weighting function, |H(λ)|.
Discussion of convolution for filter response...
When the filter is phase-correct and is designed to give 50% transmission at the cutoff frequency, there is a complementary relationship between roughness and waviness:
This is also simply expressed in the Fourier domain:
Or defining the roughness filter in itself,
If the filter is not phase-correct or does not have 50% transmission at the cutoff, then there are two related but independent filters for the roughness and for the waviness.
Frequency Response
It Is easy to calculate the frequency response of a filter in the Fourier domain. The attenuation of a sine wave by a filter H(λ) is simply IH(λ)I.
Digital Equivalent of Analog 2RC Filter
Fourier Transform Analysis
Adigital approximation of the analog 2RC filter can be constructed from the differential equations describing the analog electrical circuit. . . . The Fourier transform of the 2RC filter is:
Surface Metrology Guide - Filtering

Note the imaginary term in the above transform. This term produces the wavelength-dependent phase shift in the roughness profile compared to the primary profile.
The waviness has no standard definition with 2RC filtering, but a reasonable one which complements Eq. (7.4.1) is a filter with the opposite frequency response and the same phase lag:
H(X) = ... ?? need to calculate (7.4.2)
These have both real and imaginary parts because the filter is not phase correct. The signal is phase shifted by an amount which depends on wavelength. Note that the filter may be easily modified to yield a (nonstandard) 50% transmission at the cutoff by removing the factor of 3 everywhere it appears in front of λc.
Frequency Response
The frequency response of the 2RC filter may be found by taking the magnitude of the Fourier transform which defines the filter. The result is
This is the equation for the frequency response plotted earlier without proof. We see that the frequency response at the cutoff is
(This result was already assumed in our conversion from RC to λc. We took this circular approach in order to have more useful intermediate results- in the physical domain rather than in the electrical domain.)
Phase Lag in the Frequency Response
The phase shift of the 2RC filter may also be calculated from its Fourier transform. In general, the phase lag as a function of the wavelength of the profile is
Or for the 2RC filter, converting the phase lag angle to a fraction of a cycle,
Below is the relative phase lag as a function of the frequency of the original sinusoidal profile. On this chart a lag of 0 means no lag at all. A lag of 0.5 means the output is exactly out of phase with the input.
Surface Metrology Guide - Filtering

Right at the cutoff frequency the phase lag is 60? or one sixth of a full cycle. At the longest wavelengths the phase lag reaches 180? the output of the filter is precisely out of phase with the input. For the shortest wavelengths, the phase lag becomes negligible. A real surface is a complicated mixture of many frequencies added together. The phase lag of each component of the surface will depend on its frequency as shown above. The sum, therefore, will have a complicated phase lag behavior.
PICTURE: 2 superimposed wavelengths with different phase lags
Because the phase lag is significant near and above the cutoff wavelength, undesirable effects can occur with spikes and other sharp features. In the Fourier (frequency) domain steep transitions are a mixture of several wavelengths. The sharp feature, after it goes through the filter will be "smeared out" in the direction of filtering because of the variable phase lag of the components which make up the feature. The most commonly seen failing is the behavior of the filter around a sharp spike or a deep valley in an otherwise fairly smooth surface.
PICTURE of roughness of a spiked valley
Comments ...
Perfect steps are unlikely in surface finish measurement (or they should be), but it is instructive to examine what a step looks like after 2RC filtering.
PICTURE of roughness of a step
Comments . .
Weighting Function
The 2RC filter may be implemented digitally using the following approximate weighting function:
The roughness "pushes up" on one side of a deep valley in the surface. The one-sided-ness is due to the phase lag of the filter. In this case data was collected from right to left and the filter responds to the valley only on the left.
Because the 2RC filter has a phase lag that increases with wavelength, the waviness, if defined as the texture minus the roughness, has a lag and an asymmetry relative to the raw trace of the surface.
Surface Metrology Guide - Filtering

For 75% transmission at the cutoff frequency, A = 3.64.
Phase-Correct 2RC Filter
Background
The phase-correct 2RC filter is a digital filter that matches the frequency response of the 2RC filter but has no phase lag. It retains the same 75% transmission at the cutoff and has the very same frequency response curve. Like any phase-correct filter it can not be implemented easily with analog electronics (despite its relationship to the analog 2RC filter).
Its purpose is to approximate the behavior of the 2RC filter so that roughness parameters can be compared with the older industry standard, but to do away with the disadvantages that result from phase lags so that roughness profiles can be examined with greater confidence. This filter is sometimes referred to as "the" phase correct filter or the "PC" filter, but this name is more often given to the Gaussian filter, so confusion can obviously arise. It is best to use the full name of either phase correct filter.
Weighting Function
Fourier Transform Analysis
The phase-correct 2RC filter is a filter which has the same frequency response as the 2RC filter but is phase-correct. Mathematically, this amounts to replacing the Fourier transform of the 2RC filter by its magnitude;
The corresponding waviness filter is???.
Frequency Response
Gaussian Filter
Background
The Gaussian filter is designed to more precisely separate the roughness from the waviness. Its frequency response has a steeper slope near the cutoff than the 2RC frequency response, meaning that wavelengths near the cutoff (above or below) are more sharply distinguished as either waviness or roughness.
Weighting Function
The weighting function for the Gaussian filter is as follows:
This is a Gaussian bell-shaped curve which gives the filter its name;
The width of the bell determines the cutoff of the filter. The width is in turn determined by the α' and λc values. the parameter α' is defined so as to give 50% transmission of a sine wave with wavelength equal to the cutoff.
Surface Metrology Guide - Filtering

Fourier Transform Analysis
The time and Fourier domain versions of the weighting function are:
GET RID OF THIS:
The Gaussian filter is defined to have 50% transmission at the cutoff wavelength. This specification is what determined the value of α':
Frequency Response
The frequency response of the Gaussian filter is as shown:
The "push up" around a valley is less with the Gaussian filter than with the 2RC and is symmetric. These are advantages of the phase-correct filter approach.
Surface Metrology Guide - Filtering

Triangle Filter
Weighting Function
The weighting function for a triangle filter is defined in terms of the base half-width, B, of the unit-area triangle, as follows:
The main significance of the triangle filter is its simplicity. Sometimes it is used as a computationally faster approximation of the Gaussian filter. The triangle filter is also the basis for each pass of the two-pass Rk filter.
Fourier Transform Analysis
...
Frequency Response
The frequency response of the triangle filter is:
The frequency response of the triangle filter is close to that of the Gaussian filter, except for "wiggles" at higher frequency. These are the result of the sharp changes in the shape at x=0 and x=B.
Rk Filter
Background
The Rk filter is a special filter that is suitable for plateaued surfaces. It is designed to reduce the overshoot that occurs in the roughness on either side of a sharp valley.
Rk Filter
The Rk filter defined by German standard DIN 4774 is two passes of the above triangle filter. (The DIN standard uses a slightly different definition for B, twice the B used here). Because of the specialized processing between passes, there is no way to combine the passes into a single Fourier transform.
Filter Procedure
There is a multistep procedure involved in the Rk filter. The first step is to
Surface Metrology Guide - Filtering

perform an ordinary triangle filter on the texture profile to get a first-pass waviness profile. Next use this waviness as a truncation line: any part of the primary profile which projects below the waviness is truncated to the first pass waviness value. The truncated primary profile is next filtered a second time, again with a triangle filter. The result is the Rk waviness. Subtracting from the original texture gives the Rk roughness.
As shown in the highlighted areas of the first figure above, the Rk filter has less "push up" in the final roughness, compared to a standard, one-pass roughness filter. The waviness follows the plateaus and is less affected by the deep valleys between.
When several valleys are close together, even the Rk filter will suffer from push-up on either side of the group. Alternatives to Rk Filtering
Recent research efforts have looked for alternatives to the Rk filter approach. Several different algorithms have been proposed that find and truncate individual valleys. There are multiple options for how to define what is a deep valley and how to do the truncation. .
Short Wavelength Roughness Filtering
So far we have considered the high-pass roughness filter that separates the high frequency (short wavelength) roughness components of texture from the long wavelength waviness components of texture. At very high frequencies the measurement made by a real instrument will be limited by the mechanics and electronics and sampling rate of the instrument. However, the very newest instruments can be designed with measurement loops that perform better than necessary. In this case it is desirable to mathematically filter noise or very fine features that are not of interest.
PICTURE: mechanical lower limit
Surface Metrology Guide - Filtering

Discussion: wavelength measurable by a given stylus radius. .
Choosing Filters and Cutoffs
When a part is manufactured from a blueprint the specification for surface finish includes a cutoff for calculating the roughness, even if it is the (too often used) default value of 0.030 in. However, when no blueprint is available, some guideline is needed for how to choose the cutoff Also, the more savvy product designer may want a means for choosing what cutoff value to specify. The tables in this section give suggested values for the cutoff to use for different surface conditions.
First of all, there are five different standard cutoff lengths. These are listed in the following table.
In this table, and throughout this document, we use inch units primarily and metric units secondarily. It is important to note, however, that surface finish standards (including the ANSI standard) specify the values in metric units. The inch values are only approximate equivalents. These are the standard cutoff and sample lengths; there is rarely a reason to choose a nonstandard length except for specialized periodic surfaces. Now we address the question of how to choose a cutoff.
First, for periodic surfaces the sample length should be long enough to include a reasonable number of periods of the profile waveform. The following table suggests how to choose the sample length based on the 5m value of the primary profile. The cutoff is chosen to give at least two periods of the surface in each sample length.
Selecting cutoff for periodic surface
Table of Cutoffs and Cutoff Ratiosλc λc:λs diamond tip radius
0.003 in (0.08 mm) 30 ?/φοντ> 0.00002 ιν
0.01 in (0.25 mm) 100 ?/φοντ> 0.0001 ιν
0.03 in (0.8 mm) 300 ?/φοντ> 0.0001 ιν
0.1 in (2.5 mm) 300 ?/φοντ> 0.0004 ιν
0.3 in (8.0 mm) 300 ?/φοντ> 0.004 ιν
For: X < Sm ?/φοντ> Ψ
Choose: λc
0.0005 in 0.0016 in 0.003 in0.0016 in 0.005 in 0.01 in0.005 in 0.016 in 0.03 in0.016 in 0.050 in 0.1 in0.050 in 0.160 in 0.3 in
Surface Metrology Guide - Filtering

For non-periodic surfaces, choose the sample length based on the expected value of Ra or adjust the cutoff until the measured value of Ra fits within the bounds of the table. (If the measurement is too high for one row and too low for the next, choose the higher cutoff value to retain all relevant frequency contents.)
Selecting cutoff for random surfaces
Waviness Filtering
So far we have discussed "roughness filters"- filters for separating roughness from waviness. At longer wavelengths the same concepts apply for separating waviness from form error.
For: X < Ra ?/φοντ> Ψ
Choose: λc
0.8 µin 0.003 in0.8 µin 4.0 µin 0.01 in4.0 µin 80 µin 0.03 in80 µin 400 µin 0.1 in400 µin 0.3 in
Surface Metrology Guide - Filtering

Surface Profile Parameters Parameter Name Standards Related
Height Parameters
Ra Roughness Average (Ra) 1,2,3,4 Pa, Wa
Rq Root Mean Square (RMS) Roughness 1,3,4 Pq, Wq
Rt Maximum Height of the Profile 1,3 Pt, Wt
Rv, Rm Maximum Profile Valley Depth 1,3,4 Pv, Wv
Rp Maximum Profile Peak Height 1,3,4 Pp, Wp
Rpm Average Maximum Profile Peak Height 1
Rz Average Maximum Height of the Profile 1,3 Pz, Wz, Rtm
Rmax Maximum Roughness Depth 1 Ry, Rymax, Rti,Rz
Rc Mean Height of Profile Irregularities 3,4 Pc, Wc
Rz(iso) Ten Point Height 4
Ry Maximum Height of the Profile 4
Wt, W Waviness Height 1,2,3 Rt,Pt
Spacing Parameters
S Mean Spacing of Local Peaks of the Profile 4
Sm, RSm Mean Spacing of Profile Irregularities 1,3,4 PSm, WSm
D Profile Peak Density 4 Sm
Pc Peak Count (Peak Density) 1
HSC Hight Spot Count
λa Average Wavelength of the Profile 4
λq Root Mean Square (RMS) Wavelength of the Profile 4
Hybrid Parameters
∆a Average Absolute Slope 1,3 P∆a, W∆a
∆q Root Mean Square (RMS) Slope 1,3 P∆q, W∆q
Lo Developed Profile Length 4 lr
lr Profile Length Ratio 4 Lo
ADF and BAC Parameters
Rsk,Sk Skewness 1,3,4 Psk, Wsk
Rku Kurtosis 1,3 Pku, Wku
tp, Rmr(c) Profile Bearing Length Ratio (Material Ratio of the Profile) 1,3,4 Pmr(c), Wmr(c),
Pmr, Rmr, Wmr
Htp, Rδc Profile Section Height Difference 1,3
H Swedish Height Htp, Rt
Rk Core Roughness Depth 5
Rpk Reduced Peak Height 5 Rpk*
Rvk Reduced Valley Depth 5 Rvk*
Mr1 Material Portion 5 Rmr(c), tp
Mr2 Material Portion 5 Rmr(c), tp
Vo "Oil-Retention" Volume
Surface Metrology Guide - Profile Parameters

Roughness Amplitude Parameters
Ra - Average Roughness
Also known as Arithmetic Average (AA), Center Line Average (CLA), Arithmetical Mean Deviation of the Profile.
The average roughness is the area between the roughness profile and its mean line, or the integral of the absolute value of the roughness profile height over the evaluation length:
When evaluated from digital data, the integral is normally approximated by a trapezoidal rule:
Graphically, the average roughness is the area (shown below) between the roughness profile and its center line divided by the evaluation length (normally five sample lengths with each sample length equal to one cutoff):
The average roughness is by far the most commonly used parameter in surface finish measurement. The earliest analog roughness measuring instruments measured only Ra by drawing a stylus continuously back and forth over a surface and integrating (finding the average) electronically. It is fairly easy to take the absolute value of a signal and to integrate a signal using only analog electronics. That is the main reason Ra has such a long history
It is a common joke in surface finish circles that "RA" stands for regular army, and "Ra" is the chemical symbol for Radium; only "Ra" is the average roughness of a surface. This emphasizes that the a is a subscript. Older names for Ra are CLA and AA meaning center line average and area average..
An older means of specifying a range for Ra is RHR. This is a symbol on a drawing specifying a minimum and maximum value for Ra.
For example, the second symbol above means that Ra may fall between 10 µin and 20
Rpq, Rvq, Rmq
Material Probability Curve Parameters
Notes:
1: ASME B46.1-1995 2: ASME B46.1-1985 3: ISO 4287-1997 4: ISO 4287/1-1984 5: ISO 13565-1996
The average roughness, Ra, is an integral of the absolute value of the roughness profile. It Is the shaded area divided by the evaluation length, L. Ra is the most commonly used roughness parameter.
Older drawings may have used this notation to express an allowable range for Ra. This notation is now obsolete.
Surface Metrology Guide - Profile Parameters

µin.
Ra is Not the End of the Story
Ra does not tell the whole story about a surface. For example, here are three surfaces that all have the same Ra, but you need no more than your eyes to know that they are quite different surfaces. In some applications they will perform very differently as well.
These three surfaces differ in the shape of the profile - the first has sharp peaks, the second deep valleys, and the third has neither. Even if two profiles have similar shapes, they may have a different spacing between features. The following three surfaces also all have the same Ra.
If we want to distinguish between surfaces that differ in shape or spacing, we need to calculate other parameters for a surface that measure peaks and valleys and profile shape and spacing. The more complicated the shape of the surface we want and the more critical the function of the surface, the more sophisticated we need to be in measuring parameters beyond Ra.
Rq - Root-Mean-Square Roughness
The root-mean-square (rms) average roughness of a surface is calculated from another integral of the roughness profile:
The digital equivalent normally used is:
For a pure sine wave of any wavelength and amplitude Rq is proportional to Ra; it's about 1.11 times larger. Older instruments made use of this approximation by calculating Rq with analog electronics (which is easier than calculating with analog electronics) and then multiplying by 1.11 to report Rq. However, real profiles are not simple sine waves, and the approximation often fails miserably. Modern instruments either digitize the profile or do not report Rq. There is never any reason to make the approximation that is proportional to Ra.
These three surfaces all have the same Ra, even though the eye immediately distinguishes their different general shapes.
Surface Metrology Guide - Profile Parameters

Rq has now been almost completely superseded by Ra In metal machining specifications. Rq still has value in optical applications where it is more directly related to the optical quality of a surface.
Rt, Rp, and Rv
The peak roughness Rp is the height of the highest peak in the roughness profile over the evaluation length (p1 below). Similarly, Rv is the depth of the deepest valley in the roughness profile over the evaluation length (v1). The total roughness, Rt, is the sum of these two, or the vertical distance from the deepest valley to the highest peak.
These three extreme parameters will succeed in finding unusual conditions: a sharp spike or burr on the surface that would be detrimental to a seal for example, or a crack or scratch that might be indicative of poor material or poor processing.
Rtm, Rpm and Rvm
These three parameters are mean parameters, meaning they are averages of the sample lengths. For example, define the maximum height for the i-th sample length as Rpi. Then Rpm is:
Similarly,
and
where Rvi is the depth of the deepest valley in the i-th sample length and Rti is the sum of Rvi and Rpi:
These three parameters have some of the same advantages as Rt, Rp, and Rv for finding extremes in the roughness, but they are not so sensitive to single unusual features.
Rymax (or Rmax) - Maximum Roughness Height Within a Sample Length
Ry and Rmax are other names for Rti. Rmax is the older American name. Ry is the newer ISO and American name. For a standard five cutoff trace there are five different values of Ry. Ry is the maximum peak to lowest valley vertical distance within a single sample length.
Surface Metrology Guide - Profile Parameters

what's it good for...
Rymax(ISO) - Maximum Ry
Rymax is an ISO parameter that is the maximum of the individual or Rmax (i.e. Rti) values.
serves a purpose similar to Rt, but it finds extremes from peak to valley that are nearer to each other horizontally.
Rz(DIN)
Rz(DIN), i.e. Rz according to the German DIN standard, is just another name for Rtm in the American nomenclature. (over five cutoffs)
What's its origin & what's it good for.
Rz(ISO) - Ten Point Average Roughness
Rz(ISO) is a parameter that averages the height of the five highest peaks plus the depth of the five deepest valleys over the evaluation length.
R3zi - Third Highest Peak to Third Lowest Valley Height
The parameter R3zi is the height from the third highest peak to the third lowest valley within one sample length.
R3z - Average Third Highest Peak to Third Lowest VaJicy Height
R3z is the average of the R3zi values:
R3z has much the same purpose as Rz except that less extreme peaks and valleys are being measured.
R3zmax - Maximum Third Highest Peak to Third Lowest Valley Height
R3zmax is the maximum of the individual R3zi values:
R3z and R3zmax are not defined in national standards, but they have found their way into many high-end instruments. They originated in Germany as a Daimler-Benz
Surface Metrology Guide - Profile Parameters

standard.
Roughness Spacing Parameters
Pc - Peak Count
Peak count is a number giving the number of peaks per length of trace in a profile. For the purpose of calculating Pc a "peak" is defined relative to an upper and lower threshold. Usually this is a single number, the "peak count threshold", the distance from a lower threshold up to an upper threshold, centered on the mean line. A peak must cross above the upper threshold and below the lower threshold in order to be counted.
Peak count is the number of peaks in the evaluation length divided by the evaluation length. (Or to be picky, by the distance from the beginning of the first peak to the end of the last peak). Pc is thus reported as [peaks/in] or [peaks/cm].
Some instruments allow the thresholds to be centered on a height that differs from the mean line. This is nonstandard but may be convenient. For example) a pair of thresholds that counts low peaks accompanied by deeper valleys may be appropriate for plateaued surfaces.
[What's it good for]
The value obtained for Pc depends quite heavily on the peak count threshold for most surfaces. The figure below shows peak count versus threshold for a ground surface and a turned surface as representative samples. For the ground surface the parameter shows no stability. For the turned surface there is a bit of flattening out at a threshold of about 40 µin, but even for this surface Pc shows a wide variation with threshold.
HSC - High Spot Count
High spot count, HSC, is similar to peak count except that a peak is defined relative to only one threshold. High spot count is the number of peaks per inch (or cm) that cross above a certain threshold. A "peak" must cross above the threshold and then back below it.
High spot count is commonly specified for surfaces that must be painted. A surface which has protrusions above the paint will obviously give and undesirable finish.
Surface Metrology Guide - Profile Parameters

Sm - Mean Spacing
Sm is the mean spacing between peaks, now with a peak defined relative to the mean line. A peak must cross above the mean line and then back below it.
If the width of each peak is denoted as Si (above), then the mean spacing is the average width of a peak over the evaluation length:
Sm is usually reported in µin or µm.
λa - Average Wavelength
The average wavelength of the surface is defined as follows:
This parameter is analogous to Sm in that it measures the mean distance between features, but it is a mean that is weighted by the amplitude of the individual wavelengths, whereas Sm will find the predominant wavelength.
λq - RMS Average Wavelength
λpc - Peak Count Wavelength
The above formula leaves in the reciprocal units of λpc. Therefore the value must ordinarily be converted from [in] to [λin] or from [cm] to [λm].
K - Randomness Factor ??? What is this?
Roughness Hybrid Parameters
∆a - Average Absolute Slope
This parameter is the average of the absolute value of the slope of the roughness profile over the evaluation length:
It is not so straightforward to evaluate this parameter for digital data. Numerical differentiation is a difficult problem in any application. Some instrument manufacturers have applied advanced formulas to approximate dz/dx digitally, but the simplest approach is to apply a simple difference formula to points with a specified spacing L/N:
Surface Metrology Guide - Profile Parameters

If this approach is used, the value of LIN must be specified since it greatly influences the result of the approximation. Ordinarily LIN will be quite a bit larger than the raw data spacing from the instrument.
[What1s it good for..]
∆q - RMS Average Slope
Lo - Actual Profile Length
One way to describe how a real profile differs from a flat line is to determine how long the real profile is compared to the horizontal evaluation length. Imagine the profile as a loose string that can be stretched out to its full length.
FIGURE
The 2-D length of a profile comes from the following equation:
As for ∆a and ∆q, the answer in a digital evaluation depends on the spacing of the points we choose to approximate dr/dx:
Lr - Profile Length Ratio
The profile length ratio, Lr, is the profile length normalized by the evaluation length:
The profile length ratio is a more useful measure of surface shape than Lo since it does not depend on the measurement length.
The larger the value of Lr, the sharper or crisper the surface profile appears and the larger the true surface area of the surface is. In some applications, particularly in coating, where good adhesion is needed, it may be desirable to have a large value of Lr, i.e. a large contact surface area.
For most surfaces Lr is only slightly larger than one and is difficult to determine accurately.
Statistical Analysis
The Amplitude Distribution Function
The amplitude distribution function (ADF) is a probability function that gives the probability that a profile of the surface has a certain height, z, at any position x. Ordinarily the ADF is computed for the roughness profile, although the texture or even primary profiles might be used in specialized applications.
Surface Metrology Guide - Profile Parameters

The ADF has a characteristic bell shape like many probability distributions. The ADF tells "how much" of the profile lies at a particular height, in a histogram sense. It is the probability that a point on the profile at a randomly selected x value lies at a height within a small neighborhood of a particular value z:
The Bearing Ratio Curve
The Bearing Ratio Curve is related to the ADF, it is the corresponding cumulative probability distribution and sees much greater use in surface finish. The bearing ratio curve is the integral (from the top down) of the ADF.
We postpone further discussion of the bearing ratio curve until a later section, after we have considered other statistical techniques that work with a profile directly or are related to the shape of the ADF.
Other names for the bearing ratio curve are the bearing area curve (this is becoming obsolete with the increase in topographical methods), the material ratio curve, or the Abbott-Firestone curve.
Statistical Parameters
Rq - Root-Mean-Square Roughness
The root-mean square average roughness, Rq, was defined earlier. We note at this point, though that is the variance of the amplitude distribution function. In this sense it is a statistical parameter that measures the width of the ADF: the wider the ADF, the larger the value of~, and the rougher the surface.
Rsk - Skewness
Skewness is another parameter that describes the shape of the ADF. Skewness is a simple measure of the asymmetry of the ADF, or, equivalently, it measures the symmetry of the variation of a profile about its mean line.
or
Surfaces with a positive skewness, such as turned surfaces have fairly high spikes that protrude above a flatter average. Surfaces with negative skewness, such as porous surfaces have fairly deep valleys in a smoother plateau. More random (e.g. ground) surfaces have a skew near zero:
Surface Metrology Guide - Profile Parameters

The skewness parameter correlates with load carrying capability, porosity, and other characteristics of surfaces produced by processes other than conventional machining. A value of Rsk greater than about 1.5 in magnitude (positive or negative) indicates that the surface does not have a simple shape and a simple parameter such as Ra is probably not adequate to characterize the quality of the surface. For example, as drawn above, each surface has about the same ~ and Rt, but the surfaces are quite different.
Note that skewness is non-dimensional. Often the skewness is denoted as "Sk" instead of Rsk.
Surfaces with a large positive skewness can cause large measurement errors when measured with skidded instruments, particularly if there is a large spacing between the spikes of the surface.
Rku - Kurtosis
Kurtosis is the last ADF shape parameter considered. Kurtosis relates to the uniformity of the ADF or, equivalently, to the spikiness of the profile.
or
PICTURES OF KURTOSIS
A reader familiar with statistics will recognize that Rq, Rsk, and Rku are related to moments of the ADF probability distribution.
The zeroth moment (average) of the roughness is zero by definition. [NOT TRUE]
is the square root of the second moment (variance). Rsk is the third moment and ~ is the fourth moment of the ADF probability distribution. In statistics, a probability distribution can be constructed from all its moments. The more moments are known, the more precisely the shape of the distribution is known.
Bearing Ratio Analysis
Background
Abbott-Firestone Curve
Bearing Area Curve
Physical Significance of the Bearing Ratio Curve
The bearing ratio curve mathematically is the integral of the amplitude distribution function. It is a cumulative probability distribution. Ordinarily, the integral is performed from the highest peak downward, so each point on the bearing ratio curve has the physical significance of showing what linear fraction of a profile lies above a certain
Surface Metrology Guide - Profile Parameters

height (compared to the ADF which tells how much of a surface lies at a given height).
Comments about shape, plateau, peaks, valleys.
Mathematics of the Bearing Ratio Curve
Mathematically the bearing ratio curve may be calculated from the ADF
...
or calculated directly from a profile:
...
Simple Bearing Ratio Parameters
tp - Bearing Ratio
The symbol tp has two meanings. First, it is used generically as the abscissa of the bearing ratio curve. It is just a percent bearing ratio. Second, tp as a parameter refers to the bearing ratio at a specified height. The most common way of specifying the height is to move over a certain percentage (the reference percent) on the bearing ratio curve and then to move down a certain depth (the slice depth). The bearing ratio at the resulting point is "tp". The purpose of the reference percent is to eliminate spurious high peaks from consideration; these will wear off in early part use. The slice depth then corresponds to an allowable roughness or to a reasonable amount of wear.
Another common way of choosing the height level for tp is as a distance up or down from the mean line of the roughness profile.
[tpa vs. tpi, unfiltered, filtered]
Htp - Bearing Height
The parameter tp is the bearing ratio at only one point. If we want to measure the roughness of the surface from the bearing ratio curve, it become appropriate to look at two points on the curve and look at the height difference between them. The bearing height is the height between two points on the bearing ratio curve at specified values of tp, tp1 and tp2 These specified values will depend on the application.
H - Swedish Height
Surface Metrology Guide - Profile Parameters

The Swedish height parameter, H, is just Htp with specific values for tp1, and tp2, namely 5% and 90%. H thus has a purpose similar to Rt, but is not as strongly influenced by occasional high peaks or deep valleys.
Waviness Profile Parameters
So far we have considered parameters derived from the roughness profile. This is by far the most common type of parameter measured. However, in some applications we may be concerned with surface texture deviations with longer wavelengths. Statistical parameters of the waviness profile may be evaluated just as they are for the roughness profile.
One major problem with evaluating waviness parameters is that a longer trace length is needed in order to have statistically significant results. There is no standard for how long is long enough or how to break the waviness into separate sample lengths as we do for roughness. Thus the following parameters do not have such a rigorous connection to sample length and filter cutoff. Usually they are evaluated for one sample length equal to the longest trace possible on a particular part with a particular instrument.
Wt - Total Waviness Height
Like Rt, Wt is the height from the lowest valley to the highest peak of the waviness profile.
[Discussion . . ]
Before digital instruments and phase-correct filtering, there was no way to compute the waviness cleanly. It was common in such a case to compute Wt by an approximation:
The worst deviation of the roughness plus the worst deviation of the waviness is approximately equal to the worst deviation of the texture or total profile. This approximation should be unnecessary with modern instruments.
Wa - Average Waviness
Another parameter used to report waviness is the arithmetic absolute average, analogous to the ubiquitous Ra.
or
Advanced Statistical and Bearing Ratio Analysis Rk Parameters
There is a significant amount of information encapsulated in the shape of the bearing ratio curve for a surface. Recent efforts in surface finish have tried to summarize that shape information in a few parameters. The Rk parameters are a simple approach where the knee-shaped BAC is approximated by a set of straight lines.
Rk Construction
The Rk construction is designed to divide the bearing ratio curve into three sections: the small peaks above the main plateaus, the plateaus themselves, and the deep valleys between plateaus.
The first step is to slide a "window" across the bearing ratio curve looking for the minimum secant slope. The window is 40% tp wide. As the window slides across the curve it intersects two points on the curve. The goal is to find the position where the slope between the two points is minimized, or since the window has constant width, where the height Htp between the two points is minimized. Following are shown three steps in the process.
Surface Metrology Guide - Profile Parameters

Once the window with minimum secant slope is found, a fairly complicated construction begins. In the figure below we have found the minimum slope window and the points A and B where the window intersects the bearing ratio curve. Next draw a line through these two points to find the intercepts at 0% and 100%, points C and D. The vertical height between C and D is the first parameter, Rk. Draw a horizontal line across from C to the bearing ratio curve, point E. Find the area below the bearing ratio curve and above the line CE, shown shaded in the upper part of the figure. Next, compute Rpk as the height of triangle CEG which has the same area as the shaded area. For the valleys draw a horizontal line from D over to point F on the curve. Compute the area of the air space below line DF and above the bearing ratio curve (shown shaded in the lower part of the figure). Next compute the height, Rvk, of triangle DFH which has the same area as the shaded region.
Surface Metrology Guide - Profile Parameters

Rk
The parameter Rk is the vertical height between the left and right intercepts of the - line through the ends of the minimum Htp 40% window.
Rk correlates with the depth of the working part of the surface, the flat part of the bearing area curve. After the initial running in period (i.e. after the peaks represented by Rpk are worn down), this part of the surface carries the load and most closely contacts the mating surface. Sometimes this part of the surface is called the "core roughness" or the "kernel" (hence the k subscript).
Rpk
Rpk is an estimate of the small peaks above the main plateau of the surface. These peaks will typically be worn off (or down) during the run-in period for a part. Generally, it would be desired to have a fairly small Rpk.
Rvk
Rvk is an estimate of the depth of valleys which will retain lubricant in a funtioning part.
MR1
MR1 is the fraction of the surface which consists of small peaks above the main plateau.
MR2
MR2 is the fraction of the surface which will carry load during the practical lifetime of the part. Alternatively, 100%-MR2 is the fraction of the surface that consists of deeper valleys that will retain lubricant.
A1
The "area" of the peak portion of the bearing ratio curve is denoted by A1. It is related to Rpk and MR1:
A2
The "area" of the valleys in the Rk construction is denoted by A2. It is related to Rvk and MR2:
A2 is also called Vo, the oil retention "volume" of the surface.
Gaussian Probability Scale
Surface Metrology Guide - Profile Parameters

Gaussian Probability Parameters
The Gaussian probability scale linearizes the cumulative Gaussian distribution. The slope of the line is Rq.
.
Surface Metrology Guide - Profile Parameters
Surface Metrology Guide
Advanced Statistical and Frequency Analysis
Power Spectral Density Function
The power spectral density function is [PUT THIS IN TERMS OF WAVELENGTH] (10.1.1) In practice the Fourier transform is done by FFT, so the frequency, f; corresponds to a
Autocorrelation
Autocovariance
...
The autocovariance is, mathematically; a convolution of the profile with itself:
(10.2.1)
In discrete form, for a finite profile, taking into to consideration that there are fewer and fewer overlapping points as the shift distance increases, the autocorrelation function may be calculated as
(10.2.2)
The autocorrelation function may be calculated more efficiently by taking the Fourier transform of the power spectral density function:
Autocorrelation
The autocorrelation function is simply a normalized version of the autocorrelation function. It is the autocorrelation function normalized to be one at ∆x = 0.
(8.4.1)
We have noted above that the mean square roughness, Rq2, is equal to the zero shift value of the autocovariance.
The autocorrelation function ranges from 1, meaning perfect correlation to 1, meaning perfect correlation with the inverted, shifted profile. The autocorrelation function is independent of the profile amplitude. Therefore it is more useful than the autocovariance in comparing the shape of two different profiles.
Correlation Length and Correlation Wavelength
A simple parameter calculated from the autocorrelation function is the correlation length, ∆x0, the largest shift distance ∆x with a particular ACF value. In other words, the correlation length is the shift length needed for the correlation between two points to always fall below a certain value. Typical values used to define the correlation length are ACF lIe = 36.8% or ACF = 10%.
For periodic surfaces, one might choose ACF = 0% and look for the first zero crossing Another approach is to define λw, the correlation wavelength, the wavelength of the dominant periodic component in the profile. This value corresponds to the shift distance, ∆x> 0, where the ACF is maximized.
Autocorrelation and Surface Shape
Mathematical Nomenclature
English Symbols
C capacitance in an electrical circuit
i refers to the i-th sample length in an evaluation length
j imaginary number; square root of-I
Surface Metrology Guide - Advanced Analysis
References
Hu Amstutz, Surface Texture: The Parameters, Sheffield Measurement Division. Michael Brock, "Fourier Analysis of Surface Roughness," Bruel & Kjaer Instruments, Technical Review, No. 3, 1983.
Bill Grant and Mark Malburg, Cummins Engine Company, Personal Communications, 1992.
ISO Standard 1879, "Instruments for the Measurement of Surface Roughness by the Profile Method - Vocabulary," 1981.
ISO Standard 4287/1, "Surface Roughness - Terminology - Part 1: Surface and Its Parameters," 1984.
ISO Standard 4287/2, "Surface Roughness Terminology - Part 2: Measurement of Surface Roughness Parameters," 1984.
Leigh Mummery, Surface Texture Analysis - The Handbook, Hommelwerke, 1990.
T.V. Vorburger and 3. Raja, "Surface Finish Tutorial", NJSTIR 89-4088.
M the number of sample lengths in an evaluation length (almost always 5)
n refers to the n-th individual point in a digitized trace
N the number of digitized points in a profile
r the roughness profile height
R Roughness. When subscripted refers to a roughness height parameter.
R resistance in an electrical circuit
V voltage
w the waviness profile height
W Waviness. When subscripted refers to a waviness height parameter.
x coordinate in the direction of travel of a stylus of other measuring transducer.
y coordinate
z "height' of a surface at a particular (x,y) or traced profile height
Greek Symbols
λ wavelength
λc cutoff wavelength
.
Surface Metrology Guide - Advanced Analysis

Surface Metrology Guide
Surface Metrology Standards
ISO Standards
ISO Technical Committee 213 (TC 213) is responsible for establishing standards for Geometrical Product Specifications (GPS), including surface texture. The committee has its own web site at www.ds.dk/isotc213. Some of the information given below was compiled from this site.
Current ISO Standards
Standards under Preparation
Withdrawn ISO Standards
ISO Standards US Standards Other Related Standards Obtaining Standards
ISO 4288:1996; Geometrical product specifications (GPS) - Surface texture: Profile method - Rules and procedures for the assessment of surface texture Replaces ISO 4288:1985 ISO 12085:1996; Geometrical Product Specifications (GPS) - Surface texture: Profile method - Motif parametersISO 3274:1996; Geometrical Product Specifications (GPS) - Surface texture: Profile method - Nominal characteristics of contact stylus instruments Replaces ISO 1880:1979 and ISO 3274:1975 ISO 11562:1996; Geometrical Product Specifications (GPS) - Surface texture: Profile method - Metrological characteristics of phase correct filtersISO 13565-1:1996; Geometrical Product Specifications (GPS) - Surface texture: Profile method; Surfaces having stratified functional properties - Part 1: Filtering and general measurement conditionsISO 13565-2:1996; Geometrical Product Specifications (GPS) - Surface texture: Profile method; Surfaces having stratified functional properties - Part 2: Height Characterization using the linear material ratio curveISO 4287:1997; Geometrical Product Specifications (GPS) - Surface texture: Profile method - Terms, definitions and surface texture parameters Replaces ISO 4287-1:1984ISO 5436:1985 Calibration specimens - Stylus instruments - Types, calibration and use of specimens Watch for revisions and expansion of this standardISO 1302:1994; Technical Drawings - Method of indicating surface texture. Watch for revisions ISO/TR 14638:1995 Geometrical product specification (GPS) -- Masterplan This is an ISO Technical Report (TR) not an ISO Standard
ISO DIS 5436-1; Geometrical product specifications (GPS) - Surface texture: Profile method; Measurement standards - Part 1: Material measuresISO CD 5436-2; Geometrical Product Specifications (GPS) - Surface texture: Profile method - Calibration - Part 2: Soft gaugesISO CD 1302; Geometrical Product Specifications (GPS) - Indication of Surface textureISO DIS 12179; Geometrical product specifications (GPS) - Surface texture: Profile method - Calibration of contact (stylus) instrumentsISO FDIS 8785; Geometrical product specifications (GPS) - Surface imperfections - Terms, definitions and parametersISO/DIS 13565-3; Geometrical Product Specifications (GPS) - Surface texture: Profile method stratified functional properties - Part 3: Height characterization using the material probability curveISO/DIS 10479; Surface waviness - Vocabulary
ISO 1880:1979; Instruments for the measurement of surface roughness by the profile method - Contact (stylus) instruments of progressive profile transformation - Profile recording instruments Replaced by ISO 3274:1996 by 1996-12-01. ISO 2632-1:1985; Roughness comparison Specimens - Part 1: Turned, ground, bored, milled, shaped and planed No replacement. Withdrawn by 1997-03-27. ISO 2632-2:1985; Roughness comparison Specimens - Part 2: Spark-eroded, shot-blasted and grit-blasted, and polished No replacement. Withdrawn by 1997-03-27. ISO 3274:1975; Instruments for the measurement of surface roughness by the profile method - Contact (stylus) instruments of consecutive profile transformation - Contact profile meter, system M Replaced by ISO 3274:1996 by 1996-12-01. ISO 4287-1:1984; Surface roughness - Terminology - Part 1: Surface and its
Surface Metrology Guide - Standards

ASME Standards
The ASME B46 committee (Classification and Designation of Surface Qualities) is responsible for establishing American standards on surface texture measurement. The committee meet twice a year (in spring and fall). Contact current ASME B46 secretary for meeting schedules and other B46 businesses.
Current Standards
Standards under Preparation
Other Related Standards
(ASTM, ISO 172 on power spectral density function)
Obtaining Standards Documents
parameters Replaced by ISO 4287:1997 by 1997-04-01. ISO 4287/2:1984; Surface roughness - Terminology - Part 2: Measurement of surface roughness parameters No replacement. ISO 4288:1985; Rules and procedures for the measurement of surface roughness using stylus instruments Replaced by ISO 4288:1996 by 1996-08-15.
ASME B46.1-1995; Surface Texture (Surface Roughness, Waviness, and Lay). Revision of ANSI/ASME B46.1-1995
Terms Related to Surface TextureClassification of Instruments for Surface Texture MeasurementTerminology and Measurement Procedures for Profiling, Contact, Skidless InstrumentsMeasurement Procedures for Contact, Skidded InstrumentsMeasurement Techniques for Area ProfilingMeasurement Techniques for Area AveragingFiltering of Surface ProfilesSpecification and Procedures for Precision Reference SpecimensSpecification and Procedures for Roughness Comparison Specimens
ASME Y14.36M-1996; Surface Texture Symbols.
Fractal analysisNanometer surface texture & step height measurements by stylus profiling instrumentsFunctional correlationComputation surface metrology
standard data file formatalgorithm verificationetc. etc.
3D surface metrology
American National Standards Institute (ANSI) and NSSNThe American Society of Mechanical Engineers (345 E. 47th Street, New York, NY 10017; Tel: 1-800-THE-ASME)Your favourite engineering librariesOther commercial document handlers
Information Handling Services (IHS)Document CenterCustom Standards Services, Inc.
.