comprehensive bicycle master plan - city of phoenix … · the adoption of a comprehensive bicycle...
TRANSCRIPT

COMPREHENSIVEBICYCLE MASTER PLAN
Final Draft ReportAugust 2014
PREPARED BY IN ASSOCIATION WITH


AcknowledgementsCITY COUNCIL
Mayor Greg Stanton
Councilwoman Thelda Williams .......................................................................................................... District 1
Vice Mayor Jim Waring .......................................................................................................................... District 2
Councilman Bill Gates ........................................................................................................................... District 3
Councilwoman Laura Pastor ............................................................................................................... District 4
Councilman Daniel Valenzuela ............................................................................................................. District 5
Councilman Sal DiCiccio ...................................................................................................................... District 6
Councilman Michael Nowakowski ..................................................................................................... District 7
Councilwoman Kate Gallego ............................................................................................................... District 8
TECHNICAL ADVISORY COMMITTEEWylie Bearup ....................................................................................City of Phoenix - Street Transportation
Ray Dovalina ......................................................................................City of Phoenix - Street Transportation
Tom Godbee ..................................................... City of Phoenix - Street Transportation - Traf c Services
Scott Logan ........................................................ City of Phoenix - Street Transportation - Traf c Services
Kerry Wilcoxon ....................City of Phoenix - Street Transportation - Safety Neighborhood Traf c
Joseph Perez ..........................City of Phoenix - Street Transportation - Safety Neighborhood Traf c
Matthew Heil .................................. City of Phoenix - Street Transportation - Public nformation f ce
Shane Silsby ..................................... City of Phoenix - Street Transportation - Planning & Development
Mark Melnychenko ............................City of Phoenix - Street Transportation - Environmental Services
Jim Baker ................................................................City of Phoenix - Street Transportation - Traf c Signals
Mani Kumar ................City of Phoenix - Street Transportation - CIP/Development Technical Services
Matt Giordano ..............................................................................................................City of Phoenix - Police
*Marcus Virgil ................................................................................................................ City of Phoenix - Police
Jeremy Stapleton........ City of Phoenix - Environmental Quality Committee & Bicycle Subcommittee
Albert Santana ................................................................................. City of Phoenix - City Manager s f ce
Phil McNeely ................................................................................................. City of Phoenix - Mayor s f ce
Colin Tetreault .............................................................................................. City of Phoenix - Mayor s f ce
Dean Zattair .............................................................................................................. City of Phoenix - Aviation
Eric Johnson...................................................... City of Phoenix - Community & Economic Development
*Jeremy Legg ..................................................... City of Phoenix - Community & Economic Development
Inger Erickson ...................................................................................... City of Phoenix - Parks & Recreation
Jarod Rogers ......................................................................................... City of Phoenix - Parks & Recreation
Jon Brodsky .......................................................................................... City of Phoenix - Parks & Recreation
Katherine Coles ........................................................ City of Phoenix - Planning & Development Services
Lysistrata Hall ....................................................... City of Phoenix - Neighborhood Services Department
Amanda Luecker ..................................................................Valley Metro Regional Public Transit Authority
Ray Cabrera ...................................................................................................Downtown Phoenix Partnership
Abigail Williams ................................................................Arizona Department of Administration (ADOA)

THIS PAGE IS INTENTIONALLY LEFT BLANK

AcknowledgementsTECHNICAL ADVISORY COMMITTEE (cont.)
David Oihus ......................................................................Arizona Department of Administration (ADOA)
Mike Sanders .................................................................... Arizona Department of Transportation (ADOT)
Maureen DeCindis ..............................................................Maricopa Association of Governments (MAG)
Eric Iwersen ..................................................................................................................................... City of Tempe
James Hash ........................................................................................................................................ City of Mesa
Jude Nelson ..................................................................................................... Arizona State University (ASU)
*attended TAC meeting in place of TAC member
PEDESTRIAN AND BIKING AD HOC TASK FORCESuzanne Day .................................................................................................................District 1 representative
Bob Pane .......................................................................................................................District 2 representative
Leslie Dornfeld ............................................................................................................District 3 representative
Lisa Parks ......................................................................................................................District 4 representative
Haley Ritter ..................................................................................................................District 5 representative
Susan Bookspan ...........................................................................................................District 6 representative
Libby Coyner ................................................................................................................District 7 representative
Gene Holmerud ..........................................................................................................District 8 representative
Bob Boschee ............................................................................................................................At-Large Member
Erika Keenan ............................................................................................................................At-Large Member
Edward Jensen ..........................................................................................................................At-Large Member
Feliciano Vera .................................................................................................................Chair, At-Large Member
CONSULTANT TEAMJim C. Lee, PhD, PE, PTOE .........................................................................................................Lee Engineering
Michael J. Cynecki, PE .................................................................................................................Lee Engineering
Yung Koprowski, PE, PTOE ........................................................................................................Lee Engineering
RJ Eldridge............................................................................................................................ Toole Design Group
Jim Elliott, AICP ................................................................................................................... Toole Design Group
Terri Musser .......................................................................................................................... Charlier Associates
The consultant team is grateful for the important input and guidance from the Ad Hoc Task Force, and the Technical Ad isor ommittee TA mem ers The authors of this report ould like to speci call acknowledge substantial contributions to the report by Ad Hoc Task Force Chair Feliciano Vera and Members Leslie Dornfeld and Libby Coyner. The Consultant Team also wishes to acknowledge the review and assistance provided by City of Phoenix Street Transportation employees, particularly the contributions of Thomas Godbee, Scott Logan, Kerry Wilcoxon, and Joseph Perez.

THIS PAGE IS INTENTIONALLY LEFT BLANK

MAKING CONNECTIONS
7
Executive Summary ...........................................................................................................................1
Chapter 1 - Bene ts of a Bicycle Friendly Community .............................................................7
Chapter 2 - How to Use This Plan ...............................................................................................11
Chapter 3 - Plan Vision & Areas of Excellence ..........................................................................15
Chapter 4 - Past & Present ............................................................................................................19
Chapter 5 - Policies & Perceptions ..............................................................................................31
Chapter 6 - Opportunities & Investments .................................................................................39
Chapter 7 - E uity & Ef ciency .....................................................................................................63
Chapter 8 - Safety ............................................................................................................................65
Chapter 9 - Design & Connectivity .............................................................................................73
Chapter 10 - Connections & Collaboration ..............................................................................99
Chapter 11 - Bikes & Transit ....................................................................................................... 109
Glossary of Terms & Acronyms
Appendix A - Community Outreach
Appendix B - Bicycle Counts
Appendix C - Maricopa County Trip Reduction Latent Demand Maps
Appendix D - Detailed Assessment of Existing Policies, Practices and Procedures for Traf c Control and Bicycle Facility Design
Appendix E - Prioritization Methodology
Appendix F - Planning Level Unit Cost Estimates
Appendix G - Tier I Corridor Projects
Appendix H - Tier II Corridor Projects
Appendix I - Tier III Corridor Projects
Appendix J - Draft City Ordinance to Preclude Bicyclists from Riding Against Traf c On Sidewalks
Appendix K - Bicycle Parking

THIS PAGE IS INTENTIONALLY LEFT BLANK

MAKING CONNECTIONS
1
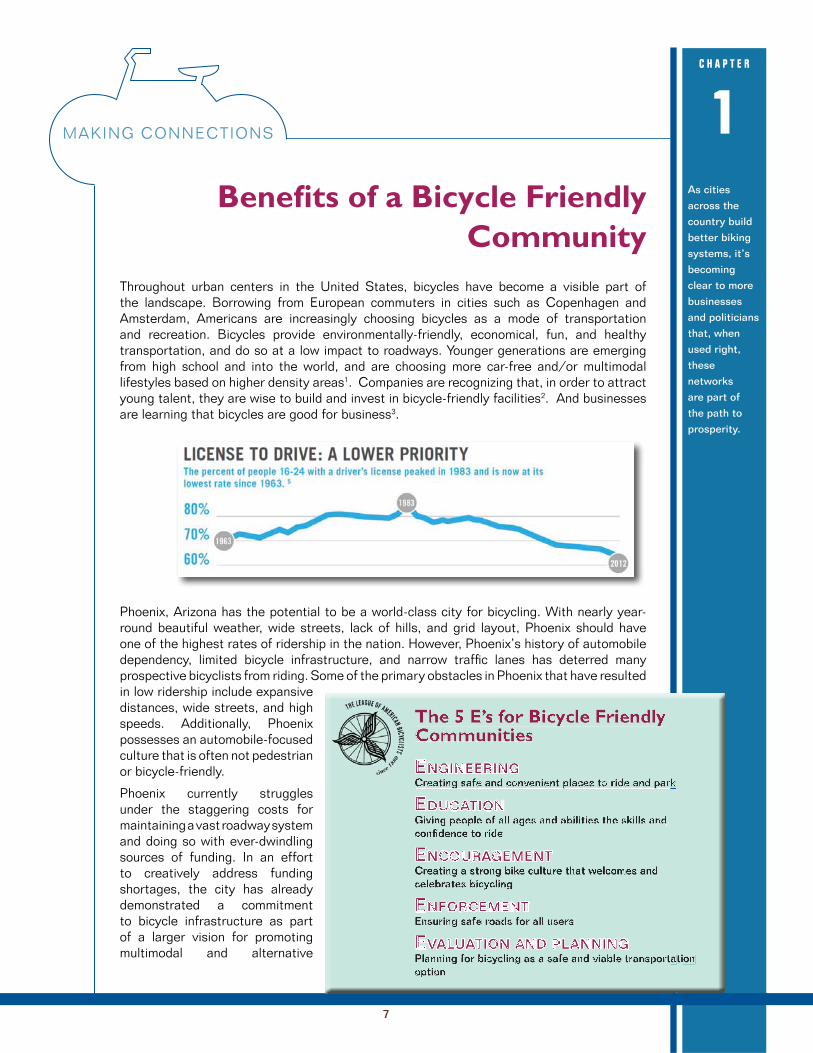
Throughout urban centers in the United States, bicycles have become a visible part of the landscape. Borrowing from European commuters in cities such as Copenhagen and Amsterdam, Americans are increasingly choosing bicycles as a mode of transportation and recreation. Bicycles provide environmentally-friendly, economical, fun, and healthy transportation, and do so at a low impact to roadways. Younger generations are emerging from high school and into the world, and are choosing more car-free and/or multimodal lifestyles based on higher density areas. Companies are recognizing that, in order to attract young talent, they are wise to build and invest in bicycle-friendly facilities. Businesses are learning that bicycles are good for business.
Phoenix, Arizona has the potential to be a world-class city for bicycling. With nearly year-round beautiful weather, wide streets, lack of hills, and grid layout, Phoenix should have one of the highest rates of ridership in the nation. However, Phoenix’s history of automobile dependency, limited bicycle infrastructure, and narrow traf c lanes has deterred many prospective bicyclists from riding. Some of the primary obstacles in Phoenix that have resulted in low ridership include expansive distances, wide streets, and high speeds.
Phoenix currently struggles under the staggering costs for maintaining a vast roadway system and doing so with ever-dwindling sources of funding. In an effort to creatively address funding shortages, the city has already demonstrated a commitment to bicycle infrastructure as part of a larger vision for promoting multimodal and alternative transportation. This document identi es ways that the City of Phoenix can aim to achieve excellence in the ve essential elements of bicycle-friendly communities, or the Five Es . By focusing on these ve areas, the City of Phoenix has the potential to become a League of American Bicyclists Platinum Bicycle-Friendly Community.
CreCreatiating ng safsafe ae and nd conconvenvenienient pt placlaces es to to ridride ae and nd parparkk
GGPlaPlanninning ng forfor bi bicyccyclinling ag as as a sa safe fe andand vi viablable te tranransposportartatiotion on optiptionon
The 5 E’s for Bicycle Friendly The 5 E’s for Bicycle FriendlyCCommunitiesCommunities
EEEEEEEEN GGGGNRRRREENGGGGGGNGGGG EEEENNNNIINNNN RRRRRRGGGGGGGG NN RRRRRRRRRRRGGGGNNNNGGGGIIIINNNNEEEEEEEERRRR GGGGNNNNII GGGGGGGGGGGGNGGGGGGIIIINNNNGGGGGCreCreatiating ng safsafe ae and nd conconvenvenienient pt placlaces es to to ridride ae and nd parparkkCreCreatiating ng safsafe ae and nd conconvenvenienient pt placlaces es to to ridride ae and nd parparkk
EEEEEEEEED C NOOOOTTATACACCUCCDDUUUUDDDDDDDDDDDD CCCCUUUUCC OOOOOOOOAA IIIITT OOUUUU ACCCC OOUUUUCCCCCAAAATAATTIIOOOOONNNNNNNNNN
EEEEEEE TTTNEEMMEEGGGGGAGGARRUOUUOUUCOCCOCCNCCCC GGGGUUUURARCCOOOOOOOO AA MMMMMMMMEENNNN RRRRRRRROOOUUUU GG MGGAAN RRRRRRRRRR GGGGCCCC MMMMOONNNNCCCCOOOOUUUURRRRAAARAGGGGGEEMM NNNNEENEENNNNTTTTCreCreatiating ng a sa strotrong ng bikbike ce cultultureure th that at welwelcomcomes es andand ce celeblebratrates es bicbicyclyclingingCreCreatiating ng a sa strotrong ng bikbike ce cultultureure th that at welwelcomcomes es andand ce celeblebratrates es bicbicyclyclinging
EEEEE TTNNEEMMMMEECCRCRCRROOFOFNN CCCCCCCCOOOOOOOO MMMMMMEEFFNNNN RRRRRROOO MN RRRRRRRRCCCC MMMMONNNNFFOOOORRRRCCCCCEEEMMMMM NNNNEENEENNNNTTTTEnsuring safe roads for all users EnsEnsuriuring ng safsafe re roadoads fs for or allall us usersers EnsEnsuriuring ng safsafe re roadoads fs for or allall us usersers
EEEEEEEE GGGGGGGGNNNAAAPPD NAAA ANOOOOTTATATAAUAULUUUUAAAVAVAVVA UUUU OOOOVV OOOO AAAAAA DDNNNNNNNNIITTLL DDVV OOUUU DV AAAAAA NNOVVVAVAAAVAVALLLLUUUUAAATATATTIIIIOOOONNNN AAAANNNNDDDD LAAA NNNNIINNNNNNNNLLPPPP AA NNNPPPPPPPPPPLLLLAAAANNNNNNNNIIIINNNNGGGGGGGGGGGGGGGGGGGGGGGGGGGPlaPlanninning ng forfor bi bicyccyclinling ag as as a sa safe fe andand vi viablable te tranransposportartatiotion on optiptiononPlaPlanninning ng forfor bi bicyccyclinling ag as as a sa safe fe andand vi viablable te tranransposportartatiotion on optiptionon

2
This planning document will set the course for the next 20 years for the development, growth and connectivity of bicycle facilities in Phoenix. This plan is intended to provide a framework for decision-making to greatly expand and improve bicycling facilities within Phoenix. These facilities are to make it safer and easier for bicyclists to travel throughout the city and make connections to adjacent communities as a part of the regional bicycle transportation network. The intent of the plan is to identify speci c actions for Phoenix to take, along with an implementation schedule, and provide uanti able outcomes to measure the success in meeting
the goals of the plan.
The Phoenix Bicycle Master Plan is a comprehensive and collaborative effort that had considerable input from numerous city departments. While this plan was developed under the direction of the Street Transportation Department and the Phoenix Bicycle Coordinator, considerable input was also provided by the Police, Planning and Development Services, Parks and Recreation, and Transit Departments. The lead consultant for this project is Lee Engineering, LLC, along with substantial guidance and support from subconsultants Charlier Associates, Inc. and Toole Design Group.
Even though this is a 20-year plan, it is fully recognized that this plan may be updated periodically during the 20-year planning horizon to re ect changes in the community.
Bicycling promotes a healthy lifestyle, has an extremely small carbon footprint, and requires much less infrastructure or space for travel and parking compared to motor vehicle transportation. Currently, Phoenix lacks a comprehensive bicycle network that is fully connected with the community and other transportation networks (transit, airports). While over 700 miles of bicycle facilities exist within Phoenix along with 42 bicycle and pedestrian bridges/tunnels, the 596 on-street bicycle facility miles represents only a small fraction of the nearly 5,000 miles of street network in the city. Many of the bike facilities are not connected with other bicycle facilities or important destinations such as schools, universities, employment centers, shopping centers, transportation centers, or recreation facilities within Phoenix or in adjacent communities.
A comprehensive and connected bicycle network will promote a healthier community and healthy transportation alternative for residents and visitors. This network and innovations such as bike share programs can greatly expand the number of bicyclists while helping to eliminate the demand for vehicle travel.
The Bicycle Master Plan is intended to make Phoenix a part of the regional bicycle network throughout the metropolitan area. Bicycle facilities should not end at the city limits and instead should connect to facilities in adjacent cities to provide access to destinations in adjacent communities for Phoenix residents and visitors. Furthermore, residents of adjacent communities should have good access to a multitude of destinations or recreational routes within Phoenix.
The Bicycle Master Plan provides new policies for bicycle facility design as well as a framework for implementation of those facilities. These policies include the design of facilities, traf c control practices and proposals for facilities at destinations, such as parking or shower facilities.
The adoption of a comprehensive bicycle master plan will allow Phoenix to better compete for funding either through the Federal Government, when funding opportunities become available, or through the Maricopa Association of Governments (MAG). Since much of the transportation infrastructure is built by private developers, this plan will help to ensure bicycle facilities are constructed at the time parcels or site plans are developed.
In short, a comprehensive bicycle master plan will help make Phoenix an even better place to live, work and play.
The Bicycle Master Plan is guided by the following Vision, developed by the Technical Advisory Committee and Ad Hoc Task Force and informed by community ideas.
This plan establishes direction to transform the City of Phoenix into a bicycle-friendly community over the next 20 years. The goal is to systematically improve levels of bicycle friendliness, as de ned by the League of American Bicyclists’ Bicycle Friendly Communities program.

3
To achieve the Vision, seven areas of excellence necessary to a Platinum-level Bicycle Friendly Community were established. Each Area of Excellence is a focus of this plan and organized into Chapters 5 through 11. To help the City succeed in each of these areas, this plan includes a speci c goal for each Area of Excellence and recommends strategies, actions, and objectives at the end of each chapter.
Policies and Perceptions focus on the level of consideration given by the City in planning for bicycles and providing a safe, comfortable and accessible cycling environment in Phoenix.
GOAL: A strong bike culture will be the norm, not the exception, as re ected in
government organization, community, and individual actions. Public policy will be connected with the desire to have more people riding bikes more often. Bicycling will be easy, safe, convenient, fun, and an accepted mode of transportation and recreation.
STRATEGIES: Review and update of City policies, procedures, codes, ordinances, guidelines,
and standards to promote bicycle safety and facilities.
Achieve Platinum-level Bicycle Friendly Community Status from the League of American Bicyclists.
Broaden the responsibility for creating a bicycle-friendly community among engaged and impacted City Departments.
Strengthen regional transportation planning coordination with state and regional governmental agencies and public services providers.
As part of this planning process, bike corridors were prioritized based on a variety of factors. From this list, a series of bicycle facility improvements were recommended. This Area of Excellence identi es implementation and funding strategies for these facilities.
GOAL: Investments made for bicycling will be smart, focused, and equitable. The city
will leverage existing assets and create partnerships with local, county, and state agencies to build out the bicycle infrastructure network.
STRATEGIES: Successfully complete top priority projects on ranked project list.
Increase amount of funding dedicated to the bicycle program including infrastructure, amenities, and education.
Seek State and Federal funding through the Maricopa Association of Governments (MAG) to assist with implementation of large and dif cult projects.
This Area of Excellence ensures that the City and its neighborhoods are accessible by bicycle, and that bicycle facilities are safe, fun, and convenient throughout Phoenix.
GOAL: The City’s bicycle network will connect neighborhoods with each other and into
downtown Phoenix. Bicycling will be a safe, fun, and convenient transportation option to access schools, parks, shopping, work, and community centers in all parts of the City.

4
STRATEGIES: Account for social equity when identifying and prioritization bicycle infrastructure
improvement projects
Provide continuous transportation facilities for all modes along corridors.
Safety is a paramount consideration for implementing bicycle facilities in the City of Phoenix. It is also the number one criteria for federal funding of transportation programs, which require performance-based and data-driven processes for developing and implementing projects. This Area of Excellence provides a ve-year review of bicycle crashes in the City and discusses how Complete Streets increase safety for all road users.
GOAL: Bicycling will be a safe transportation and recreation option. Streets will be
designed and retro tted to safely accommodate all modes. People on bikes will understand bicycling rules of the road through proper facility
design and safety education, Bicycling will be safer by promoting accountability and responsible attitudes of all road users.
STRATEGIES: Update the City of Phoenix Website
Provide Training for Transportation Professionals and Police Of cers.
Enhance driver education.
Enhance Bicyclist Education
Promote Bicycle Events
Evaluate bicyclist safety and education regularly
Signi cantly reduce bicycle related crashes where a cyclist riding against traf c on the sidewalk and colliding with a motor vehicle exiting a private drive or side street.
Because they are an important mode of transportation to provide connectivity, bicycle routes are located along existing arterial and collector streets and included in plans for new streets. This Area of Excellence focuses on ensuring the bicycle network is continuous so that it functions as a viable transportation mode. This section also includes a discussion of bicycle facility design, ensuring that the right facility is used in the appropriate location.
GOAL: People on bikes will be able to share transportation facilities with motor
vehicles and easily cross roadways. Missing gaps in the bicycle network will be completed.
STRATEGIES: Retro t arterial and collector streets to meet commuting needs and utilize
signalized intersections, while minimizing the need to ride on the most heavily-traf cked major arterial routes.
Provide way nding for bicyclists throughout the City
Update City of Phoenix guidelines addressing bicycle facility design and traf c control

5
This section recognizes off-street and recreational routes as an integral piece of the regional bicycle system. Phoenix residents work and recreate throughout the region; and residents from outside Phoenix come to the City for the same reasons. This Area of Excellence discusses the opportunities for collaboration and partnerships with Salt River Project and adjoining cities to enhance regional bicycle connectivity and access..
GOAL: The City of Phoenix will be connected to bikeways, shared use paths, andtrails within Phoenix and in adjoining communities to provide longer-distancerecreation and commuting opportunities. This mix of facility types will provide avariety of comfortable travel options for all ages, abilities, and travel purposesthrough the promotion of loops and links.
STRATEGIES:
Every transit user is a pedestrian or bicyclist at some point on their trip. Public transit operates as a key part of the region’s multimodal transportation system, working in tandem with walking, bicycling, and driving modes to provide commuters with multiple transportation choices. This Area of Excellence highlights multimodal initiatives and opportunities for bike-transit integration..
GOAL: Commuting by public transportation will be a seamless and ef cient choice forcyclists. Completing the rst and last 2.5 miles of a transit trip will be easy toaccomplish on a bike as modes will be fully integrated.
STRATEGY:Encourage bike integration with the overall transit system.

THIS PAGE IS INTENTIONALLY LEFT BLANK
MAKING CONNECTIONS
7
As cities
across the
country build
better biking
systems, it’s
becoming
clear to more
businesses
and politicians
that, when
used right,
these
networks
are part of
the path to
prosperity.
C H A P T E R
1
CoThroughout urban centers in the United States, bicycles have become a visible part of the landscape. Borrowing from European commuters in cities such as Copenhagen and Amsterdam, Americans are increasingly choosing bicycles as a mode of transportation and recreation. Bicycles provide environmentally-friendly, economical, fun, and healthy transportation, and do so at a low impact to roadways. Younger generations are emerging from high school and into the world, and are choosing more car-free and/or multimodal lifestyles based on higher density areas1. Companies are recognizing that, in order to attract young talent, they are wise to build and invest in bicycle-friendly facilities2. And businesses are learning that bicycles are good for business3.
Phoenix, Arizona has the potential to be a world-class city for bicycling. With nearly year-round beautiful weather, wide streets, lack of hills, and grid layout, Phoenix should have one of the highest rates of ridership in the nation. However, Phoenix’s history of automobile dependency, limited bicycle infrastructure, and narrow traf c lanes has deterred many prospective bicyclists from riding. Some of the primary obstacles in Phoenix that have resulted in low ridership include expansive distances, wide streets, and high speeds. Additionally, Phoenix possesses an automobile-focused culture that is often not pedestrian or bicycle-friendly.
Phoenix currently struggles under the staggering costs for maintaining a vast roadway system and doing so with ever-dwindling sources of funding. In an effort to creatively address funding shortages, the city has already demonstrated a commitment to bicycle infrastructure as part of a larger vision for promoting multimodal and alternative
The 5 E’s for Bicycle Friendly The 5 E’s for Bicycle Friendly The 5 E’s for Bicycle Friendly CommunitiesCommunities
EEEEEEE GGGNRRRREENGGGGGGGN GGGGGGGG IIIIIIII NNNNEEEENNNNNNNN RRRRRR GGGGGGGG GGGGGGGG NN NRRRRRRRRRR GGGG GNNNNGGGGIINNNNEEEERRRRIINNNNGGGGCreCreatiating ng safsafe ae and nd conconvenvenienient pt placlaces es to to ridride ae and nd parparCreCreatiating ng safsafe ae and nd conconvenvenienient pt placlaces es to to ridride ae and nd parparkkkk
EEEEEEEED NNOOOOTATACACCUCUCDUUDUUCCCCUUUUCCCC OOOOOOOOAAAADD IIIITTDDDD OOOUUUUDD ACCCC OOOODDDDUUUUCCCCATAATTIIOOOONNNNNNNNNGivGivinging pe peoplople oe of af all ll ageages as and nd abiabilitlitiesies th the se skilkills ls andandGivGivinging pe peoplople oe of af all ll ageages as and nd abiabilitlitiesies th the se skilkills ls andand
EEEEEEE TTNEMMMEGGGGGAGGARRRRUUOUUOUUCOCCCOCCNCCCC UUUURARCCCCOOOOOOOONNNN RRRRRROOUUUURRN RRRRRRRRRRRRCCCCOOONNNNCCCCOOOOUUUURRRR GGGGAA MMMMMMMMEEGG MAGGGG MMMMAAGGGGGEEMMMM NNNNEENEENNNNTTTTCreCreatiating ng a sa strotrong ng bikbike ce cultultureure th that at welwelcomcomes es andandCreCreatiating ng a sa strotrong ng bikbike ce cultultureure th that at welwelcomcomes es andandcelcelebrebrateates bs bicyicycliclingngcelcelebrebrateates bs bicyicycliclingng
EEEEEEE TTNEMMECCRCRCRROOFOON OOOOOOOOFFNNNN RRRRRROON RRRRRRRRRRRROOOONNNNFFOOOORRRRRRCCCCCCCC MMMMMMMMEECEMCCC MMMMCCCCCEEMMM NNNNEENEEENNNNTTTTEnsEnsuriuringng safsafe re roadoads fs for or allall us usersers EnsEnsuriuringng safsafe re roadoads fs for or allall us usersers
EEEEEEEE GGGGNNNAAPD DNAA ANOOOTATAUAULUUUUAAVAVV LAUUUU OOOOVV OOOO AAAAAAAAAAAAAAAA DDII LLNNNNNNNNLL TTTT PPDDDDVV OOOUUUU DDV AAAA NN PPPPPPOOOVVAVAVAVALLUUUUAAATAATTIIOOOONNNN AAANNNNDDDD PPPPLLAA GGGGIINNNNNNNNNNNN GGGGNNINGGNN GGGGGGGGGNNNNNNNNIINNNNGGGGGPlaPlanninning ng forfor bi bicyccyclinling ag as as a sa safe fe andand vi viablable te tranransposportartatitiPlaPlanninning ng forfor bi bicyccyclinling ag as as a sa safe fe andand vi viablable te tranransposportartatitiioionnioionnaaaaoptoptionionoptoptionion

8
transportation. This document identi es ways that the City of Phoenix can aim to achieve excellence in the ve essential elements of bicycle-friendly communities,
or “the Five Es”: Engineering (Creating safe and convenient places to ride and park); Education (Giving people of all ages and abilities the skills and con dence to ride); Encouragement (Creating a strong bike culture that welcomes and celebrates bicycling); Enforcement (Ensuring safe roads for all users); and Evaluation & Planning (Planning for bicycling as a safe and viable transportation option). By focusing on these ve areas, the City of Phoenix has the potential to become a League of American Bicyclists Platinum Bicycle-Friendly Community.
In a bibliography of statistics and studies, members of bicycle advocacy nonpro t PeopleforBikes identify that the costs for driving add up signi cantly: the average cost for owning and operating a car totals approximately three month’s salary, and automobile owners spend more on this expense than any other except housing4. American Automobile Association (AAA) estimates that the average cost of owning, insuring, maintaining, and driving a car increased to approximately $9000 per year5, versus the average $308 for bicycles6.
More people opting to bicycle instead of driving has the bene t of not only reducing the number of cars on the road, but reducing congestion during peak hours of traf c and effectively diminishing the number of cars idling on the road. This adds up to decreased consumption of fossil fuels, and a reduction in carbon emissions. Recent studies have estimated fossil fuel consumption to be approximately 136 billion gallons of gasoline, and emissions to fall around 1.2 billion tons of CO27. However, bicycling can assist in reducing these numbers if people opt to make short trips by bicycle (accounting for 75% of all trips or by commuting by bicycle (easing congestion during peak hours). These factors add up to cleaner air – a win for the environment, as well as a win for public health.
Bicycling improves personal and public health in a variety of ways. On a personal level, it improves cardiovascular health and promotes weight loss – in fact, the average person loses an average of 13 pounds in the rst year of cycling8.
The 2014 report on “How 21st Century Transportation Networks Help New Urban Economies Boom” from PeopleForBikes and Alliance for Biking & Walking summarizes the case for investment in bicycle infrastructure to boost economic growth. As the American economy slowly recovers, U.S. businesses are weighing their opportunities to make the most of that returning energy with new jobs, products and services. Business leaders from coast to coast are seeing four related mega-trends reshaping American urban economies.
New roads are rarely an option in mature cities. Bicycle infrastructure, such as bike lanes, bring order and predictability to streets and provide transportation choices while helping to build neighborhoods where everyone enjoys spending time. By extending the geographic range of travel, bike lanes help neighborhoods redevelop without waiting years for new transit service to debut.
After 40 years of being synonymous with decay, inner cities have come alive and are booming with new development and residents. Twenty years of falling crime rates have helped make urban life desirable again, especially for young adults. As successful city centers ll with people, city leaders nd that building high-quality bicycle networks is an ef cient and appealing way to move more people in the same amount of space.

9
White-collar workers, from software developers to graphic designers to management consultants, are rede ning the “service sector” creating a digital workforce armed with technical skill and a generational preference for urban living. Companies and cities are scrambling to attract the most talented Millennials and Generation X-ers, who increasingly prefer downtown jobs and nearby homes.
Because bike lanes and other bicycle facility treatments make biking more comfortable and popular, they help companies locate downtown without breaking the bank on auto parking space, and allow workers to reach their desk the way they increasingly prefer: under their own power.
Desk-bound jobs and sedentary travel modes are contributing to spiking health care costs and alarming obesity rates. It’s getting more and more costly for employers and insurers to nance health coverage for working families and more cost-effective for cities and companies to lower their costs by incentivizing healthier living.
From DC to Chicago to Portland, the story is the same: people go out of their way to use low stress bicycle facilities, such as protected bike lanes. Connected, barrier-free bicycle infrastructure will get more people in the saddle burning calories, clearing minds, and strengthening hearts and lungs. As companies scramble to lower health care costs, employees who bene t from the gentle exercise of pedaling to work help boost overall hourly productivity and cut bills.
After 50 years of framing their work around the automobile, retail analysts in both the private and public sectors are shifting to a new consensus: cars don’t spend money people do. By closely studying the ways people move and do business in the urban environment, proponents of local business are boosting sales in retail districts by looking for optimal ways to use public street space.
In growing urban communities, connected bicycle facility networks encourage more people to ride bikes for everyday trips. And when people use bikes for errands, they’re the ideal kind of retail customers: regulars. They stop by often and spend as much or more per month as people who arrive in cars. Plus, ten customers who arrive by bike t in the parking space of one customer who arrives by car.

10
_________________
1 - Darren Ross, “Millenials Don’t Care About Owning Cars, and Car Makers Can’t Figure Out Why,” Fast Coexist, Online: http://www.fastcoexist.com/3027876/millennials-dont-care-about-owning-cars-and-car-makers-cant- gure-out-why (Accessed 21 May 2014)
2 - Simultaneously, companies also recognize that investing in bicycle infrastructure is signi cantly cheaper than investing in parking lots. Cascade Bicycle Club, “Building Bike-Friendly,” Online: http://www.cascade.org/2013/07/building-bike-friendly (Accessed 21 May 2014). See also Sanjah Bhatt, “Amazon Gives a Push to Biking Downtown,” Seattle Times, Online: http://seattletimes.com/html/localnews/2021622545_amazoncycletracksxml.html (Accessed 21 May 2014).
3 - Mary Lauran Hall, “NYC Study Finds Protected Bicycle Lanes Boost Local Business,” America Bikes Blog, Online: http://www.americabikes.org/nyc_study_ nds_protected_bicycle_lanes_boost_local_business (Accessed 21 May 2014). See also Carolyn Szczepanski, “How Bicycles Bring Business,” Momentum Magazine (29 April 2013), Online: http://momentummag.com/features/how-bicycles-bring-business/ (Accessed 21 May 2014).
4 - People for Bikes, “Statistics Library/Economic Statistics,” Online: http://www.peopleforbikes.org/statistics/category/economic-statistics.
5 - Bikes Belong and Rails-to-Trails Conservancy, “Active Transportation for America,” Online: http://www.railstotrails.org/resources/documents/whatwedo/atfa/atfa_20081020.pdf (Accessed 1 June 2014).
6 - Mandi Woodruff, “13 Reasons You Should Start Biking to Work,” Business Insider, Online: http://www.businessinsider.com/13-reasons-you-should-bike-to-work-2012-10 (Accessed 1 June 2014).
7 - Bikes Belong and Rails-to-Trails Conservancy, “Active Transportation for America,” Online: http://www.railstotrails.org/resources/documents/whatwedo/atfa/atfa_20081020.pdf (Accessed 1 June 2014).
8 - Mandi Woodruff, “13 Reasons You Should Start Biking to Work,” Business Insider, Online: http://www.businessinsider.com/13-reasons-you-should-bike-to-work-2012-10 (Accessed 1 June 2014).

MAKING CONNECTIONS
11
This planning document is developed to set the course for the next 20 years for the development, growth and connectivity of bicycle facilities in Phoenix. This plan is intended to provide a framework for decision-making to greatly expand and improve bicycling facilities within Phoenix. These facilities are to make it safer and easier for bicyclists to travel throughout the city and make connections to adjacent communities as a part of the regional bicycle transportation network. The intent of the plan is to identify speci c actions for Phoenix to take, along with an implementation schedule, and provide quanti able outcomes to measure the success in meeting the goals of the plan.
A goal in developing this plan is to make it compatible with other efforts currently underway such as the development of a Complete Streets Ordinance, the Downtown Phoenix Transportation Study, and the Reinvent Phoenix planning efforts. As such, there was considerable coordination between the development of this master plan and the other ongoing studies and nonmotorized enhancements.
The Phoenix Bicycle Master Plan is a comprehensive and collaborative effort that had considerable input from numerous city departments. While this plan was developed under the direction of the Street Transportation Department and the Phoenix Bicycle Coordinator, considerable input was also provided by the Police, Planning and Development Services, Parks and Recreation, and Transit Departments. The lead consultant for this project is Lee Engineering, LLC, along with substantial guidance and support from subconsultants Charlier Associates, Inc. and Toole Design Group.
Even though this is a 20-year plan, it is fully recognized that this plan may be updated periodically during the 20-year planning horizon to re ect changes in the community including growth, changes in population density or employment centers, and new developments, and to re ect updates in the AASHTO and NACTO bicycle facility design guides, Arizona DOT or MAG policies, practices or guidelines, changes in laws, improvements in technology, and revisions to the Manual on Uniform Traf c Control Devices (MUTCD) and Arizona supplement. This plan is intended to be exible to allow the city to respond to changes in budget, development and other funding opportunities as they arise.
cannot be a great city without a great transportation system,
public transit whole heartedly including expansion of rail, bus, and multimodal forms of transportation - especially walkability and bikeability.”
C H A P T E R
2

12
Bicycling promotes a healthy lifestyle, has an extremely small carbon footprint, and requires much less infrastructure or space for travel and parking compared to motor vehicle transportation. Currently, Phoenix lacks a comprehensive bicycle network that is fully connected with the community and other transportation networks (transit, airports). While over 700 miles of bicycle facilities exist within Phoenix along with 42 bicycle and pedestrian bridges/tunnels, the 596 on-street bicycle facility miles represents only a small fraction of the nearly 5,000 miles of street network in the city. Many of the bike facilities are not connected with other bicycle facilities or important destinations such as schools, universities, employment centers, shopping centers, transportation centers, or recreation facilities within Phoenix or in adjacent communities. Many bicycle facilities were built by developers as a part of their off-site improvements and exist in segments along an arterial street. At times on-street bike lanes will end several hundred feet in advance of a signalized intersection and reappear several hundred feet downstream from the traf c signal. This is not representative of a continuous connected bicycle facility, and can be intimidating to inexperienced bicyclists.
A comprehensive and connected bicycle network will promote a healthier community and healthy transportation alternative for residents and visitors. This network and innovations such as bike share programs can greatly expand the number of bicyclists while helping to eliminate the demand for vehicle travel.
The Bicycle Master Plan is important to identify barriers to bicycling and provide solutions to eliminate those barriers. At times the barrier may be a missing bicycle facility or a gap in an existing bike facility. Other times the barrier may be an arterial street that is dif cult to cross or a freeway or canal without a crossing. The lack of access to Sky Harbor Airport or other transportation centers is a barrier to bicycling for residents, airport employees and visitors to Phoenix. Other barriers may include the lack of safe and convenient parking facilities
or the lack of shower facilities at employment centers. The inability for a bicyclist to put in a call at a traf c signal without having to get off their bicycle to use a pedestrian push button is another obstacle to a good bicycle system. Not only have numerous types and locations to barriers been identi ed, but numerous improvements have been recommended to overcome the barriers.
The Bicycle Master Plan is intended to make Phoenix a part of the regional bicycle network throughout the metropolitan area. Bicycle facilities should not end at the city limits and instead should connect to facilities in adjacent cities to provide access to destinations in adjacent communities for Phoenix residents and visitors. Furthermore, residents of adjacent communities should have good access to a multitude of destinations or recreational routes within Phoenix.
The Bicycle Master Plan provides new policies for bicycle facility design as well as a framework for implementation of those facilities. These policies include the design of facilities, traf c control practices and proposals for facilities at destinations, such as parking or shower facilities.
The adoption of a comprehensive bicycle master plan will allow Phoenix to better compete for funding either through the Federal Government, when funding opportunities become available, or through the Maricopa Association of Governments (MAG). Since much of the transportation infrastructure is built by private developers, this plan will help to ensure bicycle facilities are constructed at the time parcels or site plans are developed. The plan will also allow city leaders to better plan for development of future support for general obligation bond proposals. Having a comprehensive bicycle master plan in place will allow the public to understand what the bond request will provide and how the proposed facilities will t into the overall bicycle network.
In short, a comprehensive bicycle master plan will help make Phoenix an even better place to live, work and play.
A Technical Advisory Committee (TAC) was established to provide oversight from the various Phoenix departments who would provide input into the planning, design, operation and enforcement of bicycle facilities and users. In addition, agencies outside of Phoenix government that play a role in bicycle transportation or facilities within the city or in the regional bicycle network were also invited to participate on the TAC. These agencies consisted of:
Valley Metro Cities of Tempe and Mesa Arizona State University (ASU) Downtown Phoenix Partnership Arizona Department of Transportation (ADOT) Maricopa Association of Governments (MAG)

13
The initial TAC meeting occurred on August 29, 2013, and subsequent meetings were held on November 4, 2013, November 20, 2013, March 20, 2014, and April 24, 2014. In addition to providing overall technical input and oversight to the master plan process, this committee participated in a workshop to establish a 20-year Vision for the Phoenix Bike Plan, and develop Goals for the bicycle system. The Vision and the Goals created from the TAC visioning workshop were later re ned by the Ad Hoc Task Force.
The success of this plan is contingent upon the input, and guidance and of the city’s residents and many bicycle advocates. Their expertise, experience, and creativity are invaluable in planning and developing improvements for our current and future bikeway system. As a means of incorporating these individuals into a cohesive group to help shape the future of our bikeway system, the Phoenix Of ce of the Mayor established a Pedestrian and Biking Ad Hoc Task Force that will be charged with the following tasks:
1. Review past reports, data, maps and bike-related information provided by City staff
2. Help prepare the overall Vision for the 20-Year Master Bike Plan
3. Provide feedback and guidance to City staff and its Consultant on best methods for enhancing the Phoenix bikeway system including, but not limited to, improving infrastructure and facilities, policies and bike safety education
4. Assist the Consultant in the analysis of the bike-related community feedback
5. Attend project meetings to stay engaged on the development of the Plan
6. Provide feedback and oversight into the Bike Share program station locations and operation
7. Serve in an advisory capacity to City Council on proposed City initiatives and policies that enhance pedestrian and bicycling mobility, such as Complete Streets
8. Advise City staff and Council on methods and actions to improve pedestrian safety citywide
The Pedestrian and Biking Ad Hoc Task Force met the rst and third week of every month beginning on December 5, 2013 and sunset after the June 5, 2014 where they approved the Master Bike Plan.
Phoenix residents identify barriers and desired routes on a map at a community meeting.

14
The bicycling vision for Phoenix was developed through a comprehensive process undertaken from July 2013 - June 2014. Extensive public and City staff input guided the development of the plan approach and content, which led to the overall theme of Making Connections. Highlights of the community outreach process included:
The community outreach strategy was to reach the City’s diverse demographics, including transit-dependent groups, to engage bicyclists of all ages and abilities, as well as local Bicycle Advocacy groups. A detailed summary of the community outreach is provided in Appendix A.
CommunityWorkshops
Outreach at
Committee
Ad HocTask Force
196 site speci c comments on routes and intersections received
594 users logged in 1,000 site-speci c comments
8 hours of outreach at three different transit stations 91 in-person responses on bicycling habits
technical guidance from a 32-member TAC representing 18 departments and agencies
citizens advisory group
The remaining part of the Bicycle Master Plan is organized into nine chapters. Chapter 3-Plan Vision & Areas of Excellence presents the Vision developed for bicycling in Phoenix over the next 20 years. This chapter also describes the seven Areas of Excellence necessary to achieve the vision of a platinum-level bicycling community as de ned by the League of American Bicyclists. Chapter 4-Past & Present describes a brief history of the bicycle system in Phoenix as well as the current status of the bicycle network.
Chapters 5 through 11 are structured around speci c goals to achieve each Area of Excellence relating to the bicycle transportation system in Phoenix. Each goal has one or more speci c and measurable objectives to monitor the progress of the system implementation. Each chapter is organized in the following manner:
Background of Area of Excellence What Phoenix wants to accomplish How Phoenix will accomplish each goal
“What Phoenix wants to accomplish” is the goal and measurable objectives for each of the identi ed Area of Excellence. “How Phoenix will accomplish each goal” entails the implementation plan for each Area of Excellence. These Areas of Excellence are organized into the following chapters:
5. Policies & Perceptions
6. Opportunities & Investments
7. Equity & Ef ciency
8. Safety
9. Design & Connectivity
10. Connections & Collaboration
11. Bikes & Transit

MAKING CONNECTIONS
15
The Bicycle Master Plan is guided by the following Vision, developed by the Technical Advisory Committee and Ad Hoc Task Force and informed by community ideas.
This plan establishes direction to transform the City of Phoenix into a bicycle-friendly community over the next 20 years. The goal is to systematically improve levels of bicycle friendliness, as de ned by the League of American Bicyclists’ Bicycle Friendly Communities program. Phoenix received an Honorable Mention in 2011; the next goal is a Bronze Award, progressing up to the Platinum level as additional recommendations of the Bicycle Master Plan are implemented over time.
To achieve this vision, seven Areas of Excellence necessary to a Platinum-level Bicycle Friendly Community were established. Each Area of Excellence is a focus of this plan. To help the City succeed in each of these areas, this plan includes speci c goals, strategies, actions, and objectives.
GOAL:A desired,
ultimate
condition.
STRATEGY:
framework
for decision-
making and
actions to
goal.
ACTION:
goal.
OBJECTIVE: A measurable
outcome
occurring as
a result of an
action.
C H A P T E R
3
16
Policies and Perceptions focus on the level of consideration given by the City in planning for bicycles and providing a safe, comfortable and accessible cycling environment in Phoenix.
As part of this planning process, bike corridors were prioritized based on a variety of factors. From this list, a series of bicycle facility improvements were recommended. This Area of Excellence identi es implementation and funding strategies for these facilities.
This Area of Excellence ensures that the City and its neighborhoods are accessible by bicycle, and that bicycle facilities are safe, fun, and convenient throughout Phoenix.
Safety is a paramount consideration for implementing bicycle facilities in the City of Phoenix. It is also the number one criteria for federal funding of transportation programs, which require performance-based and data-driven processes for developing and implementing projects. This Area of Excellence provides a ve-year review of bicycle crashes in the City and discusses how Complete Streets increase safety for all road users.
Because they are an important mode of transportation to provide connectivity, bicycle routes are located along existing arterial and collector streets and included in plans for new streets. This Area of Excellence focuses on ensuring the bicycle network is continuous so that it functions as a viable transportation mode. This section also includes a discussion of bicycle facility design, ensuring that the right facility is used in the appropriate location.
This section recognizes off-street and recreational routes as an integral piece of the regional bicycle system. Phoenix residents work and recreate throughout the region; and residents from outside Phoenix come to the City for the same reasons. This Area of Excellence discusses the opportunities for collaboration and partnerships with Salt River Project and adjoining cities to enhance regional bicycle connectivity and access.
Every transit user is a pedestrian or bicyclist at some point on their trip. Public transit operates as a key part of the region’s multimodal transportation system, working in tandem with walking, bicycling, and driving modes to provide commuters with multiple transportation choices. This Area of Excellence highlights multimodal initiatives and opportunities for bike-transit integration.

17

THIS
PA
GE
IS IN
TEN
TIO
NA
LLY
LE
FT B
LAN
K

MAKING CONNECTIONS
19
Phoenix rst recognized the need to plan for bicycles almost 30 years ago. Accomplishments of the City to date include:
1985 Bicycle Task Force appointed
1987 Council approves initial 700-mile Phoenix bike system
1988 Bond program provides $2.9M for plan implementation over 5 years
1993 Built system reaches 360 miles
2002 Phoenix General Plan includes Bicycle Element
2009 City adopts bicycle standards as part of Street Planning & Design Guidelines
Environmental Quality Commission establishes a Bicycle Initiative Subcommittee to begin meeting monthly
2010 Reestablished Bike Coordinator Position
2011 City receives an Honorable Mention award in the national Bicycle Friendly Communities program
2013 Reinvent PHX initiative looks at bicycling as sustainable transportation option within transit oriented development districts
2014 Comprehensive Bicycle Master Plan Developed
The rst step in developing this Comprehensive Bicycle Master Plan was to assess existing government policies and programs that support and impact bicycling as a mode of transportation. Eleven planning and policy documents were reviewed that directly relate to bicycling, six departmental interviews were conducted, and 14 regional and neighboring community bicycle plans were consulted.
Five basic types of bikeways are currently provided within the City of Phoenix:
shared use paths bicycle routes bikeable streets on-street bicycle lanes bicycle boulevards
and logged the most miles and rides!
C H A P T E R
4

20
PPPPPPPPPPhhoenix BikewaysSSSHHSSHHARAREDDED--U-USESE PP PATATHSHS: : BiBikeekewwawaysys pp phyhysisicaacalllllyyy y y sseesseeppapararateteddd frfromom mm mototororizizedeed t traraff cc anand d deddesisigngnededdeed ffooffor r r shshararedded u usese b byy y bibicycyclcleseses, , pepedeedesststririanans,,s, j jogoggegersrsrrs,,, innin-l-l--linine e skskatatateses, , anand dd ototheher r nonnon-n-momotottoririzezed d mommodedes s ooffoof ttrrttranaaanspsporortaatatitionon. . PaaPathths s maamayy y bebe a aloolongng t theehe h higighwwhwaayyyaay rriirighghgght-t-ofof-ww-waayay o or r wiwwiththinin aa ann n enentitirererelyly i indndepeepenendeedenttnnt rriirighghgght-t-ofof-ww-waayay ( (i.i.e.e. c cananalal bb bananksks oo or r ththrorouguugh h paaparkkkrrk laalandnnnd).).
OOONNOON-S-STRTREEEEET T BIIBICCYCYCLCLE EE LALANEENES:S: BiBBikekewawayysssyys ccrccreaeeeateted d byyby d desesigignannatitingng aa a p porortitionnon o of f ststreereeetet ( (ususinninnggggpppaapaavvevemementtnt m mararkikingngngs s anand d ssisigngns)s) ff fooror e excxcluulusisiveve u usseeesse bbbyybyy b bicicycyclilistssts.s. P Perer tt thehe 2 20000099 9 MUMUTCTCTCD,D, B BIKKIKE E LALANENEENNE ssissigngggns s arare e nnono l lonongeeger r rereququirrireded f foror ee eststabablilishsshining g onoonn---sstsstrerereetet b bikikeee lalanenes,s, b butut w wilill l cocontntininueuue t to o beebe u usesed d bbyyybby PPPhhPhhooeoeninix.x.
BBBIIBIICCYCYCLCLEEE ROROUTTUTESES: : BiBBikekewawaysysys d desesigignnanateted d bbyyybby ggguugguuidide e sisignngnining g tooto i indndicicatatate e a a trrtraaiailblblalazeezedd d rorouttutee,,ee, wwwhhwwhhicich h isis a a s shaaharered d faafaccicililityty ee eititheher r onoon-s-strtreeeeeeettt((ss(shahharered d wiwwithth c carrars)ss) o or r onnon t thehe ss sididewewalalkk k (s(shahareereeddddwwwiwwithtth p pededesesestrtriaiansns).).).
BBBIIBIIKKEKEABABLELELE S STRTREEEEETSTS: : StStrereetetsss whwhicichhh coconnnnecececctttwwwiwwithtth h higigheheher r leleveevel l bibikekewawway y fafaccicililititieses aa anndnd h havvavveeeeppprprrovoovenen t to o bbebe a accccepepeptatablble e fofofor r bibicycyclccle e trtravaveleel a andnd aa areeerre dddeeddeessisigngnatatededed o on n a a bibbikekeabableele s strtreeeet t mmamap p foforr r bibicycyclcliisisstttccooccoonnvnvenenieiencncnce.e. B Bikikeaeeablble e sttstrereetets s ararare e inintetendndndeded o onlnnlyyy y aaassaass a a g guiuideede a andnd a arerre g genenerereralallyly l loccocalal a andnd cc colollelecttctorroor sstsstrerereetets s whhwhicich h coconnnnnecect t biibikkeke l lananeseses o or r sisigngngneded b bikkikkeeee pppaapaatthths/s/roroutututeses..
BBBIIBIICCYCYCLCLEEE BOBOULLULEVEVARARDSDDS: : BiBicyccyclcle e booboululevevarrarddsssdds aaaraarre ee shshararedded r roaoadwwdwayays s ththaatat c crereattate e anan a atttttraractctivvivee,,ee, ccooccoonnvnvenenieientntnt, , anand d cococomfmforortaatablble e cycycclclining g enenvviviroronmnmeneennttttthhtthataat i is s wewewelclcomominninggg toto c cycyycliliststs s oofof a allll aa ageges s annannddddsskksskkilill l lelevevelssls. . BiBicycyclclcle e boboululeevevarardsds aa arere l lowwow--v-vololummumee,,ee, loolow-www-spspeeeeddd ststrereettets s ththatat h havave e bbebeenen oo optptimimizizededdeed ffooffor r r bibicycyclcle ee trtravaveelel t thrhrououghggh t trereatatatmementnts s susuchch aaaassssttrrttrafafaaf cc c calalmimmingng a anddnd t traraff ccc rereduducttctioion,n, s sigignannagege a anndddnnd pppaapaavvevemementtnt m mararkikingnngs,s, a anddnd i intnterersessectctioion n crcrosossisinngggnng ttrrttreaeaeeatmtmenentststs. . ThThessese e trtreaaeatmtmenentssts a allllowow t thrhrououghghhggh mmmoomoovevemementtnts s fofor r cycyclclisistststs w whihilelele d disiscococoururagaginninnggggssissimimmmilalar r thhthrorougugh h ttrtripips s bybyby n nonon-l-l-lococalal mm mototororizizededdeed ttrrttrafafaaf cc. . OO Onene s sucuuch h trtreaeaeatmtmenent t isis s shaaharered-d-lalanneeenne mmmaamaarkrkiningsgs, , amamonong g otothehersrs..
These facilities fall into two functional categories: recreational paths within city parks, desert preserves, which are generally implemented and maintained by the Parks and Recreation Department; and commuter/transportation-related facilities located within street corridors under the jurisdiction of the Street Transportation Department and along canals under the jurisdiction of Salt River Project (SRP).
The Parks and Recreation Department is primarily responsible for planning and implementing recreational bikeways, and periodically publishing brochures showing recreational bikeways. Bike facility maps are normally available through the Maricopa Association of Governments (MAG) based on information provided by the City of Phoenix Street Transportation Department. The Parks and Recreation Department is responsible for monitoring and maintaining recreational bikeways in city parks and off-road alignments. When the Parks and Recreation Department is unable to provide maintenance, they may refer signing de ciencies to the Traf c Services Division or surface problems to the Street Maintenance Division for repair. On-street routes (such as Third Avenue/Fifth Avenue one-way pair, 23rd Avenue, etc.) are monitored, maintained and operated by the Street Transportation Department.
Level terrain and good weather conditions for a majority of the year provide an ideal environment for bicyclists. All bicyclists are not the same and vary widely, from young children riding to school, to recreational riders, up to experienced adult riders equipped with mirrors, lights, helmets, and special clothing to ride in traf c.

21
Experienced bicyclists prefer to ride in the roadway with motor vehicles, and are normally equipped to do so. They ride at higher speeds and for longer distances, and by riding in the street, are governed by the laws for any other vehicle operator (where relevant). Experienced bicyclists are typically not suited to riding on sidewalks along the street. Sidewalks are intended primarily for pedestrian use.
Children or inexperienced bicyclists typically do not have the con dence or equipment to share arterial streets with higher speed motorized traf c. From a safety standpoint, it is advisable that these less experienced riders use sidewalks, local streets, collector streets, or separate bicycle paths instead of arterial streets. To encourage more experienced cyclists to use the street instead of sidewalks, traf c of cials should design, install and maintain a system of continuous bicycle facilities throughout the city.
Levels of bicycle accommodation in Phoenix today may be summarized by examining the current status of the City’s physical bicycle infrastructure and bicyclist ridership data.
The following list highlights current programs, activities and organizations that support bicycling in Phoenix.
City of Phoenix Bicycle Program web page City of Phoenix Bicycle Safety web page Phoenix Police Department Bicycle Safety web
page Phoenix Police Department bicycle rodeos Valley Metro bike on bus and bike on LRT
programs Phoenix Safe Routes to School program--The
Phoenix Street Transportation Department Safe Routes to School (SRTS) Coordinator coordinates SRTS at the city-wide level. Duties include organizing bicycle rodeos and walk and bike to school days. 30-40 schools within the city participate every year.
Maricopa Association of Governments (MAG) Safe Routes to School Program
As of January 2014, Phoenix has 713 total bikeway miles comprised of:
596 miles of on-street facilities 117 miles of off-street paths
includes 22 bike bridges and 20 bike tunnels
The City of Phoenix currently provides 0.48 miles of bicycle facilities per 1,000 residents, ranking 20th of 29 MAG member communities. A map of existing bicycle facilities is provided in Figures 4-1 and 4-2: Existing Bikeway Inventory.
Limited tools are currently available to determine levels of bicycling in Phoenix. Three sources that can help track numbers of cyclists reveal the following:
There are over 4,900 estimated bicycle commuters in Phoenix, representing 0.76% of all commuters, according to the U.S. Census 2011 American Community Survey. This number is up from the 2006 Census rate of 0.62% percent bicycle commuting.
Work commute rates reported by the 2013 Maricopa County Trip Reduction Program Survey are slightly higher. Bicycling is used by 1.12% of commuters surveyed (1.47% of students; 1.04% of employees), with the <25 year old group most likely to bicycle, and men more likely to bike to work than women by a 3:1 ratio.
More than 100 bicyclists per day were counted at 29% of locations on weekdays and 25% locations on weekends when the City of Phoenix conducted bicycle counts in the fall of 2013. The highest weekday count exceeded 270 bicyclists per day.
66 miles UNPAVED PATHS51 miles
PAVED PATHS
428 milesBICYCLE LANES
163 miles BICYCLEROUTES
5 miles BIKE BOULEVARD

22
N 7
TH S
T
N 1
6TH
ST
N 7
TH A
VE
N 1
9TH
AVE
N 2
7TH
AVE
N C
ENTR
AL
AVE
W GRAND AVE
E THOMAS RD
S 7T
H S
T
W THOMAS RD
E BUCKEYE RDW BUCKEYE RD
S 16
TH S
T
S 7T
H A
VE
S 24
TH S
TE VAN BUREN ST
E MCDOWELL RD
W VAN BUREN ST
W MCDOWELL RD
E CAMELBACK RDW CAMELBACK RD
E WASHINGTON ST
S 19
TH A
VE
E INDIAN SCHOOL RDW INDIAN SCHOOL RD
W BETHANY HOME RD
W JEFFERSON ST E JEFFERSON ST
S C
ENTR
AL
AVE
E BETHANY HOME RD
N 1
ST A
VE
W ADAMS STW WASHINGTON ST
S 17
TH A
VE
N 1
5TH
AVE
N 3
RD
ST
N 2
0TH
ST
N 1
2TH
ST
E OAK ST
E OSBORN RD
E MISSOURI AVE
W OSBORN RD
E ROOSEVELT ST
S 15
TH A
VE
W MISSOURI AVE
W GRANT ST
N 5
TH A
VE
E MOHAVE ST
W CAMPBELL AVE
N 3
RD
AVE
N 2
3RD
AVE
W ROOSEVELT ST
W MOHAVE ST
E HIGHLAND AVE
N 1
1TH
ST
N 4
TH S
TS
3RD
ST
S 3R
D A
VE
W ADAMS ST
E LINCOLN ST
N 2
ND
AVE
E VIRGINIA AVE
E FILLMORE ST
E SKY HARBOR CIR S
W DURANGO ST
E SKY HARBOR CIR N
E CAMPBELL AVE
W JEFFERSON ST
N 2
ND
ST
E GRANT ST
W EARLL DR
E COLTER ST
W CATALINA DRN
ALV
AR
AD
O R
D
W ENCANTO BLVD
W FILLMORE ST
N 1
ST P
L
S 12
TH S
T
N 2
0TH
ST
W CAMPBELL AVE
N 1
1TH
ST
N 2
ND
ST
N 1
2TH
ST
E OAK ST
N 2
ND
AVE
N 3
RD
AVE
N 2
3RD
AVE
E CAMPBELL AVE
N 1
2TH
ST
§̈¦17
§̈¦10
rx51
rx202
Grand Canal
± 0 0.5 1Miles
LegendBikeway/Pedestrian Bridge
!Á Bikeway/Pedestrian Tunnel
""""""" " " " " " Bike Boulevard
""""""" " " " " " Bike Lane
" " " " " " Bike Path - Paved
)))))) Bike Path - Unpaved
""""""" " " " " " Bike Route
!!!!!!! Undesignated Route
Light Rail Line
Canals

23
BASELINE RD
DOBBINS RD
ELLIOT RD
ESTRELLA DR
RAY RD
CHANDLER BLVD
PECOS RD
(36200N)
(37800N)
(39400N)
(41000N)
(42600N)
(44200N) CIRCLE MTN RD
(45800N)
(47400N)
(49000N)
(34600N)
(33000N)
(31400N)
(29800N)
(28200N)
(26600N)
(25000N)
(23400N)
(21800N)
(20200N)
(18600N)
(17000N)
(15400N)
(13800N)
(12200N)
(10600N)
(9000N)
(8000N)
(7000N)
(6000N)
CAMELBACK RD(5000N)
(4100N) INDIAN SCHOOL RD
(2900N)
(1600N)
(300N)
(1200S)
(2800S)
(4400S)
(6000S)
(7600S)
JENNY LIN RD
MINGUS RD
NEW RIVER RD
ANTHEM WAY
ROCKAWAY HILLS RD
DESERT HILLS RD
JOY RANCH RD
CLOUD RD
EL M
IRA
GE
RD
115T
H A
VE
107T
H A
VE
99TH
AVE
83R
D A
VE
75TH
AVE
91ST
AVE
67TH
AVE
59TH
AVE
51ST
AVE
43R
D A
VE
35TH
AVE
19TH
AVE
27TH
AVE
7TH
AVE
7TH
ST
16TH
ST
24TH
ST
32N
D S
T
40TH
ST
48TH
ST
56TH
ST
64TH
ST
SCO
TTSD
ALE
RD
(720
0E)
(640
0E)
(560
0E)
(480
0E)
(400
0E)
(320
0E)
(240
0E)
(160
0E)
(700
E)
(700
W)
(190
0W)
(270
0W)
(350
0W)
(430
0W)
(510
0W)
(590
0W)
(670
0W)
(750
0W)
(830
0W)
(123
00W
)
(115
00W
)
(107
00W
)
(990
0W)
(910
0W)
BEARDSLEY RD
CAREFREE HWY
DOVE VALLEY RD
LONE MOUNTAIN RD
DIXILETA DR
DYNAMITE BLVD
JOMAX RD
HAPPY VALLEY RD
PINNACLE PEAK RD
DEER VALLEY RD
UNION HILLS DR
BELL RD
GREENWAY RD
THUNDERBIRD RD
CACTUS RD
PEORIA AVE
DUNLAP AVE
NORTHERN AVE
GLENDALE AVE
BETHANY HOME RD
THOMAS RD
McDOWELL RD
VAN BUREN ST
BUCKEYE RD
BROADWAY RD
SOUTHERN AVE
LWR. BUCKEYE RD
(9200S)
(10800S)
(12400S)
(14000S)
(15600S)
(17200S)
(680
0E)
68TH
ST
(600
0E)
60TH
ST
(520
0E)
52N
D S
T
(440
0E)
44TH
ST
(360
0E)
36TH
ST
(200
0E)
20TH
ST
(120
0E)
12TH
ST
(150
0W)
15TH
AVE
(230
0W)
23R
D A
VE
31ST
AVE
(310
0W)
(390
0W)
39TH
AVE
47TH
AVE
(470
0W)
55TH
AVE
(550
0W)
(630
0W)
63R
D A
VE
(710
0W)
71ST
AVE
(790
0W)
79TH
AVE
(870
0W)
87TH
AVE
(950
0W)
95TH
AVE
(103
00W
)10
3RD
AVE
(111
00W
)11
1TH
AVE
(119
00W
)11
9TH
AVE
28TH
ST
(280
0E)
(0)
CEN
TRA
L AV
E
FRYE RD
ROSE GARDEN LN
(48200N)
(46600N) F. BOND RD
(45000N) JOHNSON RD
(43400N) CAVALRY RD
(41800N) LINDA LN
(1000N) ROOSEVELT ST
(40200N) SADDLE MTN.
(38600N) IRVINE RD
(37000N) MADDOCK RD
(35400N) GALVIN ST
(33800N) WESTLAND RD
(32200N) ASHLER HILLS DR
(30600N) MONTGOMERY RD
(29000N) PEAK VIEW RD
(27400N) PINNACLE VISTA DR
(25800N) YEARLING RD
(24200N) ALAMEDA RD
(22600N) WILLIAMS DR
(21000N)
(19400N) YORKSHIRE DR
(17800N) GROVERS AVE
(16200N) PARADISE LN
(14600N) ACOMA DR
(13000N) SWEETWATER AVE
(11400N) CHOLLA ST
(9800N) MTN. VIEW RD
(8500N) BUTLER DR
(7500N) ORANGEWOOD AVE
(6500N) MARYLAND AVE
(5500N) MISSOURI AVE
(4500N) CAMPBELL AVE
(3400N) OSBORN RD
(2300N) ENCANTO BLVD
(400S) HARRISON ST
(2000S) DURANGO ST
ELWOOD ST(3600S)
(5200S) ROESER RD
(6800S) VINEYARD DR
(8400S) SOUTH MTN. AVE
(10000S) OLNEY AVE
(11700S) CARVER RD
(13200S) KNOX DR
(14800S)
(16400S)
55
33
38
65
6
42
10
21
39
60
011
36
5
22
04
46
58
38
13
2612
07
76
2920
71
56
47
1
45
43
37
31
02
72
50
30
012
20
63
2
54
2
17
21
17
35
19 27
09
69
64
19
28
36 44
03
3503 321
40
3
26
43
51
16
7
62
23 42
3
66
06
4
12
11 13
05
25
44
67
31
41
24
11
8
4001
6
8
010
29
28 3314
14
02 39
59
16
32
15
75
34
9
7
49
34
52
68
18
9
73
10 22 374 5
48
57
27
23
08
3024
70
61
01
41
74
15
25
18
53
013
£60
rx51
rx101
rx202
rx143
rx101
Grand Canal
Arizona Canal
Western Canal
Central Arizona Project Canal
Hig
hlin
e C
anal
Roosevelt Irrigation District Canal
Crosscut C
anal
± 0 1 2Miles
LegendBikeway/Pedestrian Bridge
!Á Bikeway/Pedestrian Tunnel
Canals""""""""""" " " " " " " " " " Bike Boulevard""""""""""" " " " " " " " " " Bike Lane
" " " " " " " " " " Bike Path - Paved
)))))))))) Bike Path - Unpaved""""""""""" " " " " " " " " " Bike Route!!!!!!!!!! Undesignated Route
Light Rail Line

THIS PAGE IS INTENTIONALLY LEFT BLANK
25
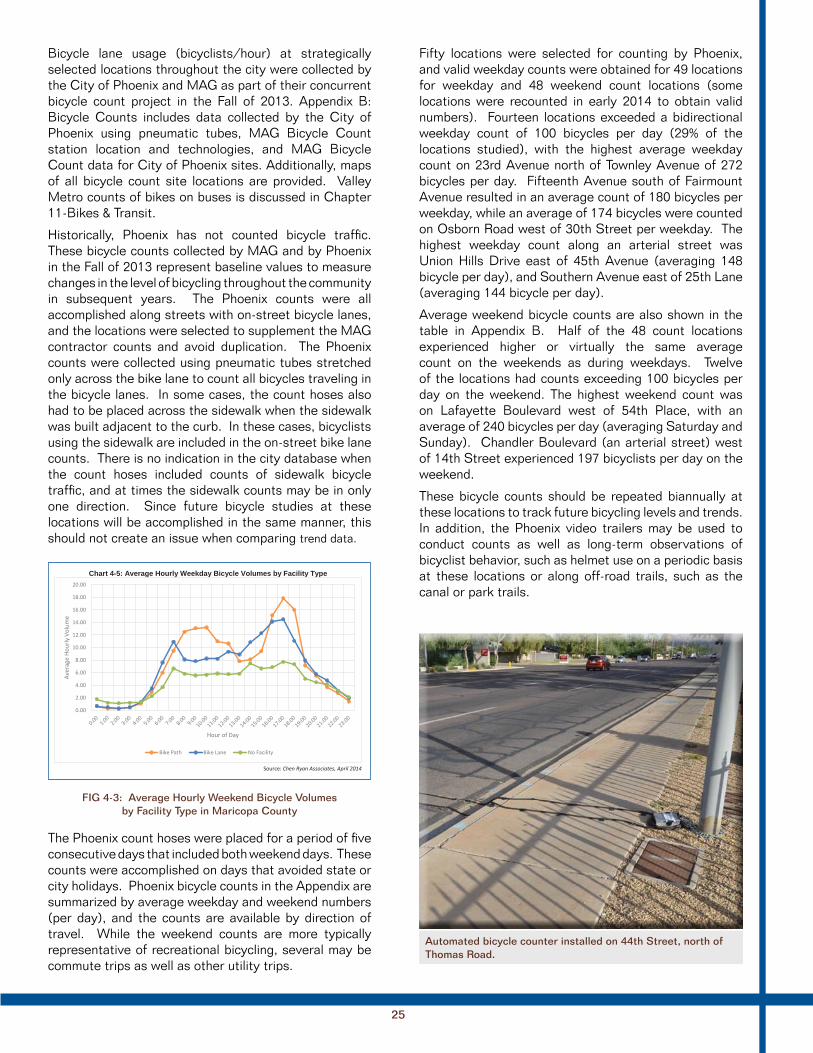
Fifty locations were selected for counting by Phoenix, and valid weekday counts were obtained for 49 locations for weekday and 48 weekend count locations (some locations were recounted in early 2014 to obtain valid numbers). Fourteen locations exceeded a bidirectional weekday count of 100 bicycles per day (29% of the locations studied), with the highest average weekday count on 23rd Avenue north of Townley Avenue of 272 bicycles per day. Fifteenth Avenue south of Fairmount Avenue resulted in an average count of 180 bicycles per weekday, while an average of 174 bicycles were counted on Osborn Road west of 30th Street per weekday. The highest weekday count along an arterial street was Union Hills Drive east of 45th Avenue (averaging 148 bicycle per day), and Southern Avenue east of 25th Lane (averaging 144 bicycle per day).
Average weekend bicycle counts are also shown in the table in Appendix B. Half of the 48 count locations experienced higher or virtually the same average count on the weekends as during weekdays. Twelve of the locations had counts exceeding 100 bicycles per day on the weekend. The highest weekend count was on Lafayette Boulevard west of 54th Place, with an average of 240 bicycles per day (averaging Saturday and Sunday). Chandler Boulevard (an arterial street) west of 14th Street experienced 197 bicyclists per day on the weekend.
These bicycle counts should be repeated biannually at these locations to track future bicycling levels and trends. In addition, the Phoenix video trailers may be used to conduct counts as well as long-term observations of bicyclist behavior, such as helmet use on a periodic basis at these locations or along off-road trails, such as the canal or park trails.
Bicycle lane usage (bicyclists/hour) at strategically selected locations throughout the city were collected by the City of Phoenix and MAG as part of their concurrent bicycle count project in the Fall of 2013. Appendix B: Bicycle Counts includes data collected by the City of Phoenix using pneumatic tubes, MAG Bicycle Count station location and technologies, and MAG Bicycle Count data for City of Phoenix sites. Additionally, maps of all bicycle count site locations are provided. Valley Metro counts of bikes on buses is discussed in Chapter 11-Bikes & Transit.
Historically, Phoenix has not counted bicycle traf c. These bicycle counts collected by MAG and by Phoenix in the Fall of 2013 represent baseline values to measure changes in the level of bicycling throughout the community in subsequent years. The Phoenix counts were all accomplished along streets with on-street bicycle lanes, and the locations were selected to supplement the MAG contractor counts and avoid duplication. The Phoenix counts were collected using pneumatic tubes stretched only across the bike lane to count all bicycles traveling in the bicycle lanes. In some cases, the count hoses also had to be placed across the sidewalk when the sidewalk was built adjacent to the curb. In these cases, bicyclists using the sidewalk are included in the on-street bike lane counts. There is no indication in the city database when the count hoses included counts of sidewalk bicycle traf c, and at times the sidewalk counts may be in only one direction. Since future bicycle studies at these locations will be accomplished in the same manner, this should not create an issue when comparing trend data.
Chart 4-5: Average Hourly Weekday Bicycle Volumes by Facility Type
Source: Chen Ryan Associates, April 2014
0.00
2.00
4.00
6.00
8.00
10.00
12.00
14.00
16.00
18.00
20.00
Aver
age
Hour
ly V
olum
e
Hour of Day
Bike Path Bike Lane No Facility
The Phoenix count hoses were placed for a period of ve consecutive days that included both weekend days. These counts were accomplished on days that avoided state or city holidays. Phoenix bicycle counts in the Appendix are summarized by average weekday and weekend numbers (per day), and the counts are available by direction of travel. While the weekend counts are more typically representative of recreational bicycling, several may be commute trips as well as other utility trips.
Automated bicycle counter instThomas Road.

26
Community input reported that many routes are too stressful for most people due to lack of facilities, not enough space on roadways, and high traf c speeds. Public investment in bike-friendly infrastructure and more vibrant, people-oriented urban development will serve as catalysts in getting more people on bikes more often. However, focused efforts need to be made to reach out to those who currently do not consider themselves cyclists. The Maricopa County FY2013 Trip Reduction Program Annual Report indicates that men are more likely to bicycle than women by a 3:1 ratio, and people under age 25 are most likely to bike. Thus the goal is to make bicycling fun, safe, and effortless to increase usage by women, families, and others who have yet to enjoy daily health, social, and economic bene ts of bicycling.
The Maricopa County Air Quality Department furnishes aggregate bicycling data by zip code to the Maricopa Association of Governments. FY2012 data was provided to Charlier Associates regarding commuters who ride bikes one or more days per week, and for people who are willing to make a change to their daily commute and switch to the bicycle option. This last data set has been mapped to examine areas of latent demand for use in project prioritization. The maps, listed below and discussed in the following paragraphs are provided in Appendix C:
1a - Commute Trip Origins 1b - Major Employment Destinations 2a - Latent Demand Commuting – Within A Zip
Code 2b - Latent Demand Commuting – Between Zip
Codes 2c - Latent Demand Commuting – To/From
Adjacent Communities
Two maps have been generated using MAG FY2012 data to compare potential bicycling origins and destinations within the City of Phoenix. Map 1A shows zip codes with high demand (>200 residents interested in bike commuting). Map 1B shows location of major employment site destinations by zip code. Per the Trip Reduction Program survey responses, desired access is very high (>1000 expressions of interest) for people wishing to reach school/employment destinations located in zip codes 85027, 85021, 80534, and 85040. These geographically represent the village planning areas within the Deer Valley, North Mountain, Central City, and South Mountain villages.
The FY2012 data set was also analyzed to determine where new bicycle work/school trips are most desired. Of 1,482 TRP survey respondents expressing an interest in commuter bicycling, responses have been mapped to show where more than 50 people, and more than 100
people, desire to make a bicycle trip. Map 2A depicts short-distance trips internal to a zip code. Map 2B depicts longer trips desired to be made between zip codes. Most of these trips are likely less than 5 miles in length and within easy riding distance if bicycle facilities are provided. In addition, Map 2C depicts the locations of commute trips between Phoenix zip codes and surrounding communities that are desired to be accomplished on bike.
In summary, the latent demand map series demonstrates that a long-distance north/south bicycle commuter corridor(s) is highly desired on the eastern side of Phoenix from, generally, the South Mountain Park open space lands, around the Sky Harbor International Airport, continuing north to the Camelback East Village area. A second major area of need is within the Deer Valley Village area. Regional connections that may be prioritized according to highest latent demand include bikeways connecting the City of Phoenix with the adjacent communities of Glendale and Tempe.
Lee Engineering reviewed existing bicycle facilities using city-provided bike data to identify bicycle system obstacles and gaps including:
Barriers to bicycling as identi ed by the public Missing links from Phoenix to/from bicycle
facilities in neighboring cities and towns Arterial street segments with potential to
retro t bicycle lanes within the existing cross-section
The maps that follow show locations identi ed as barriers to bicycling. The map also depicts where bicycle facilities are not continuous with adjacent agencies, lack of bicycle facilities on the arterial street network, and locations with potential for retro t.
The City of Phoenix incorporates bicycle facilities on the street network by designing new roadways with bicycle facilities, restriping existing street right-of-way to accommodate bicycle lanes, and implementing road diets.
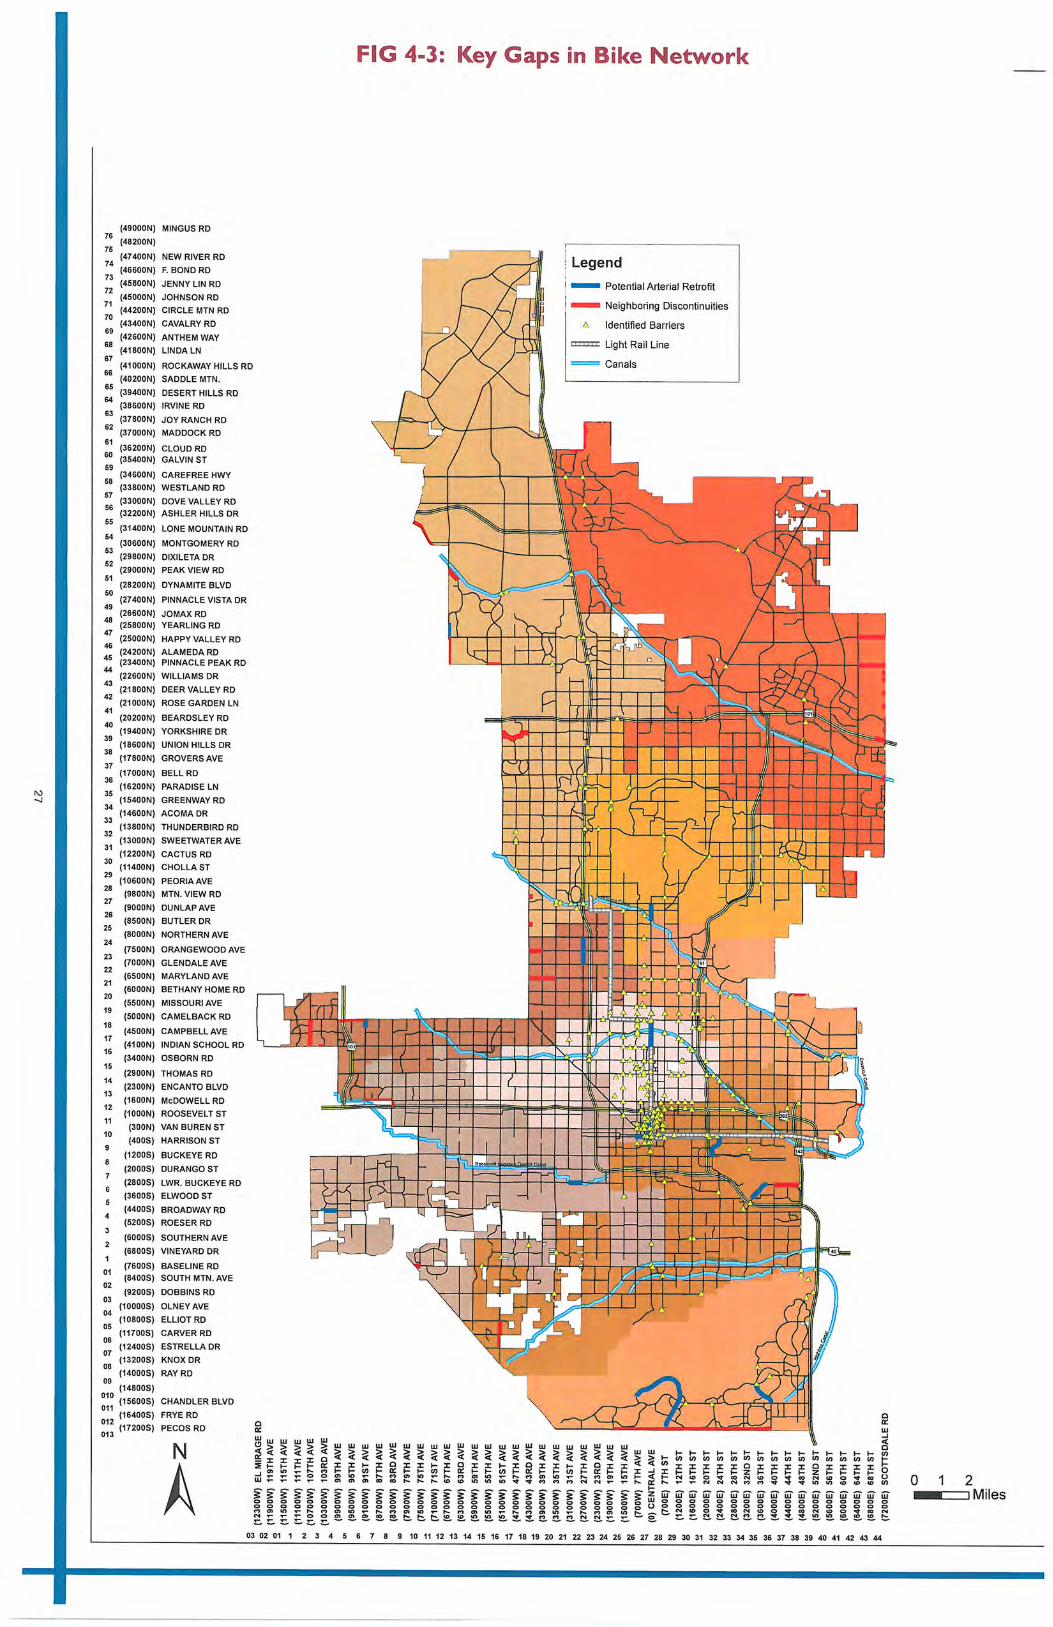

THIS PAGE IS INTENTIONALLY LEFT BLANK

29
RECOMMENDATIONSSTRATEGY:
Measure changes in the level of bicycling throughout the community.
ACTION: Conduct biannual bicycle counts. Analyze Maricopa County Trip Reduction
Survey data annually and suggest adding survey questions to enhance bike to work data.
OBJECTIVE: Seek funding to add bike facilities and improve
connections with Glendale and Tempe based on this data.
STRATEGY: Continue monitoring condition and extent of
bike facilities throughout the City.
ACTION: Develop interactive smart phone application for
bicycle facility inventory and reporting.

THIS PAGE IS INTENTIONALLY LEFT BLANK

MAKING CONNECTIONS
31
GOAL:
A strong bike
culture will be
the norm, not
the exception,
organization,
community,
actions.
Public policy
will be
connected
with the
more people
riding bikes,
more often.
Bicycling will
be easy, safe
fun, and an
accepted
mode of
transportation
and
recreation.
Over the past decades, there has been a cultural shift in how bicycling is perceived. Bicycling will be:
a viable mode of transportation for those who cannot or choose not to drive; recognized as the norm an integral component in providing an accessible public transit system; and viewed as a means to enhance the quality of life and accessibility of a community.
This chapter discusses opportunities and constraints as re ected in government actions to institutionalize bicycle friendly practices into the city’s transportation planning processes.
There are several City departments and regional and statewide agencies engaged in bicycle planning and/or directly impacted by implementation of bicycle friendly policies. Additionally, bicycle paths on regional transportation routes such as State highways and some regionally important roadways must be coordinated with relevant agencies and entities. It is important that these agencies support Phoenix’s vision to be a Platinum Level Bicycle Friendly community by 2034. To date, many of the agencies and entities that are engaged in bicycle planning throughout Phoenix and the region have developed speci c plans and policies that provide them with guidance to support the development of bicycle facilities. These plans and policies are listed in Table 5-1: Existing Bicycle Plans and Policies.
In 2008, the City of Phoenix Street Transportation Department identi ed $19 million in unfunded bicycle of transportation program needs. Identi ed projects included bike structures, shared use paths, safety projects, major and street improvement projects to accommodate bicycles, bike lane retro t projects, and bike program operations. To date, some of these needs are still unfunded with an additional $52.7 million identi ed to complete the priority corridor projects of this Master Plan.
C H A P T E R
5

32
Plan/Policy/ Enforcing Entity
MUTCD Federal Highway Administration (FHWA)
Provides legal requirements and options for traf c control devices for bicycle facilities and operations.
AASHTO Guide for Design of Bicycle Facilities
American Association of State Transportation Agencies (AASHTO)
Provides design guidance for bicycle transportation facilities as adopted by state agencies.
NACTO Urban Street Design Guide
National Association of City Transportation of cials
Charts the design principles and strategies that cities are adopting to confront 21st Century demands on their streets.
NACTO Urban Bikeway Design Guide
National Association of City Transportation of cials
Provides design guidance and options for bicycle transportation facilities as adopted by an organization of cities.
City of Phoenix (2002). Phoenix General Plan – Bicycling Element.
City of Phoenix
The Bicycling element sets forth goals, policies, and recommended programs that will help enhance bicycle facilities within the City of Phoenix. The three goals are- Bicycle access: increase bicycle access to destinations in Phoenix and maximize bike route connections to other cities; Ridership: increase bicycle ridership by removing barriers, improving facilities and providing more information; Safety: improve bicycling safety through more education, better signage and installation of more safety features. Includes the Planned Bikeway System Approved 1987 consisting of approximately 588 miles of bike facilities.
City of Phoenix (2009). City of Phoenix Street Planning and Design Guidelines. Chapter 10– Bikeways.
City of Phoenix
These standards are for planning and designing both on- and off-street types of bikeways within the City of Phoenix. It contains detailed information on the location of bikeways and the signs and markings for each type. Guidance for bikeways affected by construction and a list of maintenance responsibilities is provided. National, regional, and local design standards to be used in conjunction with this document are listed.
2012 City of Phoenix Supplement to 2012 MAG Uniform Standard Speci cations
City of Phoenix
These Speci cations are developed for public works construction within the City of Phoenix and include construction of improvements that will be owned and/or maintained by the City of Phoenix. These Speci cations are not intended to supersede the City of Phoenix Construction Code, or any other applicable law, or ordinance. Multi-Use Trails shall allow bicycle use with tread and surface conditions that allow side-by-side travel and ease of passing by bicycles.
City of Phoenix (2011). Traf c Operations Handbook. Chapter 5 – Pedestrians and Bicyclists
City of Phoenix
The purpose of this chapter is to provide guidelines on the design and operation of bike facilities. The de nition of bicycles and requirements on bicycle equipment and usage, by law, is provided. Four types of bikeways and two functional types are de ned. The procedure for installing bicycle racks is detailed. Several portions of this handbook chapter are pending in draft form.

33
Plan/Policy/ Enforcing Entity
City of Phoenix (additions and revisions in 1997 and 2003). City of Phoenix Zoning Code(Canal Design Guidelines).
City of Phoenix
These Canal Bank Design Guidelines applies to all development in the City of Phoenix on both public and private land adjacent to Highline, Grand, Arizona, and Western canals which is subject to development review. It states that canal banks be a primary component of pedestrian, bicycle, and equestrian pathways. There is mention of cyclists in regards to safety where canals cross arterials and adjacent to power easements.
Perez, J. (2012). Bicycle Minimum Green Times at Signalized Intersections.
This internal memorandum provides a methodology for calculating minimum green times based on street width, speed limits, yellow and red time to accommodate bicyclists stopped at a signal. Bicycle minimum green times can be as low as 4.9 seconds to cross a 40 foot road and as high as 9.7 seconds to cross a 132 foot road. It is recommended that a bicyclist be present to test any changes to signal timing, especially at wider intersections. Look-up tables are included.
Perez, J. (2012). Bicycle Acceleration at Signalized Intersections.
This paper reviews the FHWA publication Characteristics of Emerging Road Users and Their Safety, which analyzes performance characteristics of human powered objects, including bicycles. The FHWA report provides a table of distance versus observed times for various user types. An important observation is that hand cyclists, entitled to use bike lanes, do not meet the lowest bicycle acceleration rate suggested for use in AASHTO guidelines. The City of Phoenix allows engineering judgment to determine whether to use the AASHTO equation (with the recommendation of using a bicycle acceleration rate of 1.5 ft/s2) or the FHWA table for hand cyclists to calculate minimum green time.
Perez, J. (2013). Bicycle Detection at Traf c Signals. Perez, J. (2011). Bicycle Detection at Traf c Signals.
These papers discuss different technologies for bicycle detection at intersections for the City of Phoenix and neighboring cities. Information regarding the Bicycle Detector Pavement Marking and Bicycle Signal Actuation Sign (R10-22) is provided. Information regarding Bicycle Push Buttons, Bicycle Signal Heads, Bicycle Boulevard Intersection needs, Bicycle Detector Pavement Markings and Bicycle Signal Actuation Signs are provided. References are listed.
City of Phoenix (2007). Traf c Barricade Manual.
City of Phoenix
This 2007 edition of the Traf c Barricade Manual was developed based on the eld experience of the city’s most experienced traf c control inspectors and professional traf c engineers. The primary goal of the TBM is to provide guidance for implementing the most effective temporary traf c control in our urban public streets and complement the Arizona Manual on Uniform Traf c Control Devices, and includes guidance for bicycles in temporary traf c control zones.
Phoenix Code. Chapter 36 Vehicles and Traf c. Article IX. Bicycles
City of PhoenixChapter 36 Vehicles and Traf c, Article IX, includes legal requirements for bicycle licensing, operating a bicycle, bicycle parking, and the disposition of abandoned bicycles.

34
Development of the Phoenix Bicycle Master Plan included reviewing and assessing existing Phoenix policies, practices, and procedures for traf c control and bicycle facility design with respect to the standards and guidelines published by AASHTO, MUTCD, and NACTO.
Recommendations were developed based the review and assessment described above. General recommendations addressing the City of Phoenix’s bicycle facility design and traf c control guidance is provided in the objectives of this Area of Excellence. These should be taken into account when the City updates the documents listed Table 5-1 or develops new guidelines addressing bicycle facility design or traf c control. A detailed assessment of each of the documents reviewed is provided in Appendix D.
Design options, organized into the following categories, are provided in Chapter 9-Design & Connectivity:
Design options for roadway segments Design options for intersections Off-street design options Design options for bicycle parking Way nding
It is largely the responsibility of various city departments to plan, design and operate the bicycle network in Phoenix. Phoenix will also be involved in enforcement and education activities. While much of the funding for the construction and operations may come from city government, through the proper application of zoning ordinances a large part of the infrastructure may be provided through developer improvements. Additionally, there is a need for public/private involvement and coordination with the State and regional agencies for planning and implement of regional bicycle facilities.
Plan, design, build, operate and maintain bicycle facilities in the public rights-of-way. The Street Transportation is also involved in education and encouragement activities (promoting bike to school and bike to work events, and promoting helmet use and educating young cyclists). Explore bicycle facility funding opportunities through grants.
Plan and provide design guidelines for bicycle facilities. Ensure developers provide the facilities required through ordinances or as indicated in the bike master plan.
Established to get more people on bikes more often and works to improve resource ef ciency, air quality, public health, safety and welfare.
Enforce traf c laws and ordinances for the rules of the road for motorists and bicyclists, and assists in providing education to drivers and bicyclists. Assists in major bike events and bicycle rodeos in Phoenix. Completes Arizona crashes for all motor vehicle collisions involving bicycles.
Plan, design, operate and maintain bicycle facilities within the phoenix parks system.
Promote bicycling and bicycle facility development and help to coordinate information outreach to their constituents.
A nonpro t organization funded by an assessment on property owners within the 90-square-block area of the Downtown Phoenix Business Improvement District. The boundaries for this district are Seventh Street on the east to Third Avenue on the west, and Fillmore Street on the north to the Union Paci c tracks (south of Jackson Street) on the south. Some of their activities include: streetscape and urban design, transportation and parking coordination, branding, public relations, and Public Policy Facilitation for their district.
Prepares statewide bicycle plan. Coordinates bicycling design guidelines and standards throughout the state. Provides AHUR funding and oversees HSIP and other Federal grant programs that may be used for bicycle infrastructure improvements and safety projects.
Consists of regional member agencies as well as the development, architecture, landscape architecture communities, Valley Metro and the Coalition of Arizona Bicyclists. Earlier versions of the committee developed a Regional Bicycle Plan, the Regional Off-Street System Plan, and the Regional Bikeways Map. The committee encourages the implementation of these plans by recommending pedestrian and bicycle-related projects for funding from federal and other sources as well as activities to inform the region about the bene ts of biking and walking.
Provides school crossing guard training and oversees Safe Route to School grant applications in the MAG planning area.
The Regional Public Transportation Authority (RPTA) operates the regional bus system and light rail transit (LRT) system. They accommodate bicycle travel by providing bike

35
racks on all buses and allow bicycles to board light rail trains to extend the range of bicycling across the valley. Provides education on how to use the bus bike racks. Bicycle parking storage is provided at a number of transit centers and some major stations.
Provides funding to agencies throughout Arizona to promote bicycle safety, including funds to purchase bike helmets for low income school children in support of Bike to School events and Bike rodeos
Through an IGA, allows the maintenance roads along the SRP irrigation canals to be used for walking and bicycling.
Promotes efforts that improve bicycling usage and safety within the state of Arizona by addressing law enforcement and transportation engineering issues through education, outreach and advocacy programs thereby enhancing the role of bicycling in local, county and statewide transportation plans.
A community of urban bicyclists dedicated to making the downtown Phoenix area a friendlier, more welcoming place to ride a bike regardless of age, gender, race, income or bicycling ability, with a mission of inspiring cycling as a transportation option for Phoenix.
Provide bicycle infrastructure in the right of way or on private property within their development (as required by the zoning ordinance, general plan or desire to provide a bicycle-friendly environment for their community) and operate and maintain the bicycle facilities on their private property
Operates two major campuses in Phoenix; Downtown campus and the West campus that are major generators of bicycle transportation. Provides bicycle parking at various locations on their campuses.
Generate bicycle traf c and must provide a safe route to enter their facilities and bicycle storage for their faculty and students.
RECOMMENDATIONSGOAL:
A strong bike culture will be the norm, not the exception, as re ected in government organization, community, and individual actions. Public policy will be connected with the desire to have more people riding bikes more often. Bicycling will be easy, safe, convenient, fun, and an accepted mode of transportation and recreation.
STRATEGY: Review and update of City policies, procedures,
codes, ordinances, guidelines, and standards to promote bicycle safety and facilities.
ACTION: By 2015, review and update 100% of documents,
and then biannually thereafter Guidance on bicycle facility design and traf c control should be consistent across all City of Phoenix guidance documents.
OBJECTIVE: Guidance on bicycle facility design and traf c
control should reference the most up-to-date standards and guidance provided by the MUTCD with the Arizona Supplement and guidance provided by AASHTO and NACTO.
Guidance on bicycle facility design should allow for exibility in design, sensitivity to roadway context, and the application of engineering judgment.
Guidance on bicycle facility design and traf c control should allow for innovative bicycle facilities.
Guidance on bicycle facility design should recommend separated facilities like cycle tracks and buffered bicycle lanes that accommodate users of all ages and abilities, where feasible.
Guidance on bicycle facility design and traf c control should address bicycle accommodation and bicycle facilities at intersections.
Guidance on bicycle facility design should include cross sections with typical widths for bicycle and pedestrian facilities and travel lanes.

36
STRATEGY: Achieve Platinum-level Bicycle Friendly
Community Status from the League of American Bicyclists .
OBJECTIVE: By 2019, receive Bronze Bicycle Friendly
Community award
By 2024, receive Silver Bicycle Friendly Community award
By 2029, receive Gold Bicycle Friendly Community award
By 2034, receive Platinum Bicycle Friendly Community award.
STRATEGY: Broaden the responsibility for creating a bicycle
-friendly community among engaged and impacted City Departments.
ACTION: Create an interdepartmental bicycle Task Force
to plan for, fund, manage and maintain bicycle facilities.
Establish and promote City of Phoenix as a bicycle friendly community.
Promote federal tax incentives for “bike to work.”
Pursue federal grants through the National Endowment for the Arts that could be applied for “Functional Art” - art that can be used as shade structures. ADOT, MAG, Street Transportation Department, along with trained members of the Police bike patrol should assist in educating other police of cers on bicycle laws, ordinances and operating characteristics, especially motor of cers and those involved in lling out crash reports. The League of American Bicyclists or FHWA can provide training expertise in this effort .
The Police department should partner with the Street Transportation Department on reporting de ciencies within the street network that may have an adverse effect on bicycling, such as pot holes, missing or damaged signs, worn pavement markings, landscaping blocking visibility or encroaching into a bike lanes, and streetlight outages along city streets. Routine requests can be reported via Intradepartmental Service Requests (SSRs), or be reported via email or by phone to a Street Transportation dispatcher.
The Street Transportation Department should partner with the Planning and Development Services Department on future bicycle facility infrastructure and implementation involving individual site plans as well as master plan developments. The Street Transportation Department should partner with the Aviation and Transit Departments and Valley Metro on improved means for bicycle access and bicycle parking facilities at the airports and at various transit centers.
The Street Transportation Department should partner with the Transit Department and Valley Metro to count how many patrons with bikes cannot be accommodated on buses (along with the number who currently ride on buses).
The various divisions within the Street Transportation Department should coordinate with the Phoenix Bike Coordinator on bicycle facility design and operation practices and guidelines, the street overlay program, striping changes, the CIP, and other issues within the department that would affect the bicycle system or program.
The Street Transportation Department should continue to partner with the Police and City Council of ces, GOHS, local health agencies/bike advocates and schools to sponsor bicycle rodeos and promote bike to school day events to encourage bicycling at a young age and to educate the young bicyclists.
The Street Transportation Department should partner with the Parks and Recreation Department to identify opportunities to provide improved connections between on-street bicycle facilities with off-street trails/paths and to explore trailblazing and other guide signing for off-road trails.
The Phoenix Street Transportation Department should partner with the Downtown Phoenix Partnership and representatives of the ASU Downtown campus and Valley Metro to explore improvements in the bicycle network, bicycle connections and parking facilities in the downtown area, and identify optimal Bike Share station locations. These same agencies should partner to promote and educate new users when the Bike Share becomes available to the public.
The Street Transportation Department and Police should partner with Channel 11 and other media outlets (such as radio traf c alerts) to provide bicycle safety PSAs and other educational outreach to motorists and bicyclists

37
The Street Transportation, Planning and Development Services, Police, and Law Departments should partner to review the zoning and traf c ordinances to make them more Bicycle Friendly and promote the addition of improved/additional bicycle facilities with new development or redevelopment.
STRATEGY: Strengthen regional transportation planning
coordination with state and regional governmental agencies and public services providers.
ACTION: ADOT, MAG, RPTA, SRP, Maricopa County,
adjoining cities The City of Phoenix Street Transportation Department and Police Department should partner with bicycle advocacy organizations and health organizations for improved bicyclist education and to promote bicycle helmet use, especially amongst children and novice bicyclists.
The Street Transportation Department should continue to partner with ADOT to apply for HSIP or other grants that may be used to provide bicycle safety improvements.
The Street Transportation Department should partner with MAG and local advocacy groups to conduct regular Cyclovia events.
The Street Transportation Department should continue to participate on the MAG Bicycle and Pedestrian Committee and the Transportation Safety Committee to coordinate implementation of regional bicycle facilities and to explore the possibility of obtaining MAG Design Assistance funds for bicycle enhancements and safety education and improved regional facility connectivity. A partnership should also be created with MAG to provide continued bicycle ridership count studies in future years to monitor ridership.
The Street Transportation Department should partner with SRP to provide paved canal paths along all of the SRP irrigation canals and provide more canal crossing opportunities.
The Street Transportation Department should partner with bicycle organizations, businesses, schools, HOAs and members of the community to create an “Adopt-A Bike-Route” program to clean (trash removal) and better monitor bicycle facilities, especially for off-street routes.
The Street Transportation Department should partner with ADOT to explore additional opportunities to provide bicycle crossings across the freeways in Phoenix, both at-grade crossings and with bicycle/pedestrian bridges such as along the Grand Canal path and at other locations.
The Parks and Street Transportation Department should partner with ADOT to assure the addition of a bicycle path along the proposed SR202 Loop South Mountain freeway.

THIS PAGE IS INTENTIONALLY LEFT BLANK

MAKING CONNECTIONS
39
GOAL:
made for
bicycling will
be smart,
focused, and
equitable.
The City of
Phoenix will
existing
assets
and create
partnerships
with local,
county, and
state agencies
to build out
the bicycle
infrastructure
network.
Many communities – Phoenix included – began bikeway implementation in areas where pilot projects could be built at low to moderate costs, with community backing and support, as opportunities arose. Other bike facilities were built as developer offsite improvements or with individual major street improvement projects. The result is a collection of individual bikeway segments that do not provide the network connectivity desired by cyclists who wish to ride for transportation or longer-distance recreational pursuits. Second generation bicycle plans therefore often look at how to overcome cross-town travel barriers and complete missing gaps in a community’s bicycle network. The challenge is determining where to start when many diverse and worthy projects combine to form the long-range bicycling vision of a community.
With limited resources to commit, the City identi ed and prioritized 39 corridors to focus future bicycle infrastructure investments. The roster of prioritized corridors is provided in the following pages. A variety of on-street and off-road bicycle projects were identi ed to complete gaps and make connections within these corridors. These projects have been prioritized using a methodology that re ects community values, builds upon best practices in bikeway planning, and takes advantage of the latest national research on safety and other issues. The outcome is a three-tiered approach to implement need-based projects over short, medium, and long-term planning horizons.
C H A P T E R
6

40
The City of Phoenix Bicycle Master Plan served as a national pilot methodology for evaluating corridors and selecting bicycle improvement projects. Figure 6-1 summarizes the iterative approach of this methodology. Appendix E: Prioritization Methodology details the methodology used. Factors such as demand, connectivity, stakeholder input, safety, existing conditions, constraints, and equity were weighted and used to develop a ranked list of prioritized projects. The initial phase of recommendations will be implemented as part of the ve-year Capital Improvement Program (CIP); projects associated with Tier II and Tier III corridors will be addressed in future years of bike plan implementation. Implementation of all priority corridor projects will result in 351 miles of seamlessly connected bikeways focused in areas with high bicycling demand to equitably serve the citizens of Phoenix. The planning level unit cost estimates established for the various types of bicycle facility improvement projects are provided in Appendix F. In total, the City of Phoenix will seek $52.7 million in funding for these projects.
The prioritized roster of Tier I, Tier II, and Tier III projects are provided in Appendix G, Appendix H, and Appendix I, respectively. Bike projects range from extending the bike lane to the intersection to providing on-street bike lanes, or shared lane markings to bicycle bridges over I-17. Each has their own unique cost, and the costs developed for the Phoenix Bike Master Plan are considered “planning level costs” that may vary based on individual characteristics at a site. Except for the proposed bicycle bridge over I-17 and the paving of the SRP or CAP canal paths, all bike lane projects are proposed to be built within existing right-of-way.
Completion of Tier I corridor projects will add 32 miles of bikeways and improve bicycle safety and mobility through 50 intersections. The planning level in-house cost estimate to implement these projects is $4,031,000. The highest priority corridors for implementation include the following, in order ranked:
1
2
3
4
5 Osborn Road
6
7
8
9
10
Completion of Tier II corridor projects will add 33 miles of bikeways, make an important connection across the I-17 freeway, and improve bicycle safety and mobility through 108 intersections. The planning level in-house cost estimate to implement these projects is $14,008,000. An additional $9,320,000 would be invested to pave the Grand Canal Trail. The Tier II corridors for implementation include the following, in order ranked:
11
12
13
Identify/Rank Improvements along Corridors
Focusing on Tier 1
PrioritizeCorridors and
Separateinto 3 Tiers
Develop DemandHeat Map and
Identify Corridors

41
29 Highline Canal
Parkway
30
31
32 Dobbins Road
33 Western Canal
34
Highway
35 Broadway Road
36 Deer Valley Road
37
38
39 CAP Canal
The Ad Hoc Task Force members expressed a desire to highlight a select number of bicycle corridors within Phoenix to brie y describe why the route is important for cyclists, to highlight the important features and destinations along the corridor, and to indicate the needs along these corridors. The corridors were selected to represent a cross-section of Phoenix Council Districts as well as a cross-section of the Tiered Corridors (priorities) and include a diversity of recreation, commuter and school corridors within Phoenix to highlight their bene ts. Consensus from the Ad Hoc Task Force is that Central Avenue should be the primary focus of the pro le corridors because of the statement it makes in Phoenix and in the Comprehensive Bicycle Master Plan. The other selected corridors include 3rd Street, Osborn Road, Deer Valley Road, Dobbins Road, Arizona Canal, 47th Avenue, and 19th Avenue. Brief narratives and photos are provided to highlight each corridor.
14
Road
15
16 Ray Road
17
18 from Baseline Road to Pecos Park
19
20
21
22
23
Completion of Tier III corridor projects will add 55 miles of bikeways and improve bicycle safety and mobility through 125 intersections. The planning level in-house cost estimate to implement these projects is $10,798,000. An additional $14,550,000 would be invested to pave the Arizona, Highline, Western, and CAP Canal Trails. The Tier III corridors for implementation include the following, in order ranked:
24
25
26 Roeser Road
27 Baseline Road
28 Arizona Canal

THIS PAGE IS INTENTIONALLY LEFT BLANK


THIS PAGE IS INTENTIONALLY LEFT BLANK


THIS PAGE IS INTENTIONALLY LEFT BLANK


THIS PAGE IS INTENTIONALLY LEFT BLANK

49
A citizens’ backed 3rd Street Promenade initiative has the potential to transform 3rd Street through midtown and downtown to a corridor for multimodal, human-powered transportation. In downtown, the evolving Biomedical Campus is bordered by 3rd and 5th Streets. This is the highest ranked corridor in the Comprehensive Bike Master Plan and provides an important north/south connection into the central core for commuting, college students, and for recreational uses.
The 3rd Street Corridor provides connectivity from the Steele Indian School Road Park/Arizona Veteran Home/VA Medical Center through the ASU Downtown Campus and Biomedical Center, past Chase Field and connecting into Buckeye Road where ASU is considering expanding classrooms. There is a direct connection to the Washington/Jefferson Street routes
and LRT. Some of the signi cant destinations along the 3rd Street corridor include Phoenix Center for the Arts and Margaret T Hance Park, UofA Medical School, Herberger Theater Center, Symphony Hall, Arizona Center, Phoenix Convention Center, US Airways Center, Heritage Square and the Phoenix Sheraton Hotel which is the largest hotel in Phoenix. For route continuity and clarity, the 3rd Street bicycle corridor should exist along 3rd Street as a two-way route.
Lower speeds and moderate traf c volumes Connectivity to the ASU downtown campus and
large student populations Connectivity to Osborn Road and the
Washington/Jefferson Street corridors through downtown Phoenix
Connection to LRT Connection to major sports venues in downtown
Phoenix (Arizona Diamondbacks and Phoenix Suns)
Good crossing over I-10
High on-street parking demand from Fillmore Street to Jefferson Street
Lack of space dedicated to bicycling in the downtown corridor
May need to remove some parking to accommodate bicycle facilities
Railroad crossing south of Jackson Street One-way operation between Fillmore and
Roosevelt Street
Central Avenue is the heart of midtown Phoenix and the connector from north Phoenix to this country’s largest municipal park, South Mountain Park. Central Avenue presently supports METRO light rail from Camelback Road to Jefferson Street with further extensions south planned. As Phoenix’s primer main street, it has the potential to be our Champs-Élysées with density and diversity of people, places, and things. Recently repaved with the construction of METRO, it is central Phoenix’s smoothest streets to ride.
This route provides a connection from the Sunnyslope area to downtown Central Business District to South Mountain Park. It supports a diversity of commuter, recreational and school trip purposes. This central
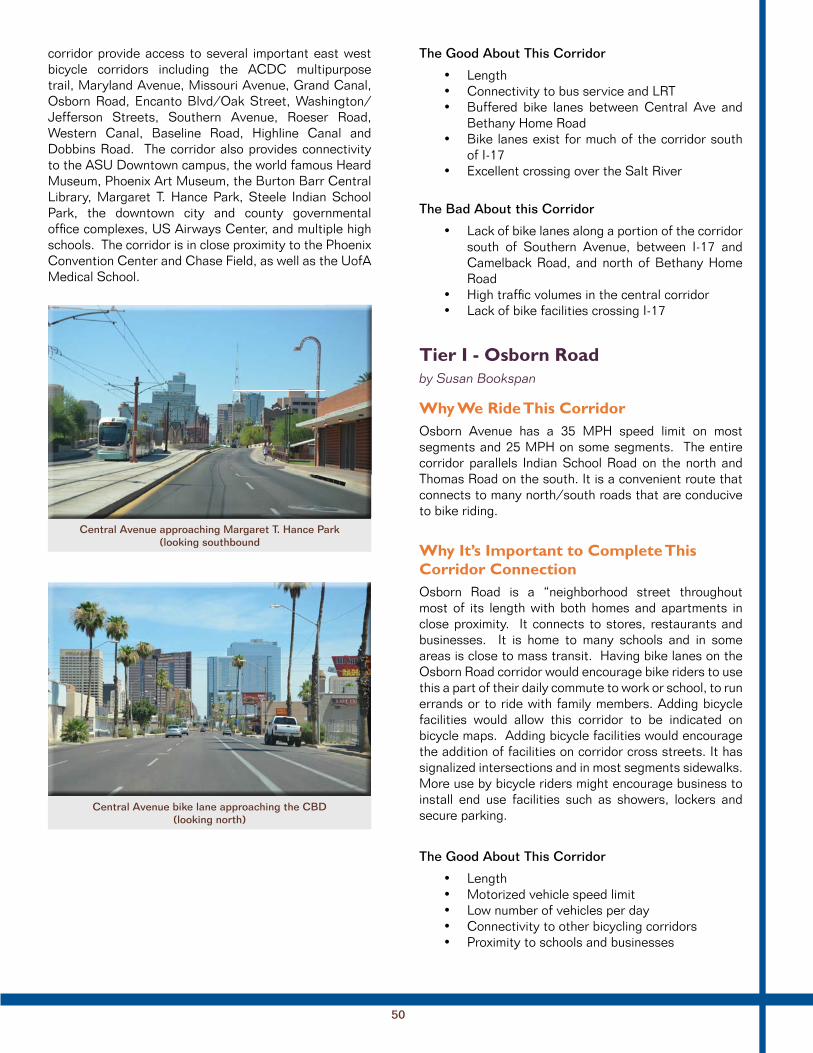
50
corridor provide access to several important east west bicycle corridors including the ACDC multipurpose trail, Maryland Avenue, Missouri Avenue, Grand Canal, Osborn Road, Encanto Blvd/Oak Street, Washington/Jefferson Streets, Southern Avenue, Roeser Road, Western Canal, Baseline Road, Highline Canal and Dobbins Road. The corridor also provides connectivity to the ASU Downtown campus, the world famous Heard Museum, Phoenix Art Museum, the Burton Barr Central Library, Margaret T. Hance Park, Steele Indian School Park, the downtown city and county governmental of ce complexes, US Airways Center, and multiple high schools. The corridor is in close proximity to the Phoenix Convention Center and Chase Field, as well as the UofA Medical School.
(looking southbound
Length Connectivity to bus service and LRT Buffered bike lanes between Central Ave and
Bethany Home Road Bike lanes exist for much of the corridor south
of I-17 Excellent crossing over the Salt River
The Bad About this Corridor
Lack of bike lanes along a portion of the corridor south of Southern Avenue, between I-17 and Camelback Road, and north of Bethany Home Road
High traf c volumes in the central corridor Lack of bike facilities crossing I-17
by Susan Bookspan
Osborn Avenue has a 35 MPH speed limit on most segments and 25 MPH on some segments. The entire corridor parallels Indian School Road on the north and Thomas Road on the south. It is a convenient route that connects to many north/south roads that are conducive to bike riding.
Osborn Road is a “neighborhood street throughout most of its length with both homes and apartments in close proximity. It connects to stores, restaurants and businesses. It is home to many schools and in some areas is close to mass transit. Having bike lanes on the Osborn Road corridor would encourage bike riders to use this a part of their daily commute to work or school, to run errands or to ride with family members. Adding bicycle facilities would allow this corridor to be indicated on bicycle maps. Adding bicycle facilities would encourage the addition of facilities on corridor cross streets. It has signalized intersections and in most segments sidewalks. More use by bicycle riders might encourage business to install end use facilities such as showers, lockers and secure parking.
Length Motorized vehicle speed limit Low number of vehicles per day Connectivity to other bicycling corridors Proximity to schools and businesses
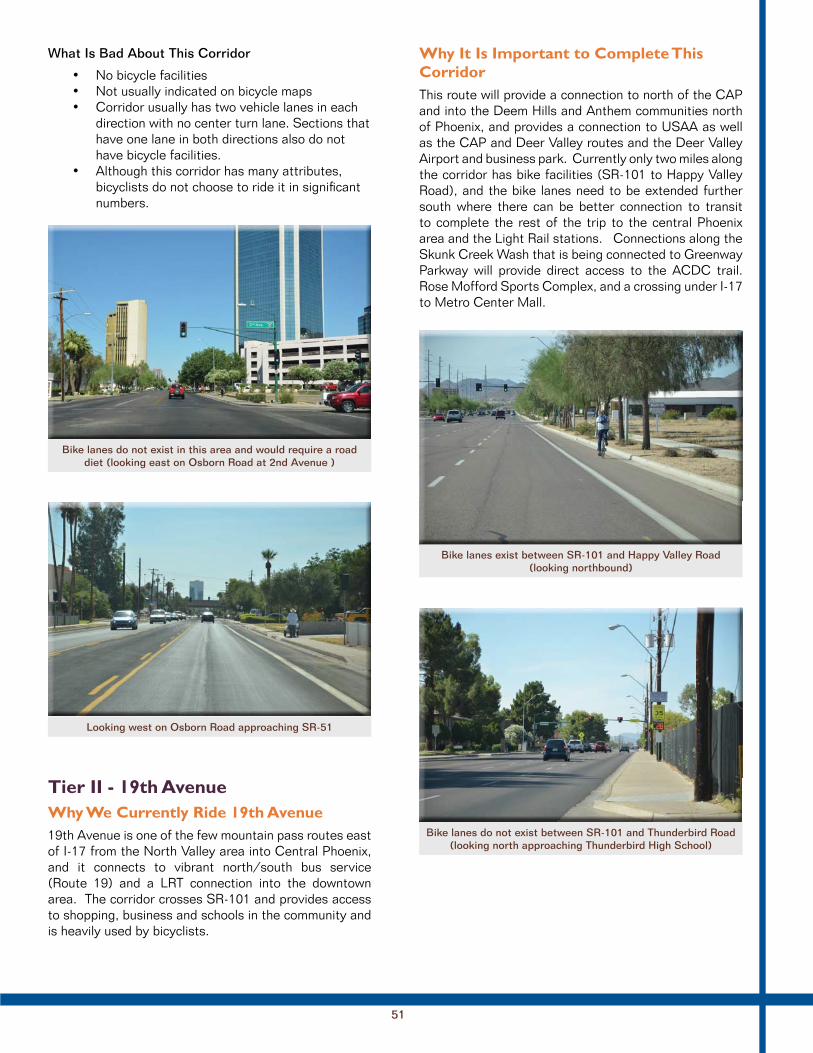
51
No bicycle facilities Not usually indicated on bicycle maps Corridor usually has two vehicle lanes in each
direction with no center turn lane. Sections that have one lane in both directions also do not have bicycle facilities.
Although this corridor has many attributes, bicyclists do not choose to ride it in signi cant numbers.
Bike lanes do not exist in this area and would require a road
19th Avenue is one of the few mountain pass routes east of I-17 from the North Valley area into Central Phoenix, and it connects to vibrant north/south bus service (Route 19) and a LRT connection into the downtown area. The corridor crosses SR-101 and provides access to shopping, business and schools in the community and is heavily used by bicyclists.
This route will provide a connection to north of the CAP and into the Deem Hills and Anthem communities north of Phoenix, and provides a connection to USAA as well as the CAP and Deer Valley routes and the Deer Valley Airport and business park. Currently only two miles along the corridor has bike facilities (SR-101 to Happy Valley Road), and the bike lanes need to be extended further south where there can be better connection to transit to complete the rest of the trip to the central Phoenix area and the Light Rail stations. Connections along the Skunk Creek Wash that is being connected to Greenway Parkway will provide direct access to the ACDC trail. Rose Mofford Sports Complex, and a crossing under I-17 to Metro Center Mall.

52
Length Connectivity to bus service along 19th Ave to
Central Phoenix and LRT Connectivity to other major bicycle corridors
(CAP, Deer Valley, Skunk Creek Wash) Crosses SR-101 and CAP Proximity to Deer Valley Airport, USAA, Turf
Paradise, Deer Valley Park and Community Center, schools, shopping and other business along 19th Avenue
Provides a connection to the communities north of Carefree Highway as well as Pioneer Living History Museum
The Bad About this Corridor
Lack of bike lanes south of SR-101 and through the SR-101 interchange
High traf c volume and speeds Lack of full road improvements between Happy
Valley Road and Jomax Road Lack of bike lanes through the mountain pass
south of Thunderbird Road
by Susan Bookspan
Missouri Avenue has a 35 MPH speed limit, begins at 24th Street traverses Phoenix and continues through Glendale. The entire corridor parallels Camelback Road, so it is a convenient route that connects to many north/south roads that are conducive to bike riding.
Missouri is a “neighborhood street throughout most of its length. It connects to stores, restaurants, businesses and schools and is close to mass transit. Having bike lanes on the Missouri corridor would encourage bike riders to use this a part of their daily commute to work or school, to run errands or to ride with family members. Adding bicycle facilities would allow this corridor to be indicated on bicycle maps. Adding bicycle facilities would encourage the addition of facilities on corridor cross streets. Has signalized intersections and in most segments sidewalks. More use by bicycle riders might encourage business to install end use facilities such as showers, lockers and secure parking.
Length Motorized vehicle speed limit Low number of vehicles per day Connectivity to other bicycling corridors Proximity to schools and businesses
Few bike facilities Not usually indicated on bicycle maps Corridor has two vehicle lanes in each
directions which is not bicycle friendly Although this corridor has many attributes,
bicyclists do not choose to ride this corridor with its lack of bicycle lanes.

53
by Bob Pane
Deer Valley Road is one of the few continuous routes that connects the west valley to the east valley north of the 101 freeway, 35th avenue to 56th street. The Reach 11 Sports Complex is situated along the route.
Deer Valley is a major thoroughfare across the northern portion of the City. It connects to stores, restaurants, businesses, schools, airports and is one of only a handful of bike lanes that cross I-17. Reach 11 Sports Complex is located along the route which is a focal point for numerous sporting events and major cycling events. It connects with Cave Creek Road another major bike
corridor that has access to the Sonoran Desert Drive. At its farthest eastern extent it connects to 56th street which allows access to the south into the east Phoenix area and also bike lanes that tie into Scottsdale. Pinnacle High School is just south of Deer Valley and east of that are two major shopping destinations, Desert Ridge and City North.
Length Travelled by cyclists seeking long distance routes Connectivity to other bicycling corridors Proximity to schools and businesses including
Deer Valley Airport and Deer Valley Rock Art Center
One of a small number of bike routes crossing I-17
High traf c volume and speeds No bike lanes east of Reach 11 towards Pinnacle
High School No bike lanes between 40th Street and Tatum
Boulevard where Desert Ridge Mall is located No bike lane crossing the I-17 interchange in the
westbound direction Few bike facilities
by Erika Keenan
Dobbins Road is currently a two-lane, uncurbed, undivided east west roadway. The current posted speed limit is 40 mph between Central Avenue and 27th Avenue, 50 mph west of 27th Avenue and 40 mph at the old Laveen Elementary School.
Major intersections along the Dobbins Road corridor include: Central Avenue, 7th Avenue, 19th Avenue, 27th Avenue, 35th Avenue, 43rd Avenue, 51st Avenue and 59th Avenue. The Dobbins Road corridor currently has at least 9 public/charter schools located on or within a ¼ - ½ mile distance off these major intersections. Safe Routes to schools for both child pedestrians and cyclist make this corridor a priority for District 7 and District 8. Because of the density and zoning criteria for South Phoenix and Laveen, homes/schools aren’t quite as close as in downtown Phoenix and hence, a distance of 1 mile commute to a school is more typical.

54
Central Avenue 7th Avenue
- Southwest Elementary School (physically located on Dobbins Road)
- Nina Pullman Center for Compassion Arizona Human Society
- City of Phoenix Fire Station- Valley View School (.5 miles north of
Dobbins on 7th Ave) 19th Avenue 27th Avenue
- Eagle College Prep Elementary School (.4 miles from Dobbins to South Mountain Avenue)
35th Avenue- Cesar Chavez Park ( .5 mile from Dobbins)- Major bus stop at 35th Avenue and
Baseline Road ( .8 mile from Dobbins) 43rd Avenue (there should be a cross walk at
this intersection due to all the schools)- Laveen Elementary School ( . 3 mile South
of Dobbins)- Legacy Traditional School (.7 mile North of
Dobbins)- Vista del Sur Elementary School (.4 miles
to turn onto South Mountain Avenue) - Cesar Chavez High School (1 mile from
Dobbins Road)- Heritage High School (1 mile from Dobbins
Road) 51st Avenue
- City of Phoenix Fire Station- Old Laveen Elementary School, while
owned by the Laveen Elementary School District, rents space to: South Mountain Community College, the Laveen Art League, which holds community events.
- Laveen Elementary School District Of ces, and the well-used community baseball elds owned by the Laveen District of ce.
- Old Laveen Baptist Church 55th Avenue
- Betty Fairfax High School (.6 mile from Dobbins Road)
There are various SRP irrigation canals and nationally registered or eligible historic places existing on or near either side of Dobbins Road from Central Avenue to 67th Avenue. For this reason, it is important to preserve the historic and rural charter of Dobbins Road and the canals. The canal between 19th Avenue and 23rd Avenue has been determined to be eligible for Nation Historic Registry listing. The Western Canal from 17th Avenue to 23rd Avenue has been recommended by the Federal Government as a historic canal. Due to this categorization, funding may be available to improve this road through both Federal and State resources1.
1 - Dobbins Road Design Concept Report (Central Ave to 67th Ave), produced by Kirkham Michael Consulting Engineers for the City of Phoenix October, 2003.

55
Laveen School Auditorium (5001 West Dobbins Road)
Ralph H. Stoughton Estate (805 West South Mountain Avenue)
Determined Eligible for National Register Western Canal and lateral ditch to 23rd Avenue Del Monte Market – Established in 1908 (2659
W. Dobbins Road)
When Dobbins Road was analyzed by City of Phoenix consultants Kirkham Michael Consulting Engineers in October 2003, it was recommended that the segment from Central Avenue to 51st Avenue be a three-lane section with continuous two-way left turn lane with traf c signals at the major cross streets. Six-foot bicycle lanes, ve-foot sidewalks, and 10-foot multipurpose trails
were recommended throughout the proposal. A joint agreement will be needed with SRP for the multipurpose trail located along the south side of the historic canal between 19th and 23rd Avenues. From January-October 2003, The City of Phoenix hosted a series of public meetings in conjunction with the Laveen and South Mountain Village Planning Committees. Even as far back as 2003, the public voiced their desire for bike lanes, pedestrian safety, and vehicular accidents. Since that time, Laveen, in particular, doubled in size jumping from 20K population to currently 50K+ residents as recorded by Census2 and the American Community Survey data, with over 40% of Households having school age children under the age of 17. And the public, via Wikimaps, still identi ed Dobbins corridor as a priority for the area for bike/pedestrian improvements.
by Suzanne Day
This alignment is part of an important route between Peoria and Glendale to the northwest and Scottsdale with connections to Tempe to the southeast. Providing a quiet, scenic, cross-town route through Phoenix City Council districts 1, 3, and 6, the Arizona canal is one of Phoenix’s hidden gems.
The biggest advantage of this off-street corridor is ease of crossings at major arterials (including the behemoth that is I-17) thanks to dedicated bicycle and pedestrian underpasses. Another big advantage is the quiet serenity of pedaling along the canal and seeing birds, sh and community members enjoying the outdoors.
Third, the corridor connects to well-established bike trails and paths in Glendale, Surprise, Scottsdale, and – via the Galvan Parkway and Tempe Town Lake bike and pedestrian bridge – Tempe.
2 - 2010 Census; 2012 ACS
The Valley Metro light rail expansion to 19th Avenue and Dunlap will open in 2016, and is within a half-mile of this corridor. From there, it’s less than a 6-mile ride to ASU West Campus, and under 8 miles to the Thunderbird School of Global Management. This corridor will become even more valuable when the Valley Metro light rail northwest extension Phase 11 reaches Metrocenter in the early 2020s.
An important feature of this segment will be addressing a large berm on the alignment of 47th Avenue, between Sweetwater and ASU West. Currently the berm is too steep to ride up or down, it’s necessary to dismount and walk at both ends of the berm. The 47th Avenue bike route leads directly to the Arizona Canal trail; the berm is a major impediment to an easy bike commute for ASU West students.
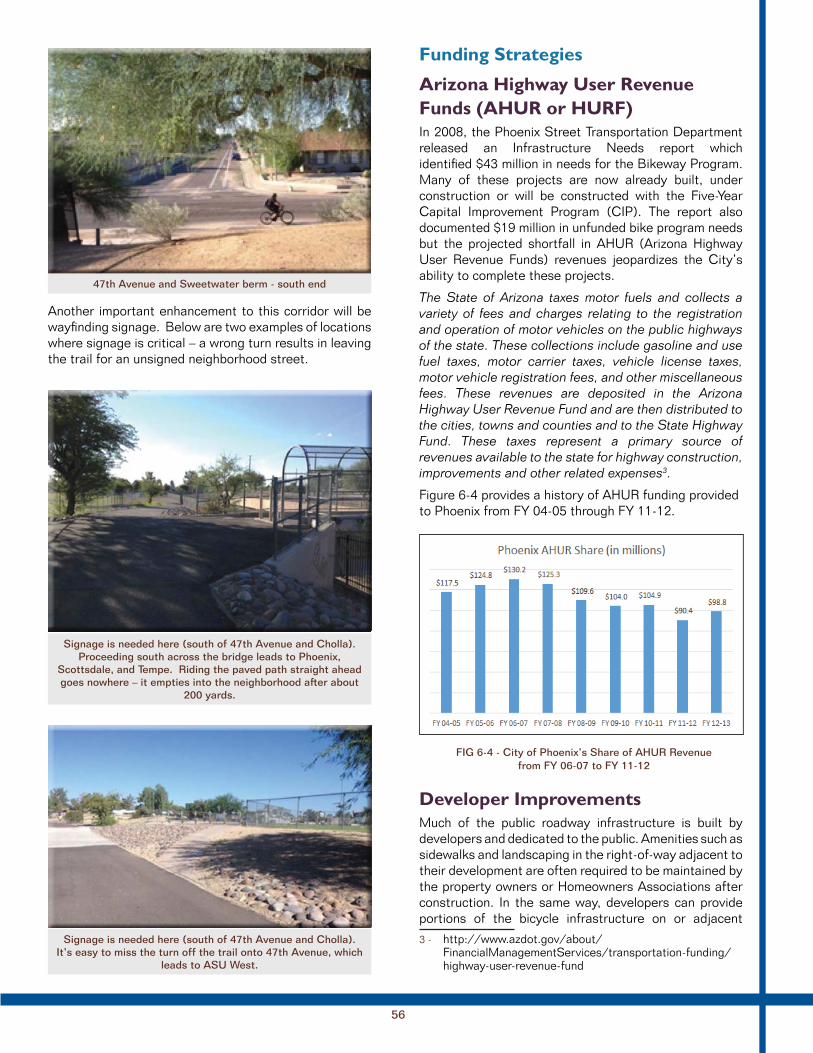
56
Another important enhancement to this corridor will be way nding signage. Below are two examples of locations where signage is critical – a wrong turn results in leaving the trail for an unsigned neighborhood street.
..........
Proceeding south across the bridge leads to Phoenix,
goes nowhere – it empties into the neighborhood after about 200 yards.
In 2008, the Phoenix Street Transportation Department released an Infrastructure Needs report which identi ed $43 million in needs for the Bikeway Program. Many of these projects are now already built, under construction or will be constructed with the Five-Year Capital Improvement Program (CIP). The report also documented $19 million in unfunded bike program needs but the projected shortfall in AHUR (Arizona Highway User Revenue Funds) revenues jeopardizes the City’s ability to complete these projects.
The State of Arizona taxes motor fuels and collects a variety of fees and charges relating to the registration and operation of motor vehicles on the public highways of the state. These collections include gasoline and use fuel taxes, motor carrier taxes, vehicle license taxes, motor vehicle registration fees, and other miscellaneous fees. These revenues are deposited in the Arizona Highway User Revenue Fund and are then distributed to the cities, towns and counties and to the State Highway Fund. These taxes represent a primary source of revenues available to the state for highway construction, improvements and other related expenses3.
Figure 6-4 provides a history of AHUR funding provided to Phoenix from FY 04-05 through FY 11-12.
from FY 06-07 to FY 11-12
Much of the public roadway infrastructure is built by developers and dedicated to the public. Amenities such as sidewalks and landscaping in the right-of-way adjacent to their development are often required to be maintained by the property owners or Homeowners Associations after construction. In the same way, developers can provide portions of the bicycle infrastructure on or adjacent
3 - http://www.azdot.gov/about/FinancialManagementServices/transportation-funding/highway-user-revenue-fund

57
to their development or provide funding for eventual bikeway improvements at the time of their development. Developer-required on-site or off-site improvements, in response to master plans or stipulations on their development, occur as a result of site-plan review by the Planning and Development Services Department. Zoning ordinances need to provide the ability for plan reviewers to stipulate these amenities or improvements, and the plan reviewers should be trained to look for opportunities for developer bicycle facility improvements.
Another ef cient way to fund bicycle infrastructure improvements in the right-of-way is though the sale of general obligation bonds, which much be approved by the voters. The sustained growth of Phoenix has contributed to the City’s use of bonds as a major source of nancing for its capital improvement programs. The Bike Master Plan can be used to identify speci c corridors and improvements within those corridors for a bond program to target so the voters have a clear understanding on what they are approving. Bond funds are the most exible and lowest cost dollars for Phoenix to use and result in the most capital improvements per dollar spent. Furthermore, once bond funds are obligated for a speci c improvement that has been approved by the Citizen’s Bond Committee, they cannot be diverted to another use.
The rst draft of the Alliance for Biking and Walking’s 2014 Benchmarking Report on Bicycling and Walking in the United States report is the source of the following text as contributed by Darren Flusche of the League of American Bicyclists.
On October 1, 2012, the recently passed federal transportation law, Moving Ahead for Progress in the 21st Century (MAP-21), went into effect. MAP-21 maintained broad eligibility for bicycling and walking projects across transportation funding programs and put more decision-making power in the hands of regional governments for active transportation projects, but it also consolidated bicycling- and walking-friendly programs while reducing total funding for them. It also made it easier for states to divert these funds to other purposes.
Prior to MAP-21, three of the most common sources of federal funds for bicycling and walking projects were the Transportation Enhancements Program (TE), Safe Routes to Schools (SRTS), and the Recreational Trails Program (Rec Trails or RTP). Under MAP-21 these have been
consolidated into one program called the Transportation Alternatives Program (TAP). Unfortunately, the funding for the TAP program is 26 percent less in scal year 2014 than the combined FY2012 funding for the three programs it replaced. You can nd speci c funding levels for your state and region at www.AdvocacyAdvance.org/MAP21.
There have been some changes in eligible activities. For example, states and regions can still use TAP funds for pedestrian and bicycling improvements, but they cannot use TAP to pay for adult bicycle education classes. There is a new activity called Safe Routes for Non-Drivers, which is meant to improve access and accommodations for older adults, children, and individuals with disabilities and may lend itself to creative projects. Another new use of TAP funds is that the right-of-way of former Interstate routes can be converted into walkable, low-speed thoroughfare in urban environments.
Any activity that was eligible under the Safe Routes to School Program, including educational safety programs for K-8 students, is eligible under TAP. Some states are using a portion of TAP funds to maintain an independent SRTS project selection process, others are incorporating SRTS activities in their overall TAP process. Some states, like Washington, are using additional safety funds from the Highway Safety Improvement Program to cover SRTS activities to make up for reduction in funds.
Every year, each state decides if it wants to maintain the Rec Trails program as it had been, with the same agency administration and rules, or “opt-out”. If the state maintains the program, the funds equal to the FY2009 amount are taken off the top of TAP. If the state opts out, the Rec Trails funds get absorbed into TAP. In 2013, only Florida and Kansas opted out of the Rec Trails.
TAP funds are distributed within states in two ways. Half of the funds are controlled by the state DOT to be spent anywhere in the state. The other half is allocated to rural areas, small cities, and large cities based on the proportion of the population in those geographies.
In many places, local governments are more responsive to walking and bicycling needs than states are. In response, bicycling advocates fought to increase the amount of control regional planning agencies – Metropolitan Planning Organizations (MPOs) – have over federal transportation dollars. The result of these efforts is that MPOs with a population of over 200,000 are now sub-allocated funds to run their own TAP application process and select the projects they think are most important.

58
Transferability and Opt-outs of TAP Funds One of the goals of MAP-21 was to increase “ exibility” for how states spend their federal dollars. One of the things this means is that states can transfer their anywhere-inthe- state funds to other transportation programs – for uses other than biking and walking projects. Additionally, if funds are unspent (“unobligated”) after the rst full year, funds may be exed to the Congestion Mitigation and Air Quality Improvement Program (CMAQ).
Looking Where the Big Money Is TAP is a very small part of MAP-21 and it is just a small source for walking and biking projects within the law. Bicycling and walking projects are broadly eligible in the vast majority of federal-aid funding programs. CMAQ funds projects that provide alternatives to car travel, including several bikeshare systems. The Highway Safety Improvement Program (HSIP) funds pedestrian and bicycle safety infrastructure. Section 402 State and Community Highway Safety Grants funds non-infrastructure programs, like adult bicycle education classes and pedestrian safety trainings. And the Surface Transportation Program (STP) funds bicycle and pedestrian transportation projects and now can be used for TAP-type projects and Rec Trails-type projects.
The Transportation Investment Generating Economic Recovery, or TIGER Discretionary Grant program, provides a unique opportunity for the DOT to invest in road, rail, transit and port projects that promise to achieve critical national objectives. Since 2009, Congress has dedicated more than $4.1 billion for six rounds to fund projects that have a signi cant impact on the Nation, a region or a metropolitan area.
The TIGER program enables DOT to examine a broad array of projects on their merits, to help ensure that taxpayers are getting the highest value for every dollar invested. In each round of TIGER, DOT receives many applications to build and repair critical pieces of our freight and passenger transportation networks. Applicants must detail the bene ts their project would deliver for ve long-term outcomes: safety, economic competitiveness, state of good repair, livability and environmental sustainability.
There are $600 million that has been appropriated for the FY 2014 TIGER program. The FY 2013 TIGER program, the fth round of federal TIGER grants, awarded $474 million to 52 projects. Although highly competitive, past rounds of TIGER have funded several stand along bicycling and walking projects and a large number of successful projects that include bicycling and walking components.

59
The following table summarizes some of the recently completed (RC), ongoing (O), and committed (C) bike program expenditures:
(Source: City Council Report, May 7, 2013)
Funding Cost
Arizona Canal Bike Tunnel under 7th Ave. AHUR, stimulus RC $2,877,165
South Mt. Comm. College Ped. and Bike Crossing AHUR, fed aid RC $790,518
Royal Palm (15th Ave/Dunlap) AZ Canal Bike Bridge AHUR, fed aid RC $1,261,698
Nevitt Park at Western Canal Bike Bridge AHUR, fed aid O $1,168,600
7th St. Science Center Bike and Ped. Bridge ’06 bond C $6,091,745
Indian School/16th St. Multi-Use Trail AHUR, fed aid O $1,882,885
19th Ave./Cave Creek Wash Bike Trail (Revised project scope) ’06 bond C $794,306
Rio Salado/Salt River; 24th ST. to I-10 Path AHUR, fed aid RC $3,552,487
Arcadia Portal Multi-Use Trail AHUR, fed aid RC $651,137
Grand Canal Bike Crossings AHUR O $14,434
Grand Canal Major St. Safety Improvements ’06 bond O $25,000
Sonoran Boulevard. Paseo Bike Trail PPI (Parks) RC $3,800,000
Rio Salado/Salt River; 32nd St. – 40th St. Path AHUR, fed aid C $1,122,642
Rio Salado/Salt River; 40th St. – SR 143 Path AHUR, fed aid C $2,058,310
107th Avenue; ISR to Camelback Shared Use Path AHUR, fed aid C $1,500,000
Bike Racks and Corrals Citywide AHUR O $26,822
Bike Detection at Traf c Signals AHUR O $22,250
Bike Storage Corrals for Schools CCF O $7,500
Bike Parking Rings for Parking Meters AHUR O $5,000
Bike Safety Education GOHS O $9,000
Bike Helmets for Children GOHS O $6,000
Bike Share ($1,914,500)
Regional Bike Share Project with City of Tempe CMAQ, Fed Aid O $1,414,500
Bike Share Infrastructure Improvements AHUR O $500,000
Baseline; 51st Ave. – 59th Ave. Bike Lanes AHUR C $725,000
43rd Avenue; Baseline – Southern AHUR C $725,000
Southern Avenue; 19th Avenue/ - 31st Avenue/ AHUR RC $725,000
Pinnacle Peak Road; 35th Ave. – 55th Ave. AHUR O $1,450,000

60
Funding Cost
Sonoran Boulevard; North Valley Pkwy. - Cave Creek Rd. AHUR, IF, CCF RC $2,175,000
Avenida Rio Salado AHUR, fed aid O $272,400
Centennial Way (Washington St. near State Capitol) ADOT, fed aid RC $5,000
7th Avenue; Southern – Salt River AHUR C $1,087,500
43rd Avenue; Lower Buckeye – Buckeye Rd. AHUR C $725,000
32nd Street; Southern – Broadway AHUR, ’01 bond O $725,000
35th Avenue; Baseline – Southern Ave. AHUR C $725,000
75th Avenue; Lower Buckeye – Buckeye AHUR C $725,000
Buckeye Road; 67th Ave. – 59th Ave. AHUR, IF C $725,000
Lower Buckeye; 51st Ave. – 43rd Ave. AHUR, ’06 bond C $725,000
32nd Street; Washington St. – McDowell Rd. Fed aid, ’06 bond C $725,000
56th Street; Deer Valley Rd. – Pinnacle Peak Rd. AHUR, IF C $725,000
35th Avenue; Dobbins – Baseline AHUR C $725,000
27th Avenue; Lower Buckeye – Buckeye AHUR C $725,000
27th Avenue; L-101 – Deer Valley AHUR C $725,000
64th Street; Utopia – Mayo AHUR, IF C $1,450,000
Buckeye Road; 7th St. – 16th St. AHUR C $725,000
Baseline Road; 59th Ave. – 51st Ave. AHUR C $725,000
Roosevelt; Central Ave. – 4th St. AHUR, fed aid O $240,000
Central Avenue; Camelback – Bethany Home Rd. AHUR RC $41,754
Chris-Town Gateway Bicycle Boulevard AHUR RC $58,613
11th St Pedestrian and Bike Improvements FTA RC $10,000
Indian School; 19th Ave. – I-17 AHUR C $100,000
Overlay Projects (2 miles, various projects) AHUR RC $10,000
32nd Street SR 51 – Reach 11 AHUR, fed aid O $445,568
Shea Boulevard; 32nd St. – SR 51 AHUR, fed aid C $364,941
Roosevelt Row Bike Lanes AHUR, fed aid O $750,260
Discretionary Project Funding for Bike Lanes AHUR C $1,000,000
Staf ng (1 Full-Time Equivalent position) AHUR O $110,000
Citywide Specialty Bike Marking and Signing AHUR O $59,968
Discretionary Small Project Funding (FY13-17) AHUR O $250,000
FTA – Federal Transit Authority CCF – Capital Construction Funds
PPI – Parks and Preserve Initiative IF – Impact Fees
GOHS – Governor’s Of ce of Highway Safety AHUR – Arizona Highway User Revenue
CMAQ – Congestion Management & Air Quality

61
RECOMMENDATIONSGOAL:
Investments made for bicycling will be smart, focused, and equitable. The city will leverage existing assets and create partnerships with local, county, and state agencies to build out the bicycle infrastructure network.
STRATEGY: Successfully complete top priority projects on
ranked project list.
ACTION: Program bicycle facility needs into the City’s
Capital Improvement Program (CIP). Consolidate projects to eliminate gaps and
barriers on individual priority corridors when possible or to take advantage of economies of scale.
BBBBBBBBBiike Program Expenditures
11.11. BIBIKEKE SSTRTRUCCUCCTUTUREEREE:::: NeNew w bbrbbrididgegess ss ananddtutunnnneeleels s toto a accccccccomommomoddaddatete t theehee owow ooooff ff bibicycycllcllisiststs o oveeveer r oror u unddndderer c cananalaala s s oror r roaooao dwdwayyayyss ss ($($1 1 mimimimillllioion n - - $6$$6$ m milillilionoono p perer ssssttrttrucuctutureeree))
222.222. BIBIKEKE TTRARAILILS SS S / / PAPATHTTHT S:S: OfOOfO f-f-roroadadwawwaw y y bibicycycllcllee ee oror m mulululultiti-u-usese ppppatathshs t toooo fufulllly y seeseepapararateetee ththe e oooow w ofof p pedeede esestrtriaaiaannsnns a andnd bbbbicicycycliliststststs s frfrommomm momototoririririzezed d trtrafaafa cc ( ($88$88000000,0,00000 -- $ $8 8 mimillllioion n peepeer r r r mimilele),), i incncluludidingnngn R ROWWOWW a acqcquiuisissis titionon, , asasasasphphalalt,,t,, etetc.c.
333.333. SPSPECCECCIAIAL L PRRPRROJOJECCECCTTSTTS:: SmmSmmalalleler r sppsppececiaialtlty yy yprprojojeccecctsts t to o suusuupppporort t edeede ucucatatiooioon,n, s safafetetetety y ananddimimprprovovovoveded o opeepeeraratitionon fffforor b bicicycycycycliliststs s ($$($$2,2,00000 0 - - $3$30,0,000000000 0 peper r prpprp ojojecect))t))
444.444. BIBIKEKE SSHAHAREEREE:: PrProggoggraram m foforr rr reresisidedentnntn ssanand d vvivvississitotorsrs ttttoooo rerentnt bbbbicicycycleles s atat s statatiitiioonoonssththrorouggugghohoutut t thehheh c citity y ($($($($1.1.5 5 mimillllllioion n inin apapprprovovovoveded f funnunnddiddingng i inccnccluludidingng rrrregegioionanallCoCongngeseese titionon MMMMititigigatatiooioon n AiAir r QuQQuQ alalitity y fufufufundndiningggginin p parrarrttnttnerershshippipp w witith h thhthhe e CiCityty oooof f TeTemppmppe)e)
555.555. MAMAJOOJOORR STSTRERRER ETET IIMPMMPM ROROVEVVEV MEMENTNTNTNT PRPROJJOJJECECTSTS:::: NeNew w bibbib keke i infnfrarararaststruructctuuruure e adaddededddd inin c cononjujjuj ncnctitionnonn w witith h neeneew w roroaddaddwwawway y oror r roaaoaaddwddwayay wwwwidideneniningggg prprojojecectsttst ( ($6$6000000,0,00000 - - $1$1.1.1 m milillilionon p perer m mililee,ee, e eststimmimmatateded a att tt $7$72525,0,0,0,00000 p perrerr m milile e onnonn a aveverarageggeg ))
666.666. BIBIKEKE L LANANE E RRERRETRTROFOOFO ITIT P PRORROR JEJECTTCTTS:S: N Newewewew bibikeke l lanaana eses a addddddddeded t to o eexeexisistitinggngg s strtreeeetsstss w witithoohoouttutt wiwidedeninininingng, , e.e.g.gg.g , , nenew w bibbib keke l lannanneesees a addddedeede w witith h ovovererlaalaayy yy prprojojecececectsts o or r thhthhrorougugh h rrorroadad d dieeieetsts ($($5,5,0000000 0 - - $7$75,55,5 00000 0 peepeer r mimilele))
777.777. BIBIKEKE P PROROGRRGRRAMAM OOOOPEPERARATITTIT ONONS:S: OpOpererataata ining g buubuuddgddgetet t toooo mamananagegegege p prorogrrgrraamaam,,ininclcludduddiiniing g ststaffaffff,ff, m matatererereriaialsls a anddndd r relelatatedededed exexpepensnsnsnseses ( ($11$116060,0,0000000 - - $ $21210,0,00000 0 peepeerr rr yeyearar))))

62
OBJECTIVE: By 2019, complete 80% of Tier I projects By 2024, complete 100% of Tier I projects and
50% of Tier II and Tier III projects By 2029, complete 75% of Tier II and Tier III
projects By 2034, complete 100% of Tier II and Tier III
projects Complete other identi ed bicycle infrastructure
projects as opportunities and resources become available.
STRATEGY: Increase amount of funding dedicated to
the bicycle program including infrastructure, amenities, and education.
OBJECTIVE: By 2019, allocate a minimum of 1% of the
Street Transportation CIP budget for bicycle infrastructure improvements
Annually report the amount of funding (5-year rolling dollar value and % of total CIP) dedicated to the bicycle program
STRATEGY: Seek State and Federal funding through the
Maricopa Association of Governments (MAG) to assist with implementation of large and dif cult projects.
ACTION: Identify best quali ed projects and apply for
State or Federal Aid.

MAKING CONNECTIONS
63
During its post-war boom, the City of Phoenix planned its transportation and land use policies and investments around the assumption that the automobile was the primary modal choice for existing and new residents. Those prior planning efforts and public investment decisions provided a template for deployment of private sector capital and resources in a manner that supported, and continues to support, a reliance on automobiles as the primary form of day to day transportation for the majority of adult-age Phoenix residents.
With voter approval of Transit 2000, providing dedicated funding for the initial Valley Metro light rail line and expanded bus and paratransit services the City of Phoenix began to meaningfully expand the scope of its transportation and land use planning policies to address the needs of those citizens utilizing active and public transportation systems, in addition to motorized transportation modes. Building upon its more recent Reinvent PHX and Complete Streets initiatives, the Bike Master Plan recognizes that access to the City’s transportation system is often a requirement for one to enjoy unfettered access to the market and public life, especially for those who rely on our active and public transportation systems in daily life. Bicycles are vital and underutilized tools in our City’s transportation system and, for many, comprise a critical means to access opportunities.
The Bike Master Plan regards equity in transportation investment as a constitutive element of a healthy, sustainable local economy. By providing for the broadest possible access to bicycles and other forms of active transport, the City also broadens the ability of its residents to seek employment, education, business, and personal opportunities while ensuring that every resident has the dignity of choice in their transportation mode.
GOAL:
The City’s
bicycle
network
will connect
neighbor-
hoods with
each other
and into
downtown
Phoenix.
Bicycling will
be a safe,
fun, and
trans-
portation
option to
access
schools,
parks,
shopping,
work, and
community
centers in all
parts of the
City.
C H A P T E R
7
City Bicycle Coordinator
bicycle enthusiast and works to make sure that new infrastructure is implemented to make riding
bike infrastructure should
with bicycling because it’s
you can do it by yourself
riding in groups because
with the people around you, and you notice things that you wouldn’t notice.
sense of community and togetherness.”

64
The Plan addresses social equity by endeavoring to provide bicycle transportation facilities for all socioeconomic groups and all portions of the community. Several variables were used to account for social equity in the master plan process when identifying corridors, ranking the corridors and raking projects along the targeted corridors. Corridor identi cation and selection utilized a variety of social equity measures, including: percentage of households in poverty; percentage of population under 18; and percentage of households with no vehicles, as well as population density. The process of corridor prioritization included the same measures to account for social equity as well as land use.
Equity in stakeholder input was accomplished by holding the public meetings in the community centers of low income communities. Complementing the public meetings, limited English pro cient populations and individuals with limited access to computing technology were speci c target populations for personal interviews at transit centers.
The Plan seeks to achieve modal equity by endeavoring to provide facilities for active, public and motorized transportation modes, including provision of bicycle parking facilities at destinations. The master plan seeks to further achieve modal equity by providing continuous transportation facilities for all modes along the corridors, and establishes a philosophy that if a bicycle facility is provided a long a two-way motor vehicle facility, the bicycle facility should also provide two-way bicycle services. Bicyclists should not be diverted to a different route if a motor vehicle route is provided, and the bicycle facility should be continuous. Furthermore, opportunities should be explored to provide additional bicycle facilities throughout Phoenix so that bicyclists have modal equity throughout the entire community and travel to every destination that a motor vehicle can access.
Additionally bicyclists should have equal access to public transit (buses and light rail) that is offered to pedestrians. While Phoenix was the rst major city to equip all buses with bike racks with the ability to carry two bicycles, there are times when bicyclists cannot be accommodated because the racks are full. All new buses are being purchased with racks that are able to accommodate three bicyclists, and the conversion to 3-bike bus racks should continue.
Finally, the Plan recognizes that equity in investment among active, public, and motorized transportation is vital to the interests of the City in fostering a globally competitive economy capable of attracting and retaining capital and talent, and will further enhance our ability to diversify our City’s economy in a sustainable manner.
RECOMMENDATIONSGOAL:
The City’s bicycle network will connect neighborhoods with each other and into downtown Phoenix. Bicycling will be a safe, fun, and convenient transportation option to access schools, parks, shopping, work, and community centers in all parts of the City.
STRATEGY: Account for social equity when identifying and
prioritization bicycle infrastructure improvement projects
ACTION: Continue to utilize a prioritization methodology
that utilize a variety of social equity measures, including: % of households in poverty; % of population under 18; % of households with no vehicles; and population density.
STRATEGY: Provide continuous transportation facilities for
all modes along corridors.
ACTION: Provide continuous bicycle facilities
Provide two-way bicycle facilities on two-way motor vehicle facilities
Provide bicyclists equal access to public transit (buses and light rail) that is offered to pedestrians
photo provided by Charlier and Associates

MAKING CONNECTIONS
65
GOAL:
Bicycling will
be a safe
transportation
and recreation
option.
be designed
to safely
accommodate
all modes.
People on
bikes will
understand
bicycling
rules of the
road through
proper
facility design
and safety
education,
Bicycling will
be safer by
promoting
accountability
and
responsible
attitudes of all
road users.
One of the goals of the Bicycling Element in the 2002 Phoenix General Plan was to improve bicycle safety through more education, better traf c signs and pavement markings, and installation of more safety features for bicyclists. This master plan continues that goal and expands it to focus on redesigning major streets and intersections to be “complete streets” that are safe and accommodating for all users.
The City of Phoenix Street Transportation Department, in collaboration with a group of community stakeholders, developed a draft Complete Streets Policy in July 2013. The stated intent of this policy, if adopted by City Council, is that –
“Complete Streets will make Phoenix more walkable and bikeable, support investments in transit, foster social engagement and community pride, boost the local economy and property values, and improve the livability and long-term sustainability of our region. Phoenix will be a better place to be, realizing long-term savings from improved public health and safety, environmental stewardship, social mobility and transportation equity.”
C H A P T E R
8

66
A review of reported motor vehicle crashes involving bicyclists in Phoenix over the past ve years highlights the need to focus on the redesign of arterial streets and intersections to better accommodate cyclists.
This chapter of the Bicycle Master Plan presents a ve-year summary of bicyclist crash data from 2008 through 2012. In summary, future facility planning and education programs should strive to address the following:
25% of all the reported bicyclist crashes involving a motor vehicle in the State of Arizona occur in Phoenix (Fig 8-1).
495 crashes were reported annually, resulting in approximately 62 serious injuries and 8 fatalities per year.
In the past two years, total bicyclist crashes have increased by more than 8% each year. Thankfully, the number of serious injury and fatal bicycle crashes have not followed the same trend.
96.3% of bicyclist crashes occur on arterial and local roads.
53.3% of all bicycle crashes are intersection related.
Serious injury crashes frequently occur along major arterial streets that serve transit.
Demographics Children and teenagers age 10-
19 were involved in the highest number of bicycle crashes.
The number of bicycle crashes were highest in October, November and March, and on weekdays from 7-8 am and 3-6 pm – corresponding to high volume bike travel months and bicycle commuter patterns.
The information provided in this section is intended to supplement the Phoenix Traf c Collision Summary and Phoenix Bicycle Collision Summary reports. Both are compiled by the Street Transportation Department; the former on an annual basis and the latter as staff resources permits.
To gain insight into crash occurrence involving bicyclists in the City of Phoenix, an analysis of crash data was performed for the years 2008 through 2012. The results of this analysis, as shown in Figures 2 through 9, provide an overview of bicycle transportation safety in the City of Phoenix. Fatal crashes (K) and serious injury crashes (A) are a prime focus of this analysis to re ect national performance measures.
The analysis was performed using the Regional Transportation Safety Information Management System (RTSIMS) software. RTSIMS Version 1.0 serves as a key analytical tool at the Maricopa Association of Governments (MAG) for performing transportation safety analysis that is required for safety planning functions at the regional level. The primary source of this crash data is the ALISS crash database maintained by the Arizona Department of Transportation (ADOT). Crashes involving bicyclists are de ned as crashes involving a “pedalcylist” traf c unit. Data for this analysis was ltered for crashes with Phoenix as the law enforcement
agency having jurisdiction of the crash scene. Note that to get in the ALISS crash database at least one motor vehicle must be involved.
The Arizona Motor Vehicle Crash Facts, compiled annually by ADOT, is the source of State crash data presented in this section. Twenty- ve percent of the State’s bicyclist crashes occur in the City of Phoenix. Based on the 2010 US population census, 22.6% of the State’s population reside in the City of Phoenix.
As shown in Figure 8-2, most reported bicyclist crashes result in an injury (89.4%). Since 2010, total bicyclist crashes have increased by more than 8% each year. The number of serious injury and fatal crashes has not followed the same trend.

67
Crashes involving bicyclists are highest in the month of October, followed by November and March (Figure 8-3), which is largely consistent to those times when it is most comfortable to ride Phoenix with respect to temperature.
Bicyclist crashes occur most frequently on weekdays; particularly Thursdays and Tuesdays (Figure 8-4). Bicyclist volume data that is being collected and analyzed by MAG and Phoenix will provide further insight into ridership by day of week.
in the City of Phoenix by Day of the Week
Bicyclist crashes are highest in the afternoon hours of 3 pm to 6 pm and the morning hour of 7 am to 8 am. This data suggests that bicyclist crashes are more likely to occur at times of high motor vehicle volumes. The total number of bicyclists may also be higher at these times.
in the City of Phoenix by Hour of the Day
Children and teenagers between the ages of 10 and 19 are involved in the highest number of bicyclist crashes (Figure 8-6). For those under the age of 16, this group may rely on bicycling as a primary mode of transportation because they are not old enough to obtain a driver’s license and those from 16 to 19 may not be able to afford the expense of owning and driving a motor vehicle. Bicyclists between the ages of 40 to 54 also experience a higher number of bicycle crashes. The bicyclists within this age range (40-54 years old) are most likely to sustain serious injuries or die in a crash.
in the City of Phoenix by Age
A crash tree of fatal and serious injury bicyclist crashes in Phoenix for 2008-2012 is presented in Figure 8-7. Crash trees are a tool to help identify and select the facility types and roadway and traf c characteristics of the locations where target crash types occur most frequently. Bicyclist-involved K (fatal) and A (serious injury) crashes in the City rarely occur at freeway interchanges with 96.3% occurring on arterial, collector, and local roads. Approximately half of these crashes occur at intersections. Of the intersection-related

68
crashes, there is nearly an even split between bicyclist-involved fatal and serious injury (K and A) crashes at signalized versus unsignalized intersections. Angle crashes (38%) are most common at intersections. Angle crashes (24%) are also common elsewhere which is likely due to potential con ict between bicyclists and motor vehicles at driveways or bicyclists riding on sidewalks and crossing streets.
The current crash report form and police of cer reporting may not provide enough detail to accurately describe bicyclist crashes. Upon review of fatal and serious injury (K and A) crashes involving bicyclists by manner of collision, approximately 50% are coded under “other” or “single vehicle.” This may indicate a greater need for police of cer training on how to accurately ll out crash reports that involve bicyclists. It would also be desirable to include more types of bicycle-involved crashes in the ALISS crash database to better monitor the safety of the road network for bicyclists. This would require a change in the ADOT reporting procedures.
A spatial analysis of fatal and serious injury bicyclist crashes within the City of Phoenix was performed and provided in Figure 8-8 on the next page. The METRO Light Rail line and Valley Metro transit centers are shown on the map. There appears to be a pattern of serious injury crashes along some of the arterial streets that
transit serves such as Bell Road, Camelback Road, and Indian School Road. Indian School Road has the most fatal bicyclist-involved crashes.
There are limited safety countermeasures the City can be implemented on Indian School Road. The City has partnered with MAG to perform a corridor safety assessment on Indian School Road between 27th and 51st Avenues in 2015. Some of the recommendations from that report may be applicable elsewhere. Previously, the City has upgraded to larger diameter signal heads and added higher visibility street name signs along the entire length of Indian School as part of a federal grant. A recent City overlay project on Indian School Road from 19th Avenue to 23rd Avenue recon gured the roadway to add bike lanes. The City will continue to evaluate roadways at the time of pavement overlays to add bike lanes.
In addition to making engineering improvements to the city’s infrastructure, education programs are also being recommended. Model programs from Boston, Chicago, Davis, Minneapolis, Portland, and other cities may be adapted to address safety needs in Phoenix.
freeways. These crashes occurred at urban freeway interchanges
crashes.
City of Phoenix
2008-2012 Bicyclist Crashes347
6.7% of all A
n Related
185 (53

69
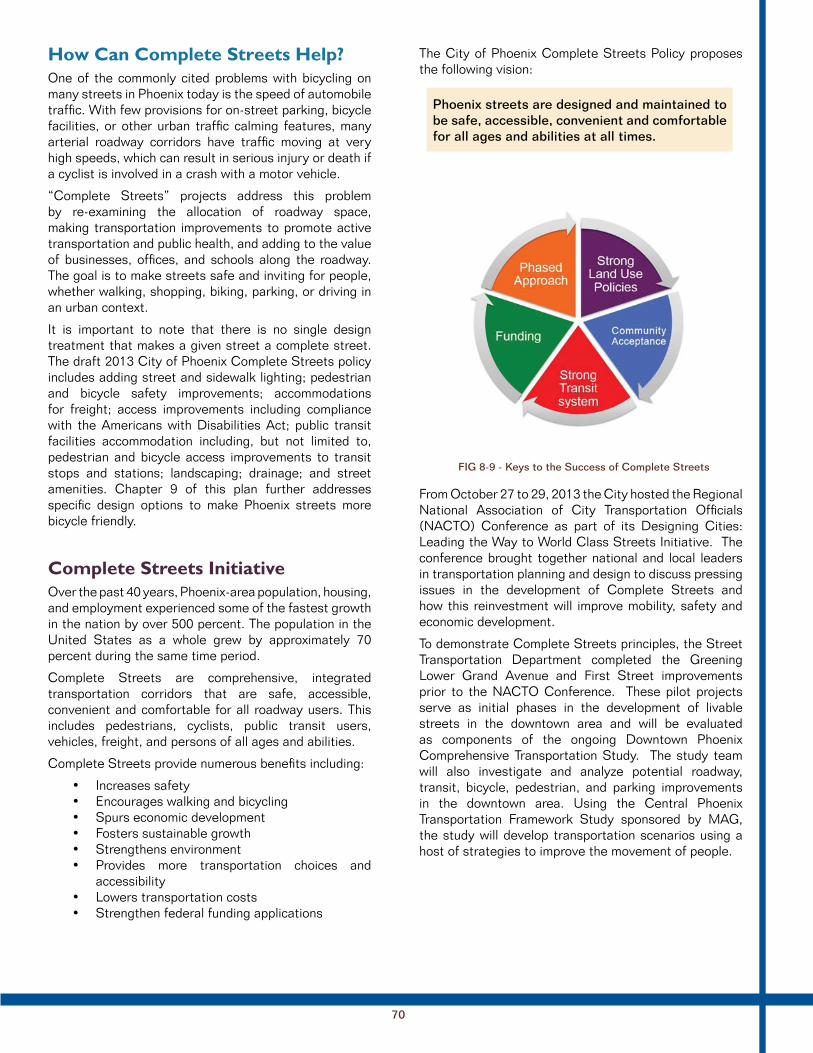
70
One of the commonly cited problems with bicycling on many streets in Phoenix today is the speed of automobile traf c. With few provisions for on-street parking, bicycle facilities, or other urban traf c calming features, many arterial roadway corridors have traf c moving at very high speeds, which can result in serious injury or death if a cyclist is involved in a crash with a motor vehicle.
“Complete Streets” projects address this problem by re-examining the allocation of roadway space, making transportation improvements to promote active transportation and public health, and adding to the value of businesses, of ces, and schools along the roadway. The goal is to make streets safe and inviting for people, whether walking, shopping, biking, parking, or driving in an urban context.
It is important to note that there is no single design treatment that makes a given street a complete street. The draft 2013 City of Phoenix Complete Streets policy includes adding street and sidewalk lighting; pedestrian and bicycle safety improvements; accommodations for freight; access improvements including compliance with the Americans with Disabilities Act; public transit facilities accommodation including, but not limited to, pedestrian and bicycle access improvements to transit stops and stations; landscaping; drainage; and street amenities. Chapter 9 of this plan further addresses speci c design options to make Phoenix streets more bicycle friendly.
Over the past 40 years, Phoenix-area population, housing, and employment experienced some of the fastest growth in the nation by over 500 percent. The population in the United States as a whole grew by approximately 70 percent during the same time period.
Complete Streets are comprehensive, integrated transportation corridors that are safe, accessible, convenient and comfortable for all roadway users. This includes pedestrians, cyclists, public transit users, vehicles, freight, and persons of all ages and abilities.
Complete Streets provide numerous bene ts including:
Increases safety Encourages walking and bicycling Spurs economic development Fosters sustainable growth Strengthens environment Provides more transportation choices and
accessibility Lowers transportation costs Strengthen federal funding applications
The City of Phoenix Complete Streets Policy proposes the following vision:
From October 27 to 29, 2013 the City hosted the Regional National Association of City Transportation Of cials (NACTO) Conference as part of its Designing Cities: Leading the Way to World Class Streets Initiative. The conference brought together national and local leaders in transportation planning and design to discuss pressing issues in the development of Complete Streets and how this reinvestment will improve mobility, safety and economic development.
To demonstrate Complete Streets principles, the Street Transportation Department completed the Greening Lower Grand Avenue and First Street improvements prior to the NACTO Conference. These pilot projects serve as initial phases in the development of livable streets in the downtown area and will be evaluated as components of the ongoing Downtown Phoenix Comprehensive Transportation Study. The study team will also investigate and analyze potential roadway, transit, bicycle, pedestrian, and parking improvements in the downtown area. Using the Central Phoenix Transportation Framework Study sponsored by MAG, the study will develop transportation scenarios using a host of strategies to improve the movement of people.
Phoenix streets are designed and maintained to
for all ages and abilities at all times.

71
Arizona Revised Statutes ARS 28-101 and City Code Section 36-97 de ne bicycles as devices propelled by human power, having two tandem wheels greater than 16 inches in diameter or having three wheels in contact with the ground with at least one greater than 16 inches. Anyone riding a bike with wheels greater than 16 inches is a bicyclist and can ride on the sidewalk or in the street regardless of age, experience, or ability. State law imposes requirements on bicycle equipment and usage, prohibiting carrying more than one rider (unless designed to do so), and carrying bulky articles that take both hands from the handle bars. ARS 28-817 requires an “adequate” front lamp to be seen at 500 feet, rear red re ector for nighttime use, and requires equipment to enable proper braking.
City Code Section 36-98 requires bicycles operating on streets, alleys or public highways to be licensed by the Police Department. However, the police have not issued licenses in decades. Additionally, ARS 28-812 requires bicyclists riding in the road (or on the shoulder) to obey “Rules of the Road” as any other vehicle operator (where appropriate). Traf c laws apply to all cyclists when riding in the roadway. Bicyclists are required to ride as far as practical on the right side of the road, travel in the same direction as traf c, stop at STOP signs or red traf c signals and yield the right-of-way to pedestrians in crosswalks.
Bicyclists may ride on sidewalks, but clearly sidewalks are designed to give preferential use to pedestrians. For example, City Code Section 36-113 requires bicyclists on sidewalks to yield right-of-way to pedestrians. City Code Section 36-110 also requires bicyclists emerging from an alley, driveway or building to yield right-of-way to pedestrians on sidewalks, and yield right-of-way to all vehicles on the road. Furthermore Section 36-108 requires bicyclists to ride at a speed reasonable and prudent under existing conditions, which with pedestrians and street furniture, often requires a readiness to come to a complete stop. A combination of narrow sidewalks, con icts with pedestrians and at driveways, and “wrong way” riding on sidewalks often results in sidewalks being a poor place for bicyclists to ride.
Communities that combine infrastructure development, and education and encouragement programs are the most successful at increasing levels of participation in bicycling. Education and encouragement programs are a good opportunity for partnerships between government agencies, community groups and the non-pro t sector.
RECOMMENDATIONSGOAL:
Bicycling will be a safe transportation and recreation option. Streets will be designed and retro tted to safely accommodate all modes.
People on bikes will understand bicycling rules of the road through proper facility design and safety education, Bicycling will be safer by promoting accountability and responsible attitudes of all road users.
STRATEGY: Update the City of Phoenix Website
OBJECTIVE: Consolidate bicycle information on the City of
Phoenix website into one bicycling portal with an intuitive URL that is easy for people to remember and include this URL on printed materials.
Add the Street Maintenance Division’s problem reporting telephone number and Online Street Maintenance/ADA Problem Reporting Form link to the bicycle safety website. Modify this form, so cyclists can report problems with storm drains, debris in roadway, bicycle detection not working, and other bicycle-speci c issues.
STRATEGY: Provide Training for Transportation Professionals
and Police Of cers.
OBJECTIVE: Provide training to City of Phoenix transportation
engineers, as well as consultants who regularly work with Phoenix regarding the City’s complete streets policy (when nalized), City bicycle facility standards and guidelines, and bicycle facility planning and design best practices.
Establish a program to train police of cers on laws impacting bicyclists and bicycle safety, and lling out the Police crash reports for bicycle
crashes. Partner with Valley Metro to provide training to
bus drivers on sharing the road with bicyclists.
STRATEGY: Enhance driver education.

72
STRATEGY: Evaluate bicyclist safety and education regularly
OBJECTIVE: Create an implementation performance
dashboard to track progress on implementing various aspects of the bicycle plan and document the impact on rates of bicycling, bicycle crashes and demographics (e.g. increases in female or minority riders).
Conduct observations around schools where bike helmets have been distributed to students and safety assemblies and rodeos were conducted to monitor the change in student behavior and helmet use.
STRATEGY: Signi cantly reduce bicycle related crashes
where a cyclist riding against traf c on the sidewalk and colliding with a motor vehicle exiting a private drive or side street.
OBJECTIVE: Add language to City ordinances that places
responsibility on the motor vehicle drivers to yield to bicyclists travelling lawfully on sidewalks.
Amend City Ordinance to Preclude Bicyclists from Riding Against Traf c on Sidewalks
A rst draft of this ordinance is provided in Appendix J.
OBJECTIVE: Expand automobile driver education about
bicycle laws, behavior, and rights. Launch a “coexist” campaign to educate
motorists and bicyclists to promote safe and respectful behavior from all road users.
Launch anti-distracted driving campaign to remind drivers of the dangers of distracted driving.
STRATEGY: Enhance Bicyclist Education
OBJECTIVE: Continue City-wide coordination of Safe
Routes to School (SRTS) activities, including bicycle rodeos and Bike to School Day safety assemblies and group rides.
Establish a Phoenix Bicycle Ambassadors Program to provide outreach and education on bicycling. Potentially partner with Phoenix Metro Bicycle Club or other local or regional advocacy organization to institute and sustain the program.
Establish a bicycle education program targeting seniors, e.g., by allowing seniors to try comfortable and stable three-wheeled bicycles and encouraging empowerment in transportation and health decisions.
Establish an active living partnership that includes agencies, businesses and institutions involved in promoting health and wellness to implement programs promoting bicycling for health.
STRATEGY: Promote Bicycle Events
OBJECTIVE: Continue promotion of Citywide Bike to School
Day and Bike to Work Day. Establish a regular Cyclovia in downtown
Phoenix, where streets are closed to motorized vehicles and opened up to non-motorized users. One such event was held in Council District 5 in conjunction with John F. Long Elementary School on March 8, 2014.
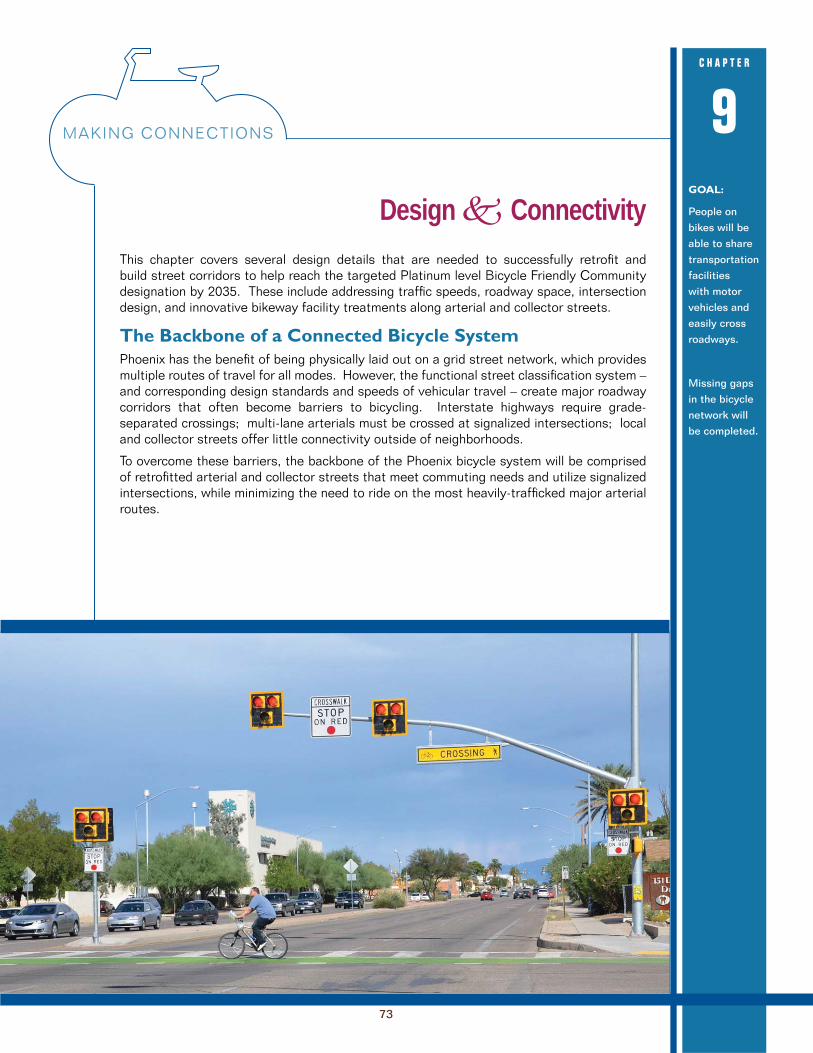
MAKING CONNECTIONS
73
Design ConnectivityThis chapter covers several design details that are needed to successfully retro t and build street corridors to help reach the targeted Platinum level Bicycle Friendly Community designation by 2035. These include addressing traf c speeds, roadway space, intersection design, and innovative bikeway facility treatments along arterial and collector streets.
Phoenix has the bene t of being physically laid out on a grid street network, which provides multiple routes of travel for all modes. However, the functional street classi cation system – and corresponding design standards and speeds of vehicular travel – create major roadway corridors that often become barriers to bicycling. Interstate highways require grade-separated crossings; multi-lane arterials must be crossed at signalized intersections; local and collector streets offer little connectivity outside of neighborhoods.
To overcome these barriers, the backbone of the Phoenix bicycle system will be comprised of retro tted arterial and collector streets that meet commuting needs and utilize signalized intersections, while minimizing the need to ride on the most heavily-traf cked major arterial routes.
GOAL:
People on
bikes will be
able to share
transportation
facilities
with motor
easily cross
roadways.
in the bicycle
network will
be completed.
C H A P T E R
9

74
The Street Planning and Design Guidelines (2009) as adopted by the City of Phoenix recognize eleven street cross-sections for new arterial and collector streets. These cross-sections are required to be used for new roadway design. Some of the cross-sections include bicycle lanes as presented below (Figures 9-1 through 9-4).
Cross-sections A, B, and C designs include bicycle lanes; however, streets that were designed before 2009 when the latest City of Phoenix Street Planning and Design Guidelines was approved, may not necessarily have bicycle lanes. In such cases, restriping existing street rights-of-ways to accommodate bicycle lanes should be considered. Roadway restriping,

75
as referred to in this document, does not require a change to the existing number of motor vehicle lanes (as opposed to road diet). Instead it as is a term used to describe the situation where lane width can be narrowed to accommodate new or buffered bicycle lanes in the roadway between the existing curbs. The City of Phoenix cross-section “D” is presented below as an example of road retro t to accommodate bicycle lanes (Figures 9-5 and 9-6). The City should discontinue use of Cross-section D without bike lanes.

76
Another example of roadway restriping is adding buffer space to provide additional separation between bicyclists and vehicular traf c. The “before” condition for this treatment is shown in Figure 9-7. The “after” condition is shown in Figure 9-8. If physical vertical barriers are added to the buffer space, this would be referred to as a protected bike lane or one-way protected cycle track.
Additional separation between bicyclists and vehicular traf c can be achieved by adding raised cycle tracks. This retro tting requires signi cant right-of-way to accommodate both pedestrians and bicyclists outside of the paved roadway, but it provides even more separation between bicyclists and vehicular traf c than a buffer space (Figure 9-9 and Figure 9-10). This and other innovation bicycle facilities are included in the NACTO Urban Bikeway Design Guide.

77
.
1
2
Road diets are based on reallocation of road space through a reduction in the number of vehicular traf c lanes. Typical roadway recon guration on a 40 feet wide collector street involves converting an undivided four lane roadway into three lanes made up of two through lanes and a center two-way left turn lane plus bike lanes. A typical four-lane roadway before a road diet is depicted in Figure 9-13. The roadway after road diet implementation is depicted in Figure 9-14. The remaining space of 10 feet can be utilized as bike lanes (5 feet in each direction), pedestrian crossing islands or parking spaces. The advantages of road diets include, but are not limited to, crash reduction, improved overall safety and accessibility for non-motorized users, reduced traf c speed, and improved access management.
Not every road is suitable for a road diet. According to Federal Highway Administration3 four-lane roadways with Average Daily Traf c (ADT) of 20,000 or less may be good candidates for road recon guration. Road diets can be applied to four-lane roadways with motor vehicle capacity from around 5,000 up to 24,000 vehicles per day, or up to around 1,500 to 1,750 vehicles during the peak hour4. In the City of Phoenix, a road diet on 15th Avenue showed ADTs above approximately 20,000 vehicles. On a road diet section, there is an increased likelihood of traf c congestion that may divert traf c to nearby parallel roads or neighborhood streets.
1 - All dimensions are approximate2 - All dimensions are approximate3 - FHWA Proven Safety Countermeasures “Road Diet” (Roadway Recon guration)4 - Libby, T. Road Diet Conversions: A Synthesis of Safety Research. DTFH61-11-H-00024, May 2013

78
Several feasibility factors should be considered before implementing a road diet: roadway function and environment, overall traf c volume, turning volumes and patterns, frequent-stop and slow-moving vehicles, speeds, and queues, crash type and pattern, pedestrian and bicycle activity, right-of way availability, as well as other contextual considerations. None of these factors have speci c threshold assigned to consider road diet; rather, multiple factors need to be taken into account when evaluating road diet option.
Approx. ADT Operations
Montana:Helena - US12
18,000 Improved No Notable Decrease*
Minnesota:Duluth - 21st Avenue EastRamsey County - Rice Street
17,00018,700 Before16,400 After
Improved*28 percent total crash reduction (3 years of data)
No Notable Decrease*N/A
Oakland - High StreetSan Leandro - East 14th Street
22,000-24,00016,000-19,300 Before14,000-19,300 After
17 percent in total crash reduction (1 year of data)52 percent in total crash reduction (2 years of data)
No notable change in vehicle speedMaximum of 3 to 4 MPH spot speed reduction
Seattle - Nine Locations9,400-19,400 Before9,800-20,300 After
34 percent average total crash reduction (1 year of data)
N/A
Orlando - Edgewater Drive.N/A increase in safety: crash rate dropped
by 34%, injury rate dropped by 68% drop in speed between approximately 1% to 7%
increase in on-street parking utilization by approximately 12%
overall increase in bicyclist use by approximately 30%
*Summarized results based on anecdotal information.
The FHWA Highway Safety Information System (HSIS) Summary Report discussed the Evaluation of Lane Reduction “Road Diet” Measures and Their Effects on Crashes and Injuries5. This report includes road-diet before and after study using 10 groups, with 11 road diets and 24 comparison sites. The analysis included examination of crash frequency, crash rate, crash severity and crash type on selected locations. The results of this study are depicted in Figure 9-11.
5 - http://www.fhwa.dot.gov/publications/research/safety/humanfac/04082/04082.pdf (last visited 12/5/2012)
where bicyclists are legally prohibited, should be designed and constructed under the assumption that they will be used by bicyclists.”

79
Road Diets Comparison Before Period Road
Crash FrequencyReduction InAfter Period No Change No Difference Road Diets Lower
Crash Rates No Change No Change Road Diets Lower Road Diets Lower
Crash Severity No Change No Change No Difference No Difference
Crash Type No Change No Change Difference:1. Road diets had a higher percentage of angle crashes2. Road diets had a lower percentage of rear-end crashes
Difference:1. Road diets had angle crashes.2. Road diets had a lower percentage of rear-end crashes.
6
The need for bicycle lanes in urban/suburban setting was evaluated by the Oregon Department of Transportation (ODOT) study7. The City of Phoenix should use this chart to help practitioners determine the appropriateness for bicycle lanes (Figure 9-12). If a bicycle lane cannot be retro tted on a major arterial, the City should identify a continuous parallel bicycle route or consider a shared lane and implement intersection bicycle design treatments for crossing the major arterial.
6 - http://www.fhwa.dot.gov/publications/research/safety/humanfac/04082/04082.pdf (last visited 12/5/2012)7 - http://www.oregon.gov/ODOT/HWY/BIKEPED/docs/bike_lane_matrix.pdf

80

81
The City of Phoenix has implemented road diets over the last 15 years and should continue this practice as underutilized roadways without bike lanes are identi ed. Examples of road diet projects the City of Phoenix has implemented include:
12th Street between Osborn Road and Indian School Road
12th Street between Camelback Road and Mountain View Road
15th Avenue between Van Buren Street and Bethany Home Road
Central Avenue between Camelback Road and Bethany Home Road
23rd Avenue between Dunlap Avenue and Peoria Avenue
40th Street between McDowell Road and Camelback Road
Grand Avenue between 7th Avenue and 15th Avenue
1st Street from Van Buren Street to Moreland Street
In particular, the City of Phoenix implemented a road diet on 40th Street between McDowell Road and Indian School Road as part of a traf c calming project. Prior to the road diet implementation, 40th Street was four-lane roadway without bike lanes, and had approximately 18,000 vehicles per day. After the road diet was implemented 40th street was converted into a two-lane roadway with a center turn lane and bike lanes. However, all 40th Street approaches were designed to have one left, one through and one right turn lane at the collector street intersections. The signalized intersections along 40th Street remained unchanged. A one-year before and after study concluded that the collision rate between the arterial street intersections decreased by 43 percent. Collision rates at the signalized intersections remained approximately constant during this same time period8.
Many engineering advancements have been made in recent years to make bicycling a more prominent daily activity for short-distance trips within cities. Most notably, the National Association of City Transportation Of cials (NACTO) has developed two new guidance documents that are being enthusiastically embraced by metropolitan areas across the country. The NACTO Urban Street Design Guide and Urban Bikeway Design Guide will be used by Phoenix to supplement current local, state, and national transportation standards.
8 - Lee Engineering, LLC 40th Street Traf c Study, 2003
In a memorandum dated August 20, 2013, the Federal Highway Administration expressed support for taking a exible approach to bicycle and pedestrian facility design, particularly in urban areas. The AASHTO Guide for the Development of Bicycle Facilities is the primary national resource for planning, designing, and operation of bicycle facilities. The NACTO Urban Bikeway Design Guide builds upon the exibilities provided in the AASHTO guide, which can help communities plan and design safe and convenient facilities for bicyclists. The City of Phoenix Street Transportation Department has demonstrated national leadership by adopting the NACTO Design Guides for Streets and Bicycle Facilities in 2013. The table presented on the FHWA’s bicycle and pedestrian design guidance web page is regularly updated (http://1.usa.gov/1qoNCov) and explains what bicycle facilities, signs, and markings are allowed in accordance with the MUTCD. Elements of the NACTO Guide’s new and revised provisions will be considered in the rulemaking cycle for the next edition of the MUTCD. Non-compliant traf c control devices may be piloted through the MUTCD experimentation process. That process is described in Section 1A.10 of the MUTCD.
This section of the report documents an extensive review of the state of the art and practice in variety of design options. These design options represent the most innovative technologies and practices implemented worldwide by cities leading in bicycle friendly design. The design options were selected to accommodate preferences of a variety of bicyclists (e.g. preferring to use on and/or off-street bicycle facilities).
The design options presented in this section were chosen as infrastructure tools that can be used to improve bicycling in Phoenix and are consistent with guidance provided by the National Association of City Transportation Of cials (NACTO), Manual on Uniform Traf c Control Devices (MUTCD), and the American Association of State Highway and Transportation Of cials (AASHTO).
The City’s existing plans, standards, and guidelines should be updated to speci cally address intersection treatments. Additionally, existing plans, standards, and guidelines do not reference innovative facilities, such as cycle tracks. Below is a list of recommended innovative facilities from the NACTO guide that should be included in the City of Phoenix Street Planning and Design Guidelines. These as well as other design options are presented with greater detail in the next section of this report.

82
Buffered Bike Lane Contra-Flow Bike Lane Colored Bike Lane One-Way Cycle Track (protected bike lane) Two-Way Cycle Track Raised Cycle Track Bicycle Boulevard Shared Lane Marking
Bike Box Intersection Crossing Marking Two-Stage Turn Queue Box Median Refuge Island Through Bike Lane Combined Bike Lane/Turn Lane Cycle Track Intersection Approach Active Warning Beacon for Bike Route at
Unsignalized Intersection Bicycle Signals Hybrid Beacon for Bike Route Crossing of
Major Street (BikeHAWK)
DESIGN OPTIONS FOR ROADWAY SEGMENTS
Provides exclusive space for bicyclists through the use of bicycle lane striping, signs, and pavement markings.
On roadways with 3,000 or more motor vehicle trips per day where there is potential or existing bicycle demand.
Any street with excessive curb to curb space where bike lanes could help reduce vehicle lane widths.
Improves bicyclist comfort on busy roads. Improves bicyclist visibility to motor vehicle
drivers by encouraging bicyclists to ride on the road rather than on the sidewalk.
Allows bicyclists to ride at their preferred speed. When created by narrowing motor vehicle lanes,
can reduce motor vehicle speeds.

83
Allows for bicycle access on major through streets.
Distinguishes lane usage between motorists and cyclists.
Bike lanes should provide a width of 5 ft. to 8 ft. of rideable surface; however, in constrained situations a minimum width of 4’ ride-able surface is allowable based on engineering judgment. Bicycle lanes over 8 ft. wide are discourage to limit confusion as to whether the bike lane is a vehicle lane.
Space for bicycle lanes can be created by reallocating existing roadway space, e.g., by narrowing other travel lanes, removing travel lanes, and/or recon guring parking lanes.
Provides buffer space on one or both sides of bicycle lane to create greater separation between bicyclists and passing motorists as well as on-street parking.
The buffer is typically installed on the parking side where parking turnover is high and traf c speeds low, and on the travel lane side where parking turnover is low and traf c speeds high.
Streets where high motor vehicle volumes and speeds where cycle track is not feasible
Provides additional space to separate bicyclists from vehicular traf c
Provides space for bicyclists to pass one another without encroaching into the adjacent motor vehicle travel lane
Encourages bicyclists to ride outside of the door zone when the buffer is between parked cars and the bike lane
Provides more space for bicycling without making the bike lane appear so wide that it might be mistaken for a travel lane or a parking lane
Space for buffered bicycle lanes can be created by reallocating existing roadway space, e.g., by narrowing other travel lanes, removing travel lanes, and/or recon guring parking lanes.
photo provided by Toole Design Group
Provides a bicycle lane for bicyclist to travel in both directions while vehicular traf c remains one-way.
One-way traf c streets Narrow streets where on-street parking and
bicycle accessibility are given priority over traf c accessibility
Provide direct access for bicycles traveling in both directions
In uence motorist choice of routes without limiting bicycle traf c
Cyclists do not have to make detours as a results of one-way traf c

84
Space can be created by reallocating existing roadway space, e.g., by narrowing other travel lanes, removing travel lanes, and/or recon guring parking lanes.
Limited parking on side with contra ow lane Illegal parking within the contra ow lane Traf c control signs/signals must exist for
contra- ow bicyclist traf c Design of contra- ow lane termini and its
connection to the receiving roadway A bicycle lane or other marked bicycle facility
should be provided for bicyclists traveling in the same direction as motor vehicles to discourage wrong way riding in the contra- ow lane
Bicycle lanes that are painted green to provide the visual perception of a narrow roadway for motorists and give the bicyclist a psychological perception of separation from traf c.
Use for existing bicycle lanes at locations of potential con ict points, i.e., heavily utilized driveway crossings, within bicycle crosswalks, at uncontrolled intersections, railroad track crossings, etc.
Provides visual separation Provides warning of possible con ict from
crossing paths
Maintenance Cost Use materials that provide a slip resistant
surface Typically requires approval from FHWA to
implement on an experimental basis.
Exclusive one-way bicycle facilities that are physically separated from motor vehicle travel lanes and sidewalks. Separation can be achieved through a variety of treatments, including: a) parking lanes with pavement marking buffers inclusive of exposts or bollards; b) curbs or concrete medians; or c) planters with landscaping. Can be implemented at street level, raised to the level of the adjacent sidewalk, or raised at a vertical offset between the street and the sidewalk. The latter can utilize a mountable curb to allow for entry and exit of the roadway.
Arterial roadways with higher motor vehicle speeds and volumes
Roadways with high parking turnover Roadways with fewer cross-streets and longer
blocks
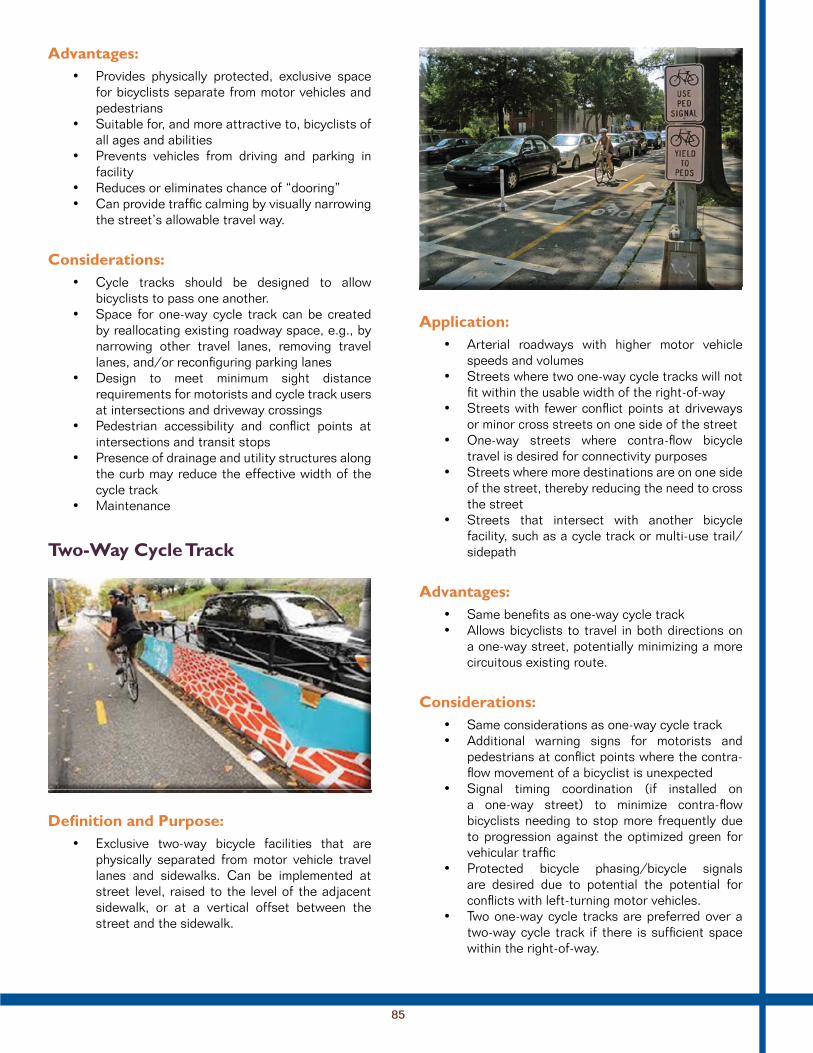
85
Provides physically protected, exclusive space for bicyclists separate from motor vehicles and pedestrians
Suitable for, and more attractive to, bicyclists of all ages and abilities
Prevents vehicles from driving and parking in facility
Reduces or eliminates chance of “dooring” Can provide traf c calming by visually narrowing
the street’s allowable travel way.
Cycle tracks should be designed to allow bicyclists to pass one another.
Space for one-way cycle track can be created by reallocating existing roadway space, e.g., by narrowing other travel lanes, removing travel lanes, and/or recon guring parking lanes
Design to meet minimum sight distance requirements for motorists and cycle track users at intersections and driveway crossings
Pedestrian accessibility and con ict points at intersections and transit stops
Presence of drainage and utility structures along the curb may reduce the effective width of the cycle track
Maintenance
Exclusive two-way bicycle facilities that are physically separated from motor vehicle travel lanes and sidewalks. Can be implemented at street level, raised to the level of the adjacent sidewalk, or at a vertical offset between the street and the sidewalk.
Arterial roadways with higher motor vehicle speeds and volumes
Streets where two one-way cycle tracks will not t within the usable width of the right-of-way
Streets with fewer con ict points at driveways or minor cross streets on one side of the street
One-way streets where contra- ow bicycle travel is desired for connectivity purposes
Streets where more destinations are on one side of the street, thereby reducing the need to cross the street
Streets that intersect with another bicycle facility, such as a cycle track or multi-use trail/sidepath
Same bene ts as one-way cycle track Allows bicyclists to travel in both directions on
a one-way street, potentially minimizing a more circuitous existing route.
Same considerations as one-way cycle track Additional warning signs for motorists and
pedestrians at con ict points where the contra-ow movement of a bicyclist is unexpected
Signal timing coordination (if installed on a one-way street) to minimize contra- ow bicyclists needing to stop more frequently due to progression against the optimized green for vehicular traf c
Protected bicycle phasing/bicycle signals are desired due to potential the potential for con icts with left-turning motor vehicles.
Two one-way cycle tracks are preferred over a two-way cycle track if there is suf cient space within the right-of-way.

86
Pavement markings that emphasize to motorists that a travel lane should be shared with bicyclists or that bicyclists have priority in the travel lane. They also help bicyclists position themselves outside of the door zone.
Streets with moderate traf c volumes where bike lanes are precluded by constrained right-of-way
Short gaps between bike lanes Streets without space for bike lanes in both
directions. Low-traf c shared roadways to indicate
presence of bikeway To designate through-movement of bicycles
through shared turn lane Streets with speed limits of 35 mph or less
Increase visibility of bicyclists Guide proper roadway positioning of bicyclists
on streets
Maintenance costs Markings must be spaced 250 ft. or less Installation of appropriate MUTCD signage to
indicate when a bicyclist and motorist should share the available lane width or when the bicyclist “may use full lane.”
Shared on-road facility designated only for bus and bicycle use. Sometimes painted in red. Provide on-road travel lanes designated exclusively for bus and bicycle use, along with right turns at intersections and driveways
Arterial streets where there is not enough space for a bike lane
Arterial streets with high bus and bike volumes
Provides dedicated lane for buses and bicyclists
May be uncomfortable for some bicyclists due to sharing lane with large vehicles and mixing with motor vehicle traf c at intersections.
Issues with right turn motorists entering the lane on the approach to driveways and intersections.
Important to educate bus drivers

87
Local street routes that are optimized for bicycle and pedestrian travel. Design elements may include: diverters, recon guration of stop signs to favor the bike boulevard, traf c calming and shared lane markings, and crossing improvements at high traf c crossings
Any residential street or minor collectors
Improves connectivity for non-motorized modes Improves bicycle comfort Improves bicycle safety Provides comfortable and attractive places for
people of all ages to bike, run, skate, and walk Lowers vehicular volume Maintenance costs
Traf c calming measures designed to accommodate bicyclists. Examples include curb extensions, speed tables, chicanes, storm water plantings, cut-throughs, and diverters.
Local or collector streets
Calms traf c Reduces traf c speeds and volumes Reduces cut-through traf c
Maintenance (issues such as street sweeping) and landscape trimming/watering
Affects parking

88
BEFORE
AFTER
Reallocating roadway space by reducing the number of general purpose travel lanes and using the balance for other purposes, such as to support bicycle and pedestrian access.
Four-lane undivided streets, which may be converted to a three-lane cross section (one lane in each direction with a center turn lane or median)
Multi-lane streets with extra capacity where one or more lanes can be removed
Can create space for bicycle lanes, cycle tracks, refuge islands, and other bicycle and pedestrian improvements
Reduces exposure of crossing bicyclists and pedestrians to motor vehicle traf c
Can reduce motor vehicle crashes and improve speed limit compliance
A capacity analysis is often necessary to evaluate the impacts of the proposed design on the operations of the roadway and adjacent road network.
Maintain continuity of pavement markings from blocks with road diet to blocks in the existing condition.
Advantageous to add width to the parking lane or the bicycle lane in areas of high parking turnover to reduce the likelihood of dooring
photo provided by Toole Design Group
Reducing the width of general purpose travel lanes to the minimal lane widths allowed within the jurisdiction to encourage slower vehicular speeds and/or provide space for bicycle and pedestrian improvements.
Streets with lanes that are wider than the minimum requirement
Can create space for bicycle lanes, cycle tracks, refuge islands, and other bicycle and pedestrian improvements
Can reduce motor vehicle speeds
Heavy vehicles, transit vehicles, and emergency vehicles and the width of roadway considered to be a minimum for these vehicles’ routes
Potential impacts on the adjacent road network

89
Provides a dedicated space for bicyclists to wait ahead of traf c during the red light at signalized intersections. A typical bicycle box is designated by two pavement markings called stop bars, approximately 12 to 16 feet apart with painted bicycle symbol. Bicycle boxes maybe painted with bright colors (green).
Signalized intersection with:
High number of queuing bicyclists High automobile and bicycle volume Frequent bicycle left turns or motor vehicle right
turns History of frequent turning con icts No right turn bay
Improves visibility of bicyclists stopped at signalized intersection
Reduces bicycle/motor vehicle crashes Gives bicyclist priority when signal has a short
green phase Allows left turn bicyclist to position themselves
ahead of traf c Shorter crossing distance for bicyclists Lessens nuisance from vehicle exhaust
Post “No Turn on Red” signs for motorists Vehicle encroachment into bike boxes Initial and maintenance costs of colored surface
photo from NACTO Urban Bikeway Design Guide
Offer bicyclists a safe way to make left turns at multi-lane signalized intersections from a right side cycle track or bike lane, or to make right turns from a left side cycle track or bike lane. The con guration of two-stage turn queue boxes is typically dictated by the geometric layout of the intersection. For example, the queue box can utilize area in front of a setback crosswalk, area in line with a cycle track’s buffer space and far side parking lane or, if right-of-way constraints allow at a T-Intersection, an area within a carved out “jughandle” sidewalk con guration.

90
Signalized, multi-lane intersections with high motor vehicle volumes or speed where a signi cant number of bicyclists turn left from a right side facility
Unsignalized intersections in conjunction with connections to other facilities such as bicycle boulevards
To assist bicyclists in navigating safely across streetcar tracks
Improves the ability of the bicyclist to make safe and comfortable left-turning movements
Provides a dedicated queuing space for bicyclists making a two-stage turn
Reduces turning con icts between bicyclists and motor vehicles
Prevents con icts arising from bicyclists queuing in a bike lane or crosswalk
Typically results in higher average delay for bicyclists, due to the need to receive two separate green signal indications (one for the through street, followed by one for the cross street) before proceeding with the turn; at unsignalized intersections, the two-stage turning movement can cause delay as bicyclists need to wait for appropriate gaps in traf c to cross
In cities that permit right turns on red signal indications, a “No Turn on Red” sign should be installed to prevent vehicles from entering the queue area (MUTCD Section 2B.54)
Pavement markings in the intersection that indicate where bicyclists should cross. Pavement marking treatments can include dashed white lines. symbols (e.g., chevrons, bicycle symbols), and green paint.
Limited visibility for side street traf c On-street parking Curved road through intersection
Provides greater visibility for bicyclists at intersections.
Informs all roadway users of where bicyclists should cross.
Separates modes to reduce con icts.
Maintenance Potential confusion or clutter with additional
pavement markings

91
As bicyclists approach intersections in a standard bicycle facility, the presence of vehicular turning lanes can pose a signi cant challenge for bicyclists to correctly position themselves to make a through movement across the intersection. A standard bike lane, also referred to as a ‘bicycle pocket’ is placed to the left of a right-turn-only lane at an intersection to enable bicyclists and right-turning motorists to position themselves in advance of the intersection, avoiding last-second con icts in the “weaving area.” A through bike lane is designed so that the through bicyclists are given priority within the weaving area and signs and markings are installed to indicate that motorists turning right should yield to bicyclists going straight through the intersection in the bike lane. Dashed lines and colored pavement are used to increase the visibility of the con ict area.
Streets with right-side bike lanes and right-turn only lanes at intersections
Streets with bike lanes where the right or left travel lane terminates in a turn lane
Streets with bike lanes and a parking lane that transitions into a turn lane at intersections
Enables bicyclists to correctly position themselves to the left of right turn lanes
Reduces con icts between turning motorists and bicycle through traf c
Provides bicyclists with guidance to follow the preferred travel path
Leads to more predictable bicyclist and motorist travel movements
Alerts motorists to expect and yield to merging bicycle traf c
Designs should encourage turning motorists to yield to bicyclists through installation of MUTCD regulatory signs
Important to consider safety implications for all allowed movements for each travel mode (motor vehicle, transit vehicles, bicyclists, pedestrians)
Consider restricting movements to reduce potential con icts and increase protection for bicyclists and pedestrians
Merging or weaving areas should be located prior to the intersection
A combined bicycle lane/motor vehicle turn lane with a designated space for through-moving bicyclists. Typically, a dashed line indicates the end of a bicycle facility adjacent to the curb and the start of the space for bicyclist and motorists to merge into a shared lane, the combined bike lane/turn lane. The intended path for bicyclists is indicated by a dashed bicycle lane, or shared lane markings, placed towards the inside portion of the turn lane. This treatment includes signs to advise motorists and bicyclists of proper positioning within the lane.
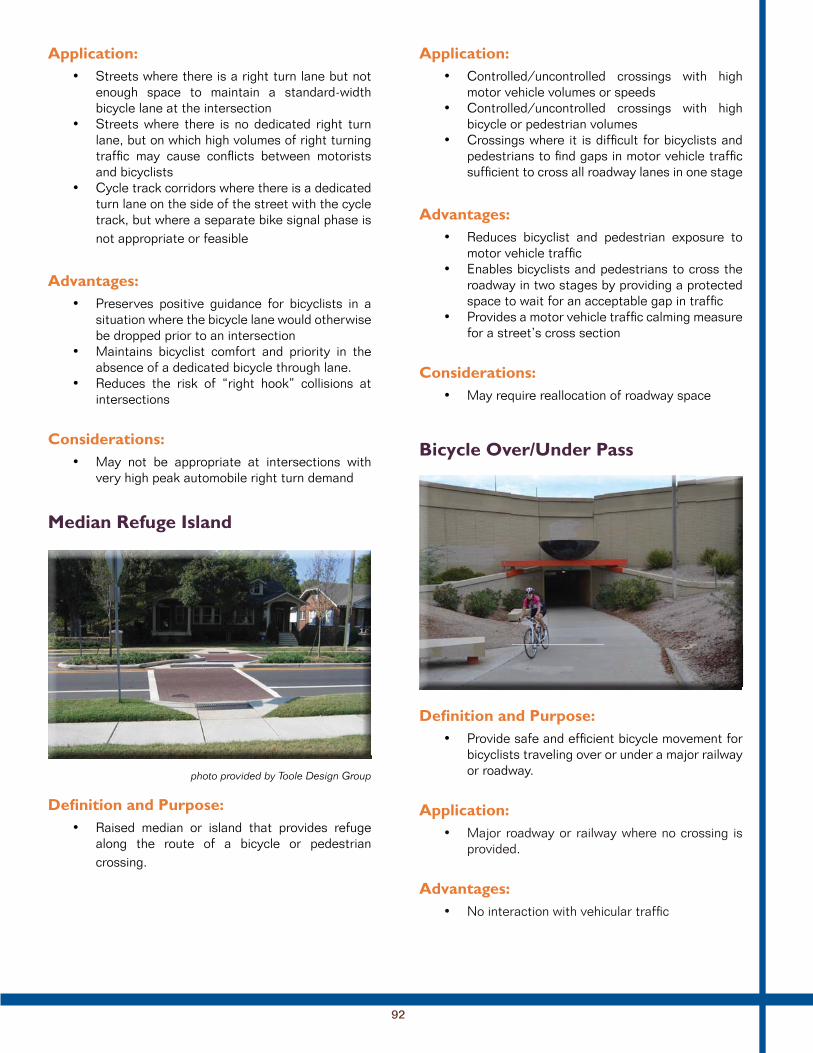
92
Streets where there is a right turn lane but not enough space to maintain a standard-width bicycle lane at the intersection
Streets where there is no dedicated right turn lane, but on which high volumes of right turning traf c may cause con icts between motorists and bicyclists
Cycle track corridors where there is a dedicated turn lane on the side of the street with the cycle track, but where a separate bike signal phase is not appropriate or feasible
Preserves positive guidance for bicyclists in a situation where the bicycle lane would otherwise be dropped prior to an intersection
Maintains bicyclist comfort and priority in the absence of a dedicated bicycle through lane.
Reduces the risk of “right hook” collisions at intersections
May not be appropriate at intersections with very high peak automobile right turn demand
photo provided by Toole Design Group
Raised median or island that provides refuge along the route of a bicycle or pedestrian crossing.
Controlled/uncontrolled crossings with high motor vehicle volumes or speeds
Controlled/uncontrolled crossings with high bicycle or pedestrian volumes
Crossings where it is dif cult for bicyclists and pedestrians to nd gaps in motor vehicle traf c suf cient to cross all roadway lanes in one stage
Reduces bicyclist and pedestrian exposure to motor vehicle traf c
Enables bicyclists and pedestrians to cross the roadway in two stages by providing a protected space to wait for an acceptable gap in traf c
Provides a motor vehicle traf c calming measure for a street’s cross section
May require reallocation of roadway space
Provide safe and ef cient bicycle movement for bicyclists traveling over or under a major railway or roadway.
Major roadway or railway where no crossing is provided.
No interaction with vehicular traf c

93
Cost “footprint” required for bridge ramps Security for underpasses Vandalism for underpasses
photo provided by City of Tucson
Use a bicycle symbol lens at signalized intersections to indicate when bicycles may travel through the intersection.
Signalized intersection with high bicycle volume
Minimize con icts between bicyclists and other modes of transportation.
Reduced bicycle delay during periods of high vehicle traf c
Provide bicyclist priority over other users (leading bicycle interval)
Help to simplify bicycle movements through complex intersections
Maintenance costs Increase stops and delay for automobile traf c Increase delay for bicyclist during periods when
the major street traf c is low Not yet in MUTCD (under consideration for next
revision) Motorist may confuse bicycle signal for vehicle
signal in some applications
Provides detection for bicyclists at signalized intersections using pavement sensors/loops, video detection, or other technologies. Designs should include markings to indicate to bicyclists where to position themselves to actuate the signal.
Signalized intersection where signal change is unlikely without detection (activated signal approaches)
Provide a way for a bicyclist to call the signal
Installation and maintenance costs Sensitivity and adjustment
photo provided by City of Tucson

94
(RRFB)
photo provided by City of Scottsdale
A warning beacon consisting of yellow LED lights in two rectangular clusters, or beacons, that employ a stutter- ash pattern similar to that used on emergency vehicles. Used at uncontrolled intersections and mid-block crossings to warn drivers of crossing bicyclists and pedestrians.
Uncontrolled intersections/crossings with high motor vehicle volumes or speeds
Uncontrolled intersections/crossings with high bicycle or pedestrian volumes, or a high number of vulnerable pedestrians (e.g. near schools, senior centers)
Shared-use path crossings
Increases driver yielding Costs less than traf c signals or hybrid signals
and can be used with solar power panels to eliminate the need for a power source
RRFB’s should be limited to locations with critical safety concerns and should not be installed in locations with sight distance constraints that limit the driver’s ability to view pedestrians on the approach to the crosswalk.
RRFB’s should be used in conjunction with advance yield pavement lines and signs.
photo provided by City of Tucson
A push-button-activated pedestrian and bicycle signal that increases pedestrian and bicycle safety at crossings while stopping vehicle traf c only as needed. This type of signal is also commonly referred to as the High intensity Activated crosswalk, or HAWK, signal. This signal consists of two red lenses above a single yellow lens. Once activated by the push-button, the hybrid beacon will brie y ash yellow intervals until displaying a steady red indication to drivers and a “WALK” indication to pedestrians and bicyclists. While pedestrians nish crossing, the hybrid beacon displays alternating ashing red lights to the motorist until it goes dark signaling that motorists may proceed.
Mid-block crossings (including off-street path crossings)
Crossings where high traf c volumes and speeds make it dif cult for pedestrians and bicyclists to cross the street, and where ‘warrants’ for a conventional signal are not met
Provide a protected crossing while allowing vehicles to proceed through a pedestrian/bicycle crossing as soon as it is clear, thus minimizing vehicle delay
May also provide audible information for visually impaired pedestrians

95
Hybrid beacons should only be installed at marked crosswalks and if gaps in traf c are not deemed adequate to permit pedestrians and bicyclists to cross safely.
A shared bicycle and pedestrian facility that is physically separated from motor vehicle traf c by an open space or barrier and either within the highway right-of-way or within an independent right-of-way. Most shared use paths are designed for two-way travel and are at least 8’ wide.
Corridors not well served by the on-street bikeway network
Washes, canals, river banks
Separates bicyclist from vehicular traf c Provides more direct/shorter routes to access
destinations
Stops at street crossings unless underpasses and overpasses are built
photos provided by City of Tucson
Bicycle parking intended for short-term use, such as a brief shopping trip. May consist of individual or multiple bike racks placed within the furniture or building frontage zones on a sidewalk or high-capacity corrals placed within the parking lane.
Within close proximity of major entrances to businesses, parks, libraries and other community facilities.
Promotes bicyclist traf c to variety of destinations
Provides secure located to store bicycles
In-street corrals may require removal of on-street parking space

96
photo provided by Toole Design Group
Long-term bicycle parking should be secure and protected from the elements. Potential facilities include bike lockers, bike lids, bike cages, and bike stations.
Close to places of employment, transit centers, educational facilities, airports, and train stations (long-term).
Promotes bicyclist traf c to variety of destinations
Provides secure located to store bicycles
For private property applications, must be provided by property owners
Additional amenities may be provided, including showers, lockers, and maintenance stations
Signs to provide distance and direction to points of interest or destinations along a route. In the context of this plan, way nding also includes guides signs to provide connectivity and continuation of an existing bike route, connection to another bicycle route, and street name signs at trail crossings of arterial streets.
Multi-use trail crossings at arterial streets, or along any on-street or off-street route which provide connections to major attractors or points of interest or alternate routes.
Guidance for complex routes where the primary path may be unclear
Provides useful guidance to bicyclists Promotes tourism Encourages and promotes bicycling by providing
improved directions and distances
Requires custom signs and sign monitoring MAG is currently conducting a study to
develop standardized Way nidng sign design guidelines and branding for the off-street trail system. Phoenix should provide input into the development of the sign design and usage guidelines and adopt the guidelines and branding that are developed for the MAG region. This same practices can be used for the on-street bicycle routes where appropriate.

97
RECOMMENDATIONS
People on bikes will be able to share transportation facilities with motor vehicles and easily cross roadways. Missing gaps in the bicycle network will be completed.
Retro t arterial and collector streets to meet commuting needs and utilize signalized intersections, while minimizing the need to ride on the most heavily-traf cked major arterial routes.
Continue to implement road diets as underutilized roadways without bike lanes are identi ed.
Evaluate roadways at the time of pavement overlays to add bike lanes
Implement innovative bicycle facilities as described in Chapter 9 of the Bicycle Master Plan
Provide way nding for bicyclists throughout the City
Install guide signs for connections to the continuation of the existing bike route
Install guide signs for connections to other bicycle routes
Install way nding signs that provide guidance as well as distance and/or time to nearby destinations or points of interest
Provide street name signs for trail crossings of arterial and collector streets where none currently exists.
Provide input into the development of the MAG way nding sign design and usage guidelines
Adopt the way nding guidelines that are developed for the MAG region
Update City of Phoenix guidelines addressing bicycle facility design and traf c control
Take a exible approach to bicycle and pedestrian facility design, particularly in urban areas, through the use of AASHTO and NACTO national resource guides.
Guidance on bike lane design should recommend a width of 5’ to 7’of ride-able surface; however, in constrained situations a minimum width of 4’ ride-able surface is allowable based on engineering judgment. Guidance should discourage bicycle lanes over 7’ wide to limit confusion as to whether the bike lane is on-street parking or a travel lane. If surplus pavement exists, a striped buffer between the vehicle travel lane and the bicycle lane may be provided.
Guidance on bike lane design should specify that bike lane signs should be considered and used based on engineering judgment, and guidance should provide additional detail on the use and placement of bike lane signs per the MUTCD and AASHTO.
Guidance on bike lane design should specify that bike lane symbols should be installed at intervals of 500 ft. to 1000 ft. based on engineering judgment, and that bike lane markings should generally be provided after intersections and signalized driveways. Pavement symbols on the approach to intersections where separate right turn lanes exist should be encouraged.
The Traf c Operations Handbook allows consideration to be given to declaring a bike lane in effect only during commute periods (7:00 a.m. – 6 p.m.). This language should be modi ed to specify that such consideration should include roadway classi cation, cross section, traf c speeds and volumes, and adjacent land uses.
Guidance on shared use path design should recommend two-way shared-use path widths of 10 ft. - 14 ft. or more (per AASHTO), with reductions to 8’ under certain circumstances based on engineering judgment.
Guidance on shared use path design should promote the use of materials other than decomposed granite for multi-use trails, such as asphalt or concrete.
Guidance on canal pathway design should promote the inclusion of bicycle accommodations on bridges across canals.
Guidance on canal pathway design should include guidelines for bicycle access to the pathway, short- and long-term bicycle parking, and bicycle way nding.

98
Guidance on bike routes should include additional detail on the use and placement of bike route signs per AASHTO and MUTCD.
Guidance on bicycle detection at traf c signals should allow for testing of new bicycle detection technologies.
Guidance on bike rack placement and minimum clearances should be updated based on the most recent AASHTO and APBP guidelines.
Guidance on bike parking should address long-term bicycle parking, such as bike lockers at transit hubs.
The Street Transportation Department should review and potentially expand the existing rack request program.
The City should partner with business improvement districts such as the Downtown Phoenix Partnership to provide bicycle racks in commercial areas.
Funding should be prioritized for bicycle rack installation along Tier 1 corridors during the initial phase of bicycle plan implementation, Tier II corridors during the second phase of bicycle plan implementation, and Tier III corridors during the third phase of bicycle plan implementation.
The City should consider initiating an interagency program to evaluate, replace and add bike parking at all City-owned public facilities.
The City should consider amending zoning and subdivision codes to require redevelopment and new development to provide appropriate types, quantities and locations of bicycle parking as part of development approval. See Sample Bicycle Parking Guidelines in Appendix K: Bicycle Parking.
The City of Phoenix bicycle program web page should provide a map of bicycle parking locations in downtown Phoenix, a way for bicyclists to indicate where bicycle parking is needed, and information on how to request a bicycle rack.
If the Street Transportation Department converts single-space parking meters to pay-stations, old parking meter posts should be modi ed to function as bicycle racks where feasible and appropriate.
The Street Transportation Department should establish a process to evaluate locations and facility types for long-term bicycle parking, and develop branding.
The bicycle parking standards provided in the Phoenix Traf c Operations Handbook should be updated. See recommended updates in Appendix K: Bicycle Parking.
Guidance on work zones should address bicycle safety and accommodation.
Guidance on work zones should include temporary detour signing and striping recommendations for bicycles, as well as “Share the Road” and “May use Full Lane” signs as provided for in the MUTCD.

MAKING CONNECTIONS
99
The city of Phoenix is one of 32 jurisdictions in Maricopa County (including the County Government and Indian Reservations). Because Phoenix lies in the center of the region, mobility within Phoenix is, in part, its connection with other jurisdictions. Within the city, bicycle facilities can be found on- and off-street. Most of these off-street facilities are managed by the City of Phoenix Parks and Recreation Department. Like the on-street network, the off street network ful lls a mobility and recreation role. For bicycle facilities within Phoenix to be fully functional, it is imperative that the on- and off- street networks be seamlessly integrated. This chapter discusses opportunities to ensure bicycle facilities are connected within the city and within the region.
C H A P T E R
10GOAL:
The City of
Phoenix will
be connected
to bikeways,
shared use
paths, and
trails with
Phoenix and
communities
longer-
distance
recreation and
commuting
opportunities.
This mix of
facility types
comfortable
for all ages,
abilities,
purposes
through the
promotion
of loops and
links.

100
Within Phoenix, a total of 51 miles of off-street paved paths and 66 miles of unpaved trails are managed by the Phoenix Parks and Recreation Department, Salt River Project, and the Flood Control District of Maricopa County. These facilities are used by a wide variety of cyclists described in Table 10-1: Types of Cyclists.
Type of Cyclists Characteristics
Type A: Child Bicyclists Pre-teen riders whose bicycle use is initially monitored by parents Do not like to ride in traf c and/or are not allowed to ride on most streets Desire access to key destinations surrounding residential area Will seek out multi-use pathways as safe, recreational places to ride.
Type B: Basic Bicyclists Casual adult and teenage riders who are less con dent operating in traf c Are often intimidated by motor vehicles, tend to make short trips close to home
and prefer designated bicycle facilities Some will develop greater skills and progress to the advanced level, but basic
bicyclists will always make up the largest percentage of cyclists.
Type C: Sport Cyclists Riders preferring adventure cycling requiring high levels of technical expertise Includes recreational road cyclists focusing on distance and speed Includes off-road cyclists focusing on terrain, speed and distance.
Type D: Advanced Bicyclists Experienced riders who can operate under most traf c conditions. Includes road cyclists comfortable riding in traf c who will ride with or without
bicycle facilities present, often bike long distances, and prefer direct routes for utilitarian trips.
Most of the paved and unpaved shared use facilities are along canals or washes, and in parks, mountain parks, and preserves. Of these facilities, the canals and washes are preferred by all types of cyclists. These facilities provide important non-motorized connections because they are generally level surfaces and connected to the street grid. These off-street facilities include the shared use corridors along the Indian Bend and Cave Creek Washes, and shared use corridors along the Grand, Arizona, Highline, Western, and Central Arizona Project (CAP) canals. Other facilities, preferred by Types A through C cyclists are located in parks, mountain parks and preserves are primarily loops not connected to the street grid and used for recreational and sport bicyclists. This plan is focused on enhancing the network of bicycle facilities that provide recreational and commuter, shopping or other mobility options. For these reasons, this plan focused on providing opportunities associated with bicycle facilities along canals.
Salt River Project (SRP) operates a system of canals throughout the metropolitan area for the purposes of transmission and distribution of water. As shown in Figure 10-1, the banks of SRP-operated canals have
become popular recreation areas. Some corridors offer developed shared use trails; others corridors are not developed and users share access provided primarily for SRP maintenance vehicles. All canals are required by Federal law to be accessible to the public.
The most signi cant off-street bicycle facility is the partially completed 18.69 mile shared-use path and trail corridor along the Grand Canal. Completing this corridor is the top ranked off-road bikeway project recommended in this plan. This project is recommended as part of the Tier II improvement projects.
The Grand Canal trail is a major SRP corridor that links the communities of Peoria, Glendale, Phoenix, and Tempe. The Grand Canal represents a substantially under-utilized asset. In addition to providing a recreational venue, it also contributes to the transportation network as a major bike trajectory connecting neighborhoods along its route and linking with two Metro Light Rail stations at Sky Harbor International Airport and Campbell/Central Avenue.
Within the City of Phoenix, the Grand Canal connects between and within neighborhoods east and west of I-17. These include the westside urban villages of Maryvale and the eastside urban Villages of Alhambra, Encanto,

101
Camelback East, and Central City. The Grand Canal Trail does not traverse I-17. As a result, the urban village of Maryvale is not connected by the canal to other urban villages east of I-17. One of the projects identi ed as a part of this plan is a bridge over I-17 at the Grand Canal.
The Grand Canal Trail is also important as an intra-village facility connecting destinations within the Encanto and Camelback East Villages. As part of the ReinventPHX initiative, detailed plans have been developed for trail development and major street crossing improvements at ten intersections located between 7th Avenue and 44th Street. These plans include installing 12-foot wide paved multi-use trails along the canal, using a combination of highly visible crosswalk markings, colored pavements, median refuge islands, and bicycle hybrid beacons (BikeHAWKs) to enhance intersection crossings; and celebrating the canal by creating a community gateway using an urban roundabout, public art, and amenities at the intersection of the Grand Canal with Van Buren and 40th Street. Other concepts put forward by ReinventPHX include activating the canal with buildings that front onto it, improving access by adding new pedestrian bridge crossings, and the creating new civic spaces at select nodes.
The Indian Bend Wash within Phoenix extends from Scottsdale Road to the Piestewa Peak Parkway (SR-51). This corridor extends the existing city of Scottsdale Indian Bend Wash shared use facility into Phoenix. The Indian Bend Wash terminates at the Salt River and Rio Salado Development in Tempe.
The Cave Creek Wash is a signi cant open space corridor that extends from the Tonto National Forest through the Cave Buttes Recreation Area to the Arizona Canal. Within Phoenix, a paved, shared-use path extends from Union Hills Road to the Arizona Canal. A portion of the path, between Greenway Parkway and the Cave Creek Golf Course access road is incomplete but should be built soon. This portion includes a mid-block crossing across 19th Avenue.
The Arizona Canal Corridor includes a paved shared use path between the Skunk Creek Wash and East 24th Street in Phoenix. The Arizona Canal is also the northern link of the Maricopa County Sun Circle Trail. At 24th Street, the corridor includes a decomposed granite trail through the Arizona Biltmore and proceeds east along the canal bank into Scottsdale. This corridor includes the Arizona Falls, which was restored by SRP as a visitor destination.
The Highline Canal is located between the Western Canal and South Mountain. A paved, shared use path is located along this canal corridor between Central Avenue and 46th Street. At 46th Street, the Highline Canal proceeds south into Tempe and Guadalupe, and wraps back across I-10 into Phoenix. The unpaved path is discontinuous between Ray Road, across I-10, and Chandler Boulevard. The portion of the Canal within Phoenix is one of two east-west non-motorized facilities serving the area between the Gila River and South Mountain.
The Western Canal is part of the Maricopa County Sun Circle and Maricopa Trails. This important corridor extends from 35th Avenue within Phoenix into Tempe, where is proceeds south to approximately Chandler Boulevard.
The CAP corridor is a regional facility that extends from the Salt River Pima Indian Community throughout the county. Within Phoenix, a portion of the corridor from 19th to 67 Avenues is a designated, shared use unpaved trail. While other portions of the CAP are designated as shared use facilities, they are discontinuous along the canal.
Sport and Recreational Cyclists have frequent rides in excess of 50 miles per day that cross through many jurisdictions. They desire large loops that utilize connectors that feed into larger main corridor routes. These loops can be built on/connected with larger loops to support rides from 35 to more than 60 miles. These loop routes would also provide access to cultural features such as the Musical Instrument Museum, Reach 11, or the canal system and other family oriented routes. Within Phoenix priority corridors that support these larger loops are:
Deer Valley from 35th Avenue to 56th Street Central Avenue to South Mountain Park and the
route around South Mountain Cave Creek Road
Additional corridors that would support these larger loops are:
Greenway Road from 51st avenue to the Greenway/Hayden Loop. This would tie Phoenix into Scottsdale’s system.
Mayo Boulevard from the Musical Instrument Museum (Tatum Boulevard) to Scottsdale Road. This would also tie north Scottsdale to the Phoenix system.

102

103
Of cials from adjacent communities were contacted to obtain information about connectivity to and from Phoenix into their community. A summary of this information is provided in the following sections.
Glendale borders Phoenix to the northwest. Important opportunities for bicycle facilities exist along the Grand Canal and Skunk Creek Trails as well as along on-street routes:
To connect the ASU West campus (located south of Thunderbird Road from 51st Avenue to 43rd Avenue) to the main campus of Glendale Community College (located north of Olive Avenue to Mountain View Avenue, between 59th Avenue and 63rd Avenue.) through the provision of an on-street path from the ASU West campus along 47th Avenue in Phoenix south to Mountain View Road and west to the Glendale Community College main campus.
Along the Skunk Creek Wash from the Glendale/Phoenix border at 51st Avenue (north of Union Hills Drive) that extends to Rio Vista Park in the City of Peoria west of 83rd Avenue and north of Thunderbird Road where the wash connects with the New River Bike Trail (see Figure 17).
Along the Arizona Canal Diversion Channel multi-purpose trail (Thunderbird Paseo trail) from Phoenix through Glendale and into Peoria linking with the Skunk Creek Trail. This connection also provides access into the Rio Vista Park and the New River Trail that runs north/south through Peoria and Glendale (Figure 17).
Glendale plans to extend the Grand Canal trail west from SR-101 along approximately the Bethany Home Road alignment to connect with the New River Trail at about 107th Avenue. There are bike facilities that provide access to Midwestern University medical campus located between 57th Avenue and 59th Avenue and south of the Outer Loop Freeway (SR-101). There is also potential for on-street bike lanes along Greenway Rod between Phoenix and Glendale that would provide access to the
International School of Global Management located on the southeast corner of 59th Avenue and Greenway Road.
Along the Grand Canal trail as it crosses Camelback Road at 75th Avenue at the Phoenix/Glendale border. This would provide improved bicycle access to the University of Phoenix stadium where the 2015 Super Bowl game will be held. In addition a number of additional major sporting and other types of events are held both the University of Phoenix football stadium and Jobing.com Hockey Arena complex immediately to the north of the football stadium.
Along the Grand Canal off-road path to the Camelback Ranch sports complex (spring training facility) located west of 107th Avenue and south of Bethany Home Road. This link could also provide connectivity to the New River off-road trail. The cities of Peoria and Glendale have plans to extend the New River off-road trail south from Olive Avenue to Bethany Home Road.
Peoria now allows 10-foot wide vehicle lanes on streets, which has resulted in opportunities to re-stripe many arterial streets with bicycle lanes. Opportunities for facility connectivity with Peoria include:
Extending Happy Valley Road on-street bike lanes west of 67th Avenue into Peoria and connecting to the Phoenix on-street bike lanes to the east.
Connecting Jomax Road west of 67th Avenue (This will be resolved when future development along Jomax Road occurs)
Providing access into the Sonoran Mountain Ranch development in Peoria along Pyramid Peak Road north of Brookhart Way .
The primary connecting routes between Avondale and Phoenix are along 17th Ave at Indian School Road, 14th Drive/Westwind Park at Indian School Road, 111th Avenue at Indian School Road and 107th Avenue from Lower Buckeye to MC-85. Avondale is also planning a multi-use trail along Van Buren from 113th Avenue to 99th Avenue that will have an opportunity to link into Phoenix.
The primary bicycle destinations in Avondale include Estrella Mountain Community college,
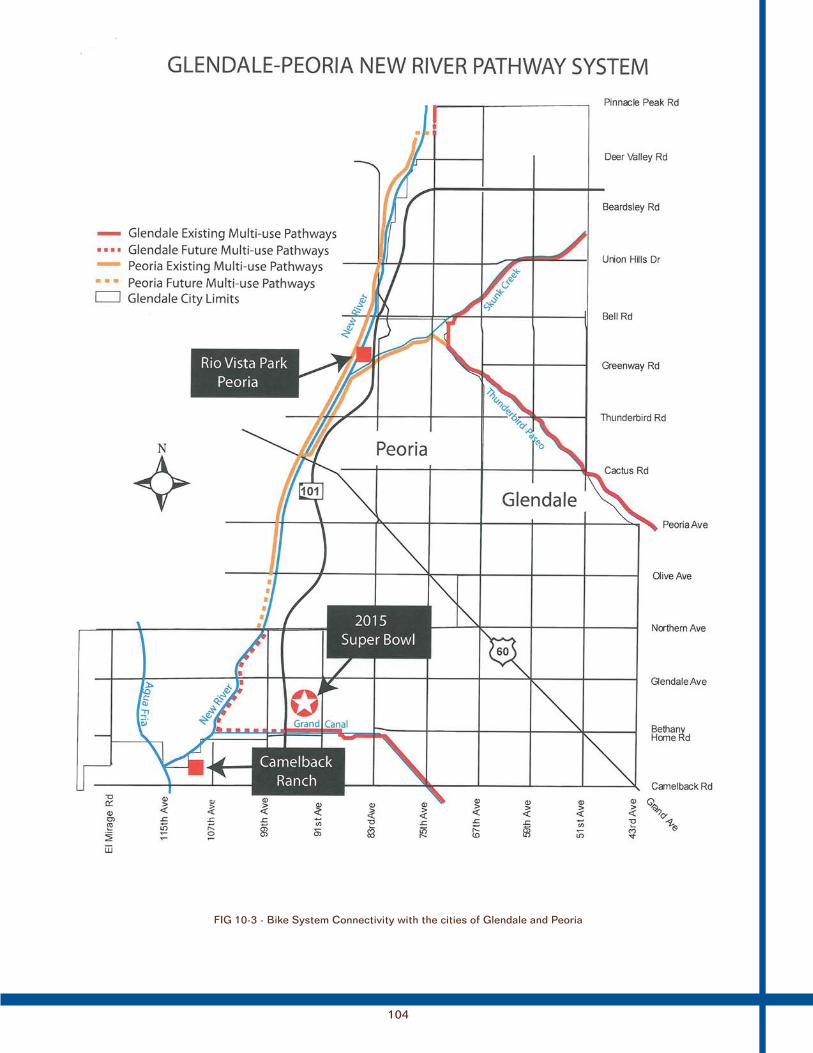
104

105
Westview High School, La Joya Community High School, Agua Fria High School and the Avondale Transit centers.
The primary destinations that Phoenix residents may want to access within the city include Estrella Mountain Community College, Avondale Transit Center and Gila River recreation area.
Avondale residents would most likely want to access the following destinations within Phoenix: Ak-Chin Pavilion (with Loop 101 being a barrier to bicycle access), and future light rail transit stations along I-10 when they are built.
Current barriers to bicycle travel in Avondale include the lack of adequate bicycle accessways, inability to cross the freeways and the lack of paved pathways along the Gila River.
Avondale reports that currently all commercial/industrial developments are required to provide on bike parking space per 50 parking spaces. There is no information provided on requirements for bike parking at residential developments. As with most cities, the Avondale traf c department monitors the on-road system and the off-road system is monitored by their Parks Department.
Missing links exist along the Cave Creek Road bicycle facility from Carefree Highway to Pima Road. These connections will improve bicycle access from Phoenix to the downtowns of Cave Creek and Carefree. Construction of the missing bike facility is scheduled to begin in May 2015.
Scottsdale borders Phoenix to the east and shares on-street and off street bicycle facilities. Major bicycle trails currently in Scottsdale include the Crosscut Canal Path, Arizona Canal Path, Indian Bend Wash Path, Pima Path, Oak Street, Indian School Road, Miller road, Lincoln Drive, McDonald Drive, Scottsdale Road, Pima Road, Sweetwater, Cholla and Roosevelt Street. Key planning considerations include:
Scottsdale on-street bike lanes end at 60th Street (the border with Phoenix).
An off-road paved path along the south side of the Arizona Canal (north of Indian school Road) also ends at the City Limits (60th Street alignment) and should extended west into Phoenix.
Scottsdale has plans to provide on-street bike lanes along McDowell Road and Thomas Road east of the Phoenix city limits. While there are
no city of Phoenix bike lanes planned on Thomas Road, there are on-street bike lanes along McDowell Road through Papago Park from 52nd Street to Galvin Parkway within Phoenix that could connect into Scottsdale. These on-street bike lanes provide access to the Galvin Parkway bike trail and on-street bike lanes and the path along the west side of the Crosscut canal.
There is no paved path along the Arizona Canal and no bike lanes on Indian School Road from Phoenix that will allow a connection to downtown Scottsdale, a popular destination for cyclists.
Scottsdale residents could also more easily access downtown Phoenix using bicycle facilities that could be located along Oak Street, Earll Drive and Osborn Road, but there are barriers in some of the neighborhoods west of the Crosscut Canal that prevent a continuous route into downtown Phoenix.
Tempe borders the southeastern portion of Phoenix. The city plans to launch Bikeshare in the spring of 2014. The major bicycle corridors in Tempe include College Avenue, Crosscut Canal, and Tempe Town Lake/Rio Salado trails. Major destinations include downtown Tempe, Town Lake, ASU main campus, Kiwanis Park and a number of other schools and parks. The primary bicycle routes connecting into Tempe include Washington Street on-street bike lanes, University Drive bike lanes, the Western Canal Multi-user Path near I-10, Town Lake/Rio Salado Multi-use Path near the Grand Canal in Phoenix, and the bike lanes on Warner Road.
Planned routes that will provide connectivity from Tempe to Phoenix include:
A 10-foot wide Rio Salado West multi-use path adjacent to the Rio Salado (Salt River) between Priest Drive and the City of Tempe boundary with Phoenix just east of SR-143.
A bike/pedestrian bridge over I-10 at Alameda. This bridge is unfunded at this time.
Planning considerations for enhanced connectivity between Phoenix and Tempe include:
Access to Tempe Town Lake via the Grand Canal (the Grand Canal is not a multi-use, lit path), Western Canal path (I-10 freeway is currently a barrier) and Alameda Drive (I-10 is a barrier).
Access to Sky Harbor Airport via the Grand Canal (this would provide an additional option to the Washington bike lanes to the Sky train at 44th Street).
Access to downtown Phoenix and the restaurants along the Grand Canal path via the Grand Canal.
106
Chandler shares a 2.5 mile border with Phoenix from approximately the Knox Road alignment to the Pecos Road alignment. There are two major arterials in Chandler that extend into Phoenix; Ray Road and Chandler Boulevard. Both of these have on-street bike lanes in the city of Chandler. The Ray Road bike lanes extend to the ADOT right of way, but do not cross I-10 and there are no bike lanes on the Phoenix (west) side of the freeway. Bike lanes on Chandler Boulevard terminate at 54th Street, ¼ miles east of I-10. The bike lanes do not extend all the way to the ADOT ROW and there are no on-street bike lanes in Phoenix west of I-10.
(ADOT)ADOT manages and maintains Interstates 10 and 17 and the existing and planned Loop 101, 202 and 303 freeways. Portions of the ADOT system were constructed prior to a time when bicycle facilities were considered, and as a result, some ADOT facilities create barriers to bicycle connectivity. In later years, ADOT included bicycle crossings on some of its facilities such as the Maryland bridge over I-17, and bicycle/pedestrian bridges over SR-51 at Grovers Avenue, Nisbet Road, Paradise Lane, Oak Street, Campbell Avenue and at the Mercury Mine School (approximately 29th Street alignment); and underpasses along the Arizona Canal at I-17 and under SR-51 at Thunderbird Road, Maryland Avenue, Arizona Canal, and the Grand Canal to name a few. However, funding constraints continue to prevent crossings at some key locations.
The planned Southwest portion of SR 101 west of I-10 around South Mountain will be constructed along the existing Pecos Road corridor. This corridor is heavily used by bicyclists and accommodates a major bicycle sporting event. Currently, ADOT has no plans to build a bike facility in conjunction with this freeway unless it is requested by Phoenix and Phoenix is willing to pay for the added cost of a bike facility. At this time, the city has not requested a bicycle facility along SR 101 Pecos Road alignment.
Bicycle crossings on many of the ADOT interchanges throughout Phoenix are needed. These include Happy Valley Road at I-17 and as Deer Valley and Pinnacle Peak Road at I-17.
The Maricopa Association of Governments facilitates planning and construction of bicycle facilities throughout the region through Transportation Alternatives Funds, and other programs offered through the Bicycle and Pedestrian Working Group. The Maricopa Association of Governments (MAG) hosts a regional bikeways map that shows existing, locally-designated bicycle facilities at http://geo.azmag.gov/maps/bikemap/. This map was produced under the direction of the MAG Regional Bicycle Task Force with funding provided by the Federal Highway Administration.
RECOMMENDATIONSGOAL:
The City of Phoenix will be connected to bikeways, shared use paths, and trails within Phoenix and in adjoining communities to provide longer-distance recreation and commuting opportunities. This mix of facility types will provide a variety of comfortable travel options for all ages, abilities, and travel purposes through the promotion of loops and links.
STRATEGY: Use the off street network to complement and
supplement the on-street network.
ACTION: Implement projects listed in Appendices G-I: Off
Road Priority Projects along the following off-street corridors within Tier I – III projects. - Grand Canal- Indian Bend Wash- Cave Creek Wash - Arizona Canal - Highline Canal - Western Canal - CAP Canal
Work with ADOT to ensure there is a bicycle path along the SR 202 Loop along the Pecos Road alignment.
STRATEGY: Enhance the safety of off-street corridors at their intersections with streets and other motorized facilities such as railroads and freeways.

107
ACTION: Give rst priority to street crossing enhancement
projects. Work with ADOT to enhance bicycle facility
crossings of freeways and state roads. In particular, focus include Happy Valley Road at I-17 and Deer Valley and Pinnacle Peak Road at I-17 as priority projects.
STRATEGY: Enhance the functionality of the Phoenix bicycle
system by connecting to bicycle facilities that provide regional access.
ACTION: Work with the City of Tempe to provide access
along the Grand Canal to:
- Tempe Town Lake (also using Alameda Drive)
- Sky Harbor Airport- Downtown Phoenix- Planned developments along the Grand
Canal
Work with the City of Scottsdale to provide continuous bicycle facilities that link Phoenix with bicycle facilities within City of Scottsdale that terminate at the city of Phoenix border including:
- On-street bike lanes at the borders at the Phoenix at 60th street alignment;
- An off-road paved path along the south side of the Arizona Canal (north of Indian school Road at 60th Street alignment).
- Planned on-street bike lanes along McDowell Road.
- Along the Arizona Canal and on Indian School Road from Phoenix that provide a connection to downtown Scottsdale.
- Along Oak Street, Earll Drive and Osborn Road providing a continuous route into downtown Phoenix.
Work with the City of Peoria to provide continuous bicycle facilities that link Phoenix with bicycle facilities within City of Peoria including:
- Extend Happy Valley Road on-street bike lanes west of 67th Avenue into Peoria and connecting to the Phoenix on-street bike lanes to the east.
- Connect Jomax Road west of 67th Avenue (This will be resolved when future development along Jomax Road occurs)
- Providing access into the Sonoran Mountain Ranch development in Peoria along Pyramid Peak Road north of Brookhart Way .
On Street Routes:
- To connect the ASU West campus (located south of Thunderbird Road from 51st Avenue to 43rd Avenue) to the main campus of Glendale Community College (located north of Olive Avenue to Mountain View Avenue, between 59th Avenue and 63rd Avenue.) through the provision of an on-street path from the ASU West campus along 47th Avenue in Phoenix south to Mountain View Road and west to the Glendale Community College main campus.
Work with the City of Glendale to provide continuous bicycle facilities that link Phoenix with bicycle facilities within City of Glendale including:
Along the Skunk Creek Wash from the Glendale/Phoenix border at 51st Avenue (north of Union Hills Drive) extending to Rio Vista Park in the City of Peoria west of 83rd Avenue and north of Thunderbird Road where the wash connects with the New River Bike Trail (see Figure 17).
Along the Arizona Canal Diversion Channel multi-purpose trail (Thunderbird Paseo trail) from Phoenix through Glendale and into Peoria linking with the Skunk Creek Trail. This connection also provides access into the Rio Vista Park and the New River Trail that runs north/south through Peoria and Glendale (Figure 17).
Along Greenway Road between Phoenix and Glendale to provide access to the International School of Global Management located on the southeast corner of 59th Avenue and Greenway Road.
Along the Grand Canal trail as it crosses Camelback Road at 75th Avenue at the Phoenix/Glendale border.
Along the Grand Canal off-road path to the Camelback Ranch sports complex (spring training facility) located west of 107th Avenue and south of Bethany Home Road.

THIS PAGE IS INTENTIONALLY LEFT BLANK

MAKING CONNECTIONS
109
GOAL:
Commuting
by public
transportation
will be a
seamless
choice for
cyclists.
Completing
last 2.5 miles
of a transit
trip will
be easy to
accomplish
on a bike
as modes
will be fully
integrated.
Valley Metro provides eco-friendly public transit options to residents of greater Phoenix and Maricopa County including the planning and operations of a regional bus system and the development and operations of light rail. In Fiscal Year 2013, total ridership for the system was 73.4 million passengers, which set a new record for bus and light rail boardings. The rst 20 miles of light rail opened December 2008. Seven light rail extensions are planned or are under construction that will create a 60-mile system by 2034.
Valley Metro recognizes that public transit operates as a key part of the region’s multimodal transportation system, working in tandem with walking, bicycling, and driving modes to provide commuters with multiple, equally easy transportation choices.
The rst and last miles are terms used to describe a common problem in urban areas where most of the geographic area of a city lies beyond an easy walking distance to a transit station. Therefore, people wishing to ride light rail must combine modes and use local bus service, bikes and/or cars to reach their nal destinations.
C H A P T E R
11

110
Since the national average bicycle trip length is 2.5 miles, this study expands the targeted “last mile” transit catchment area and looks for ways to more safely accommodate bicycle trips within 2.5 miles of light rail stations and transfer centers, as well provide new facilities that may encourage people to ride who may not otherwise consider biking.
Valley Metro offers several programs to promote bicycling, and the agency is working with the City of Phoenix to enhance last-mile access for cyclists, as described in detail in this chapter. Highlights of these multimodal initiatives include:
All Valley Metro buses are equipped with a two-bike or three-bike rack located on the front of the bus. Racks are available on a rst-come, rst-serve basis. Valley Metro bike ridership for FY2011-12 showed that 13 bus routes had more than 20,000 bike boardings, and bike boardings on 14 routes represented more than 3% of total passengers.
Bike-transit integration is an important contributor to ridership along light rail. On-board storage hangers for 4 bikes are located in the center section of each vehicle. Standing with a bicycle is also allowed as long train aisles and doorways are not blocked. Allowing bikes on trains is so popular that is it starting to create capacity and vehicle circulation constraints during peak hours and special events. Of Metro riders surveyed in 2011, over 9% combined their transit trips with bicycling, with 72% of cyclists biking both to and from light rail.
Most transit centers and light rail stations have open air bike stands (bike racks) and/or enclosed bicycle lockers. Bike racks are provided at Valley Metro rail park-and-rides, rail station platforms, and several bus stops. Bicycle lockers are provided at Central Station in Downtown Phoenix, and at the Phoenix Skytrain Station at 44th and Washington. Existing capacity at station areas along the Central Phoenix/East Valley light rail alignment currently provides parking for 536 bicycles.
Valley Metro actively encourages bicycling to transit through a variety of programs including Valley Bike Month, Bike to Work and School Day, Bike to the Ballpark, a Portable Bike Rack Loan Program for special events, Bicycle Commuting 101 classes, and distribution of educational materials on bike safety and sharing the road.
A new bike share program will be launched in 2014. Named “Grid Bikes” after Phoenix’s well-known street grid system, the program will be implemented and operated by CycleHop. Valley Metro and the City of Phoenix are working with CycleHop to nalize locations for bicycle hubs, where bikes may be rented by the hour. Each Grid Bike will be equipped with a solar-powered, GPS-enabled locking mechanism and be remotely monitored. Plans are to have 500 bikes in the downtown Phoenix area by early 2015.
Of the 15 transit centers in Maricopa County, there are nine in the City of Phoenix. A transit center is a facility where transit vehicles converge, enabling passengers to transfer among routes and services. Some transit centers also have Park-and-Ride facilities. Transit centers are generally located off the street and provide passengers with a shaded or enclosed waiting area, seats, drinking fountains and transit information. Transit centers in the City of Phoenix with bike racks1 include Central Station, Desert Sky, Ed Pastor, Metro Center, Paradise Valley Mall, and Sunnyslope. The number of bicycle parking spaces available at transit centers and park-and-rides is not currently available. There are 22 bicycle lockers available at Central Station that are available for use between 5 am and 10 pm seven days a week. Increased misuse of bike lockers for storage or personal use is leading to consideration of alternatives such as bike lids.
1 - As listed under amenities at http://www.valleymetro.org/getting_on_board/transit_centers; accessed on October 1, 2013
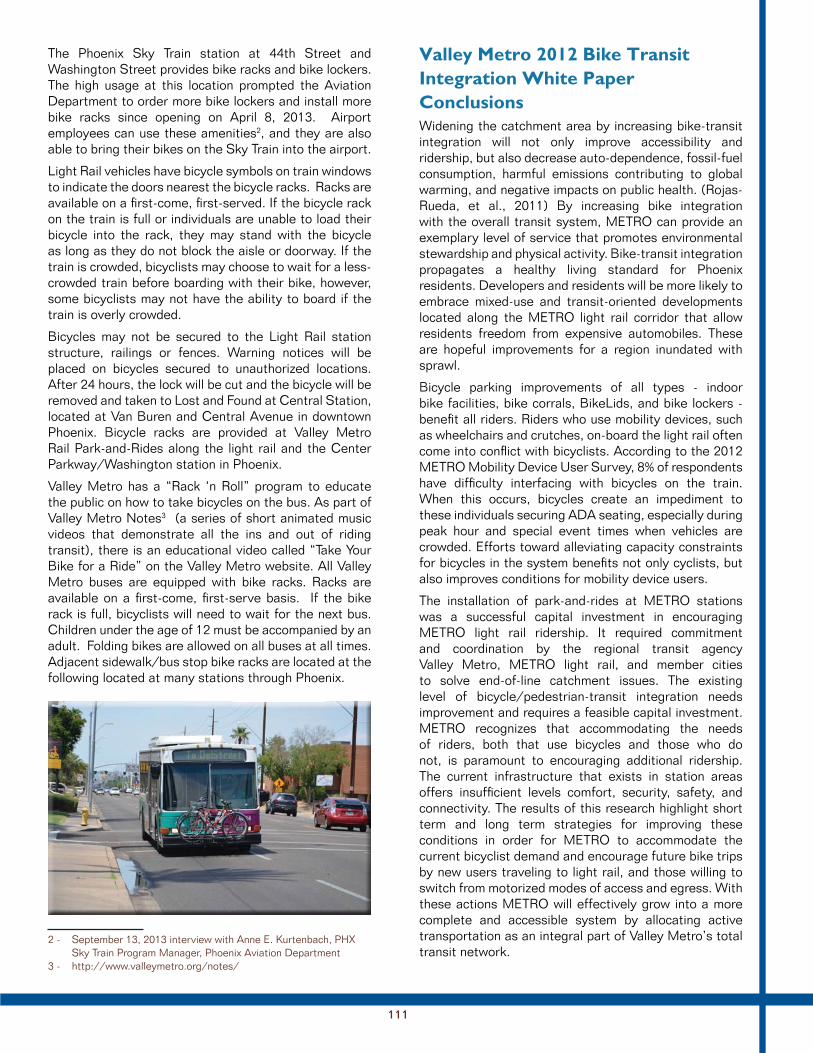
111
The Phoenix Sky Train station at 44th Street and Washington Street provides bike racks and bike lockers. The high usage at this location prompted the Aviation Department to order more bike lockers and install more bike racks since opening on April 8, 2013. Airport employees can use these amenities2, and they are also able to bring their bikes on the Sky Train into the airport.
Light Rail vehicles have bicycle symbols on train windows to indicate the doors nearest the bicycle racks. Racks are available on a rst-come, rst-served. If the bicycle rack on the train is full or individuals are unable to load their bicycle into the rack, they may stand with the bicycle as long as they do not block the aisle or doorway. If the train is crowded, bicyclists may choose to wait for a less-crowded train before boarding with their bike, however, some bicyclists may not have the ability to board if the train is overly crowded.
Bicycles may not be secured to the Light Rail station structure, railings or fences. Warning notices will be placed on bicycles secured to unauthorized locations. After 24 hours, the lock will be cut and the bicycle will be removed and taken to Lost and Found at Central Station, located at Van Buren and Central Avenue in downtown Phoenix. Bicycle racks are provided at Valley Metro Rail Park-and-Rides along the light rail and the Center Parkway/Washington station in Phoenix.
Valley Metro has a “Rack ‘n Roll” program to educate the public on how to take bicycles on the bus. As part of Valley Metro Notes3 (a series of short animated music videos that demonstrate all the ins and out of riding transit), there is an educational video called “Take Your Bike for a Ride” on the Valley Metro website. All Valley Metro buses are equipped with bike racks. Racks are available on a rst-come, rst-serve basis. If the bike rack is full, bicyclists will need to wait for the next bus. Children under the age of 12 must be accompanied by an adult. Folding bikes are allowed on all buses at all times. Adjacent sidewalk/bus stop bike racks are located at the following located at many stations through Phoenix.
2 - September 13, 2013 interview with Anne E. Kurtenbach, PHX Sky Train Program Manager, Phoenix Aviation Department
3 - http://www.valleymetro.org/notes/
Widening the catchment area by increasing bike-transit integration will not only improve accessibility and ridership, but also decrease auto-dependence, fossil-fuel consumption, harmful emissions contributing to global warming, and negative impacts on public health. (Rojas-Rueda, et al., 2011) By increasing bike integration with the overall transit system, METRO can provide an exemplary level of service that promotes environmental stewardship and physical activity. Bike-transit integration propagates a healthy living standard for Phoenix residents. Developers and residents will be more likely to embrace mixed-use and transit-oriented developments located along the METRO light rail corridor that allow residents freedom from expensive automobiles. These are hopeful improvements for a region inundated with sprawl.
Bicycle parking improvements of all types - indoor bike facilities, bike corrals, BikeLids, and bike lockers - bene t all riders. Riders who use mobility devices, such as wheelchairs and crutches, on-board the light rail often come into con ict with bicyclists. According to the 2012 METRO Mobility Device User Survey, 8% of respondents have dif culty interfacing with bicycles on the train. When this occurs, bicycles create an impediment to these individuals securing ADA seating, especially during peak hour and special event times when vehicles are crowded. Efforts toward alleviating capacity constraints for bicycles in the system bene ts not only cyclists, but also improves conditions for mobility device users.
The installation of park-and-rides at METRO stations was a successful capital investment in encouraging METRO light rail ridership. It required commitment and coordination by the regional transit agency Valley Metro, METRO light rail, and member cities to solve end-of-line catchment issues. The existing level of bicycle/pedestrian-transit integration needs improvement and requires a feasible capital investment. METRO recognizes that accommodating the needs of riders, both that use bicycles and those who do not, is paramount to encouraging additional ridership. The current infrastructure that exists in station areas offers insuf cient levels comfort, security, safety, and connectivity. The results of this research highlight short term and long term strategies for improving these conditions in order for METRO to accommodate the current bicyclist demand and encourage future bike trips by new users traveling to light rail, and those willing to switch from motorized modes of access and egress. With these actions METRO will effectively grow into a more complete and accessible system by allocating active transportation as an integral part of Valley Metro’s total transit network.

112
An overview of recommendations from the Valley Metro 2012 Bike Transit Integration White Paper Recommendations is provided in Table 11-1.
Bus routes were reviewed with more than 20,000 bike boardings or where bike boardings represented more than 3% of total passenger boardings. Table 11-2 summarizes the ridership data for these 24 routes. The general cross section of the roadway and the existence of bike lanes for these routes are provided. Except for the Union Hills Drive, 40th Street, Southern Avenue, and south Central Avenue routes, bike lane facilities do not exist for long distances on these routes.
RECOMMENDATIONSGOAL:
Commuting by public transportation will be a seamless and ef cient choice for cyclists. Completing the rst and last 2.5 miles of a transit trip will be easy to accomplish on a bike as modes will be fully integrated.
STRATEGY: Encourage bike integration with the overall
transit system.
Goal Solution
Short Term: Alleviate the overcrowding of bikes on light rail vehicles
Add secure bike parking facilities (i.e. BikeLids and bike lockers) to stations with the highest levels of bike access.
Vehicle modi cation to increase on-board bicycle capacity Create bike-use policies, rules of conduct, & rider-guide. Station info posters sharing bike policies, best practices, & bike amenities. Larger bicycle decals on vehicles and station platform signage instructing bikers where to board.
Vehicle signage placed on the outside of vehicle wraps. Bike compartment viewing portal (visible through vehicle wrap)
Long Term: Encourage additional bike ridership
Provide secure bike parking at all stations. Offer bike-sharing near popular bicyclist destinations along the light rail corridor Improve station connectivity to bikeways Improve bike infrastructure in and around stations Increase security presence (personnel, cameras, lighting) at stations/park-and-rides.
Educate riders traveling to Park-and-rides about the health, environmental, and cost bene ts of biking to stations and destinations.
At major transit stations, put practice bicycle racks for riders to practice, in a low-stress setting, putting bicycles onto bus racks or light rail racks
New light rail and bus rolling stock should have minimum bicycle position requirements
ACTION: Encourage Valley Metro to provide at least 3 or
4 capacity bike racks on all buses Encourage Valley Metro to provide more than 4
bike spaces on LRT cars (increase as new rolling stock is purchased and through retro t)
Encourage Valley Metro to provide practice racks for busses/LRT
Identify and build bike facilities that support and connect to transit. Bicyclists should have equal access to public transit that is offered to pedestrians.
Partner with Valley Metro to provide repair stations at critical light rail stations.
Provide bike parking and repair stations in City -owned parking garages.

113
Route NamePassengers(all days)
Bikes(all days)
%(all days) ADT Bike Lane Coverages
19th Ave 2,562,634 69,244 2.70% 21,583 Few Bike Lanes, existing only on southernmost portion of route
Indian School 2,512,145 54,346 2.16% 39,843 No Bike Lanes (except 23rd Ave to 19th Ave)
35th Ave 1,948,950 52,202 2.68% 26,163 Few Bike Lanes, existing north of Bell Road
Thomas Road 2,756,478 47,675 1.73% 31,665 No Bike Lanes
McDowell 2,102,721 45,890 2.18% 28,491 Few Bike Lanes
Glendale -24th Street
1,694,495 40,116 2.37% 32,064 No Bike Lanes
16th Street 1,429,856 38,565 2.70% 33,427 Few Bike Lanes
Central 1,482,845 38,165 2.57% 22,486 Few bike lanes north of downtown, south of I-17 bike lanes are present except from Southern to Baseline
Van Buren 1,518,478 37,723 2.48% 20,826 No Bike Lanes
7th Street 1,371,182 36,823 2.69% 33,997 Existing on south 1/3 of route
44th Street 698,117 23,986 3.44% 34,644 Few Bike Lanes
Bell 632,610 21,295 3.37% 34,040 No Bike Lanes
Union Hills 485,886 20,096 4.14% 22,496 Bike lanes along almost entire route in Phoenix
Southern 614,650 18,647 3.03% 27,947 Bike lanes along almost entire route in Phoenix
Broadway 482,292 15,038 3.12% 24,347 No Bike Lanes
Thunderbird 347,738 12,216 3.51% 29,853 Few Bike Lanes
Buckeye 341,161 11,290 3.31% 32,368 No Bike Lanes
Greenway 311,853 11,142 3.57% 28,690 Some bike lanes
40th Street 188,715 6,632 3.51% 11,847 Bike lanes along entire route
University 126,716 5,183 4.09% 16,887 No Bike Lanes
Priest Drive 116,688 4,752 4.07% 12,147 No Bike Lanes
Cactus -39th Ave
54,362 1,841 3.39% 30,754 No Bike Lanes
RAPID 19,098 732 3.83% 181,370 No Bike Lanes
RAPID 2,539 208 8.19% - No Bike Lanes

THIS PAGE IS INTENTIONALLY LEFT BLANK

AASHTO American Association of State Highway Transportation Of cials
Arterial Street A street that provides for moderately long distance traf c movement within Phoenix or between Phoenix and adjacent cities. Moderate service is provided to abutting land. Access is controlled through frontage roads, raised medians and the spacing and location of driveways and intersections. Opposing traf c ows are separated by a raised median or a continuous left turn lane.
ADOT – Arizona Department of Transportation
ADT - Average Daily Traf c – The average 24 hour volume of traf c, being the total volume during a stated period divided by the number of days in that period. Normally this would be periodic daily traf c volumes over several days, not adjusted for days of the week or seasons of the year. For two-way streets, the ADT includes both directions of travel
ARS – Arizona Revised Statutes (State law)
Bicycle – A device, including a racing wheelchair, that is propelled by human power and on which a person may ride and that has either: (a) Two tandem wheels, either of which is more than sixteen inches in diameter. (b) Three wheels in contact with the ground, any of which is more than sixteen inches in diameter (ARS 28-101.6)
Bicycle Boulevard – A street segment or series of contiguous street segments, that has been modi ed to accommodate through bicycle traf c and minimize through motor vehicle traf c
Bicycle Detector – A device used for determining the presence or passage of bicyclists
Bicycle Facilities – A general term denoting improvements and provisions that accommodate or encourage bicycling, including parking and storage facilities, and shared roadways not speci cally de ned for bicycle use.
Bicycle Lane – A portion of a roadway that has been designated for preferential or exclusive use by bicyclist by pavement markings and, if used, signs. In Phoenix BIKE LANE signs will always be used to designate bike lanes
Bicycle Locker– A secure, lockable container used for individual bike storage
Bicycle Network – A system of bikeways designate by the jurisdiction having authority. This system may include bike lanes, bicycle routes, shared use paths, and other identi able bicycle facilities.
Bikeway – A generic term for any road, street, path or way that in some manner is speci cally designated for bicycle travel, regardless of whether such facilities are designated for the exclusive use of bicycles or are to be shared with other transportation modes.
Bike HAWK – A pedestrian hybrid beacon (PHB) that has been modi ed to accommodate bicycle traf c along with pedestrians
Buffer-Separated Lane – A preferential lane or other special purpose lane that is separated from the adjacent general-purpose lanes(s) by a pattern of standard longitudinal pavement markings that is wider than a normal or wide lane marking. The buffer area might include rumble strips, textured pavement or channelized devices such as tubular markers or transversable curbs, but does not include a physical barrier.
Bicycle Route – A roadway that is of cially designated and signed as a BIKE ROUTE, but which is open to motor vehicle travel and upon which no bicycle lane is designated (see Shared Roadway)
Collector Street – A street that provides for short distance (less than 3 miles) traf c movement primarily functions to collect and distribute traf c between local streets or high volume traf c generators and arterial streets. Provides direct access to abutting land. Some access may be controlled by raised medians and the spacing and location of intersections and driveways.
Complete Streets – Streets that are designed and operated to enable safe access for all users. People of all ages and abilities are able to safely move along and across streets in a community, regardless of how they are traveling. Complete Streets make it easy to cross the street, walk to shops, and bicycle to work. They allow buses to run on time and make it safe for people to walk to and from train stations. (Source: National Complete Streets Coalition)
Cycle Track – A form of protected bicycle lane
FHWA – Federal Highway Administration, a division of the USDOT
Fixed-Time Operation (Pre-timed Operation) – A type of traf c signal operation in which all signal phases are pre-timed and where no detection is required for any mode.
Full Actuated Operation – A type of traf c signal operation in which all signal phases function on the basis of actuation or detection.
Highway - “Highway” or “Street” is the entire width between the boundary lines of every way if a part of the way is open to the use of the public for purposes of vehicular travel (ARS 28-101.52)
ITE – Institute of Transportation Engineers
LAB – League of American Bicyclists
Local Street – A street that provides for direct access to residential, commercial, industrial or other abutting land, and for local traf c movements and connects to collector and/or major streets.
LRT – Light Rail Transit
MAG – Maricopa Association of Governments
MAP-21 – Moving America Ahead for Progress in the 21st Century the Federal highway bill that was signed into law on July 6, 2012 and became effective October 1, 2012
Major Arterial Street - A street that provides for long distance traf c movement within Phoenix and between Phoenix and other cities. Service to abutting land is limited. Access is controlled through frontage roads, raised medians, and the spacing and location of driveways and intersections. Opposing traf c ows are often separated by a raised median.
Minor Collector Street - A street that provides for short distance (less than 3 miles) traf c movement primarily functions to collect and distribute traf c between local streets and arterial streets. Provides direct access to abutting land. Some access may be controlled and the spacing and location of intersections.
Modal Equity - Providing adequate transportation facilities for all modes (motor vehicle, pedestrian and bicycles), including parking facilities at destinations.
MPH or mph – miles per hour
MUTCD – Manual on Uniform Traf c Control Devices for Streets and Highways, 2009 edition, which was adopted by the State of Arizona with an Arizona Supplement on January 13, 2012.
NACTO – National Organization of City Transportation Of cials
NHTSA – National Highway Traf c Safety Administration
Pedestrian Hybrid Beacon (PHB or HAWK) – A special type of hybrid beacon used to warn and control traf c at an unsignalized location to assist pedestrians in crossing a street or highway at a marked crosswalk
Recumbent Bicycle – A bicycle with pedals at roughly the same level as the seat where the operator is seated in a reclined position with their back supported
Right-of-way – A general term denoting land, property or interest therein, usually in a strip, acquired for or devoted to transportation purposes.
Right-of-Way (Assignment) – The permitting of vehicles and/or pedestrians to proceed in a lawful manner in preference to other vehicles or pedestrians by the display of a sign or signal indications. Per ARS 28-101.46, “Right-of-way” when used within the context of the regulation of the movement of traf c on a highway means the privilege of the immediate use of the highway.
Road User – A vehicle operator, bicyclist or pedestrian, including persons with disabilities, within the highway or on a private road open to the public travel.
Roadway – That portion of the highway that is improved, designed or ordinarily used for vehicular travel, exclusive of the berm or shoulder. If a highway includes two or more separate roadways, roadway refers to any such roadway separately but not to all such roadways collectively (ARS 28-601.22)

Roundabout – A type of circular intersection that provides yield control to all entering vehicles and features channelized approaches and geometry to encourage reduced travel speeds through the circular roadway.
RPTA – Regional Public Transit Authority
Shared-Lane Marking – A pavement marking symbol that indicates an appropriate bicycle positioning in a shared lane
Shared Roadway – A roadway that is of cially designated and signed as a BIKE ROUTE, but which is open to motor vehicle travel and upon which no bicycle lane is designated (see Bicycle Route)
Shared-Use Path – A bikeway outside the traveled way and physically separated from motor vehicle traf c by an open space or barrier and either within the high right-of-way or within an independent right-of-way. Shared-use paths may also be used by pedestrians, skaters, wheelchair users, joggers, and other non-motorized users. Most shared-use paths are designed for two-way travel.
Shoulder – the portion of the roadway contiguous with the traveled way that accommodates stopped vehicles, emergency use, and lateral support of subbase, base and surface courses. Shoulders, where paved, are often used by bicyclists.
Sidewalk – That portion of a street that is between the curb lines or the lateral lines of a roadway and the adjacent property lines and that is intended for the use of pedestrians (ARS 28-601.24)
Sidepath – A shared-use path located immediately adjacent and parallel to a roadway.
Social Equity - The effort to provide bicycle transportation facilities for all socioeconomic groups and all portions of the community
SRP – Salt River Project, the utility company that owns and operates the irrigation canals in Phoenix, often used by bicyclists and pedestrians, and provides electric power to a portion of the Phoenix metropolitan area.
Traf c – Pedestrians, ridden or herded animals, vehicles and other conveyances either singly or together while using a highway for purposes of travel (ARS 28-601.28)
Traveled Way – The portion of the roadway for the movement of vehicles, exclusive of the shoulders, berms, sidewalks and parking lanes.
Unpaved Path – Path not surfaced with a hard, durable surface such as asphalt or Portland cement concrete.
USDOT – United States Department of Transportation
Vehicle – A device in, on, or by which a person or property is or may be transported or drawn on a public highway, excluding devices moved by human power or used exclusively on stationary rails or tracks (ARS 28-101.57)
Valley Metro – The regional transit agency in the Valley that began on March 1, 2012, consisting of two distinct transit systems: Regional Public Transportation Authority (RPTA) and Valley Metro Rail.
VPH or vph – vehicles per hour

THIS PAGE IS INTENTIONALLY LEFT BLANK