comprehensive housing market analysis for phoenix … · comprehensive housing market analysis ......
TRANSCRIPT

C O M P R E H E N S I V E H O U S I N G M A R K E T A N A L Y S I S
Phoenix-Mesa-Scottsdale, Arizona
As of April 1, 2016U.S. Department of Housing and Urban Development Office of Policy Development and Research
Pima
Gila
Pinal
Maricopa
Yavapai
Yuma
Navajo
Coconino
La Paz
Moh
ave
Santa Cruz
Coc
hise
Gra
ham
Mexico
Housing Market Area
The Phoenix-Mesa-Scottsdale Housing Market Area (hereafter, Phoenix HMA) consists of Maricopa and Pinal Counties and is coterminous with the Phoenix-Mesa-Scottsdale, AZ Metropolitan Statistical Area. The principal city of Phoenix is Arizona’s capital and the sixth most populous city in the United States. The HMA accounts for more than two-thirds of the population of the state of Arizona.
Market DetailsEconomic Conditions ............. 2
Population and Households ... 5
Housing Market Trends .......... 7
Data Profile ........................... 12
SummaryEconomy The economy of the Phoenix HMA began improving in 2011, and the rate of growth has exceeded the national rate since 2012. During the 12 months ending March 2016, nonfarm payrolls rose by 63,800 jobs, or 3.4 percent, to 1.93 million. This increase follows an average annual increase of 2.6 percent from 2012 through 2014. The unem-ployment rate as of the 12 months ending March 2016 was 5.1 percent, down from 5.7 percent a year earlier.
Sales MarketThe sales housing market is slightly soft, with an estimated vacancy rate of 2.9 percent, down from 4.3 percent in April 2010. During the 3-year fore -cast period, demand is expected for 72,050 sales units (Table 1). Demand is expected to increase slightly each year during the forecast period, as net in-migration increases moderately. The 3,600 homes under construction and a portion of the 133,000 other vacant units that may reenter the market will satisfy some of the forecast demand.
Rental MarketThe rental housing market is balanced, with an estimated vacancy rate of 6.0 percent compared with 13.8 percent in April 2010. The apartment market is also currently balanced, with a vacancy rate of 4.8 percent during the first quarter of 2016, down from the 5.4-percent rate a year ago (Reis, Inc.). During the 3-year forecast period, demand is expected for 39,150 rental units (Table 1). The 3,600 units currently under con-struction and 7,650 units in planning will meet a portion of that demand.
Table 1.HousingDemandinthePhoenixHMA*DuringtheForecastPeriod
PhoenixHMA*
SalesUnits
RentalUnits
Total demand 72,050 39,150
Under construction 3,600 3,600
*Phoenix-Mesa-Scottsdale HMA.Notes: Total demand represents estimated production necessary to achieve a balanced market at the end of the forecast period. Units under construction as of April 1, 2016. A portion of the estimated 133,000 other vacant units in the HMA will likely satisfy some of the forecast demand. Sales demand includes an estimated demand for 1,000 mobile homes. The forecast period is April 1, 2016, to April 1, 2019.Source: Estimates by analyst

Ph
oe
nix
-Me
sa
-Sc
ott
sd
ale
, A
Z •
CO
MP
RE
HE
NS
IVE
HO
US
ING
MA
RK
ET
AN
ALY
SIS
2Economic Conditions
Economic conditions in the Phoenix HMA have recovered
from the effects of the most recent national recession, and job growth since 2011 has outstripped growth in the nation. Nonfarm payroll growth averaged 2.6 percent annually from 2012 through 2014, higher than the national rate of 1.6 percent. During the 12 months ending March 2016, nonfarm payrolls in the HMA increased by 63,800 jobs, or 3.4 percent, to an average of 1.93 million jobs (Table 2). The recent job gains are in sharp con-trast to annual declines of 4.1 percent from 2008 through 2010. Before the
most recent economic downturn, nonfarm payrolls increased by an average of 74,100 jobs, or 4.3 percent, annually from 2004 to 2007. Employ-ment gains during that period were fueled by the in-migration of Cali-fornians and Canadians who were attracted by the HMA’s relatively affordable housing options. During that period, the wholesale and retail trade sector, the education and health services sector, and the construction subsector added the greatest number of jobs, at the respective averages of 13,500, 11,000, and 9,975 jobs, or 4.7, 6.1, and 7.7 percent annually. During the 12 months ending March 2016, employment gains were largest in the education and health services and the professional and business services sec-tors, which grew by 13,500 and 13,400 jobs, or 5.0 and 4.3 percent, respectively. Gains of 4,600 jobs, or 4.6 percent, in the mining, logging, and construction sector during the 12 months ending March 2016 occurred mainly because of increased residential construction of single-family homes. The unem-ployment rate averaged 5.1 percent during the 12 months ending March 2016, down from 5.7 percent a year earlier, as resident employment gains far outstripped labor force increases. Figure 1 shows trends in the labor force, resident employment, and the unemployment rate in the HMA from 2000 through 2015.
Construction employment has been affected by migration trends, the housing market collapse, and the recent national recession. Construc-tion employment doubled during the 1990s because of high levels of net in-migration, which increased the demand for housing. Continued strong net in-migration from 2000 through 2006 supported ongoing
Table 2. 12-Month Average Nonfarm Payroll Jobs in the Phoenix HMA,* by Sector
12 Months Ending Absolute Change
Percent ChangeMarch 2015 March 2016
Total nonfarm payroll jobs 1,866,500 1,930,300 63,800 3.4Goods-producing sectors 217,700 224,000 6,300 2.9
Mining, logging, & construction 99,200 103,800 4,600 4.6Manufacturing 118,500 120,200 1,700 1.4
Service-providing sectors 1,648,800 1,706,800 58,000 3.5Wholesale & retail trade 300,700 311,300 10,600 3.5Transportation & utilities 66,500 69,300 2,800 4.2Information 35,400 37,200 1,800 5.1Financial activities 162,300 169,400 7,100 4.4Professional & business services 313,300 326,700 13,400 4.3Education & health services 271,700 285,200 13,500 5.0Leisure & hospitality 201,300 209,300 8,000 4.0Other services 64,300 65,600 1,300 2.0Government 233,400 232,900 – 500 – 0.2
*Phoenix-Mesa-Scottsdale HMA.Notes: Numbers may not add to totals because of rounding. Based on 12-month averages through March 2015 and March 2016. Source: U.S. Bureau of Labor Statistics
Figure 1. Trends in Labor Force, Resident Employment, and Unemployment Rate in the PhoenixHMA,* 2000 Through 2015
Une
mpl
oym
ent r
ate
Labo
r fo
rce
and
resi
dent
em
ploy
men
t 2,220,000
2,020,000
1,820,000
1,620,000
1,420,000
2000
2002
2004
Labor force Resident employment Unemployment rate
10.0
8.0
6.0
4.0
2.0
0.0
2006
2001
2003
2005
2007
2009
2010
2008
2012
2013
2015
2014
2011
*Phoenix-Mesa-Scottsdale HMA.Source: U.S. Bureau of Labor Statistics
Ph
oe
nix
-Me
sa
-Sc
ott
sd
ale
, A
Z •
CO
MP
RE
HE
NS
IVE
HO
US
ING
MA
RK
ET
AN
ALY
SIS
3
construction activity, and subsector employment rose by nearly 8 percent annually to a peak of 179,900 jobs in 2006. The housing market collapse and the national recession of the late 2000s resulted in net out-migration and declining construction employment. From 2007 through 2010, nonfarm payrolls declined in nearly every sector, but the greatest decrease was in the construction subsector, which lost an average of 29,000 jobs, or 21.4 percent, annually. Construction job losses accounted for 38 percent of the total job losses in the HMA, as residential housing and commercial building activity declined significantly. Following a low of 82,400 construction jobs during 2010, subsector employment began to mod-erately increase. From 2010 through 2014, construction employment increased by 3,250 jobs, or 3.9 per-cent, annually, to 95,400 jobs. During that period, residential construction permit activity averaged 23,950 units annually, about one-fourth the aver-age of 92,600 units permitted in the HMA annually from 2000 through 2006. Stronger net in-migration and economic conditions increased the demand for housing during the 12 months ending March 2016, and the growth rate of construction
employment rose. During that period, construction subsector employment rose by 4,700 jobs, or 4.9 percent, to 100,500 jobs. Nonresidential construction is also supporting job growth in the subsector. Projects under way or expected to begin in 2016 include Phoenix Children’s Hospital’s new Emergency Depart-ment and Level 1 Pediatric Trauma Center and the expansion of Arizona State University’s 193,000-square-foot Biodesign Institute. Those projects and continued net in-migration and job growth are expected to support ongoing residential and nonresiden-tial construction job gains during the next 3 years.
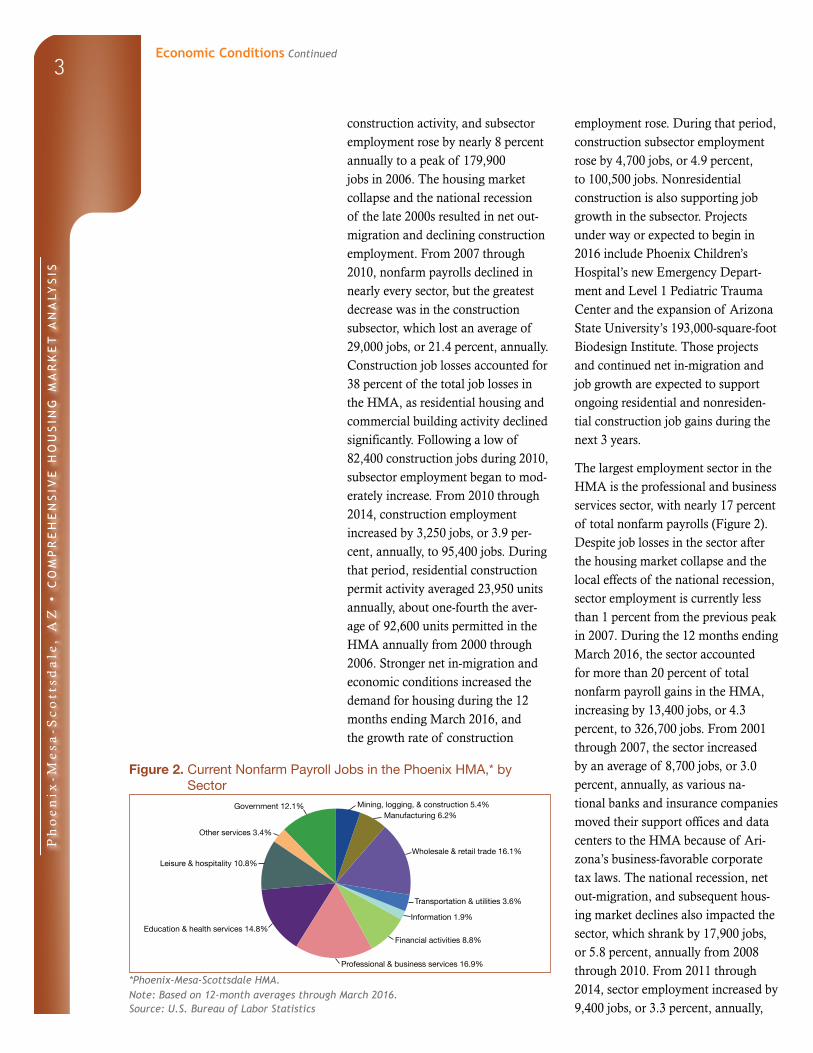
The largest employment sector in the HMA is the professional and business services sector, with nearly 17 percent of total nonfarm payrolls (Figure 2). Despite job losses in the sector after the housing market collapse and the local effects of the national recession, sector employment is currently less than 1 percent from the previous peak in 2007. During the 12 months ending March 2016, the sector accounted for more than 20 percent of total nonfarm payroll gains in the HMA, increasing by 13,400 jobs, or 4.3 percent, to 326,700 jobs. From 2001 through 2007, the sector increased by an average of 8,700 jobs, or 3.0 percent, annually, as various na-tional banks and insurance companies moved their support offices and data centers to the HMA because of Ari-zona’s business-favorable corporate tax laws. The national recession, net out-migration, and subsequent hous-ing market declines also impacted the sector, which shrank by 17,900 jobs, or 5.8 percent, annually from 2008 through 2010. From 2011 through 2014, sector employment increased by 9,400 jobs, or 3.3 percent, annually,
Figure 2.CurrentNonfarmPayrollJobsinthePhoenixHMA,*bySector
Government12.1%
Leisure&hospitality10.8%
Otherservices3.4%
Education&healthservices14.8%
Professional&businessservices16.9%
Wholesale&retailtrade16.1%
Manufacturing6.2%Mining,logging,&construction5.4%
Information1.9%
Transportation&utilities3.6%
Financialactivities8.8%
*Phoenix-Mesa-Scottsdale HMA.Note: Based on 12-month averages through March 2016. Source: U.S. Bureau of Labor Statistics
Economic Conditions Continued

Ph
oe
nix
-Me
sa
-Sc
ott
sd
ale
, A
Z •
CO
MP
RE
HE
NS
IVE
HO
US
ING
MA
RK
ET
AN
ALY
SIS
4
as overall economic conditions im-proved. American Traffic Solutions Fleet Services, a toll transaction and traffic safety company, recently relocated 464 employees to its new headquarters in Mesa. The sector is expected to continue to grow during the next 3 years, as companies continue to expand in the HMA. Apple, Inc. announced that it would be adding 300 to 500 more employees than originally planned to staff their new data center currently under construc-tion in the HMA.
The education and health services sector is the third largest payroll sector and has had the largest increase since 2000, primarily because of gains in the health services subsector (Fig-ure 3). The population of people age 62 years and older has increased since 2000, adding to increased demand for health services. During the 12 months ending March 2016, the education and health services sector added the most jobs, growing by 13,500 jobs, or 5.0 percent, to 285,200 jobs. The
sector includes 2 of the 10 largest employers in the HMA (Table 3). The sector is expected to continue to grow during the 3-year forecast period partly because of increased demand for health services from continued net in-migration. Phoenix Children’s Hospital broke ground in December 2015 on a $60 million expansion that will include a new emergency department and a pediatric trauma center. That project is in addition to the recent opening of the ninth floor of the hospital’s 11-story patient tower, which added 48 beds to the existing 385 beds, making the facility the sixth largest children’s hospital in the United States.
During the next 3 years, nonfarm pay-rolls in the HMA are expected to grow by 45,900 jobs annually, or 2.4 percent. The education and health services sector and the construction subsector are expected to contribute most of that growth during the forecast period. Abrazo Community Health Network announced that it would be adding 450
Figure 3. Sector Growth in the Phoenix HMA,* Percentage Change, 2000 to Current
Total nonfarm payroll jobs
Goods-producing sectors
Mining, logging, & construction
Manufacturing
Service-providing sectors
Information
Financial activities
Professional & business services
Education & health services
Government
Other services
Leisure & hospitality
Transportation & utilities
Wholesale & retail trade
10 20 30 40 90 10050 60 70 80– 10 0– 30 – 20 110
*Phoenix-Mesa-Scottsdale HMA.Note: Current is based on 12-month averages through March 2016. Source: U.S. Bureau of Labor Statistics
Economic Conditions Continued

Ph
oe
nix
-Me
sa
-Sc
ott
sd
ale
, A
Z •
CO
MP
RE
HE
NS
IVE
HO
US
ING
MA
RK
ET
AN
ALY
SIS
5
positions, including 180 nurses, at its six Phoenix-area hospitals. Residential construction is expected to increase, including the addition of a 423-unit
apartment project near Arizona State University that is expected to begin construction in May 2016, supporting construction job growth.
Table 3. Major Employers in the Phoenix HMA*
Name of Employer Nonfarm Payroll Sector Number of Employees
State of Arizona Government 49,800Wal-Mart Stores, Inc. Wholesale & retail trade 30,634Banner Health Education & health services 24,825City of Phoenix Government 15,100Wells Fargo & Company Financial activities 13,308Bank of America Financial activities 13,300Maricopa County Government 12,792Arizona State University Government 11,185Apollo Education Group, Inc. Education & health services 11,000JPMorgan Chase & Co. Financial activities 10,600
*Phoenix-Mesa-Scottsdale HMA.Note: Excludes local school districts.Source: The Greater Phoenix Economic Council
Population and Households
The current population of the Phoenix HMA is estimated at
4.54 million, an increase of 58,500, or 1.3 percent, a year since 2010. From 2000 to 2003, population increased 2.8 percent annually and net in-migration averaged 60,250 people annually, accounting for nearly 65 percent of population growth (U.S. Census Bureau, July 1 estimates). During that period, net natural change (resident births minus resident deaths) averaged 33,950 people annually. Population growth was strongest from 2003 to 2006, averaging 3.7 percent, annually as net in-migration surged to an average of 98,400 people, or 72 percent of population growth, and net natural change increased to an average of 38,600 a year. Net in-migration began to slow in 2006, to an average of 54,700 people annually from 2006 to 2008, as the rate of job growth began to moderate. Net natural
change, however, continued to increase during the period, to an average of 44,400 people a year. After the beginning of the national reces-sion in December 2007 and payroll declines in the HMA from 2008 to 2011, population growth slowed to 0.5 percent annually, pulled down by net out-migration of 15,700 people a year and net natural change of 35,900 people a year. As economic conditions began to improve after 2011, popula-tion growth increased, to 66,600 people, or 1.5 percent annually, boosted by net in-migration of 36,950 people a year. Net natural change, however, has continued to decline since 2011, to an average of 29,650 annually, as the population continued to age. The population of those age 62 years and older increased from 12.3 percent of total population in 2010 to 14.2 percent in 2014. During the next 3 years, the population of the HMA is
Economic Conditions Continued

Ph
oe
nix
-Me
sa
-Sc
ott
sd
ale
, A
Z •
CO
MP
RE
HE
NS
IVE
HO
US
ING
MA
RK
ET
AN
ALY
SIS
6
expected to increase by an average of 91,650, or 2.0 percent, a year, to 4.82 million, with less than 50 percent of the growth from net in-migration. Figure 4 shows population and household growth in the HMA, and Figure 5 shows the components of population change in the HMA, from 2000 to the forecast date.
The effects of the national recession in the HMA, coupled with home sales and price declines from overbuilding before the recession, greatly influ-enced household decisions to rent or buy. From 2000 to 2006, owner
households in the HMA increased by 26,750, or 3.0 percent, annually (U.S. Census Bureau survey, 2000 decennial Census, and 2006 American Com-munity Survey [ACS] 1-year data). During that period, the homeowner-ship rate rose slightly, from 68.0 percent to 68.6 percent. The growth in owner households was mirrored by renter households, which grew by 10,500, or 2.6 percent, annually during the period. As economic growth began to slow and demand for homes began to sharply decline, owner households began to decline, falling by an average of 4,450, or 0.5 percent, annually from 2006 to 2013, causing the homeownership rate to decrease from 68.6 percent to 61.0 percent. By comparison, the rate of renter household growth increased, rising by 22,500, or 4.4 percent, annually as foreclosures rose sharply after the national recession. Since 2013, improving economic conditions have led to moderate owner house-hold growth, which averaged 15,400, or 1.6 percent, annually. Rising net in-migration and continued renter household growth encouraged investors to purchase affordable single-family homes, which they offered for rent. Since 2013, renter households have increased by 30,525, or 4.8 percent, annually. Stronger renter household growth and moder-ate owner household growth reduced the homeownership rate to 59.0 percent as of April 1, 2016.
Household growth in the HMA remains below the average growth rate from 2000 to 2010 but has increased since the late 2000s. The number of households in the HMA increased 34,300, or 2.6 percent, a year from 2000 to 2010, to approximately 1.54 million households. Delayed
Figure 4. Population and Household Growth in the Phoenix HMA,* 2000 to Forecast
Population Households
100,000
90,000
80,000
70,000
60,000
50,000
40,000
30,000
20,000
10,000
02000 to 2010 2010 to current Current to forecast
Ave
rage
ann
ual c
hang
e
*Phoenix-Mesa-Scottsdale HMA.Notes: The current date is April 1, 2016. The forecast date is April 1, 2019.Sources: 2000 and 2010—2000 Census and 2010 Census; current and forecast—estimates by analyst
Figure 5. Components of Population Change in the Phoenix HMA,* 2000 to Forecast
70,000
60,000
50,000
40,000
30,000
20,000
10,000
02000 to 2010 2010 to current Current to forecast
Ave
rage
ann
ual c
hang
e
Net natural change Net migration
*Phoenix-Mesa-Scottsdale HMA.Notes: The current date is April 1, 2016. The forecast date is April 1, 2019.Sources: 2000 and 2010—2000 Census and 2010 Census; current and forecast—estimates by analyst
Population and Households Continued

Ph
oe
nix
-Me
sa
-Sc
ott
sd
ale
, A
Z •
CO
MP
RE
HE
NS
IVE
HO
US
ING
MA
RK
ET
AN
ALY
SIS
7
household formation because of the effects of the national recession slowed the increase in households to 23,750, or 1.5 percent, annually since 2010.
Despite foreclosure rates falling well below the national average during the past 3 years, homeownership rates have declined since 2010 because of high numbers of investor purchases of real estate owned (REO) properties and tight lending standards, encourag-ing households to rent. Household growth is expected to average 35,100, or 2.0 percent, annually during the next 3 years, to 1.79 million house-holds. Figure 6 shows the number of households by tenure from 2000 to the current date. Table DP-1 at the end of the report shows additional data.
Figure 6. Number of Households by Tenure in the Phoenix HMA,* 2000 to Current
2000 2010 Current
Renter Owner
1,200,000
1,000,000
800,000
600,000
400,000
200,000
0
*Phoenix-Mesa-Scottsdale HMA.Note: The current date is April 1, 2016. Sources: 2000 and 2010—2000 Census and 2010 Census; current—estimates by analyst
Housing Market Trends
Sales Market
The Phoenix HMA was one of the hardest hit areas in the nation during the housing crisis because of substantial overbuilding in the mid-2000s. Drastically reduced home construction and significant investor purchases of distressed properties (properties with loans 90 or more days delinquent, in foreclosure, or that had transitioned into REO status) have contributed to the absorption of some of the excess inventory. Sales housing market conditions in the HMA are slightly soft, with an estimated 2.9-percent vacancy rate, down from 4.3 percent in April 2010. During the 12 months ending March 2016, 111,300 new and existing single-family homes, town-homes, and condominiums sold, up nearly 11 percent from a year earlier (CoreLogic, Inc., with adjustments
by the analyst). Home sales rose sharply from 124,100 in 2000 to a peak of 227,600 in 2005 before declining precipitously to 87,700 in 2008, or nearly 21 percent annually. By comparison, national home sales declined 18 percent annually during that period. The decline occurred fol-lowing the beginning of the national recession and the housing crisis. The number of sales increased to 109,900 during 2009, as REO sales increased from less than 2 percent of home sales during 2005 to 47 percent of sales. Home sales averaged 107,350 annually from 2010 through 2013 before declining to 98,750 in 2014, as investor purchases began to decline. Home sale prices followed a similar trend. During the 12 months ending March 2016, home prices averaged $260,000, up more than 4 percent
Population and Households Continued

Ph
oe
nix
-Me
sa
-Sc
ott
sd
ale
, A
Z •
CO
MP
RE
HE
NS
IVE
HO
US
ING
MA
RK
ET
AN
ALY
SIS
8
from a year earlier. Although average home sales declined 20 percent annu-ally from 2005 through 2008, average home prices peaked at $316,700 in 2006 and declined by more than 17 percent annually to a low of $173,700 in 2009. Home sales prices have increased since 2009, rising by nearly 9 percent annually from 2010 through 2014.
Although existing home sales in the HMA increased in the past year, existing home sales and prices remain below the highs reached in the mid-2000s. During 2005, approximately 80 percent of the 159,800 existing homes sold were purchased for owner occupancy, and REO sales were only 2 percent of existing home sales (Met-rostudy, A Hanley Wood Company). The percentage of existing homes bought by owner households declined to 58 percent during 2007 and fell further to an average of 39 percent of 146,500 existing homes sold annually from 2008 through 2011. REO sales totaled 440, or less than 0.5 percent of existing home sales, during 2006 before rising sharply to nearly 60 percent of existing home sales during 2009. Existing home sales continued to decline to 96,900 during 2014, although owner-occupant purchases increased to 73 percent of sales, as in-vestor purchases declined. REO sales fell to 7 percent of existing home sales by 2014, as distressed inventory con-tinued to clear. During the 12 months ending March 2016, existing home sales increased to 105,600, up nearly 7 percent from the 98,750 homes sold during the previous 12-month period. Despite the recent growth, existing home sales are still more than 18 percent below the average of 129,900 homes sold annually in 2005 and 2006. Existing home sales prices reached a peak of $325,700 in
2007 before declining dramatically by more than 40 percent to $188,700 in 2011, as the large share of foreclosed properties kept downward pressure on prices (CoreLogic, Inc.). As investor purchases declined, existing sales prices increased by nearly 10 percent annually to $245,000 in 2014. During the 12 months ending March 2016, existing home sales prices averaged $252,900, up more than 4 percent from a year earlier.
Few areas in the nation were affected more severely by the housing crisis than the Phoenix HMA, and the steep home price declines during the national recession made the HMA a particularly attractive area for real estate investors, who have contributed to relatively rapid absorption of distressed properties. In January 2010, the HMA was among the top 3 percent of all metropolitan areas nationally in the percentage of home loans that were seriously delinquent (90 or more days delinquent or in foreclosure) or had transitioned into REO status (CoreLogic, Inc.). The rate in the HMA has been below the national rate since March 2012, however, as investor purchases have absorbed those distressed homes. As of March 2016, the rate in the HMA was 1.4 percent, down from 1.7 percent during March 2015 and well below the high of 13.8 percent in January 2010. By comparison, the national rate was 3.0 percent as of March 2016, down from 3.8 percent as of March 2015 and from a high of 9.2 percent in January 2010. As the rate of seriously delinquent loans and REO properties increased when the housing bubble burst, the percentage of home purchases made by absentee owners (a measure of investor purchases) rose each year, from 15 percent of all home sales
Housing Market TrendsSales Market Continued
Ph
oe
nix
-Me
sa
-Sc
ott
sd
ale
, A
Z •
CO
MP
RE
HE
NS
IVE
HO
US
ING
MA
RK
ET
AN
ALY
SIS
9
in 2005 to a high of 26 percent in 2011. The percentage of purchases made by absentee owners declined to 17 percent in 2014 as home price growth began to accelerate, reducing the attractiveness of the HMA to investors (Metrostudy, A Hanley Wood Company, with adjustments by the analyst).
Improving economic conditions and net in-migration have increased household growth since 2011 and have supported new home sales in the HMA. New home sales increased more than 18 percent, to 12,900, dur-ing the 12 months ending March 2016 from a year ago, and the average new home sales price increased 1 percent, to $328,400 (CoreLogic, Inc., with ad-justments by the analyst). New home sales peaked in 2005, with 58,250 homes sold, but new home sales prices peaked in 2006 at $303,700; the same years that new home sales and prices peaked in the nation. From 2007 through 2009, new home prices in the HMA decreased more than 15 percent annually, to $232,100, and the number of new home sales decreased 53 percent annually, to 11,650 homes sold, partly because of slowing net in-migration and declining payrolls. During 2010 and 2011, new home sales continued to
fall, to a low of 8,300 homes sold, but new home sales prices rose slightly, by less than 1 percent annually. From 2011 through 2014, economic growth encouraged households to purchase homes, and the number of new home sales increased 37 percent annually, to 21,375, and the average price of a new home increased nearly 10 percent annually, to $311,200.
Overbuilding of single-family homes in the HMA during the previous decade contributed to weak housing market conditions following the national recession. From 2000 through 2006, approximately 291,600 housing units were added, of which 89 percent were owner units and more than 260,800 were single-family homes (U.S. Census Bureau survey, 2000 decennial Census, and 2006 ACS 1-year data). During that period, owner households increased by 167,300. From 2006 through 2013, an additional 159,300 single-family homes were constructed in the HMA, but owner households decreased by 31,150. The production of excess for-sale housing units led to steep price declines following the national recession and increased pressure to shift single-family homes to renter tenure.
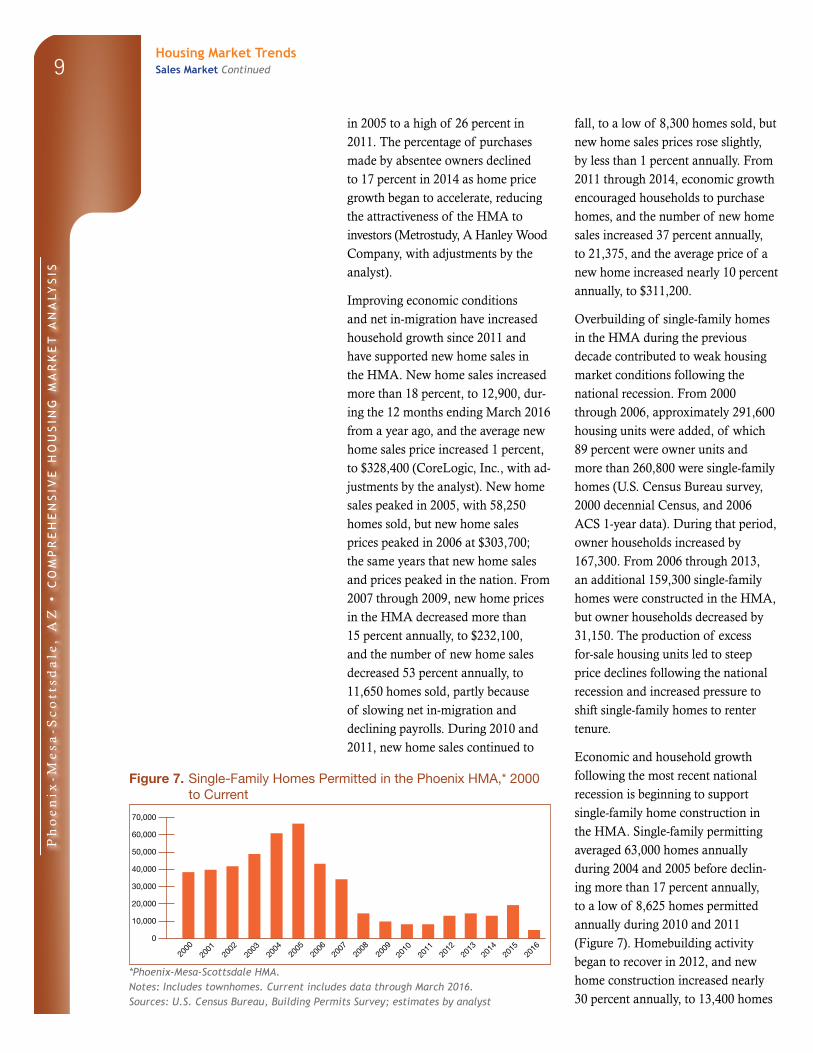
Economic and household growth following the most recent national recession is beginning to support single-family home construction in the HMA. Single-family permitting averaged 63,000 homes annually during 2004 and 2005 before declin-ing more than 17 percent annually, to a low of 8,625 homes permitted annually during 2010 and 2011 (Figure 7). Homebuilding activity began to recover in 2012, and new home construction increased nearly 30 percent annually, to 13,400 homes
Figure 7. Single-Family Homes Permitted in the Phoenix HMA,* 2000 to Current
2000
2001
2002
2003
2004
2005
2006
70,000
60,000
50,000
40,000
30,000
20,000
10,000
0
2008
2009
2010
2011
2013
2015
2016
2014
2012
2007
*Phoenix-Mesa-Scottsdale HMA.Notes: Includes townhomes. Current includes data through March 2016.Sources: U.S. Census Bureau, Building Permits Survey; estimates by analyst
Housing Market TrendsSales Market Continued
Ph
oe
nix
-Me
sa
-Sc
ott
sd
ale
, A
Z •
CO
MP
RE
HE
NS
IVE
HO
US
ING
MA
RK
ET
AN
ALY
SIS
10
permitted in 2013. During the 12 months ending March 2016, 17,850 single-family homes were permitted in the HMA, a 44-percent increase from 12,375 homes permitted during the previous 12 months (preliminary data), in response to improving sales market and economic conditions.
The Bridges at Gilbert, a 480-acre master-planned community with 1,600 lots, is one of the larger developments where single-family home construction is occurring in the
HMA. Eleven builders are construct-ing homes in this master-planned community. Taylor Morrison is offering homes ranging from 1,779 to 3,659 square feet, with prices from $291,990 to $360,990, and Meritage Homes is selling homes priced from $353,990 to $464,990. Toll Brothers is offering homes from 3,397 to 5,175 square feet, and starting prices from $540,995 to $606,995.
During the next 3 years, demand is expected for 72,050 new single-family homes, townhomes, and condomini-ums (Table 1). The 3,600 homes currently under construction and a portion of the 133,000 other vacant units that may come back on the market will satisfy a portion of the forecast demand. Demand for new homes is anticipated to be strongest for homes priced between $140,000 and $299,999. Table 4 shows the estimated demand for new market-rate sales housing, by price range, during the 3-year forecast period.
Table 4. Estimated Demand for New Market-Rate Sales Housing in the Phoenix HMA* During the Forecast Period
Price Range ($) Units of PercentFrom To Demand of Total
140,000 199,999 27,050 38.1200,000 299,999 26,200 36.9300,000 399,999 7,100 10.0400,000 499,999 7,100 10.0500,000 and higher 3,550 5.0
*Phoenix-Mesa-Scottsdale HMA.Notes: The 3,600 homes currently under construction and a portion of the estimated 133,000 other vacant units in the submarket will likely satisfy some of the forecast demand. Demand for 1,000 mobile homes during the forecast period is excluded from this table. The forecast period is April 1, 2016, to April 1, 2019.Source: Estimates by analyst
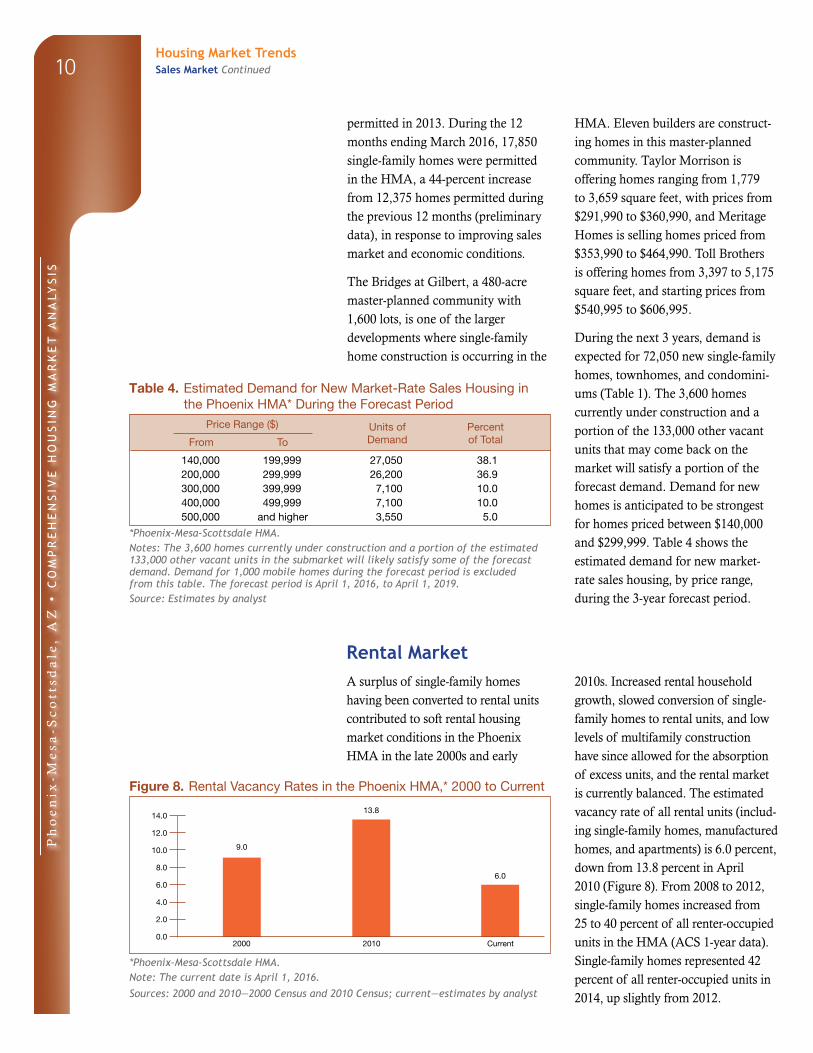
Rental MarketA surplus of single-family homes having been converted to rental units contributed to soft rental housing market conditions in the Phoenix HMA in the late 2000s and early
2010s. Increased rental household growth, slowed conversion of single-family homes to rental units, and low levels of multifamily construction have since allowed for the absorption of excess units, and the rental market is currently balanced. The estimated vacancy rate of all rental units (includ-ing single-family homes, manufactured homes, and apartments) is 6.0 percent, down from 13.8 percent in April 2010 (Figure 8). From 2008 to 2012, single-family homes increased from 25 to 40 percent of all renter-occupied units in the HMA (ACS 1-year data). Single-family homes represented 42 percent of all renter-occupied units in 2014, up slightly from 2012.
Figure 8. Rental Vacancy Rates in the Phoenix HMA,* 2000 to Current
2000 Current2010
9.0
6.0
13.814.0
12.0
10.0
8.0
6.0
4.0
2.0
0.0
*Phoenix-Mesa-Scottsdale HMA.Note: The current date is April 1, 2016.
Sources: 2000 and 2010—2000 Census and 2010 Census; current—estimates by analyst
Housing Market TrendsSales Market Continued

Ph
oe
nix
-Me
sa
-Sc
ott
sd
ale
, A
Z •
CO
MP
RE
HE
NS
IVE
HO
US
ING
MA
RK
ET
AN
ALY
SIS
11
The apartment market in the HMA also is balanced, as apartment construction has kept pace with renter household growth. The apartment vacancy rate was 4.8 percent during the first quarter of 2016, down from 5.4 percent a year earlier and far below the 9.1-percent rate in the first quarter of 2011 (MPF Research). Apartment vacancy rates currently range from a low of 3.6 percent in the MPF Research-defined Gilbert mar-ket area to 6.9 percent in the North Tempe/University area. The average apartment rent was $902 in the first quarter of 2016, up nearly 8 percent from a year ago. A balanced rental market and sustainable rent growth have caused the percentage of units offering concessions to decline from 9.1 percent a year ago to 6.4 percent in the first quarter of 2016 (MPF Research). The average apartment rent increased an average of nearly 5 percent a year from $728 during the first quarter of 2011 to the first quarter of 2016. By comparison, the average rent for the nation increased by an average of 4 percent annually during the same period. Monthly rents averaged $647, $790, $963, and $1,272 for studio, one-bedroom, two-bedroom, and three-bedroom units in the HMA, respectively. The Central Phoenix area had the highest
average apartment rent in the HMA during the first quarter of 2016, at $1,279, a 15-percent increase from the same period a year earlier. The West Phoenix area had the lowest average apartment rent, at $603, an 8-percent increase from the first quarter of 2015.
The large shift of single-family homes from owner to renter tenure following the national recession led to de-creased demand for new apartments from 2008 through 2013. Multifamily construction averaged 8,550 units annually from 2000 through 2007 before falling more than 70 percent to an average of 2,375 units annually from 2008 through 2011 because of a surplus of single-family homes, many of which were converted to rental units. Builders responded to improving rental market conditions, however, with notably higher levels of multifamily permitting from 2012 through 2014 (Figure 9). During the 12 months ending March 2016, multifamily construction totaled 6,025 units compared with 7,125 units permitted during the previous 12-month period (preliminary data). Multifamily permitting averaged only 940 units a year from 2009 through 2011, the three lowest single-year totals, including an all-time low of 650 units in 2010.
Recent developments under way in the HMA include Vela Apartments on Tempe Town Lake in Tempe. The 290-unit project is currently under construction and is projected to open in the fall of 2016. Rents are expected to start at $1,355 for one-bedroom units and $1,820 for two-bedroom units. In Glendale, the 286-unit Velaire at Aspera project is also under way and is expected to be complete
Figure 9. Multifamily Units Permitted in the Phoenix HMA,* 2000 to Current
2000
2001
2002
2003
2004
2005
2006
14,000
12,000
10,000
8,000
6,000
4,000
2,000
0
2008
2009
2010
2011
2013
2015
2016
2014
2012
2007
*Phoenix-Mesa-Scottsdale HMA.Notes: Excludes townhomes. Current includes data through March 2016.Sources: U.S. Census Bureau, Building Permits Survey; estimates by analyst
Housing Market TrendsRental Market Continued

Ph
oe
nix
-Me
sa
-Sc
ott
sd
ale
, A
Z •
CO
MP
RE
HE
NS
IVE
HO
US
ING
MA
RK
ET
AN
ALY
SIS
12
in early 2017. Rents are anticipated to range from $1,140 to $1,250 for one-bedroom units, from $1,350 to $1,485 for two-bedroom units, and $1,550 for three-bedroom units.
During the next 3 years, demand is expected for 39,150 new rental units in the HMA (Table 1). The esti-mated 3,600 units currently under
construction and 7,650 additional planned completions will meet a por-tion of the expected demand. Addi-tional construction in the HMA should be timed to enter the market during the second and third years of the 3-year forecast period. Table 5 shows the forecast demand for new market-rate rental housing in the HMA by rent level and number of bedrooms.
Table 5. Estimated Demand for New Market-Rate Rental Housing in the Phoenix HMA* During the Forecast Period
Zero Bedrooms One Bedroom Two Bedrooms Three or More Bedrooms
Monthly Gross Rent ($)
Units of Demand
Monthly Gross Rent ($)
Units of Demand
Monthly Gross Rent ($)
Units of Demand
Monthly Gross Rent ($)
Units of Demand
600 to 799 3,200 760 to 959 13,700 930 to 1,129 12,200 1,260 to 1,459 3,075800 or more 200 960 to 1,159 1,700 1,130 to 1,329 1,525 1,460 or more 340
1,160 or more 1,700 1,330 or more 1,525Total 3,425 Total 17,100 Total 15,250 Total 3,400
*Phoenix-Mesa-Scottsdale HMA.Notes: Numbers may not add to totals because of rounding. Monthly rent does not include utilities or concessions. The 3,600 units currently under construction will likely satisfy some of the estimated demand. The forecast period is April 1, 2016, to April 1, 2019.Source: Estimates by analyst
Data Profile
Table DP-1. Phoenix HMA* Data Profile, 2000 to Current
Average Annual Change (%)
2000 2010 Current 2000 to 2010 2010 to Current
Total resident employment 1,612,861 1,874,006 2,051,000 1.5 1.7
Unemployment rate 3.3% 9.6% 5.3%
Nonfarm payroll jobs 1,577,700 1,691,600 1,914,000 0.7 2.4
Total population 3,251,876 4,192,887 4,544,000 2.6 1.3
Total households 1,194,270 1,537,173 1,679,800 2.6 1.5
Owner households 812,065 1,005,949 990,600 2.2 – 0.3
Percent owner 68.0% 65.4% 59.0%
Renter households 382,205 531,224 689,200 3.3 4.4
Percent renter 32.0% 34.6% 41.0%
Total housing units 1,331,405 1,798,501 1,886,000 3.1 0.8
Owner vacancy rate 2.0% 4.3% 2.9%
Rental vacancy rate 9.0% 13.8% 6.0%
Median Family Income $60,200 $62,334 $64,201 0.3 0.6
*Phoenix-Mesa-Scottsdale HMA.Notes: Numbers may not add to totals because of rounding. Employment data represent annual averages for 2000, 2010, and the 12 months through March 2016. Median Family Incomes are for 1999, 2009, and 2014. The current date is April 1, 2016.Sources: U.S. Census Bureau; U.S. Department of Housing and Urban Development; estimates by analyst
Housing Market TrendsRental Market Continued

Ph
oe
nix
-Me
sa
-Sc
ott
sd
ale
, A
Z •
CO
MP
RE
HE
NS
IVE
HO
US
ING
MA
RK
ET
AN
ALY
SIS
13
Data Definitions and Sources
2000: 4/1/2000—U.S. Decennial Census
2010: 4/1/2010—U.S. Decennial Census
Current date: 4/1/2016—Analyst’s estimates
Forecast period: 4/1/2016–4/1/2019—Analyst’s
estimates
The metropolitan statistical area definition in this
report is based on the delineations established by
the Office of Management and Budget (OMB) in
the OMB Bulletin dated February 28, 2013.
Demand: The demand estimates in the analysis
are not a forecast of building activity. They are
the estimates of the total housing production
needed to achieve a balanced market at the end
of the 3-year forecast period given conditions on
the as-of date of the analysis, growth, losses, and
excess vacancies. The estimates do not account
for units currently under construction or units in
the development pipeline.
Other Vacant Units: In the U.S. Department of
Housing and Urban Development’s (HUD’s)
analysis, other vacant units include all vacant
units that are not available for sale or for rent.
The term therefore includes units rented or sold
but not occupied; held for seasonal, recreational,
or occasional use; used by migrant workers; and
the category specified as “other” vacant by the
Census Bureau.
Building Permits: Building permits do not
necessarily reflect all residential building
activity that occurs in an HMA. Some units
are constructed or created without a building
permit or are issued a different type of building
permit. For example, some units classified as
commercial structures are not reflected in the
residential building permits. As a result, the analyst,
through diligent fieldwork, makes an estimate of this
additional construction activity. Some of these estimates
are included in the discussions of single-family and
multifamily building permits.
For additional data pertaining to the housing market
for this HMA, go to huduser.gov/publications/pdf/
CMARtables_Phoenix_Mesa_ScottsdaleAZ_16.pdf.
Contact Information
Sam Young, Regional Economist
Denver HUD Regional Office
303–839–2643
This analysis has been prepared for the assistance and
guidance of HUD in its operations. The factual informa-
tion, findings, and conclusions may also be useful to
builders, mortgagees, and others concerned with local
housing market conditions and trends. The analysis
does not purport to make determinations regarding the
acceptability of any mortgage insurance proposals that
may be under consideration by the Department.
The factual framework for this analysis follows the
guidelines and methods developed by HUD’s Economic
and Market Analysis Division. The analysis and find-
ings are as thorough and current as possible based on
information available on the as-of date from local and
national sources. As such, findings or conclusions may be
modified by subsequent developments. HUD expresses its
appreciation to those industry sources and state and local
government officials who provided data and information
on local economic and housing market conditions.
For additional reports on other market areas, please go to huduser.gov/portal/ushmc/chma_archive.html.