composite wall testing of non-structural drywall … sfia_ssma... · steel framing industry...
TRANSCRIPT
Composite Wall Testing of Non-Structural Drywall Studs for SFIA and SSMA
STaR Technical Report No: 5421101 8 January 2014
Structural Testing and Research Inc. 498 Eagle St. N., Unit 6
Cambridge, ON, Canada, N3H 1C2 Tel: (519) 653-5255
www.starlabs.ca
STaR Technical Report No: 5421101
Composite Wall Testing of Non-Structural Drywall Studs for SFIA and SSMA
Report submitted to: Mr. Pat Ford, P.E.
Steel Framing Industry Association and
Mr. Rahim Zadeh, P.E. Steel Stud Manufacturers Association
Report authorized by:
Steven R. Fox, PhD, P.Eng.
President STRUCTURAL TESTING AND RESEARCH INC.
498 Eagle St. N., Unit 6 Cambridge, ON, Canada, N3H 1C2
Tel: (519) 653-5255 www.starlabs.ca
8 January 2014
Notice: This report cannot be altered except by STaR, and must be referenced or reproduced only in its entirety. This report is based on the test material and technical information provided to STaR by the Client, for
which STaR does not assume any liability. © January 2014
STaR Report 5421101 8 January 2014
Page 3 of 59
Table of Contents Table of Contents............................................................................................................................ 3 List of Figures ................................................................................................................................. 4 List of Tables .................................................................................................................................. 4 1 Introduction............................................................................................................................. 5 2 Objective and Scope ............................................................................................................... 5 3 Test Specimens ....................................................................................................................... 5
3.1 Section Geometry............................................................................................................ 5 3.2 Punch-Outs...................................................................................................................... 7 3.3 Steel Stud Mechanical Properties ................................................................................... 8 3.4 Metallic Coating.............................................................................................................. 9 3.5 Product Sampling............................................................................................................ 9 3.6 Gypsum Board ................................................................................................................ 9 3.7 Fasteners ....................................................................................................................... 10
4 Test Procedure and Results................................................................................................... 10 4.1 Laboratory Accreditation .............................................................................................. 10 4.2 Equipment ..................................................................................................................... 11 4.3 Test Standard ................................................................................................................ 11 4.4 Test Set-up .................................................................................................................... 11 4.5 Fabrication of Test Specimens...................................................................................... 13 4.6 Specimen Loading Procedure ....................................................................................... 13
5 Test Results........................................................................................................................... 13 5.1 Failure Mode for Transverse Load Testing .................................................................. 13 5.2 Failure Mode for End Reaction Load Testing .............................................................. 14 5.3 Test Results................................................................................................................... 16 5.4 Effect of Stud Spacing on Composite Stiffness and Strength....................................... 16
6 Calculation of Composite Wall Assembly Limiting Heights ............................................... 18 6.1 Summary of Limiting Height Calculations................................................................... 18 6.2 Limiting Heights Based on Wall Stiffness.................................................................... 18 6.3 Limiting Heights Based on Wall Flexural Strength...................................................... 19 6.4 Limiting Heights Based on End Reaction Load Tests .................................................. 19 6.5 Interpolation of Limiting Wall Heights Based on Transverse Load Tests ................... 19 6.6 Application of End Reaction Load Tests ...................................................................... 20 6.7 Extrapolation................................................................................................................. 20 6.8 Factor of Safety for Strength......................................................................................... 20 6.9 Calculation of Material Reduction Factors ................................................................... 20
7 Limiting Height Tables ......................................................................................................... 22 8 Referenced Documents ......................................................................................................... 26 Appendix A: Test Specimen Verification..................................................................................... 27 Appendix B: Test Specimen Construction.................................................................................... 29 Appendix C: Summary of Test Results ........................................................................................ 46
STaR Report 5421101 8 January 2014
Page 4 of 59
List of Figures Figure 3-1: Cross-Section of the Non-Structural Drywall Stud...................................................... 5 Figure 3-3: Punch-Out Sizes........................................................................................................... 8 Figure 4-1: Schematic of the Vacuum Box for Transverse Load Testing .................................... 12 Figure 4-2: Schematic of the Vacuum Box for End Reaction Loading Testing........................... 12 Figure 5-1: Local Buckling Failure in Transverse Loading Tests ................................................ 14 Figure 5-2: End Reaction Load Test Failure by Stud Flexure ...................................................... 15 Figure 5-3: End Reaction Load Test Failure by Stud Web Crippling .......................................... 15 Figure 5-4: End Reaction Load Test Failure by Stud Web Crippling and Pull-Out..................... 16 Figure B-1: Schematic of 4ft Flexural Test Specimen with Studs at 24”..................................... 30 Figure B-2: Schematic of 8ft Flexural Test Specimen with Studs at 24”..................................... 31 Figure B-3: Schematic of 8ft Flexural Test Specimen with Studs at 16”..................................... 32 Figure B-4: Schematic of 8ft Flexural Test Specimen with Studs at 12”..................................... 33 Figure B-5: Schematic of 10ft Flexural Test Specimen with Studs at 24”................................... 34 Figure B-6: Schematic of 10ft Flexural Test Specimen with Studs at 16”................................... 35 Figure B-7: Schematic of 10ft Flexural Test Specimen with Studs at 12”................................... 36 Figure B-8: Schematic of 12ft Flexural Test Specimen with Studs at 24”................................... 37 Figure B-9: Schematic of 12ft Flexural Test Specimen with Studs at 16”................................... 38 Figure B-10: Schematic of 12ft Flexural Test Specimen with Studs at 12”................................. 39 Figure B-11: Schematic of 16ft Flexural Test Specimen with Studs at 24”................................. 40 Figure B-12: Schematic of 16ft Flexural Test Specimen with Studs at 16”................................. 41 Figure B-13: Schematic of 16ft Flexural Test Specimen with Studs at 12”................................. 42 Figure B-14: Schematic of 20ft Flexural Test Specimen with Studs at 24”................................. 43 Figure B-15: Schematic of 20ft Flexural Test Specimen with Studs at 16”................................. 44 Figure B-16: Schematic of 20ft Flexural Test Specimen with Studs at 24”................................. 45
List of Tables Table 3-1: Measured Stud Dimensions........................................................................................... 6 Table 3-2: Measured Track Dimensions......................................................................................... 7 Table 3-3: Mechanical Properties ................................................................................................... 9 Table 3-4: Gypsum Board Flexural Test Results.......................................................................... 10 Table 5-1: Effect of 24 in. Stud Spacing....................................................................................... 17 Table 5-2: Effect of 16 in. Stud Spacing....................................................................................... 17 Table 6-1: Material Reduction Factor........................................................................................... 21 Table 7-1: Limiting Heights for 18 mil (0.0188 in.) Studs with 5/8” Type X Gypsum Board .... 22 Table 7-2: Limiting Heights for 27 mil (0.0283 in.) Studs with 5/8” Type X Gypsum Board .... 23 Table 7-3: Limiting Heights for 30 mil (0.0312 in.) Studs with 5/8” Type X Gypsum Board .... 24 Table 7-4: Limiting Heights for 33 mil (0.0346 in.) Studs with 5/8” Type X Gypsum Board .... 25 Table C-1: Flexural Strength Test Results – 24” o/c .................................................................... 47 Table C-2: End Reaction Test Results – 24” o/c .......................................................................... 48 Table C-3: Stiffness Test Results – 18 mil ................................................................................... 49 Table C-4: Stiffness Test Results – 27 mil ................................................................................... 52 Table C-5: Stiffness Test Results – 30 mil ................................................................................... 55 Table C-6: Stiffness Test Results – 33 mil ................................................................................... 58
STaR Report 5421101 8 January 2014
Page 5 of 59
Composite Wall Testing of Non-Structural Drywall Studs for SFIA and SSMA
1 Introduction A large application for cold-formed steel stud members is in the framing of interior non-structural partition walls. These walls are classified as “non-structural” in that they are not designed to carry the larger lateral loads associated with wind pressures, but rather are required to support some lateral live loads and differential air pressure within the building, typically in the order of 5 to 15 psf. The non-structural steel studs are most often used in conjunction with some type of gypsum board sheathing attached to both stud flanges. The connection of the gypsum board to the steel stud creates a stronger combined composite assembly: the strength of this composite wall assembly must be determined through a test program such as described in this report.
2 Objective and Scope The scope of the program described in this report was to carry out testing of composite wall assemblies comprised of cold-formed steel studs and 5/8” thick Type X gypsum wallboard. The test protocol followed the requirements of ICC AC86-12, Acceptance Criteria for Cold Formed Steel Framing Members – Interior Nonload-bearing Wall Assemblies. The objective of this test program was to provide the necessary data from which limiting height tables for this type of composite wall assembly could be calculated. The laboratory testing for this project was carried out from February to November 2013.
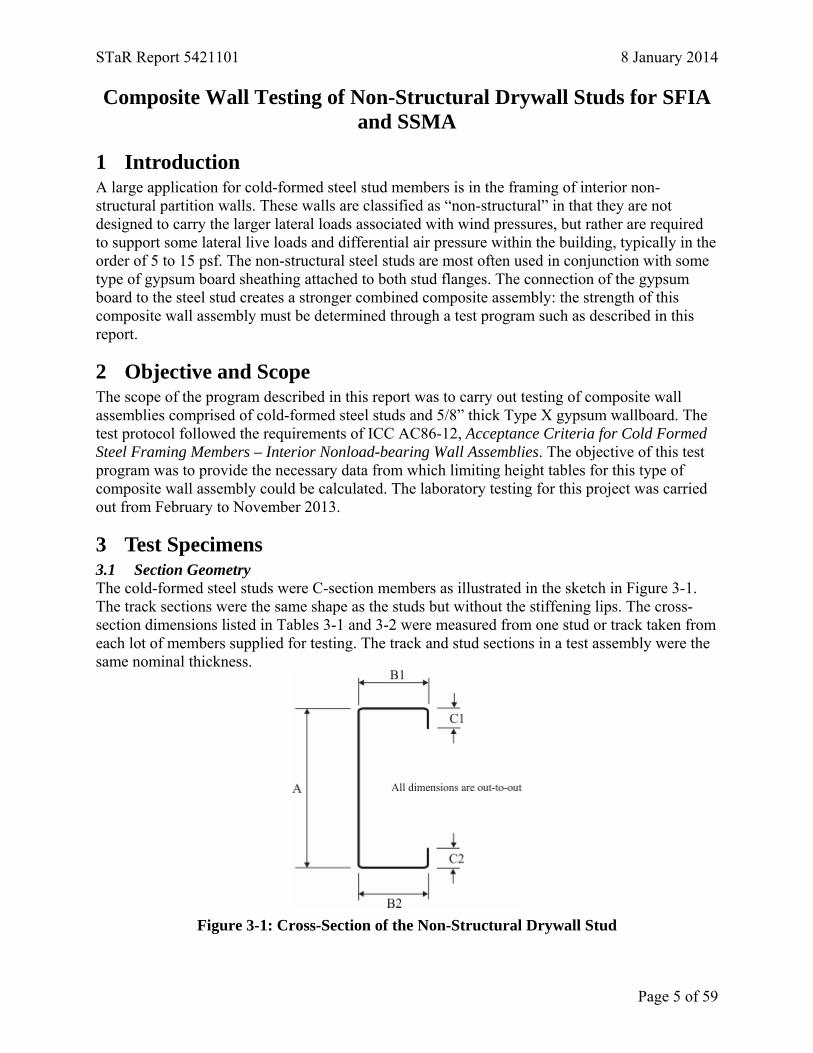
3 Test Specimens 3.1 Section Geometry The cold-formed steel studs were C-section members as illustrated in the sketch in Figure 3-1. The track sections were the same shape as the studs but without the stiffening lips. The cross-section dimensions listed in Tables 3-1 and 3-2 were measured from one stud or track taken from each lot of members supplied for testing. The track and stud sections in a test assembly were the same nominal thickness.
Figure 3-1: Cross-Section of the Non-Structural Drywall Stud
STaR Report 5421101 8 January 2014
Page 6 of 59
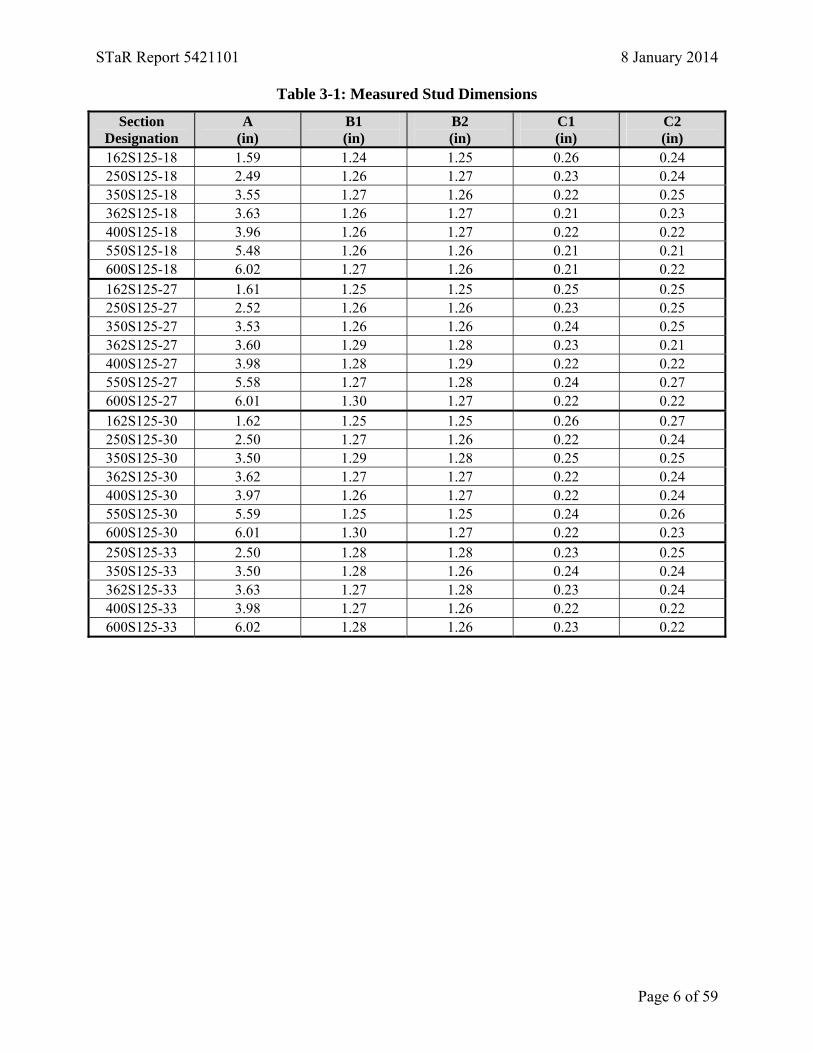
Table 3-1: Measured Stud Dimensions
Section Designation
A (in)
B1 (in)
B2 (in)
C1 (in)
C2 (in)
162S125-18 1.59 1.24 1.25 0.26 0.24 250S125-18 2.49 1.26 1.27 0.23 0.24 350S125-18 3.55 1.27 1.26 0.22 0.25 362S125-18 3.63 1.26 1.27 0.21 0.23 400S125-18 3.96 1.26 1.27 0.22 0.22 550S125-18 5.48 1.26 1.26 0.21 0.21 600S125-18 6.02 1.27 1.26 0.21 0.22 162S125-27 1.61 1.25 1.25 0.25 0.25 250S125-27 2.52 1.26 1.26 0.23 0.25 350S125-27 3.53 1.26 1.26 0.24 0.25 362S125-27 3.60 1.29 1.28 0.23 0.21 400S125-27 3.98 1.28 1.29 0.22 0.22 550S125-27 5.58 1.27 1.28 0.24 0.27 600S125-27 6.01 1.30 1.27 0.22 0.22 162S125-30 1.62 1.25 1.25 0.26 0.27 250S125-30 2.50 1.27 1.26 0.22 0.24 350S125-30 3.50 1.29 1.28 0.25 0.25 362S125-30 3.62 1.27 1.27 0.22 0.24 400S125-30 3.97 1.26 1.27 0.22 0.24 550S125-30 5.59 1.25 1.25 0.24 0.26 600S125-30 6.01 1.30 1.27 0.22 0.23 250S125-33 2.50 1.28 1.28 0.23 0.25 350S125-33 3.50 1.28 1.26 0.24 0.24 362S125-33 3.63 1.27 1.28 0.23 0.24 400S125-33 3.98 1.27 1.26 0.22 0.22 600S125-33 6.02 1.28 1.26 0.23 0.22
STaR Report 5421101 8 January 2014
Page 7 of 59
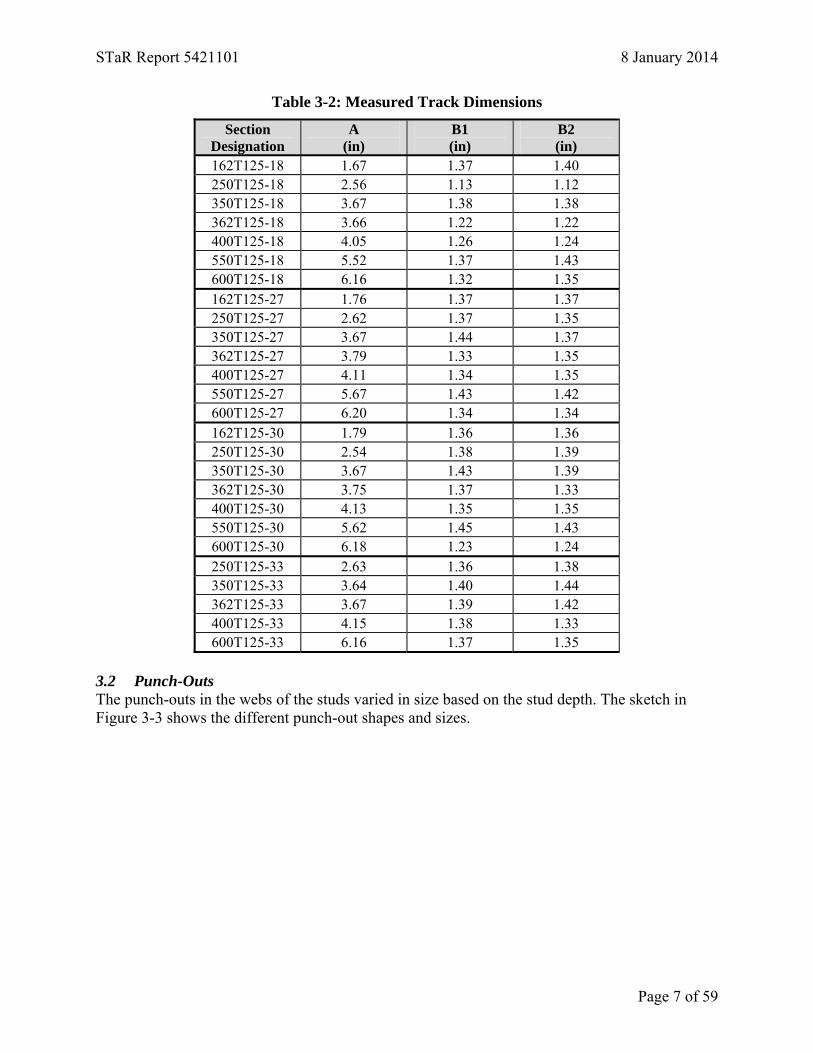
Table 3-2: Measured Track Dimensions
Section Designation
A (in)
B1 (in)
B2 (in)
162T125-18 1.67 1.37 1.40 250T125-18 2.56 1.13 1.12 350T125-18 3.67 1.38 1.38 362T125-18 3.66 1.22 1.22 400T125-18 4.05 1.26 1.24 550T125-18 5.52 1.37 1.43 600T125-18 6.16 1.32 1.35 162T125-27 1.76 1.37 1.37 250T125-27 2.62 1.37 1.35 350T125-27 3.67 1.44 1.37 362T125-27 3.79 1.33 1.35 400T125-27 4.11 1.34 1.35 550T125-27 5.67 1.43 1.42 600T125-27 6.20 1.34 1.34 162T125-30 1.79 1.36 1.36 250T125-30 2.54 1.38 1.39 350T125-30 3.67 1.43 1.39 362T125-30 3.75 1.37 1.33 400T125-30 4.13 1.35 1.35 550T125-30 5.62 1.45 1.43 600T125-30 6.18 1.23 1.24 250T125-33 2.63 1.36 1.38 350T125-33 3.64 1.40 1.44 362T125-33 3.67 1.39 1.42 400T125-33 4.15 1.38 1.33 600T125-33 6.16 1.37 1.35
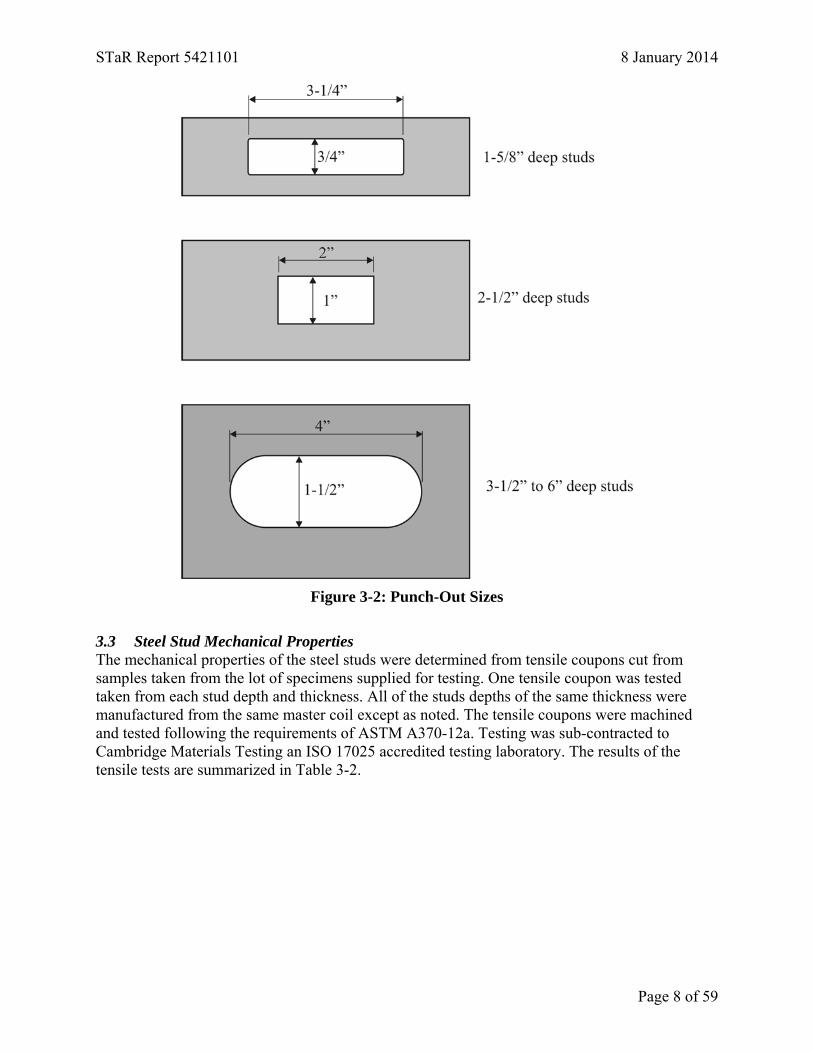
3.2 Punch-Outs The punch-outs in the webs of the studs varied in size based on the stud depth. The sketch in Figure 3-3 shows the different punch-out shapes and sizes.
STaR Report 5421101 8 January 2014
Page 8 of 59
Figure 3-2: Punch-Out Sizes
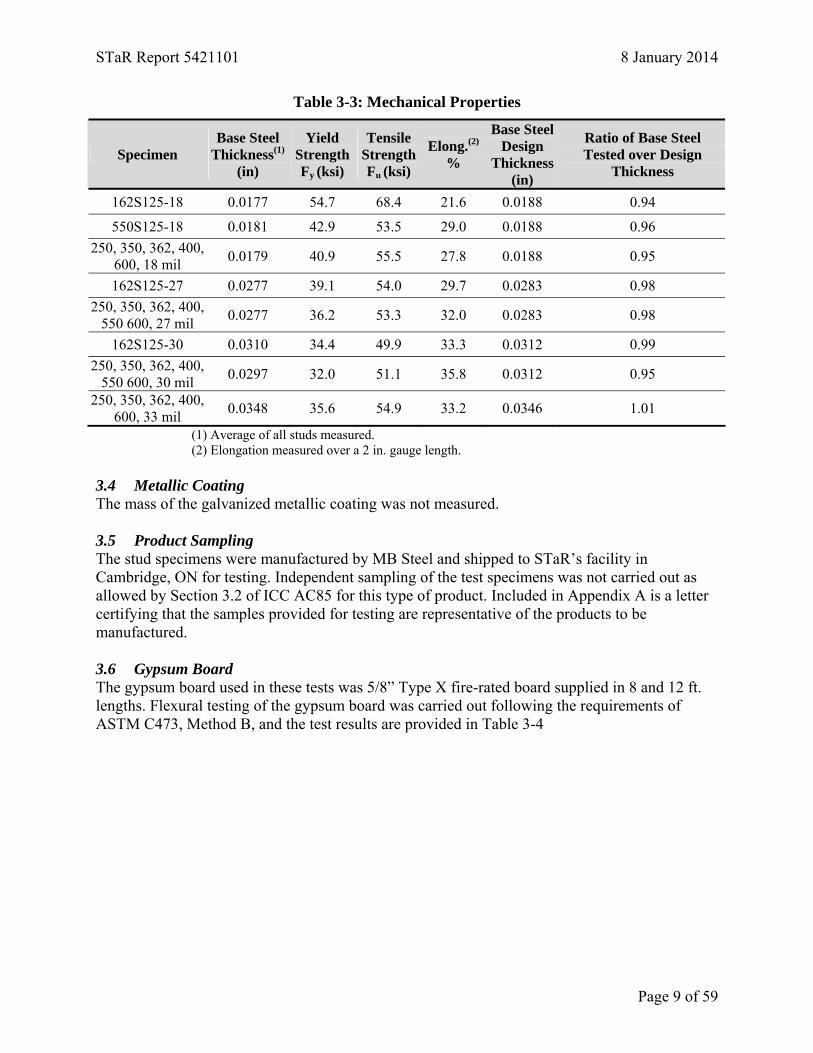
3.3 Steel Stud Mechanical Properties The mechanical properties of the steel studs were determined from tensile coupons cut from samples taken from the lot of specimens supplied for testing. One tensile coupon was tested taken from each stud depth and thickness. All of the studs depths of the same thickness were manufactured from the same master coil except as noted. The tensile coupons were machined and tested following the requirements of ASTM A370-12a. Testing was sub-contracted to Cambridge Materials Testing an ISO 17025 accredited testing laboratory. The results of the tensile tests are summarized in Table 3-2.
STaR Report 5421101 8 January 2014
Page 9 of 59
Table 3-3: Mechanical Properties
Specimen Base Steel
Thickness(1)
(in)
Yield StrengthFy (ksi)
Tensile StrengthFu (ksi)
Elong.(2)
%
Base SteelDesign
Thickness(in)
Ratio of Base Steel Tested over Design
Thickness
162S125-18 0.0177 54.7 68.4 21.6 0.0188 0.94
550S125-18 0.0181 42.9 53.5 29.0 0.0188 0.96 250, 350, 362, 400,
600, 18 mil 0.0179 40.9 55.5 27.8 0.0188 0.95
162S125-27 0.0277 39.1 54.0 29.7 0.0283 0.98 250, 350, 362, 400,
550 600, 27 mil 0.0277 36.2 53.3 32.0 0.0283 0.98
162S125-30 0.0310 34.4 49.9 33.3 0.0312 0.99 250, 350, 362, 400,
550 600, 30 mil 0.0297 32.0 51.1 35.8 0.0312 0.95
250, 350, 362, 400, 600, 33 mil 0.0348 35.6 54.9 33.2 0.0346 1.01
(1) Average of all studs measured. (2) Elongation measured over a 2 in. gauge length.
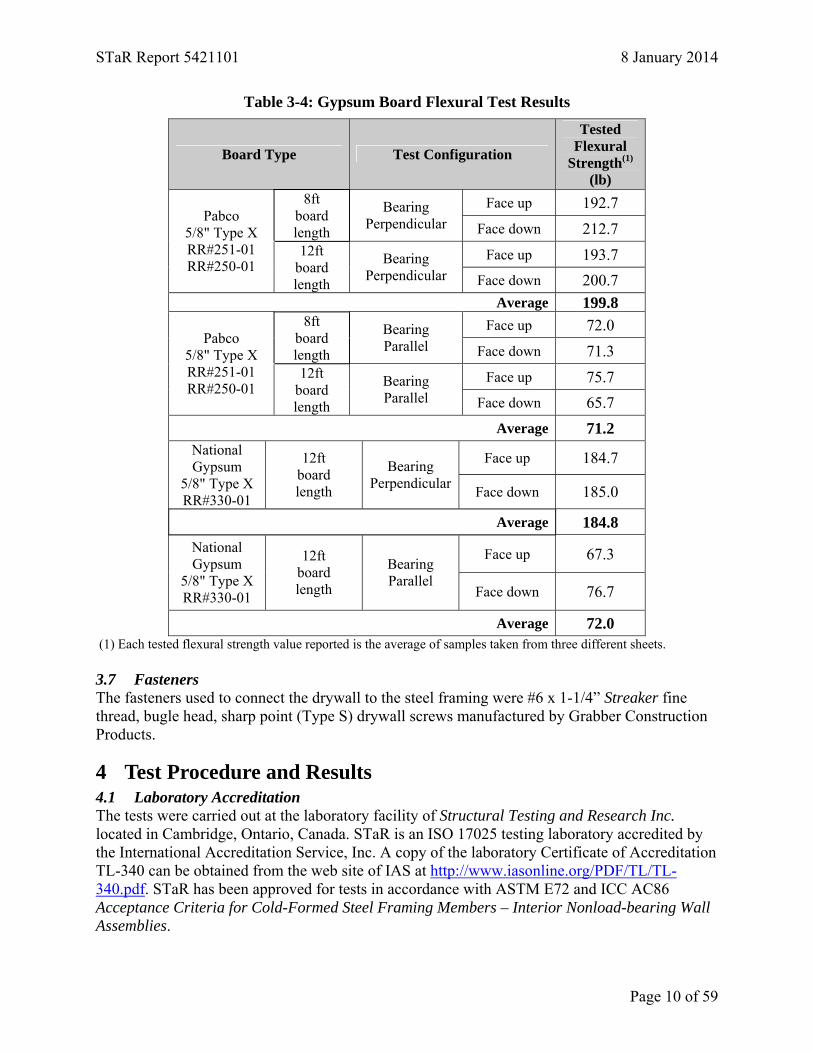
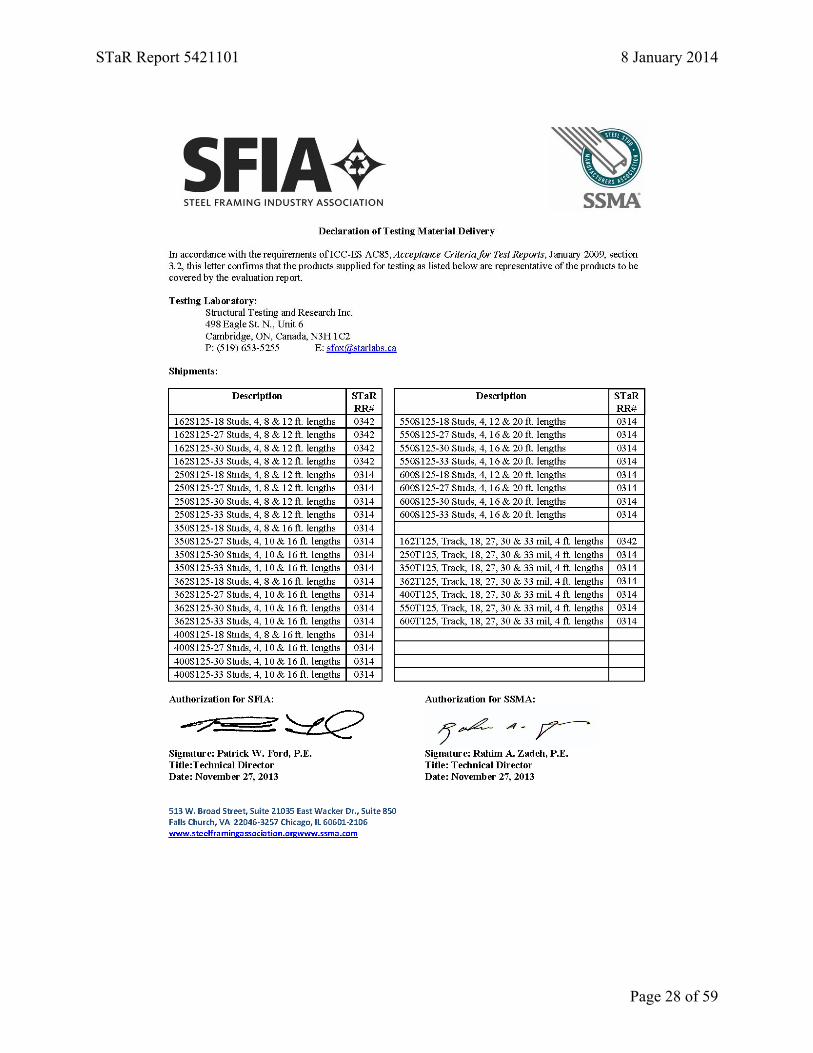
3.4 Metallic Coating The mass of the galvanized metallic coating was not measured. 3.5 Product Sampling The stud specimens were manufactured by MB Steel and shipped to STaR’s facility in Cambridge, ON for testing. Independent sampling of the test specimens was not carried out as allowed by Section 3.2 of ICC AC85 for this type of product. Included in Appendix A is a letter certifying that the samples provided for testing are representative of the products to be manufactured. 3.6 Gypsum Board The gypsum board used in these tests was 5/8” Type X fire-rated board supplied in 8 and 12 ft. lengths. Flexural testing of the gypsum board was carried out following the requirements of ASTM C473, Method B, and the test results are provided in Table 3-4
STaR Report 5421101 8 January 2014
Page 10 of 59
Table 3-4: Gypsum Board Flexural Test Results
Board Type Test Configuration
Tested Flexural
Strength(1)
(lb) Face up 192.7 8ft
board length
Bearing Perpendicular Face down 212.7
Face up 193.7
Pabco 5/8" Type X RR#251-01 RR#250-01
12ft board length
Bearing Perpendicular Face down 200.7
Average 199.8 Face up 72.0 8ft
board length
Bearing Parallel Face down 71.3
Face up 75.7
Pabco 5/8" Type X RR#251-01 RR#250-01
12ft board length
Bearing Parallel Face down 65.7
Average 71.2
Face up 184.7 National Gypsum
5/8" Type X RR#330-01
12ft board length
Bearing Perpendicular Face down 185.0
Average 184.8
Face up 67.3 National Gypsum
5/8" Type X RR#330-01
12ft board length
Bearing Parallel
Face down 76.7
Average 72.0 (1) Each tested flexural strength value reported is the average of samples taken from three different sheets. 3.7 Fasteners The fasteners used to connect the drywall to the steel framing were #6 x 1-1/4” Streaker fine thread, bugle head, sharp point (Type S) drywall screws manufactured by Grabber Construction Products.
4 Test Procedure and Results 4.1 Laboratory Accreditation The tests were carried out at the laboratory facility of Structural Testing and Research Inc. located in Cambridge, Ontario, Canada. STaR is an ISO 17025 testing laboratory accredited by the International Accreditation Service, Inc. A copy of the laboratory Certificate of Accreditation TL-340 can be obtained from the web site of IAS at http://www.iasonline.org/PDF/TL/TL-340.pdf. STaR has been approved for tests in accordance with ASTM E72 and ICC AC86 Acceptance Criteria for Cold-Formed Steel Framing Members – Interior Nonload-bearing Wall Assemblies.
STaR Report 5421101 8 January 2014
Page 11 of 59
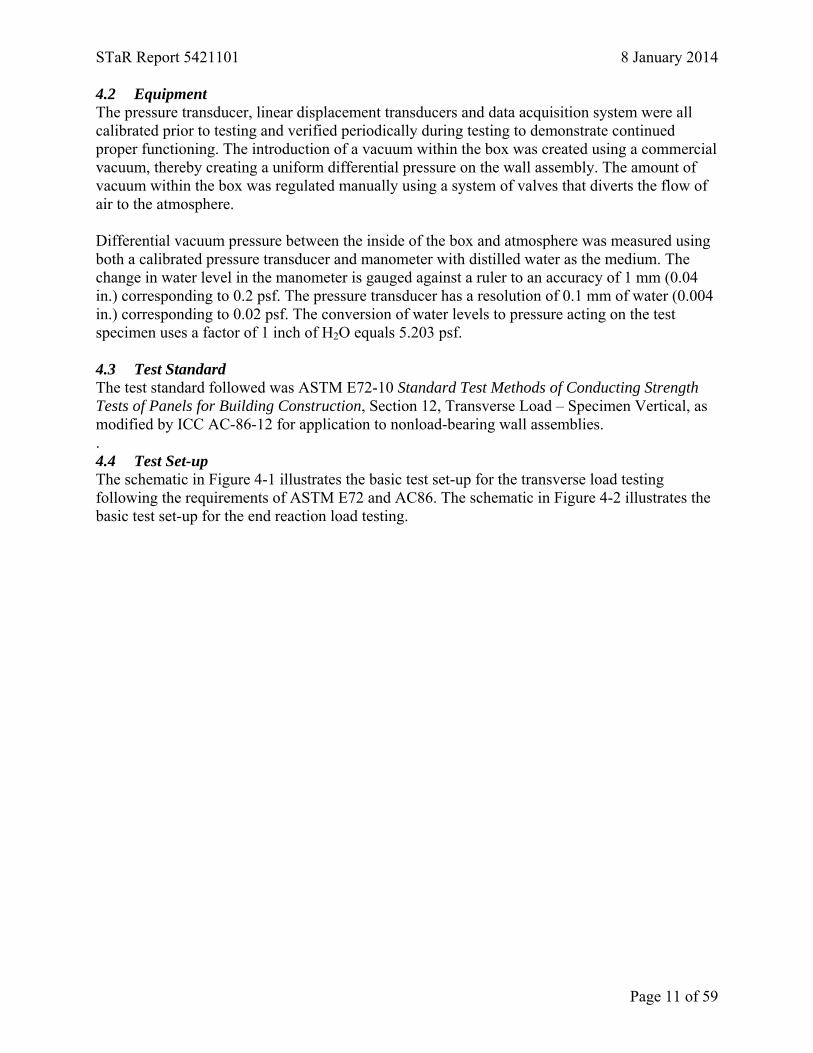
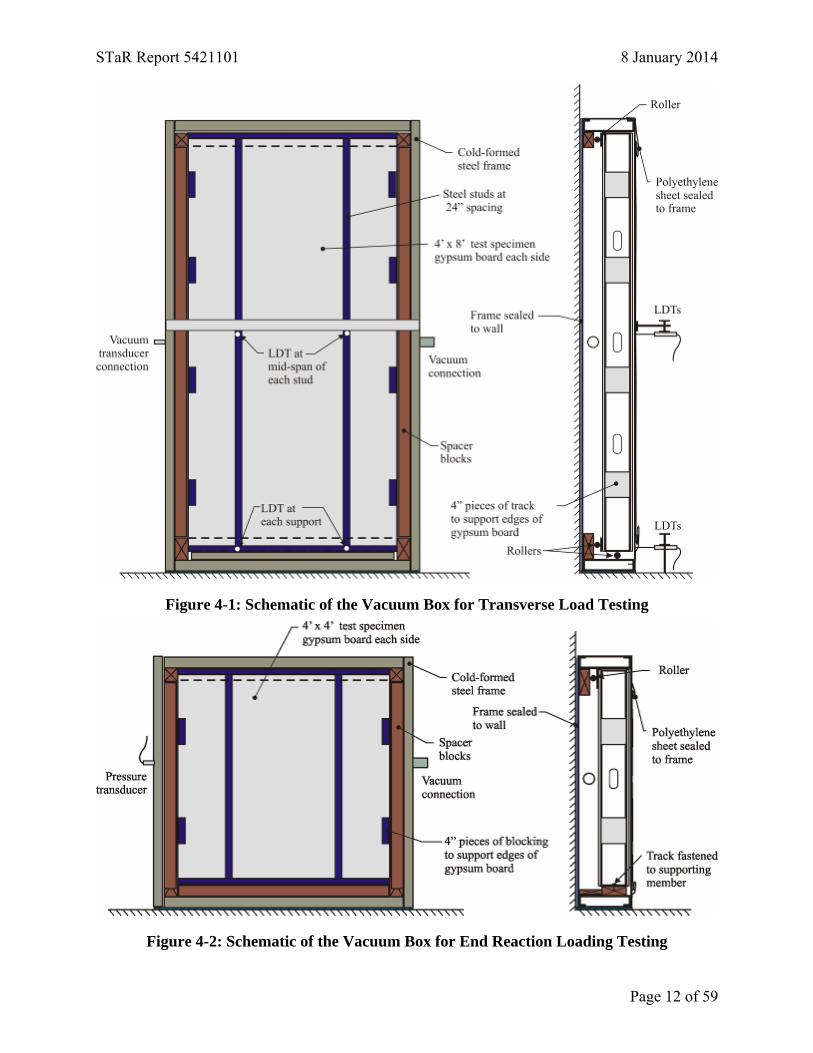
4.2 Equipment The pressure transducer, linear displacement transducers and data acquisition system were all calibrated prior to testing and verified periodically during testing to demonstrate continued proper functioning. The introduction of a vacuum within the box was created using a commercial vacuum, thereby creating a uniform differential pressure on the wall assembly. The amount of vacuum within the box was regulated manually using a system of valves that diverts the flow of air to the atmosphere. Differential vacuum pressure between the inside of the box and atmosphere was measured using both a calibrated pressure transducer and manometer with distilled water as the medium. The change in water level in the manometer is gauged against a ruler to an accuracy of 1 mm (0.04 in.) corresponding to 0.2 psf. The pressure transducer has a resolution of 0.1 mm of water (0.004 in.) corresponding to 0.02 psf. The conversion of water levels to pressure acting on the test specimen uses a factor of 1 inch of H2O equals 5.203 psf. 4.3 Test Standard The test standard followed was ASTM E72-10 Standard Test Methods of Conducting Strength Tests of Panels for Building Construction, Section 12, Transverse Load – Specimen Vertical, as modified by ICC AC-86-12 for application to nonload-bearing wall assemblies. . 4.4 Test Set-up The schematic in Figure 4-1 illustrates the basic test set-up for the transverse load testing following the requirements of ASTM E72 and AC86. The schematic in Figure 4-2 illustrates the basic test set-up for the end reaction load testing.
STaR Report 5421101 8 January 2014
Page 12 of 59
Figure 4-1: Schematic of the Vacuum Box for Transverse Load Testing
Figure 4-2: Schematic of the Vacuum Box for End Reaction Loading Testing
STaR Report 5421101 8 January 2014
Page 13 of 59
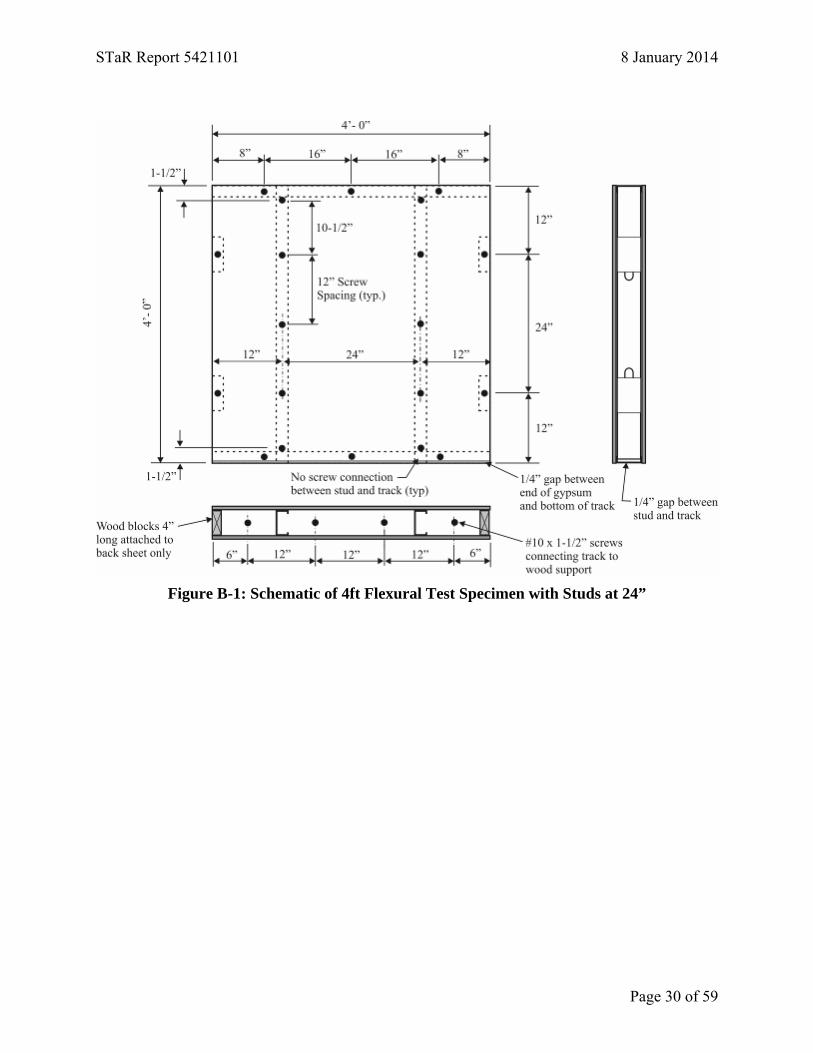
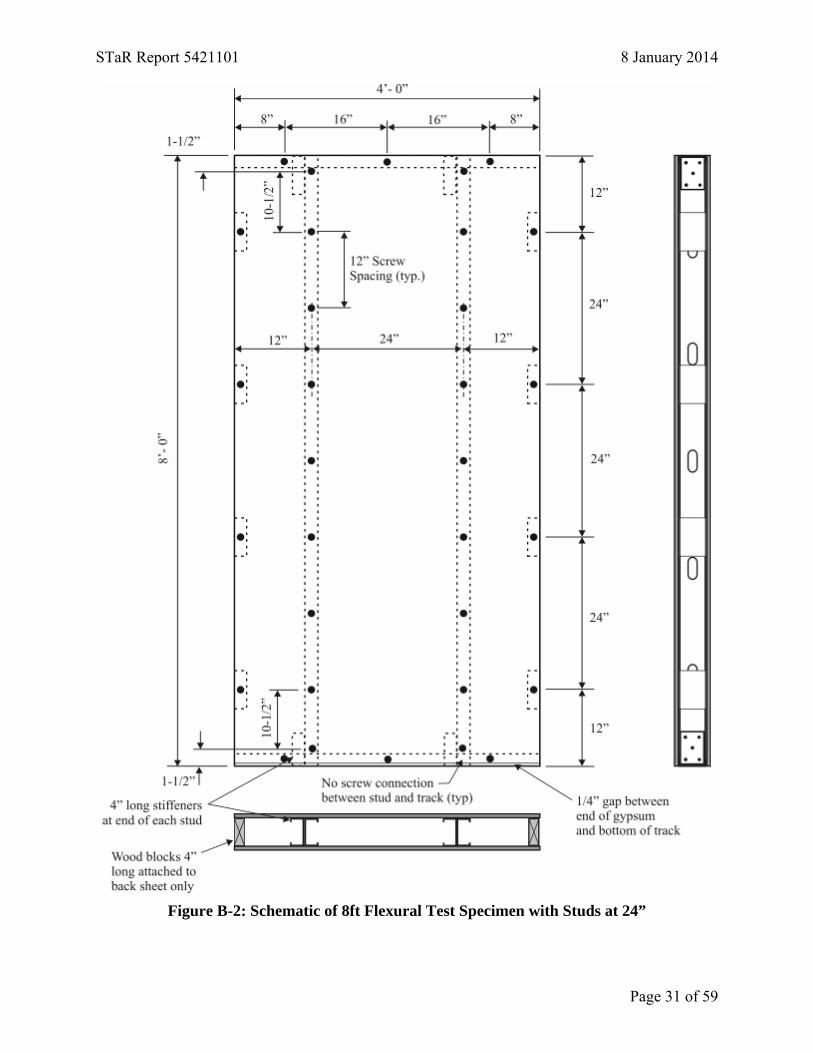
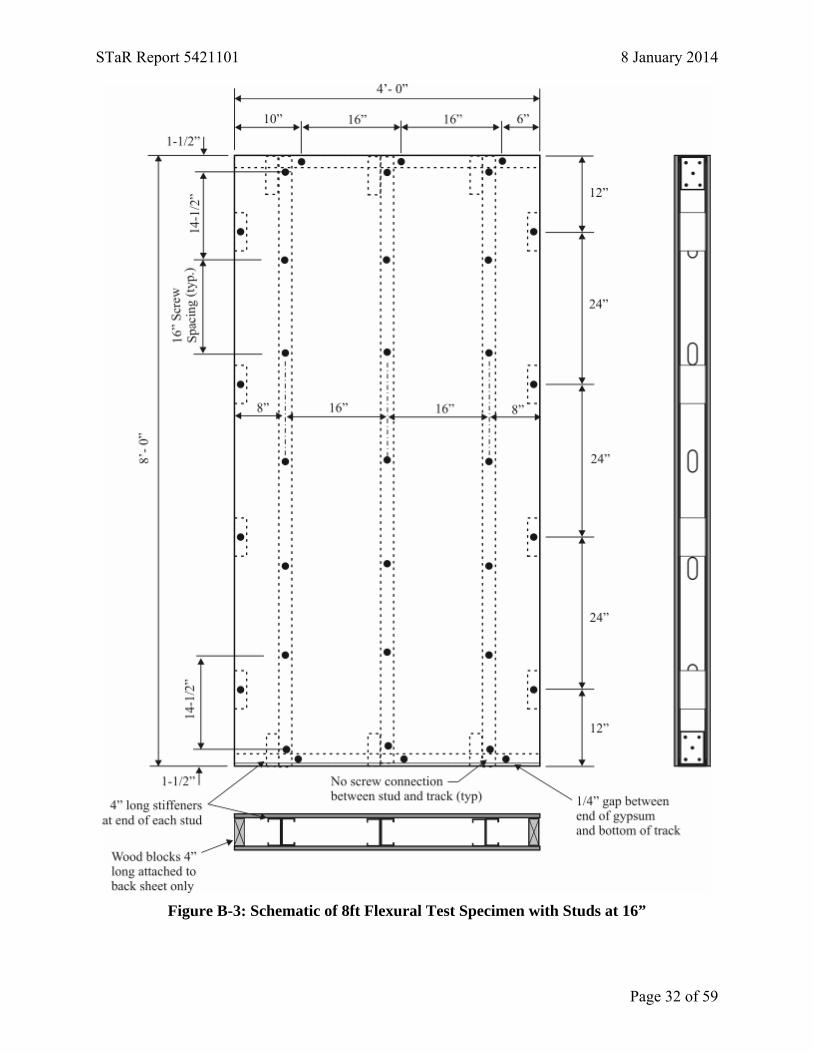
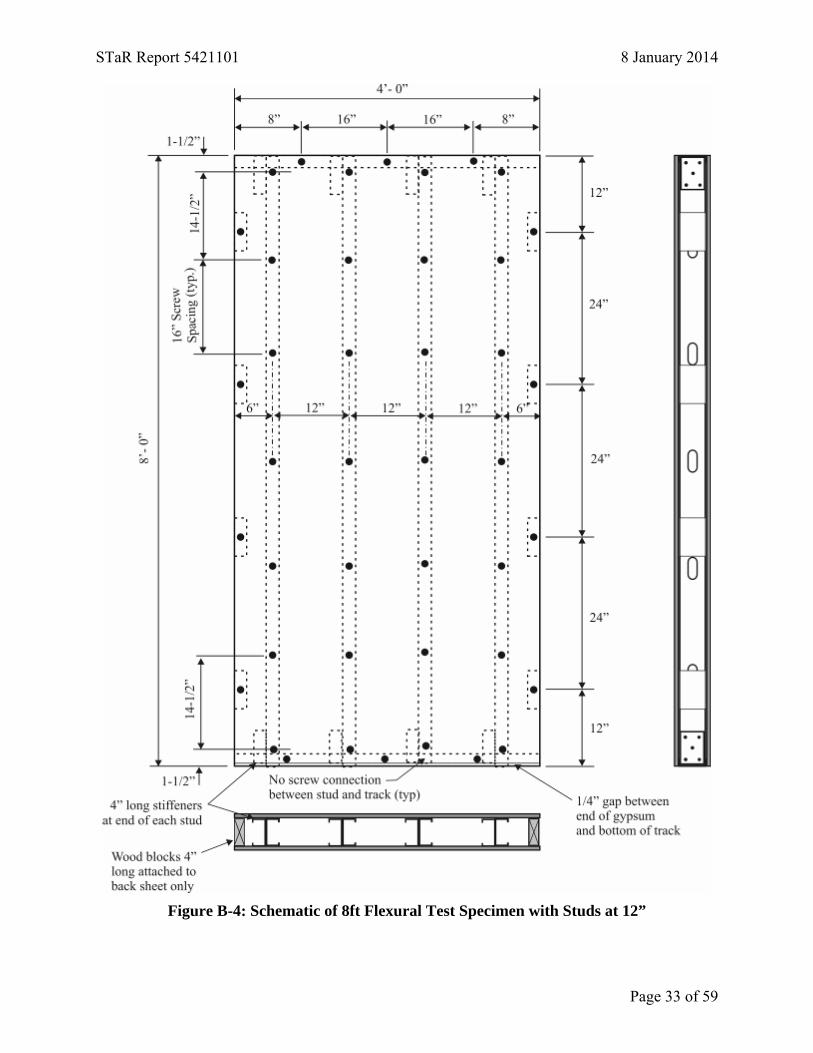
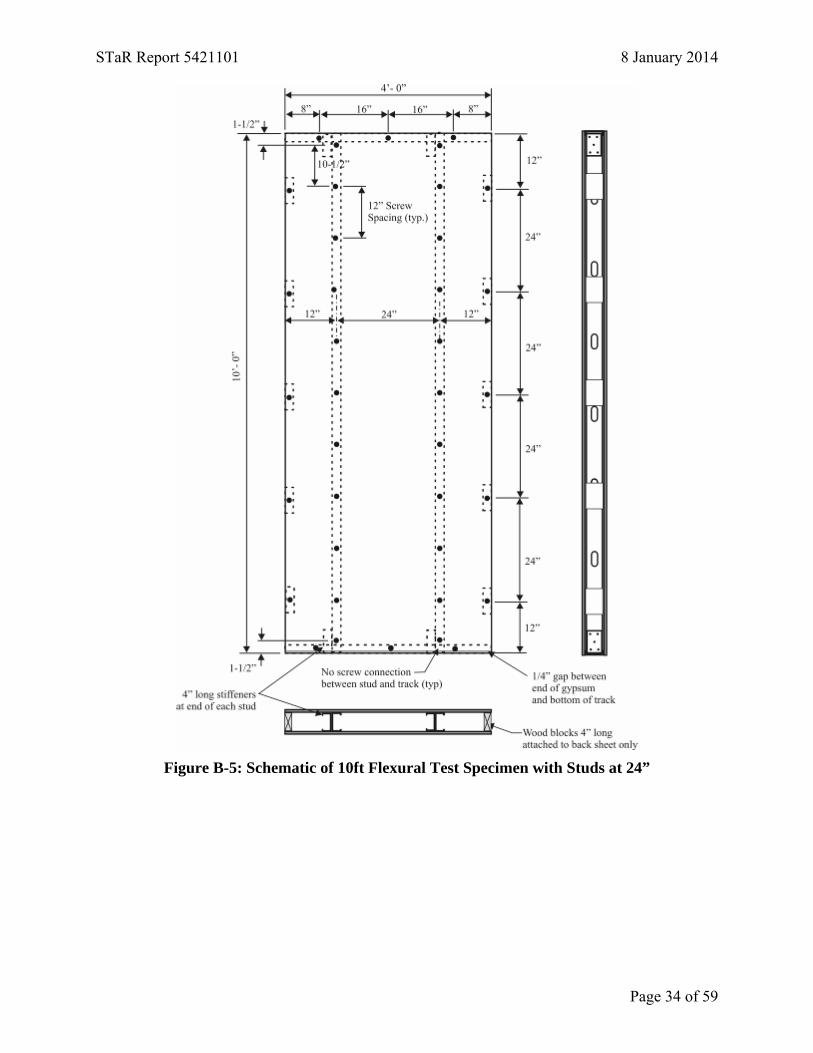
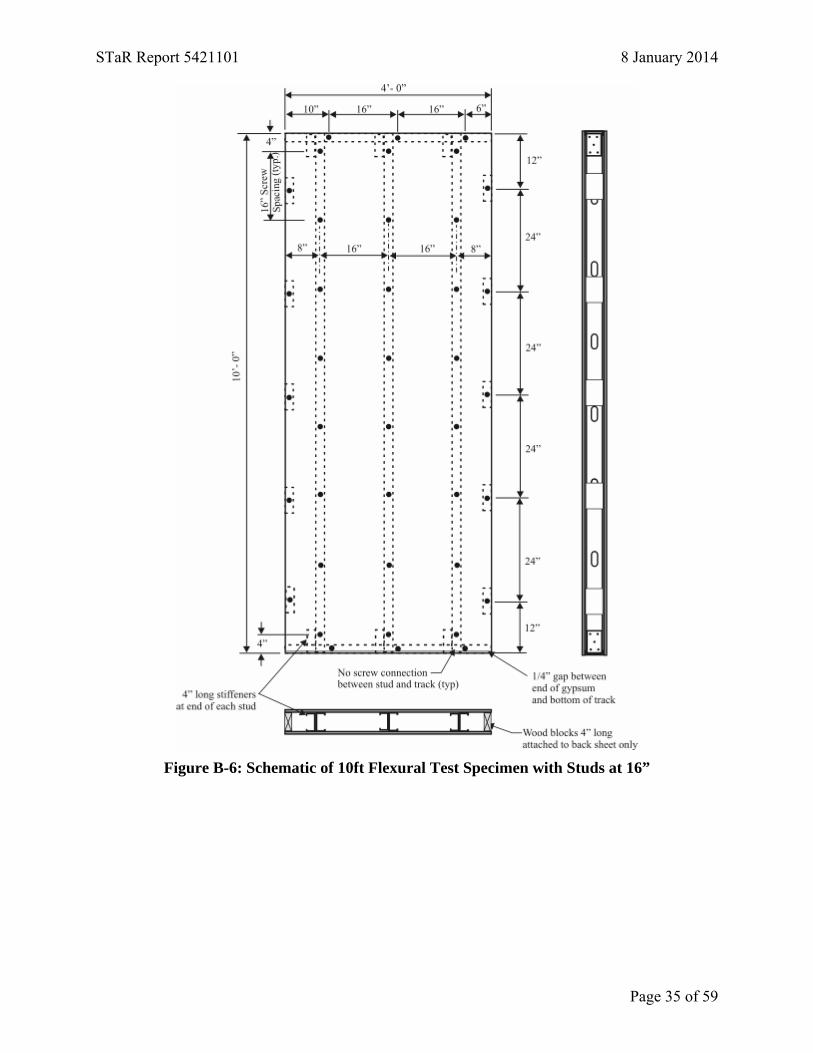
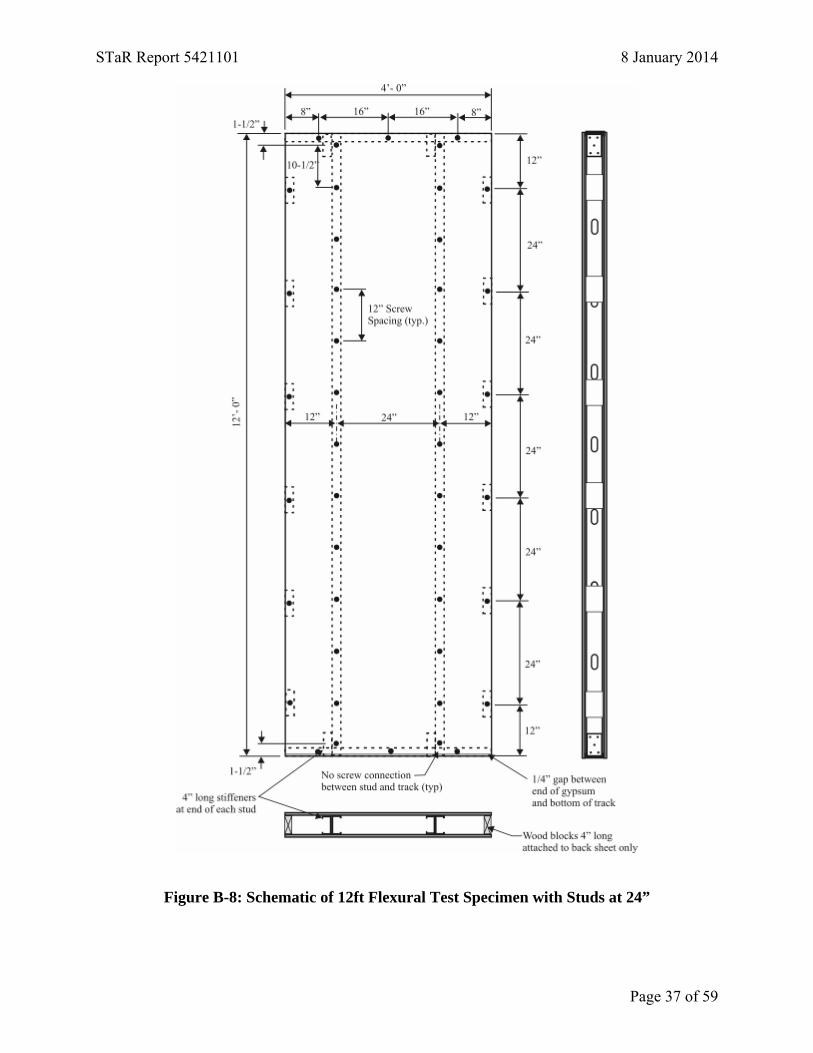
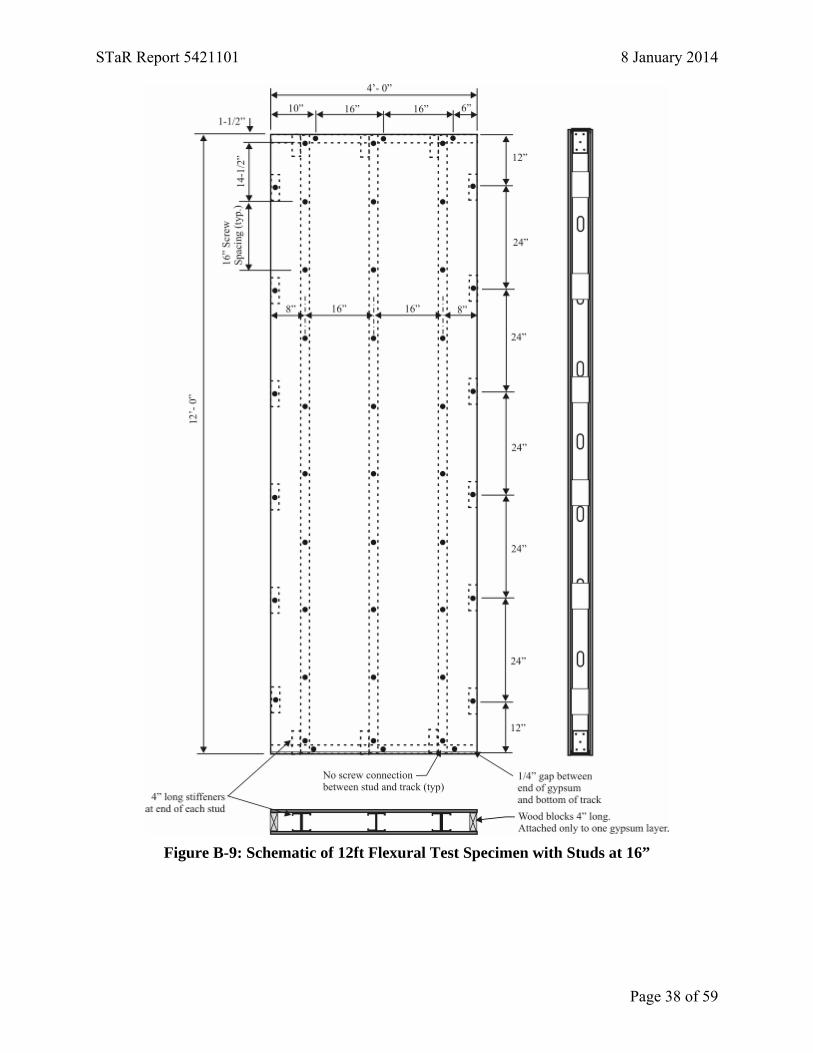
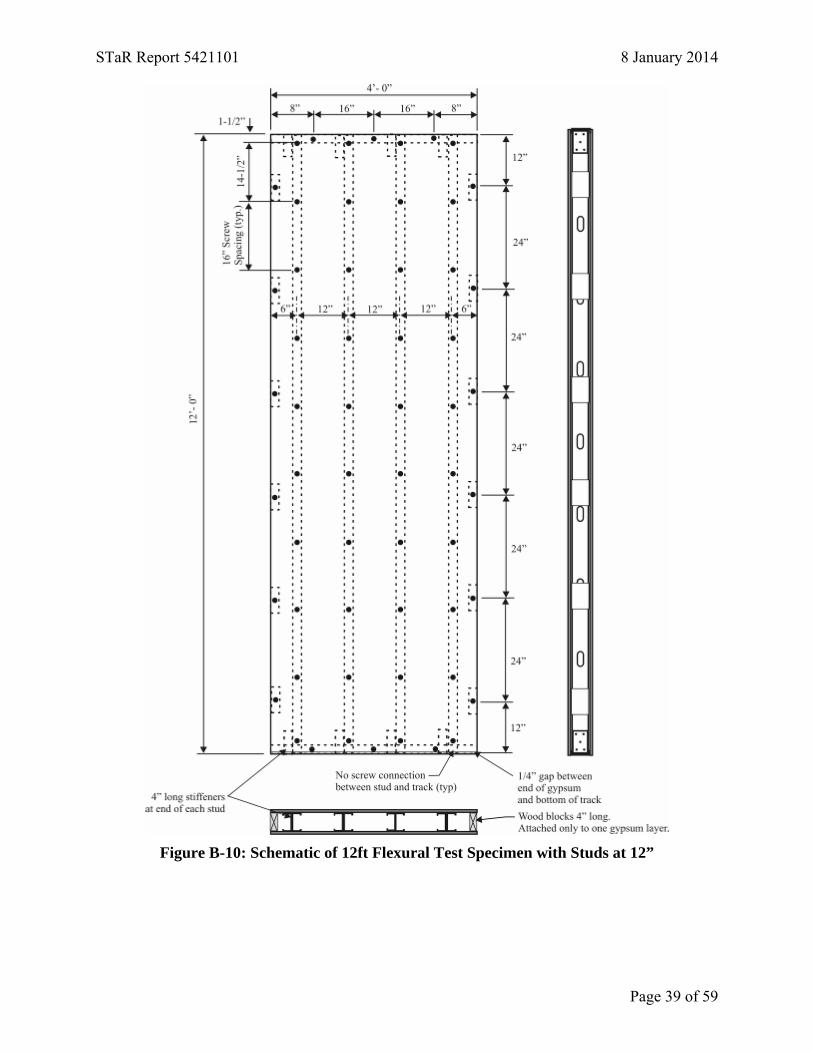
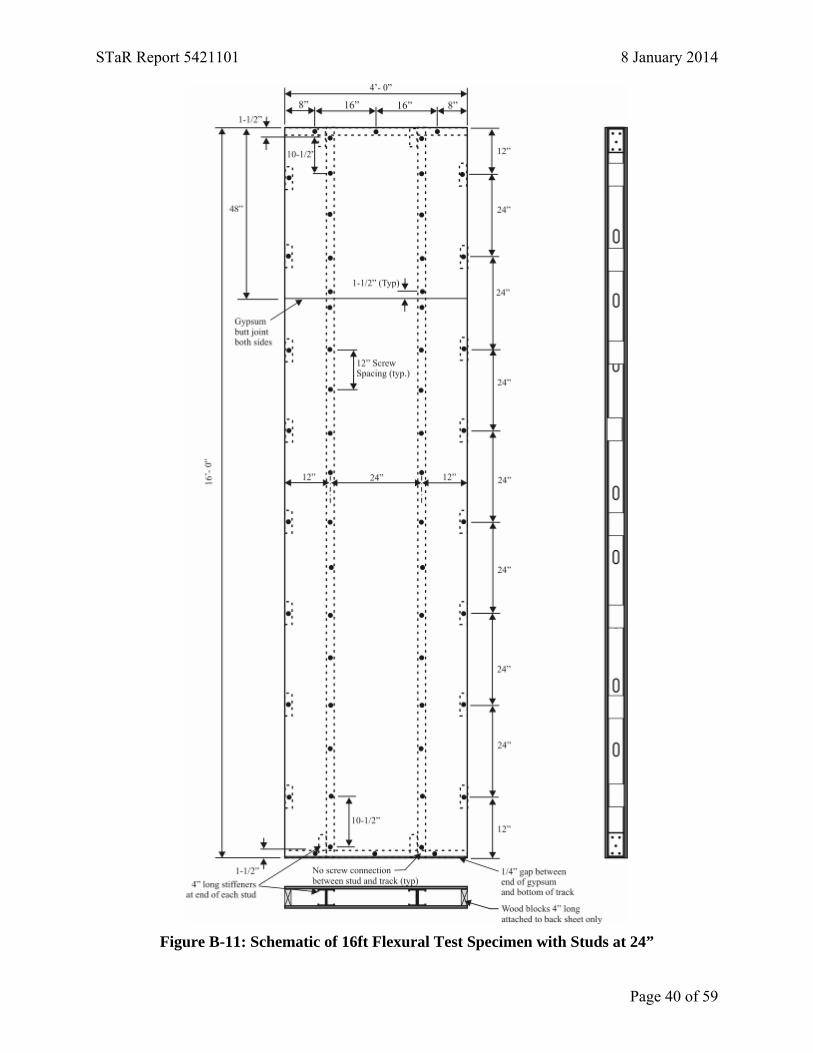
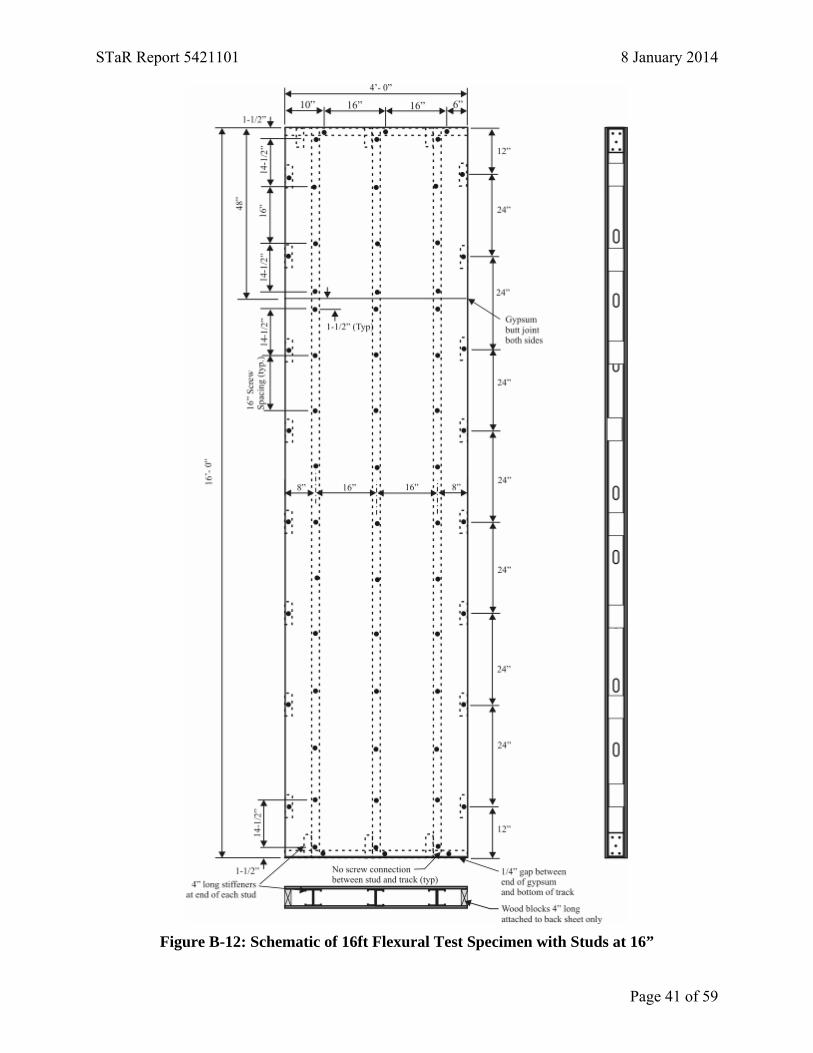
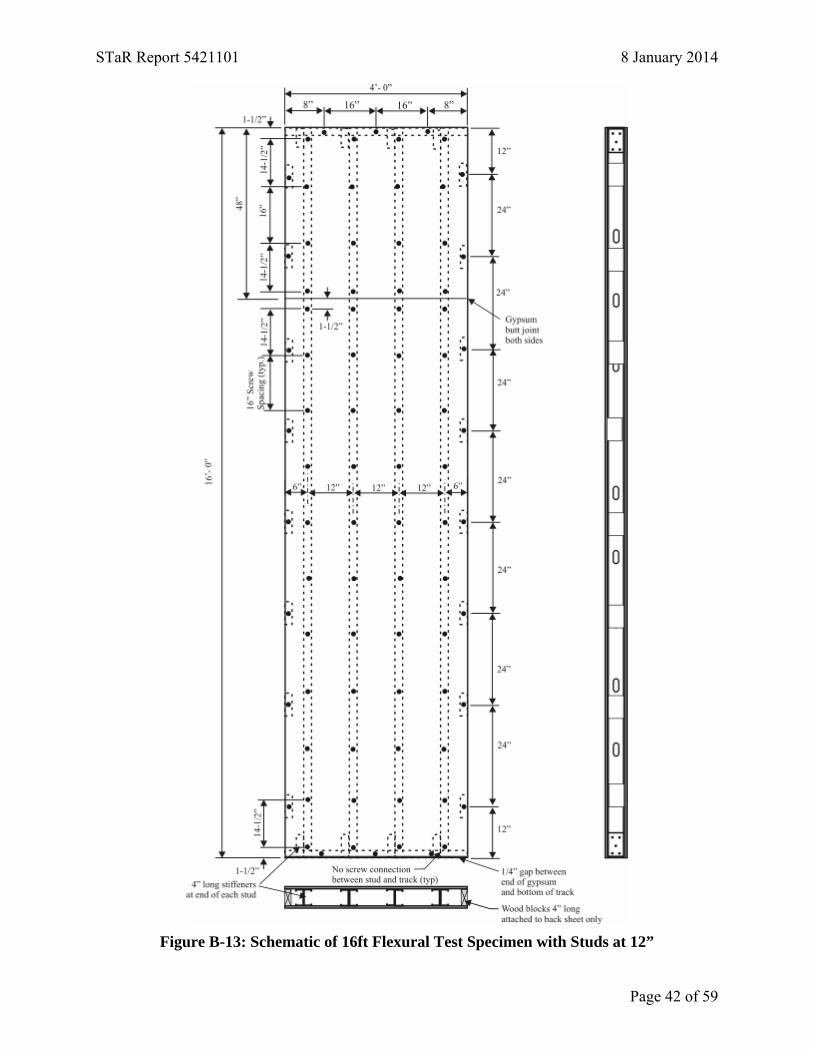
4.5 Fabrication of Test Specimens The test specimens were constructed to simulate field conditions. The spacing of the studs and attachment of the drywall is detailed in Appendix B for each wall panel configuration. The studs were not connected to the track before the gypsum board was applied. For the 4 ft. panels intended for the end reaction load tests, a ¼” gap was maintained between the end of the stud and the web of the track. The extra elements supporting the cantilevered edges were 4 in. long blocks of wood. These blocks were connected only to the drywall sheet on the back of the specimen with one screw. The studs were orientated in the same direction for all specimens. 4.6 Specimen Loading Procedure The following procedure was used to carry out the transverse wall tests: 1. Initialize (set to zero) the readings from all LDTs. Set the data acquisition system to display
the average mid-span deflection of all studs minus the average deflection at the lower supports. Have the DAQ configured to display peak vacuum to record the failure pressure.
2. Calculate the target deflection readings based on the required deflection limit states (e.g. 0.258 in. for L/360 of an actual span of 7.75’).
3. Ensure that the valve is open (bypassing the vacuum box) before starting the vacuum. Begin applying the load slowly and continuously while monitoring pressure and deflection.
4. Load to L/1200 target (pre-load) deflection limit. Record pressure (transducer) and deflection readings.
5. Remove the vacuum and record pressure and deflection readings. 6. Load to L/360 target deflection limit. Record pressure (transducer) and deflection reading at
initial loading. Hold pressure constant for 5 minutes and then record pressure and deflection readings again.
7. Remove the vacuum and unload the specimen. Immediately record pressure and deflection readings and then again after 5 minutes.
8. Repeat for the first specimen to L/240, L/180 and L/120 target deflection limits. If the specimen is able to reach the L/120 deflection limit without failing, the procedure is changed to skip the L/180 deflection limit on the following two specimens.
9. After unloading from the maximum deflection limit, load slowly to failure. Record maximum pressure.
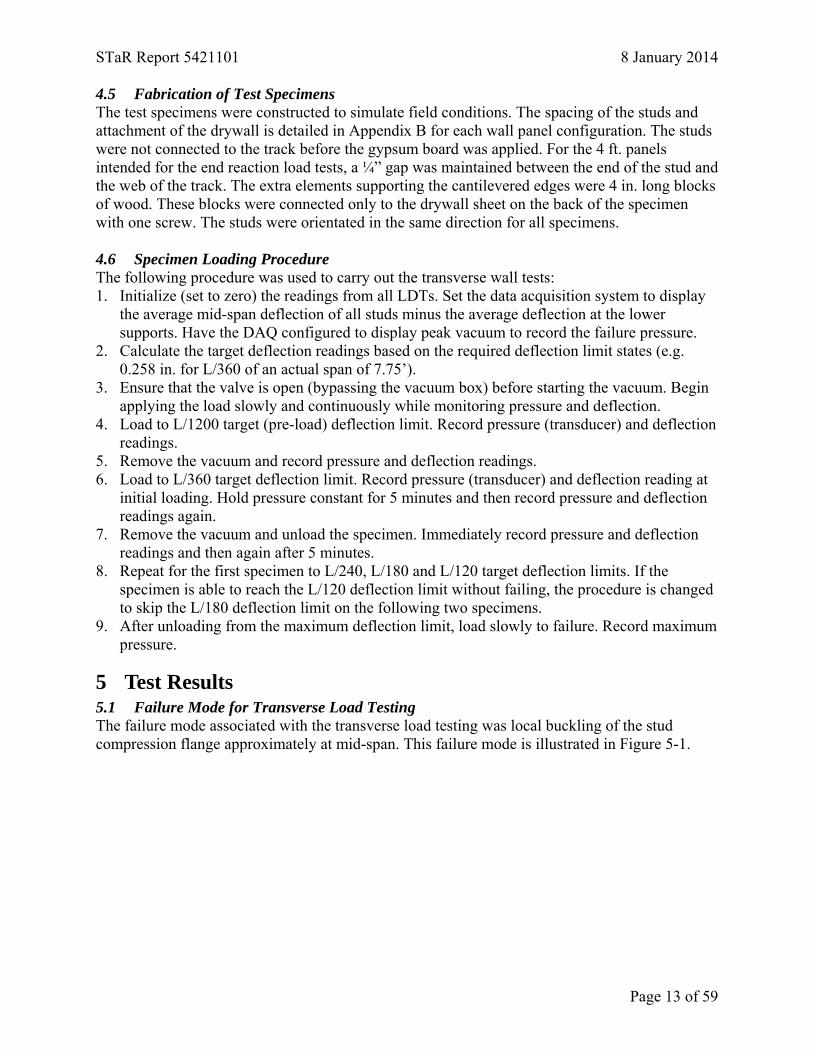
5 Test Results 5.1 Failure Mode for Transverse Load Testing The failure mode associated with the transverse load testing was local buckling of the stud compression flange approximately at mid-span. This failure mode is illustrated in Figure 5-1.
STaR Report 5421101 8 January 2014
Page 14 of 59
Figure 5-1: Local Buckling Failure in Transverse Loading Tests
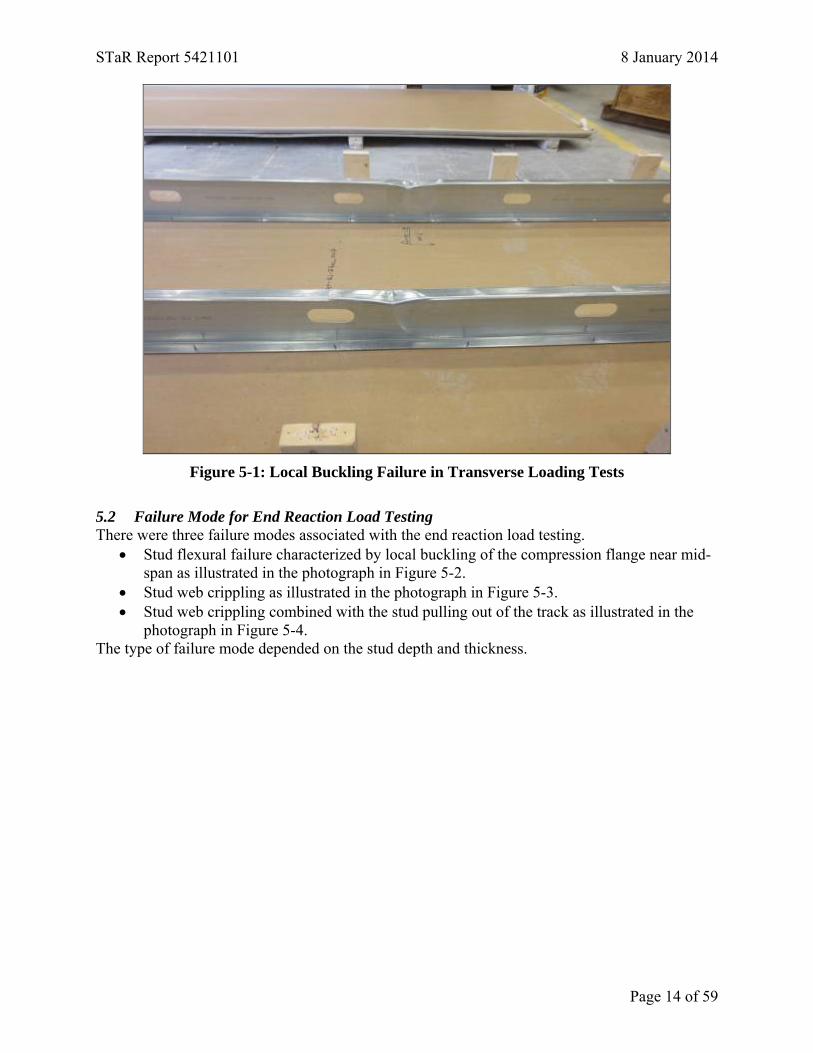
5.2 Failure Mode for End Reaction Load Testing There were three failure modes associated with the end reaction load testing.
• Stud flexural failure characterized by local buckling of the compression flange near mid-span as illustrated in the photograph in Figure 5-2.
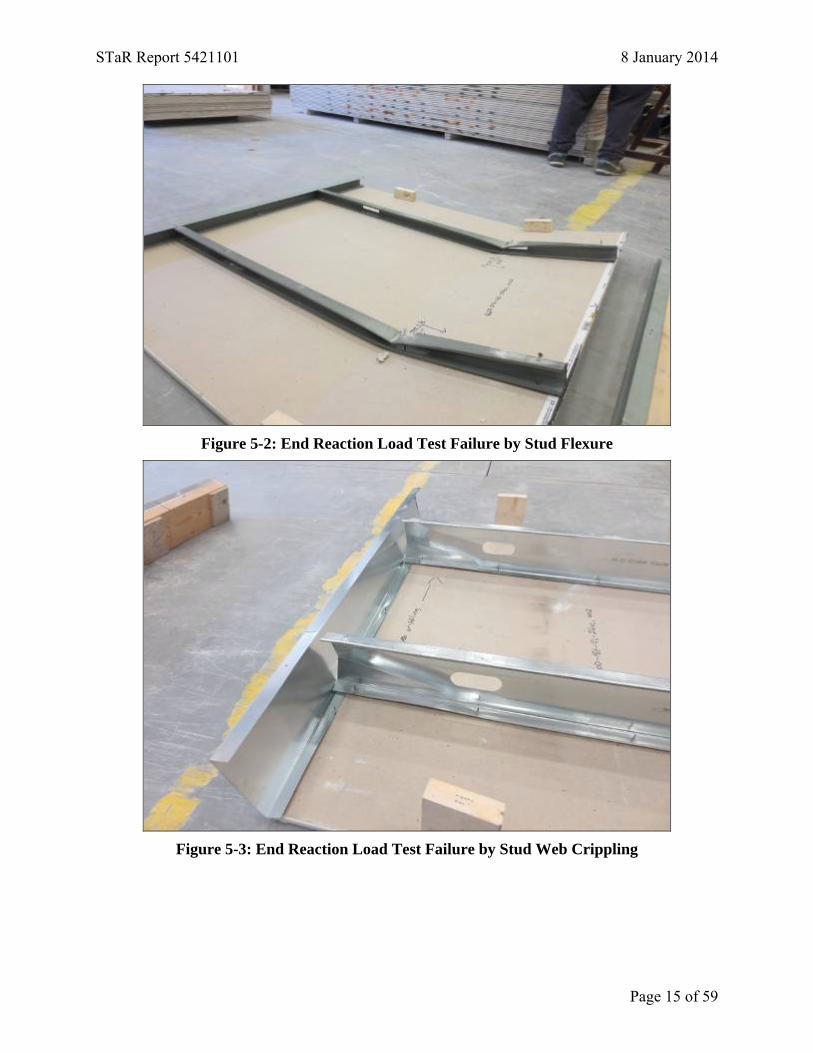
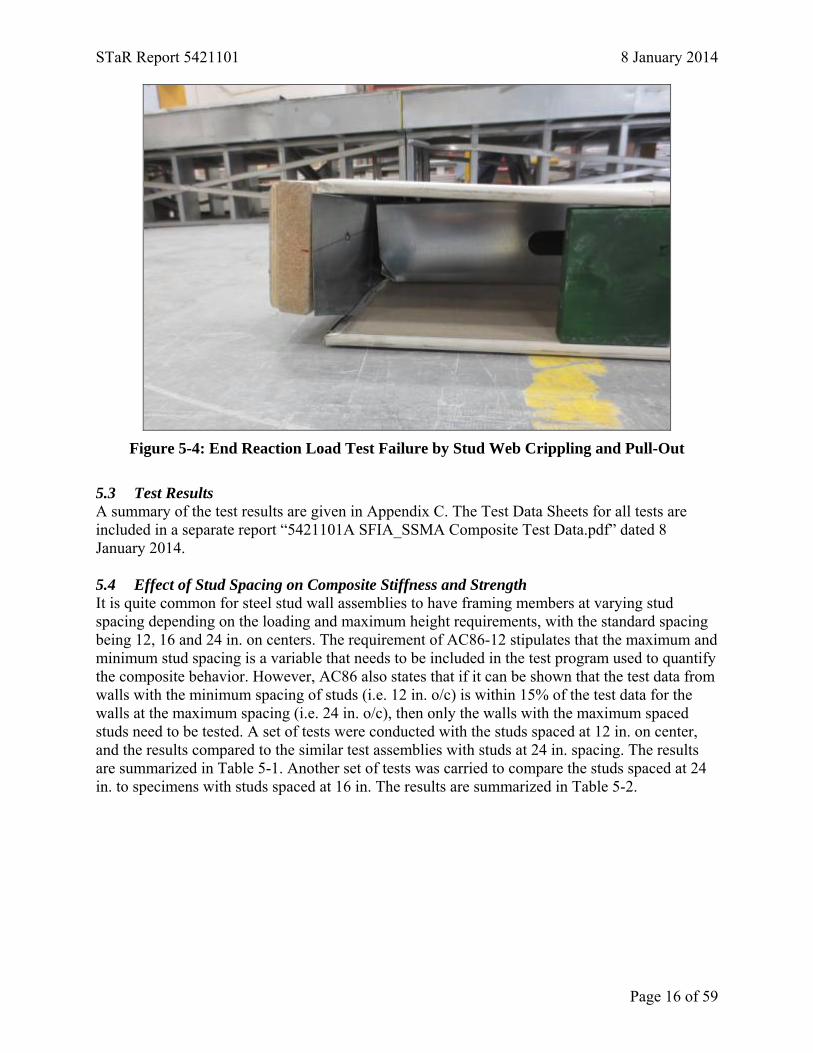
• Stud web crippling as illustrated in the photograph in Figure 5-3. • Stud web crippling combined with the stud pulling out of the track as illustrated in the
photograph in Figure 5-4. The type of failure mode depended on the stud depth and thickness.
STaR Report 5421101 8 January 2014
Page 15 of 59
Figure 5-2: End Reaction Load Test Failure by Stud Flexure
Figure 5-3: End Reaction Load Test Failure by Stud Web Crippling
STaR Report 5421101 8 January 2014
Page 16 of 59
Figure 5-4: End Reaction Load Test Failure by Stud Web Crippling and Pull-Out
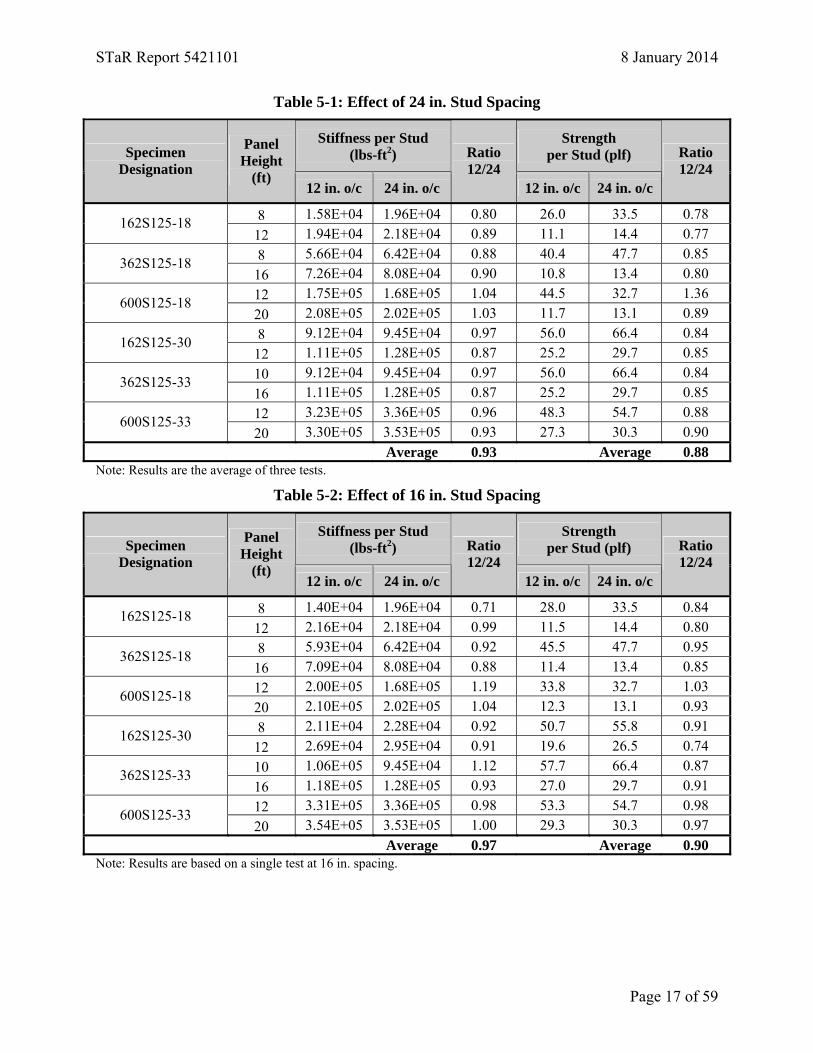
5.3 Test Results A summary of the test results are given in Appendix C. The Test Data Sheets for all tests are included in a separate report “5421101A SFIA_SSMA Composite Test Data.pdf” dated 8 January 2014. 5.4 Effect of Stud Spacing on Composite Stiffness and Strength It is quite common for steel stud wall assemblies to have framing members at varying stud spacing depending on the loading and maximum height requirements, with the standard spacing being 12, 16 and 24 in. on centers. The requirement of AC86-12 stipulates that the maximum and minimum stud spacing is a variable that needs to be included in the test program used to quantify the composite behavior. However, AC86 also states that if it can be shown that the test data from walls with the minimum spacing of studs (i.e. 12 in. o/c) is within 15% of the test data for the walls at the maximum spacing (i.e. 24 in. o/c), then only the walls with the maximum spaced studs need to be tested. A set of tests were conducted with the studs spaced at 12 in. on center, and the results compared to the similar test assemblies with studs at 24 in. spacing. The results are summarized in Table 5-1. Another set of tests was carried to compare the studs spaced at 24 in. to specimens with studs spaced at 16 in. The results are summarized in Table 5-2.
STaR Report 5421101 8 January 2014
Page 17 of 59
Table 5-1: Effect of 24 in. Stud Spacing
Stiffness per Stud (lbs-ft2)
Strength per Stud (plf) Specimen
Designation
Panel Height
(ft) 12 in. o/c 24 in. o/c
Ratio 12/24
12 in. o/c 24 in. o/c
Ratio 12/24
8 1.58E+04 1.96E+04 0.80 26.0 33.5 0.78 162S125-18 12 1.94E+04 2.18E+04 0.89 11.1 14.4 0.77 8 5.66E+04 6.42E+04 0.88 40.4 47.7 0.85 362S125-18
16 7.26E+04 8.08E+04 0.90 10.8 13.4 0.80 12 1.75E+05 1.68E+05 1.04 44.5 32.7 1.36 600S125-18 20 2.08E+05 2.02E+05 1.03 11.7 13.1 0.89 8 9.12E+04 9.45E+04 0.97 56.0 66.4 0.84 162S125-30
12 1.11E+05 1.28E+05 0.87 25.2 29.7 0.85 10 9.12E+04 9.45E+04 0.97 56.0 66.4 0.84 362S125-33 16 1.11E+05 1.28E+05 0.87 25.2 29.7 0.85 12 3.23E+05 3.36E+05 0.96 48.3 54.7 0.88 600S125-33 20 3.30E+05 3.53E+05 0.93 27.3 30.3 0.90
Average 0.93 Average 0.88 Note: Results are the average of three tests.
Table 5-2: Effect of 16 in. Stud Spacing
Stiffness per Stud (lbs-ft2)
Strength per Stud (plf) Specimen
Designation
Panel Height
(ft) 12 in. o/c 24 in. o/c
Ratio 12/24
12 in. o/c 24 in. o/c
Ratio 12/24
8 1.40E+04 1.96E+04 0.71 28.0 33.5 0.84 162S125-18 12 2.16E+04 2.18E+04 0.99 11.5 14.4 0.80 8 5.93E+04 6.42E+04 0.92 45.5 47.7 0.95 362S125-18
16 7.09E+04 8.08E+04 0.88 11.4 13.4 0.85 12 2.00E+05 1.68E+05 1.19 33.8 32.7 1.03 600S125-18 20 2.10E+05 2.02E+05 1.04 12.3 13.1 0.93 8 2.11E+04 2.28E+04 0.92 50.7 55.8 0.91 162S125-30
12 2.69E+04 2.95E+04 0.91 19.6 26.5 0.74 10 1.06E+05 9.45E+04 1.12 57.7 66.4 0.87 362S125-33 16 1.18E+05 1.28E+05 0.93 27.0 29.7 0.91 12 3.31E+05 3.36E+05 0.98 53.3 54.7 0.98 600S125-33 20 3.54E+05 3.53E+05 1.00 29.3 30.3 0.97
Average 0.97 Average 0.90 Note: Results are based on a single test at 16 in. spacing.
STaR Report 5421101 8 January 2014
Page 18 of 59
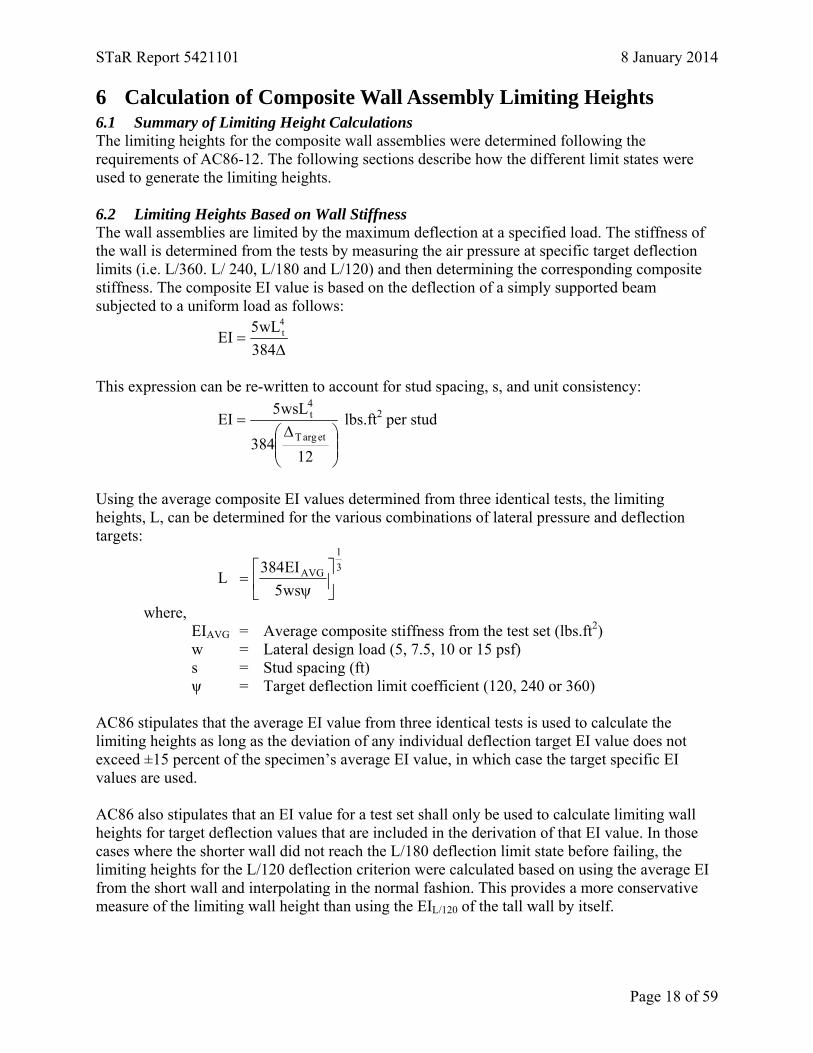
6 Calculation of Composite Wall Assembly Limiting Heights 6.1 Summary of Limiting Height Calculations The limiting heights for the composite wall assemblies were determined following the requirements of AC86-12. The following sections describe how the different limit states were used to generate the limiting heights. 6.2 Limiting Heights Based on Wall Stiffness The wall assemblies are limited by the maximum deflection at a specified load. The stiffness of the wall is determined from the tests by measuring the air pressure at specific target deflection limits (i.e. L/360. L/ 240, L/180 and L/120) and then determining the corresponding composite stiffness. The composite EI value is based on the deflection of a simply supported beam subjected to a uniform load as follows:
Δ
=384wL5
EI4t
This expression can be re-written to account for stud spacing, s, and unit consistency:
⎟⎟⎠
⎞⎜⎜⎝
⎛ Δ=
12384
wsL5EI
etargT
4t lbs.ft2 per stud
Using the average composite EI values determined from three identical tests, the limiting heights, L, can be determined for the various combinations of lateral pressure and deflection targets:
31
AVG
ws5EI384
L ⎥⎦
⎤⎢⎣
⎡ψ
=
where, EIAVG = Average composite stiffness from the test set (lbs.ft2) w = Lateral design load (5, 7.5, 10 or 15 psf) s = Stud spacing (ft) ψ = Target deflection limit coefficient (120, 240 or 360) AC86 stipulates that the average EI value from three identical tests is used to calculate the limiting heights as long as the deviation of any individual deflection target EI value does not exceed ±15 percent of the specimen’s average EI value, in which case the target specific EI values are used. AC86 also stipulates that an EI value for a test set shall only be used to calculate limiting wall heights for target deflection values that are included in the derivation of that EI value. In those cases where the shorter wall did not reach the L/180 deflection limit state before failing, the limiting heights for the L/120 deflection criterion were calculated based on using the average EI from the short wall and interpolating in the normal fashion. This provides a more conservative measure of the limiting wall height than using the EIL/120 of the tall wall by itself.
STaR Report 5421101 8 January 2014
Page 19 of 59
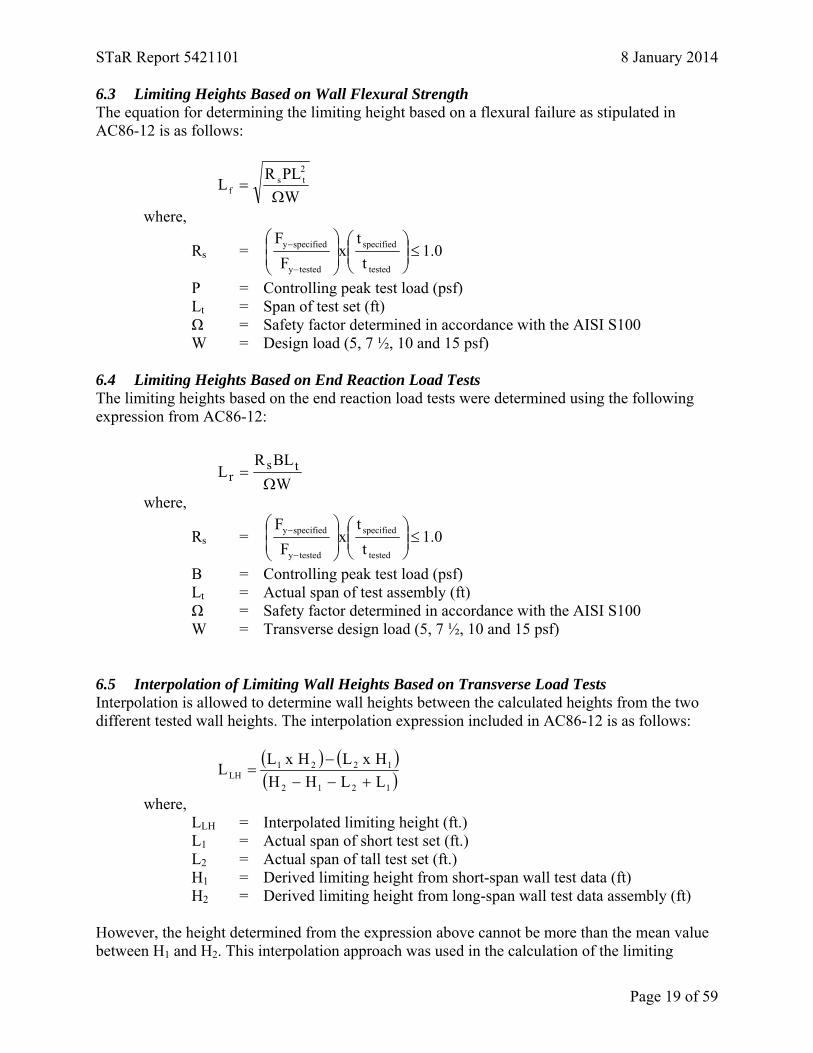
6.3 Limiting Heights Based on Wall Flexural Strength The equation for determining the limiting height based on a flexural failure as stipulated in AC86-12 is as follows:
WPLR
L2ts
f Ω=
where,
Rs = 0.1t
tx
FF
tested
specified
testedy
specifiedy ≤⎟⎟⎠
⎞⎜⎜⎝
⎛⎟⎟⎠
⎞⎜⎜⎝
⎛
−
−
P = Controlling peak test load (psf) Lt = Span of test set (ft) Ω = Safety factor determined in accordance with the AISI S100 W = Design load (5, 7 ½, 10 and 15 psf) 6.4 Limiting Heights Based on End Reaction Load Tests The limiting heights based on the end reaction load tests were determined using the following expression from AC86-12:
WBLR
L tsr Ω=
where,
Rs = 0.1t
tx
FF
tested
specified
testedy
specifiedy ≤⎟⎟⎠
⎞⎜⎜⎝
⎛⎟⎟⎠
⎞⎜⎜⎝
⎛
−
−
B = Controlling peak test load (psf) Lt = Actual span of test assembly (ft) Ω = Safety factor determined in accordance with the AISI S100 W = Transverse design load (5, 7 ½, 10 and 15 psf) 6.5 Interpolation of Limiting Wall Heights Based on Transverse Load Tests Interpolation is allowed to determine wall heights between the calculated heights from the two different tested wall heights. The interpolation expression included in AC86-12 is as follows:
( ) ( )( )1212
1221LH LLHH
HxLHxLL+−−
−=
where, LLH = Interpolated limiting height (ft.) L1 = Actual span of short test set (ft.) L2 = Actual span of tall test set (ft.) H1 = Derived limiting height from short-span wall test data (ft) H2 = Derived limiting height from long-span wall test data assembly (ft) However, the height determined from the expression above cannot be more than the mean value between H1 and H2. This interpolation approach was used in the calculation of the limiting
STaR Report 5421101 8 January 2014
Page 20 of 59
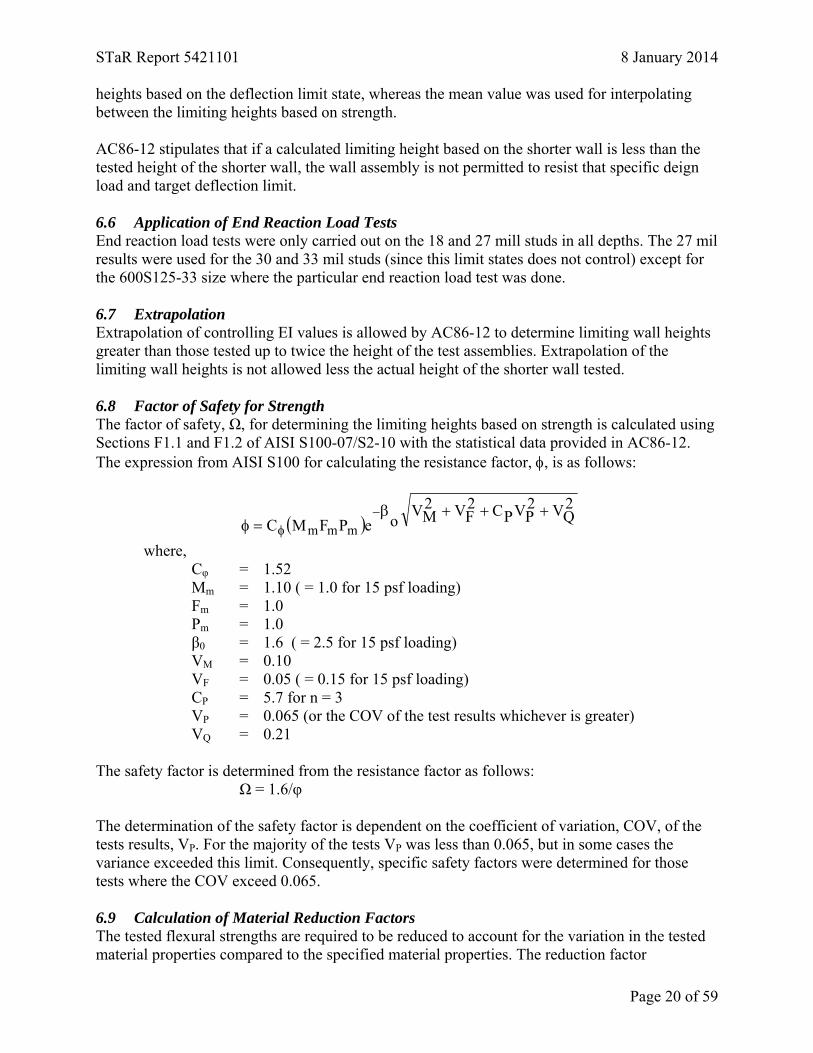
heights based on the deflection limit state, whereas the mean value was used for interpolating between the limiting heights based on strength. AC86-12 stipulates that if a calculated limiting height based on the shorter wall is less than the tested height of the shorter wall, the wall assembly is not permitted to resist that specific deign load and target deflection limit. 6.6 Application of End Reaction Load Tests End reaction load tests were only carried out on the 18 and 27 mill studs in all depths. The 27 mil results were used for the 30 and 33 mil studs (since this limit states does not control) except for the 600S125-33 size where the particular end reaction load test was done. 6.7 Extrapolation Extrapolation of controlling EI values is allowed by AC86-12 to determine limiting wall heights greater than those tested up to twice the height of the test assemblies. Extrapolation of the limiting wall heights is not allowed less the actual height of the shorter wall tested. 6.8 Factor of Safety for Strength The factor of safety, Ω, for determining the limiting heights based on strength is calculated using Sections F1.1 and F1.2 of AISI S100-07/S2-10 with the statistical data provided in AC86-12. The expression from AISI S100 for calculating the resistance factor, φ, is as follows:
( )2QV2
PVPC2FV2
MVoePFMC mmm+++β
=φ−
φ where, Cφ = 1.52 Mm = 1.10 ( = 1.0 for 15 psf loading) Fm = 1.0 Pm = 1.0 β0 = 1.6 ( = 2.5 for 15 psf loading) VM = 0.10 VF = 0.05 ( = 0.15 for 15 psf loading) CP = 5.7 for n = 3 VP = 0.065 (or the COV of the test results whichever is greater) VQ = 0.21 The safety factor is determined from the resistance factor as follows: Ω = 1.6/φ The determination of the safety factor is dependent on the coefficient of variation, COV, of the tests results, VP. For the majority of the tests VP was less than 0.065, but in some cases the variance exceeded this limit. Consequently, specific safety factors were determined for those tests where the COV exceed 0.065. 6.9 Calculation of Material Reduction Factors The tested flexural strengths are required to be reduced to account for the variation in the tested material properties compared to the specified material properties. The reduction factor
STaR Report 5421101 8 January 2014
Page 21 of 59
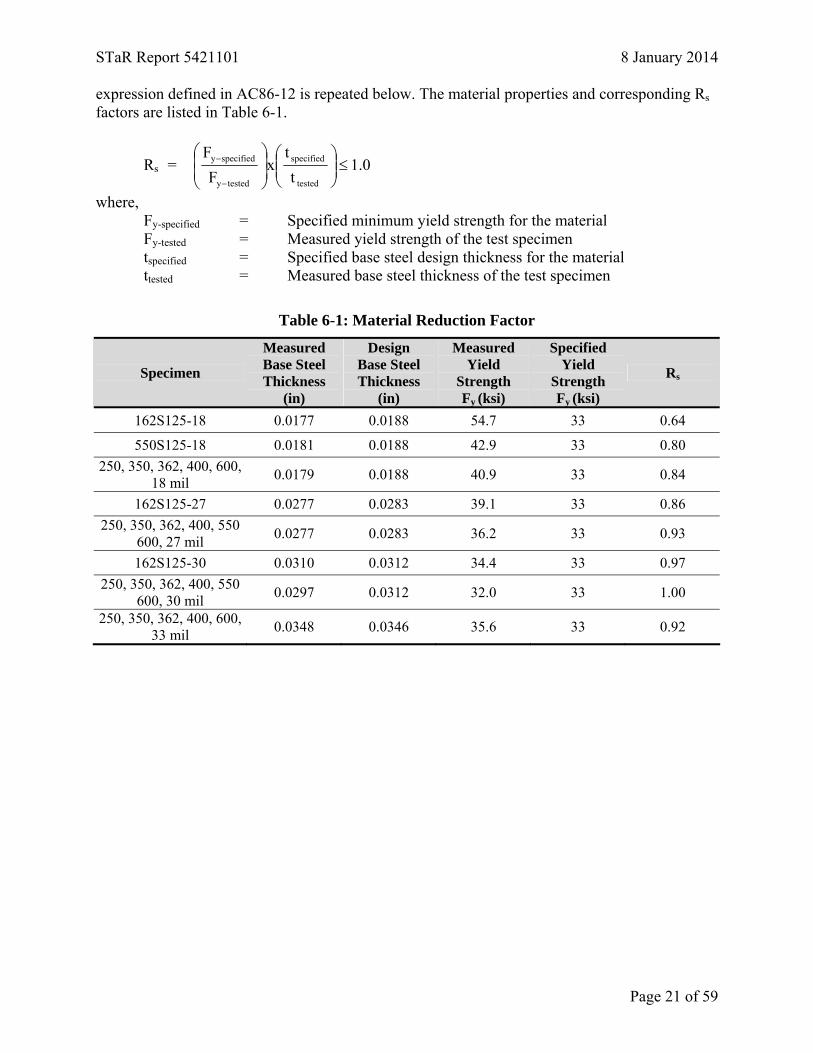
expression defined in AC86-12 is repeated below. The material properties and corresponding Rs factors are listed in Table 6-1.
Rs = 0.1t
tx
FF
tested
specified
testedy
specifiedy ≤⎟⎟⎠
⎞⎜⎜⎝
⎛⎟⎟⎠
⎞⎜⎜⎝
⎛
−
−
where, Fy-specified = Specified minimum yield strength for the material Fy-tested = Measured yield strength of the test specimen tspecified = Specified base steel design thickness for the material ttested = Measured base steel thickness of the test specimen
Table 6-1: Material Reduction Factor
Specimen
Measured Base Steel Thickness
(in)
Design Base Steel Thickness
(in)
Measured Yield
Strength Fy (ksi)
Specified Yield
Strength Fy (ksi)
Rs
162S125-18 0.0177 0.0188 54.7 33 0.64
550S125-18 0.0181 0.0188 42.9 33 0.80 250, 350, 362, 400, 600,
18 mil 0.0179 0.0188 40.9 33 0.84
162S125-27 0.0277 0.0283 39.1 33 0.86 250, 350, 362, 400, 550
600, 27 mil 0.0277 0.0283 36.2 33 0.93
162S125-30 0.0310 0.0312 34.4 33 0.97 250, 350, 362, 400, 550
600, 30 mil 0.0297 0.0312 32.0 33 1.00
250, 350, 362, 400, 600, 33 mil 0.0348 0.0346 35.6 33 0.92
STaR Report 5421101 8 January 2014
Page 22 of 59
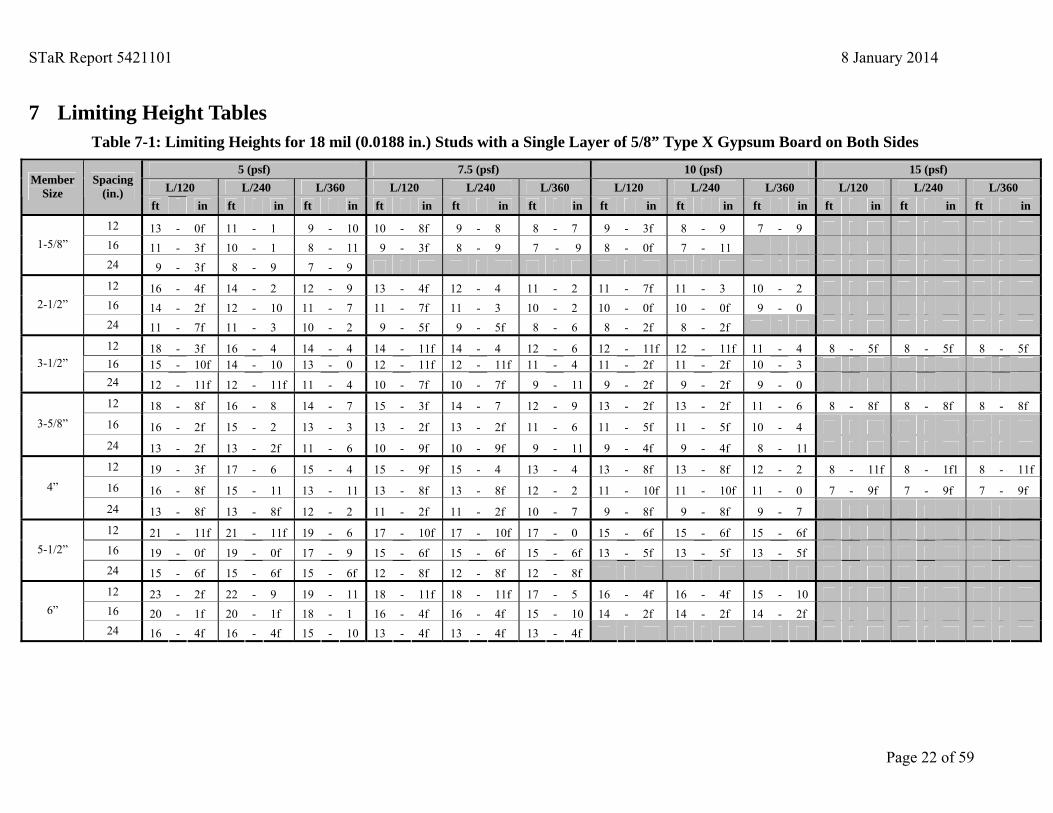
7 Limiting Height Tables Table 7-1: Limiting Heights for 18 mil (0.0188 in.) Studs with a Single Layer of 5/8” Type X Gypsum Board on Both Sides
5 (psf) 7.5 (psf) 10 (psf) 15 (psf) L/120 L/240 L/360 L/120 L/240 L/360 L/120 L/240 L/360 L/120 L/240 L/360
Member Size
Spacing (in.)
ft in ft in ft in ft in ft in ft in ft in ft in ft in ft in ft in ft in
12 13 - 0f 11 - 1 9 - 10 10 - 8f 9 - 8 8 - 7 9 - 3f 8 - 9 7 - 9 16 11 - 3f 10 - 1 8 - 11 9 - 3f 8 - 9 7 - 9 8 - 0f 7 - 11 1-5/8”
24 9 - 3f 8 - 9 7 - 9 12 16 - 4f 14 - 2 12 - 9 13 - 4f 12 - 4 11 - 2 11 - 7f 11 - 3 10 - 2 16 14 - 2f 12 - 10 11 - 7 11 - 7f 11 - 3 10 - 2 10 - 0f 10 - 0f 9 - 0 2-1/2”
24 11 - 7f 11 - 3 10 - 2 9 - 5f 9 - 5f 8 - 6 8 - 2f 8 - 2f 12 18 - 3f 16 - 4 14 - 4 14 - 11f 14 - 4 12 - 6 12 - 11f 12 - 11f 11 - 4 8 - 5f 8 - 5f 8 - 5f 16 15 - 10f 14 - 10 13 - 0 12 - 11f 12 - 11f 11 - 4 11 - 2f 11 - 2f 10 - 3 3-1/2” 24 12 - 11f 12 - 11f 11 - 4 10 - 7f 10 - 7f 9 - 11 9 - 2f 9 - 2f 9 - 0 12 18 - 8f 16 - 8 14 - 7 15 - 3f 14 - 7 12 - 9 13 - 2f 13 - 2f 11 - 6 8 - 8f 8 - 8f 8 - 8f 16 16 - 2f 15 - 2 13 - 3 13 - 2f 13 - 2f 11 - 6 11 - 5f 11 - 5f 10 - 4 3-5/8”
24 13 - 2f 13 - 2f 11 - 6 10 - 9f 10 - 9f 9 - 11 9 - 4f 9 - 4f 8 - 11 12 19 - 3f 17 - 6 15 - 4 15 - 9f 15 - 4 13 - 4 13 - 8f 13 - 8f 12 - 2 8 - 11f 8 - 1f1 8 - 11f 16 16 - 8f 15 - 11 13 - 11 13 - 8f 13 - 8f 12 - 2 11 - 10f 11 - 10f 11 - 0 7 - 9f 7 - 9f 7 - 9f 4”
24 13 - 8f 13 - 8f 12 - 2 11 - 2f 11 - 2f 10 - 7 9 - 8f 9 - 8f 9 - 7 12 21 - 11f 21 - 11f 19 - 6 17 - 10f 17 - 10f 17 - 0 15 - 6f 15 - 6f 15 - 6f 16 19 - 0f 19 - 0f 17 - 9 15 - 6f 15 - 6f 15 - 6f 13 - 5f 13 - 5f 13 - 5f 5-1/2”
24 15 - 6f 15 - 6f 15 - 6f 12 - 8f 12 - 8f 12 - 8f 12 23 - 2f 22 - 9 19 - 11 18 - 11f 18 - 11f 17 - 5 16 - 4f 16 - 4f 15 - 10 16 20 - 1f 20 - 1f 18 - 1 16 - 4f 16 - 4f 15 - 10 14 - 2f 14 - 2f 14 - 2f 6”
24 16 - 4f 16 - 4f 15 - 10 13 - 4f 13 - 4f 13 - 4f
STaR Report 5421101 8 January 2014
Page 23 of 59
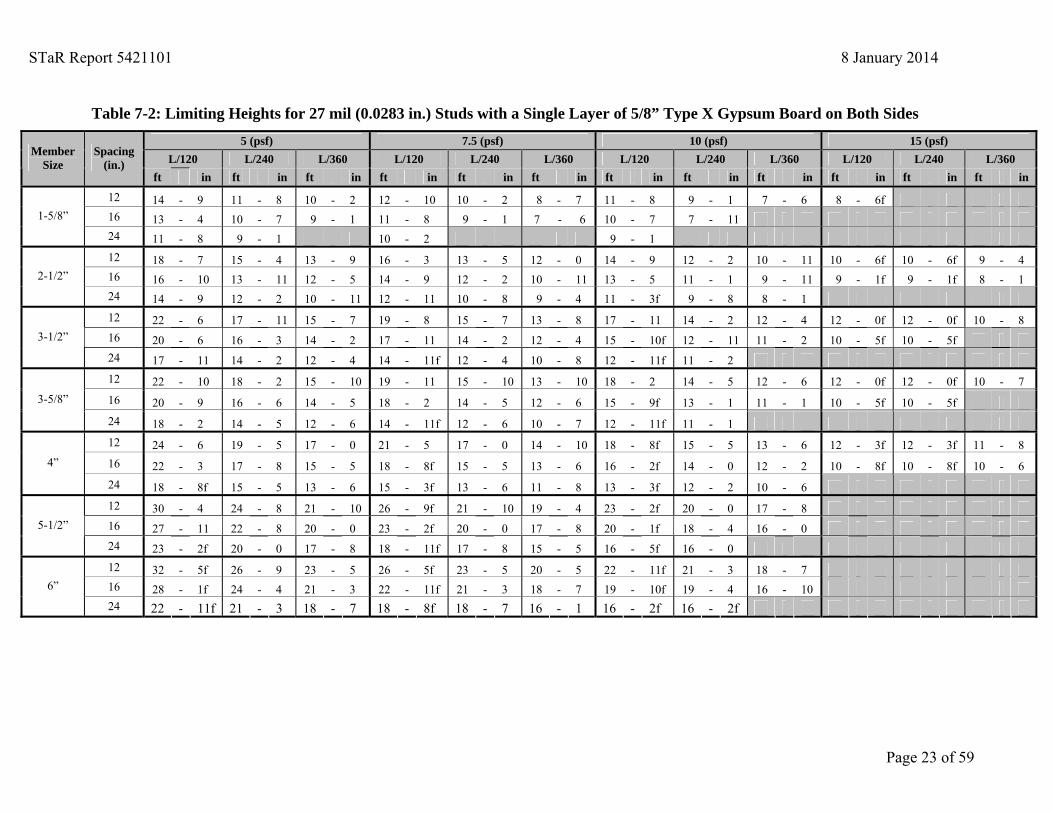
Table 7-2: Limiting Heights for 27 mil (0.0283 in.) Studs with a Single Layer of 5/8” Type X Gypsum Board on Both Sides
5 (psf) 7.5 (psf) 10 (psf) 15 (psf) L/120 L/240 L/360 L/120 L/240 L/360 L/120 L/240 L/360 L/120 L/240 L/360
Member Size
Spacing (in.)
ft in ft in ft in ft in ft in ft in ft in ft in ft in ft in ft in ft in
12 14 - 9 11 - 8 10 - 2 12 - 10 10 - 2 8 - 7 11 - 8 9 - 1 7 - 6 8 - 6f 16 13 - 4 10 - 7 9 - 1 11 - 8 9 - 1 7 - 6 10 - 7 7 - 11 1-5/8”
24 11 - 8 9 - 1 10 - 2 9 - 1 12 18 - 7 15 - 4 13 - 9 16 - 3 13 - 5 12 - 0 14 - 9 12 - 2 10 - 11 10 - 6f 10 - 6f 9 - 4 16 16 - 10 13 - 11 12 - 5 14 - 9 12 - 2 10 - 11 13 - 5 11 - 1 9 - 11 9 - 1f 9 - 1f 8 - 1 2-1/2”
24 14 - 9 12 - 2 10 - 11 12 - 11 10 - 8 9 - 4 11 - 3f 9 - 8 8 - 1 12 22 - 6 17 - 11 15 - 7 19 - 8 15 - 7 13 - 8 17 - 11 14 - 2 12 - 4 12 - 0f 12 - 0f 10 - 8 16 20 - 6 16 - 3 14 - 2 17 - 11 14 - 2 12 - 4 15 - 10f 12 - 11 11 - 2 10 - 5f 10 - 5f 3-1/2”
24 17 - 11 14 - 2 12 - 4 14 - 11f 12 - 4 10 - 8 12 - 11f 11 - 2 12 22 - 10 18 - 2 15 - 10 19 - 11 15 - 10 13 - 10 18 - 2 14 - 5 12 - 6 12 - 0f 12 - 0f 10 - 7 16 20 - 9 16 - 6 14 - 5 18 - 2 14 - 5 12 - 6 15 - 9f 13 - 1 11 - 1 10 - 5f 10 - 5f 3-5/8”
24 18 - 2 14 - 5 12 - 6 14 - 11f 12 - 6 10 - 7 12 - 11f 11 - 1 12 24 - 6 19 - 5 17 - 0 21 - 5 17 - 0 14 - 10 18 - 8f 15 - 5 13 - 6 12 - 3f 12 - 3f 11 - 8 16 22 - 3 17 - 8 15 - 5 18 - 8f 15 - 5 13 - 6 16 - 2f 14 - 0 12 - 2 10 - 8f 10 - 8f 10 - 6 4”
24 18 - 8f 15 - 5 13 - 6 15 - 3f 13 - 6 11 - 8 13 - 3f 12 - 2 10 - 6 12 30 - 4 24 - 8 21 - 10 26 - 9f 21 - 10 19 - 4 23 - 2f 20 - 0 17 - 8 16 27 - 11 22 - 8 20 - 0 23 - 2f 20 - 0 17 - 8 20 - 1f 18 - 4 16 - 0 5-1/2”
24 23 - 2f 20 - 0 17 - 8 18 - 11f 17 - 8 15 - 5 16 - 5f 16 - 0 12 32 - 5f 26 - 9 23 - 5 26 - 5f 23 - 5 20 - 5 22 - 11f 21 - 3 18 - 7 16 28 - 1f 24 - 4 21 - 3 22 - 11f 21 - 3 18 - 7 19 - 10f 19 - 4 16 - 10 6”
24 22 - 11f 21 - 3 18 - 7 18 - 8f 18 - 7 16 - 1 16 - 2f 16 - 2f
STaR Report 5421101 8 January 2014
Page 24 of 59
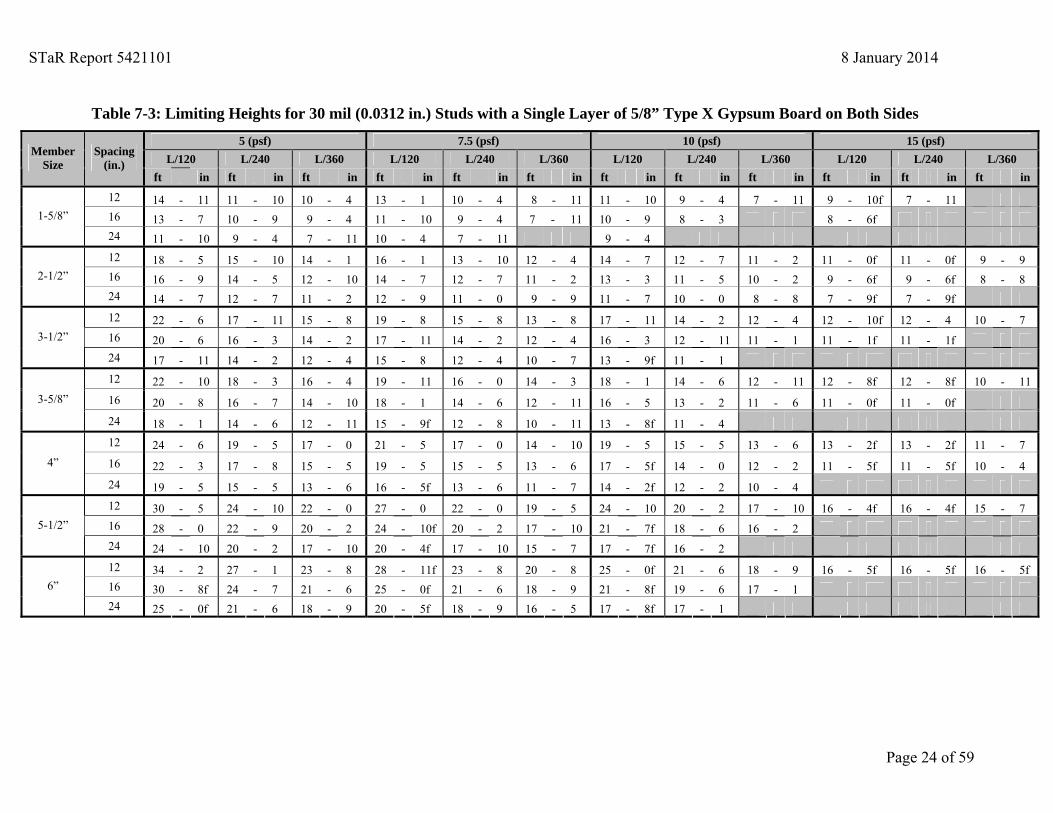
Table 7-3: Limiting Heights for 30 mil (0.0312 in.) Studs with a Single Layer of 5/8” Type X Gypsum Board on Both Sides
5 (psf) 7.5 (psf) 10 (psf) 15 (psf) L/120 L/240 L/360 L/120 L/240 L/360 L/120 L/240 L/360 L/120 L/240 L/360
Member Size
Spacing (in.)
ft in ft in ft in ft in ft in ft in ft in ft in ft in ft in ft in ft in
12 14 - 11 11 - 10 10 - 4 13 - 1 10 - 4 8 - 11 11 - 10 9 - 4 7 - 11 9 - 10f 7 - 11 16 13 - 7 10 - 9 9 - 4 11 - 10 9 - 4 7 - 11 10 - 9 8 - 3 8 - 6f 1-5/8”
24 11 - 10 9 - 4 7 - 11 10 - 4 7 - 11 9 - 4 12 18 - 5 15 - 10 14 - 1 16 - 1 13 - 10 12 - 4 14 - 7 12 - 7 11 - 2 11 - 0f 11 - 0f 9 - 9 16 16 - 9 14 - 5 12 - 10 14 - 7 12 - 7 11 - 2 13 - 3 11 - 5 10 - 2 9 - 6f 9 - 6f 8 - 8 2-1/2”
24 14 - 7 12 - 7 11 - 2 12 - 9 11 - 0 9 - 9 11 - 7 10 - 0 8 - 8 7 - 9f 7 - 9f 12 22 - 6 17 - 11 15 - 8 19 - 8 15 - 8 13 - 8 17 - 11 14 - 2 12 - 4 12 - 10f 12 - 4 10 - 7 16 20 - 6 16 - 3 14 - 2 17 - 11 14 - 2 12 - 4 16 - 3 12 - 11 11 - 1 11 - 1f 11 - 1f 3-1/2”
24 17 - 11 14 - 2 12 - 4 15 - 8 12 - 4 10 - 7 13 - 9f 11 - 1 12 22 - 10 18 - 3 16 - 4 19 - 11 16 - 0 14 - 3 18 - 1 14 - 6 12 - 11 12 - 8f 12 - 8f 10 - 11 16 20 - 8 16 - 7 14 - 10 18 - 1 14 - 6 12 - 11 16 - 5 13 - 2 11 - 6 11 - 0f 11 - 0f 3-5/8”
24 18 - 1 14 - 6 12 - 11 15 - 9f 12 - 8 10 - 11 13 - 8f 11 - 4 12 24 - 6 19 - 5 17 - 0 21 - 5 17 - 0 14 - 10 19 - 5 15 - 5 13 - 6 13 - 2f 13 - 2f 11 - 7 16 22 - 3 17 - 8 15 - 5 19 - 5 15 - 5 13 - 6 17 - 5f 14 - 0 12 - 2 11 - 5f 11 - 5f 10 - 4 4”
24 19 - 5 15 - 5 13 - 6 16 - 5f 13 - 6 11 - 7 14 - 2f 12 - 2 10 - 4 12 30 - 5 24 - 10 22 - 0 27 - 0 22 - 0 19 - 5 24 - 10 20 - 2 17 - 10 16 - 4f 16 - 4f 15 - 7 16 28 - 0 22 - 9 20 - 2 24 - 10f 20 - 2 17 - 10 21 - 7f 18 - 6 16 - 2 5-1/2”
24 24 - 10 20 - 2 17 - 10 20 - 4f 17 - 10 15 - 7 17 - 7f 16 - 2 12 34 - 2 27 - 1 23 - 8 28 - 11f 23 - 8 20 - 8 25 - 0f 21 - 6 18 - 9 16 - 5f 16 - 5f 16 - 5f 16 30 - 8f 24 - 7 21 - 6 25 - 0f 21 - 6 18 - 9 21 - 8f 19 - 6 17 - 1 6”
24 25 - 0f 21 - 6 18 - 9 20 - 5f 18 - 9 16 - 5 17 - 8f 17 - 1
STaR Report 5421101 8 January 2014
Page 25 of 59
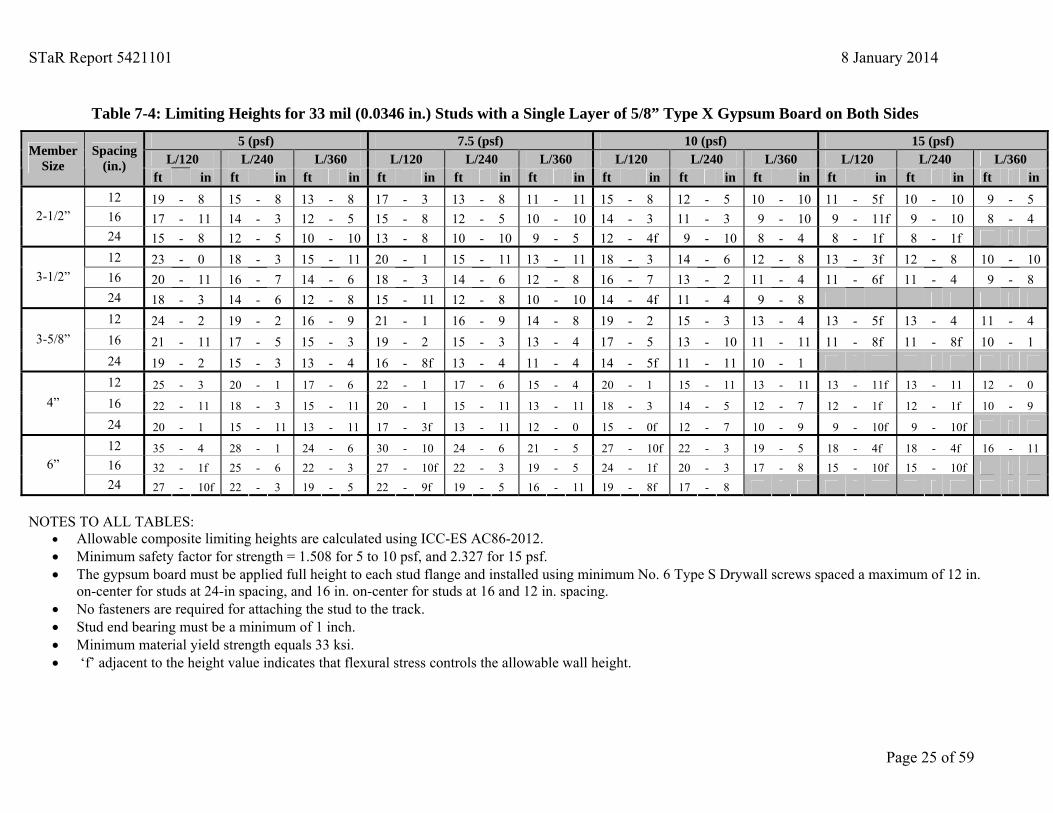
Table 7-4: Limiting Heights for 33 mil (0.0346 in.) Studs with a Single Layer of 5/8” Type X Gypsum Board on Both Sides
5 (psf) 7.5 (psf) 10 (psf) 15 (psf) L/120 L/240 L/360 L/120 L/240 L/360 L/120 L/240 L/360 L/120 L/240 L/360 Member
Size Spacing
(in.) ft in ft in ft in ft in ft in ft in ft in ft in ft in ft in ft in ft in
12 19 - 8 15 - 8 13 - 8 17 - 3 13 - 8 11 - 11 15 - 8 12 - 5 10 - 10 11 - 5f 10 - 10 9 - 5 16 17 - 11 14 - 3 12 - 5 15 - 8 12 - 5 10 - 10 14 - 3 11 - 3 9 - 10 9 - 11f 9 - 10 8 - 4 2-1/2” 24 15 - 8 12 - 5 10 - 10 13 - 8 10 - 10 9 - 5 12 - 4f 9 - 10 8 - 4 8 - 1f 8 - 1f 12 23 - 0 18 - 3 15 - 11 20 - 1 15 - 11 13 - 11 18 - 3 14 - 6 12 - 8 13 - 3f 12 - 8 10 - 10 16 20 - 11 16 - 7 14 - 6 18 - 3 14 - 6 12 - 8 16 - 7 13 - 2 11 - 4 11 - 6f 11 - 4 9 - 8 3-1/2” 24 18 - 3 14 - 6 12 - 8 15 - 11 12 - 8 10 - 10 14 - 4f 11 - 4 9 - 8 12 24 - 2 19 - 2 16 - 9 21 - 1 16 - 9 14 - 8 19 - 2 15 - 3 13 - 4 13 - 5f 13 - 4 11 - 4 16 21 - 11 17 - 5 15 - 3 19 - 2 15 - 3 13 - 4 17 - 5 13 - 10 11 - 11 11 - 8f 11 - 8f 10 - 1 3-5/8”
24 19 - 2 15 - 3 13 - 4 16 - 8f 13 - 4 11 - 4 14 - 5f 11 - 11 10 - 1 12 25 - 3 20 - 1 17 - 6 22 - 1 17 - 6 15 - 4 20 - 1 15 - 11 13 - 11 13 - 11f 13 - 11 12 - 0 16 22 - 11 18 - 3 15 - 11 20 - 1 15 - 11 13 - 11 18 - 3 14 - 5 12 - 7 12 - 1f 12 - 1f 10 - 9 4”
24 20 - 1 15 - 11 13 - 11 17 - 3f 13 - 11 12 - 0 15 - 0f 12 - 7 10 - 9 9 - 10f 9 - 10f 12 35 - 4 28 - 1 24 - 6 30 - 10 24 - 6 21 - 5 27 - 10f 22 - 3 19 - 5 18 - 4f 18 - 4f 16 - 11 16 32 - 1f 25 - 6 22 - 3 27 - 10f 22 - 3 19 - 5 24 - 1f 20 - 3 17 - 8 15 - 10f 15 - 10f 6” 24 27 - 10f 22 - 3 19 - 5 22 - 9f 19 - 5 16 - 11 19 - 8f 17 - 8
NOTES TO ALL TABLES:
• Allowable composite limiting heights are calculated using ICC-ES AC86-2012. • Minimum safety factor for strength = 1.508 for 5 to 10 psf, and 2.327 for 15 psf. • The gypsum board must be applied full height to each stud flange and installed using minimum No. 6 Type S Drywall screws spaced a maximum of 12 in.
on-center for studs at 24-in spacing, and 16 in. on-center for studs at 16 and 12 in. spacing. • No fasteners are required for attaching the stud to the track. • Stud end bearing must be a minimum of 1 inch. • Minimum material yield strength equals 33 ksi. • ‘f’ adjacent to the height value indicates that flexural stress controls the allowable wall height.
STaR Report 5421101 8 January 2014
Page 26 of 59
8 Referenced Documents AISI S100-07/S2-10, North American Specification for the Design of Cold-Formed Steel Structural Members with Supplement No. 2, American Iron and Steel Institute, Washington, DC. ASTM A370-12a, Standard Test Methods and Definitions for Mechanical Testing of Steel Products, ASTM International, West Conshohocken, PA. ASTM C473-07, Standard Test Methods for Physical Testing of Gypsum Panel Products, ASTM International, West Conshohocken, PA. ASTM C1396-06a, Standard Specification for Gypsum Board, ASTM International, West Conshohocken, PA. ASTM E72-10, Standard Test Methods of Conducting Strength Tests of Panels for Building Construction, ASTM International, West Conshohocken, PA. ICC AC86-12, Acceptance Criteria for Cold Formed Steel Framing Members – Interior Nonload-bearing Wall Assemblies, International Code Council (ICC), Whittier CA. ICC AC85-09, Acceptance Criteria for Test Reports, International Code Council (ICC), Whittier CA.

STaR Report 5421101 8 January 2014
Page 27 of 59
Appendix A: Test Specimen Verification
STaR Report 5421101 8 January 2014
Page 28 of 59
STaR Report 5421101 8 January 2014
Page 29 of 59
Appendix B: Test Specimen Construction
STaR Report 5421101 8 January 2014
Page 30 of 59
Figure B-1: Schematic of 4ft Flexural Test Specimen with Studs at 24”
STaR Report 5421101 8 January 2014
Page 31 of 59
Figure B-2: Schematic of 8ft Flexural Test Specimen with Studs at 24”
STaR Report 5421101 8 January 2014
Page 32 of 59
Figure B-3: Schematic of 8ft Flexural Test Specimen with Studs at 16”
STaR Report 5421101 8 January 2014
Page 33 of 59
Figure B-4: Schematic of 8ft Flexural Test Specimen with Studs at 12”
STaR Report 5421101 8 January 2014
Page 34 of 59
Figure B-5: Schematic of 10ft Flexural Test Specimen with Studs at 24”
STaR Report 5421101 8 January 2014
Page 35 of 59
Figure B-6: Schematic of 10ft Flexural Test Specimen with Studs at 16”

STaR Report 5421101 8 January 2014
Page 36 of 59
Figure B-7: Schematic of 10ft Flexural Test Specimen with Studs at 12”
STaR Report 5421101 8 January 2014
Page 37 of 59
Figure B-8: Schematic of 12ft Flexural Test Specimen with Studs at 24”
STaR Report 5421101 8 January 2014
Page 38 of 59
Figure B-9: Schematic of 12ft Flexural Test Specimen with Studs at 16”
STaR Report 5421101 8 January 2014
Page 39 of 59
Figure B-10: Schematic of 12ft Flexural Test Specimen with Studs at 12”
STaR Report 5421101 8 January 2014
Page 40 of 59
Figure B-11: Schematic of 16ft Flexural Test Specimen with Studs at 24”
STaR Report 5421101 8 January 2014
Page 41 of 59
Figure B-12: Schematic of 16ft Flexural Test Specimen with Studs at 16”
STaR Report 5421101 8 January 2014
Page 42 of 59
Figure B-13: Schematic of 16ft Flexural Test Specimen with Studs at 12”
STaR Report 5421101 8 January 2014
Page 43 of 59
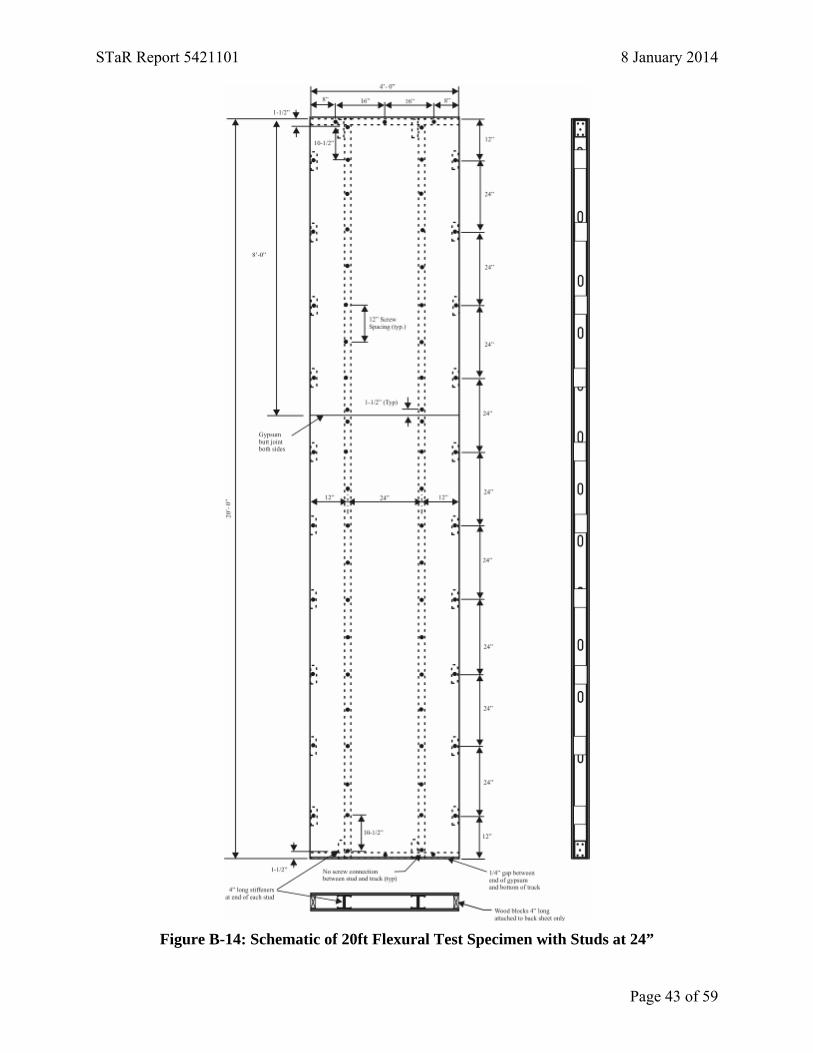
Figure B-14: Schematic of 20ft Flexural Test Specimen with Studs at 24”
STaR Report 5421101 8 January 2014
Page 44 of 59
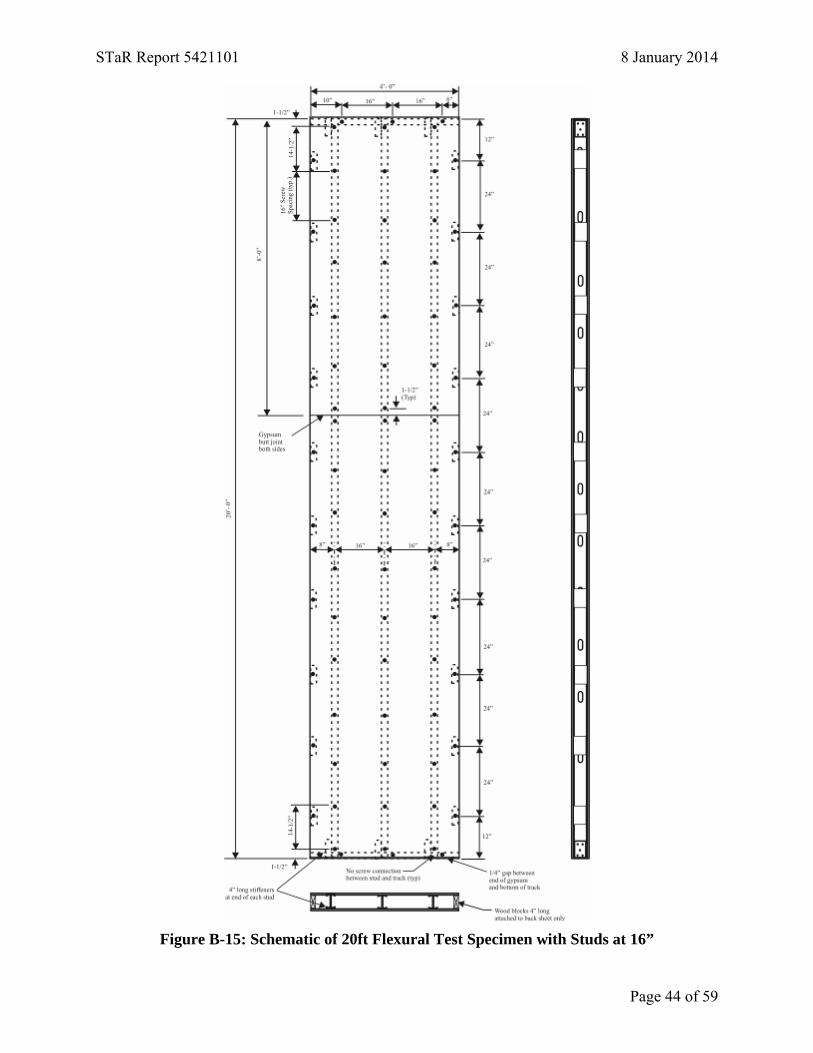
Figure B-15: Schematic of 20ft Flexural Test Specimen with Studs at 16”
STaR Report 5421101 8 January 2014
Page 45 of 59
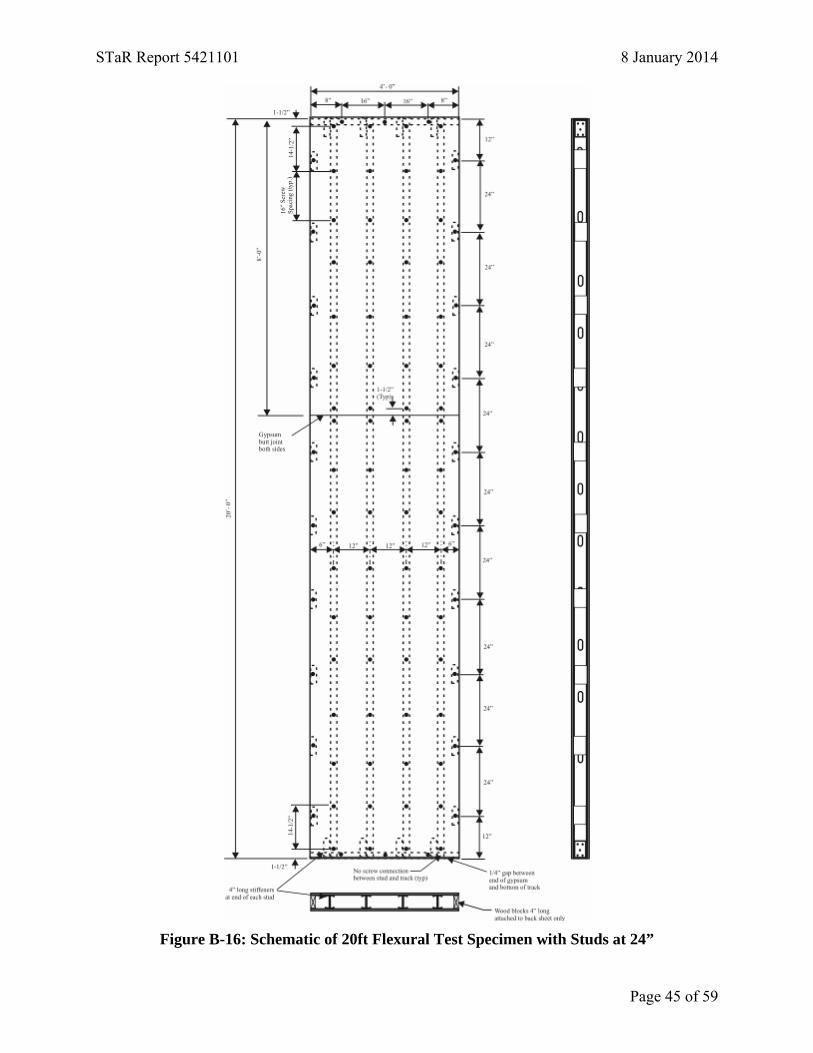
Figure B-16: Schematic of 20ft Flexural Test Specimen with Studs at 24”
STaR Report 5421101 8 January 2014
Page 46 of 59
Appendix C: Summary of Test Results
STaR Report 5421101 8 January 2014
Page 47 of 59
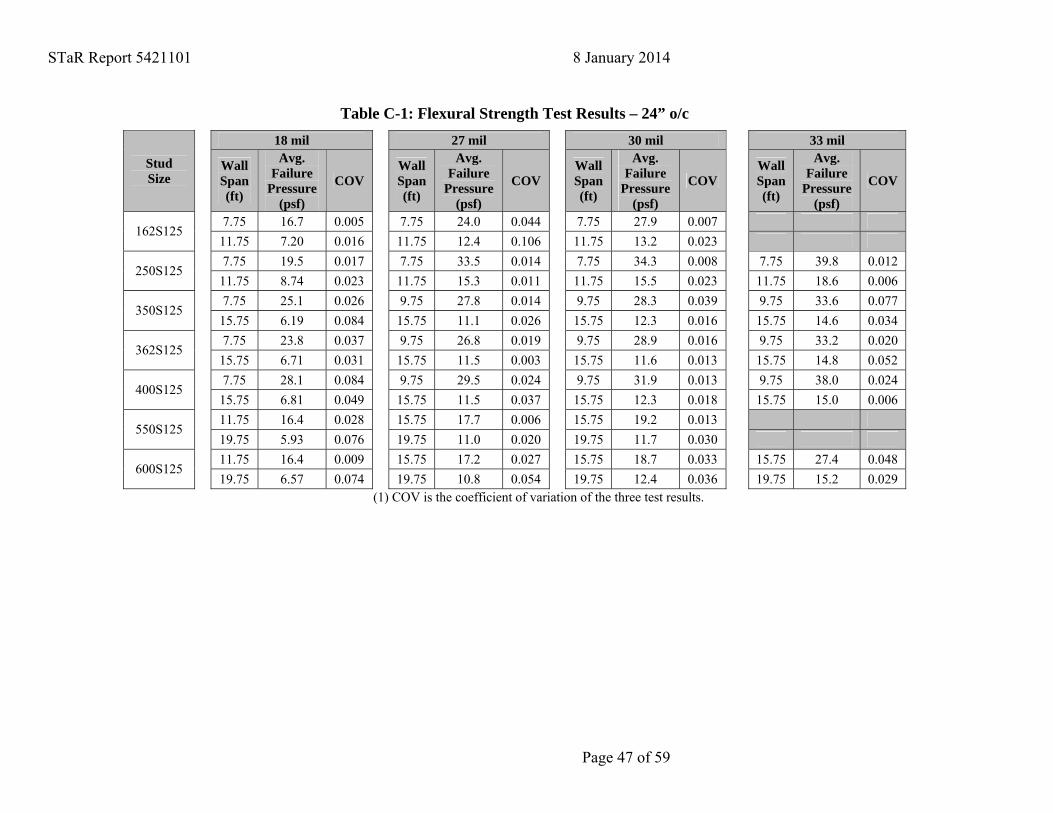
Table C-1: Flexural Strength Test Results – 24” o/c 18 mil 27 mil 30 mil 33 mil
Stud Size
Wall Span (ft)
Avg. Failure
Pressure (psf)
COV Wall Span (ft)
Avg. Failure
Pressure (psf)
COV Wall Span (ft)
Avg. Failure
Pressure (psf)
COV Wall Span (ft)
Avg. Failure
Pressure (psf)
COV
7.75 16.7 0.005 7.75 24.0 0.044 7.75 27.9 0.007 162S125
11.75 7.20 0.016 11.75 12.4 0.106 11.75 13.2 0.023 7.75 19.5 0.017 7.75 33.5 0.014 7.75 34.3 0.008 7.75 39.8 0.012
250S125 11.75 8.74 0.023 11.75 15.3 0.011 11.75 15.5 0.023 11.75 18.6 0.006 7.75 25.1 0.026 9.75 27.8 0.014 9.75 28.3 0.039 9.75 33.6 0.077
350S125 15.75 6.19 0.084 15.75 11.1 0.026 15.75 12.3 0.016 15.75 14.6 0.034 7.75 23.8 0.037 9.75 26.8 0.019 9.75 28.9 0.016 9.75 33.2 0.020
362S125 15.75 6.71 0.031 15.75 11.5 0.003 15.75 11.6 0.013 15.75 14.8 0.052 7.75 28.1 0.084 9.75 29.5 0.024 9.75 31.9 0.013 9.75 38.0 0.024
400S125 15.75 6.81 0.049 15.75 11.5 0.037 15.75 12.3 0.018 15.75 15.0 0.006 11.75 16.4 0.028 15.75 17.7 0.006 15.75 19.2 0.013
550S125 19.75 5.93 0.076 19.75 11.0 0.020 19.75 11.7 0.030 11.75 16.4 0.009 15.75 17.2 0.027 15.75 18.7 0.033 15.75 27.4 0.048
600S125 19.75 6.57 0.074 19.75 10.8 0.054 19.75 12.4 0.036 19.75 15.2 0.029
(1) COV is the coefficient of variation of the three test results.
STaR Report 5421101 8 January 2014
Page 48 of 59
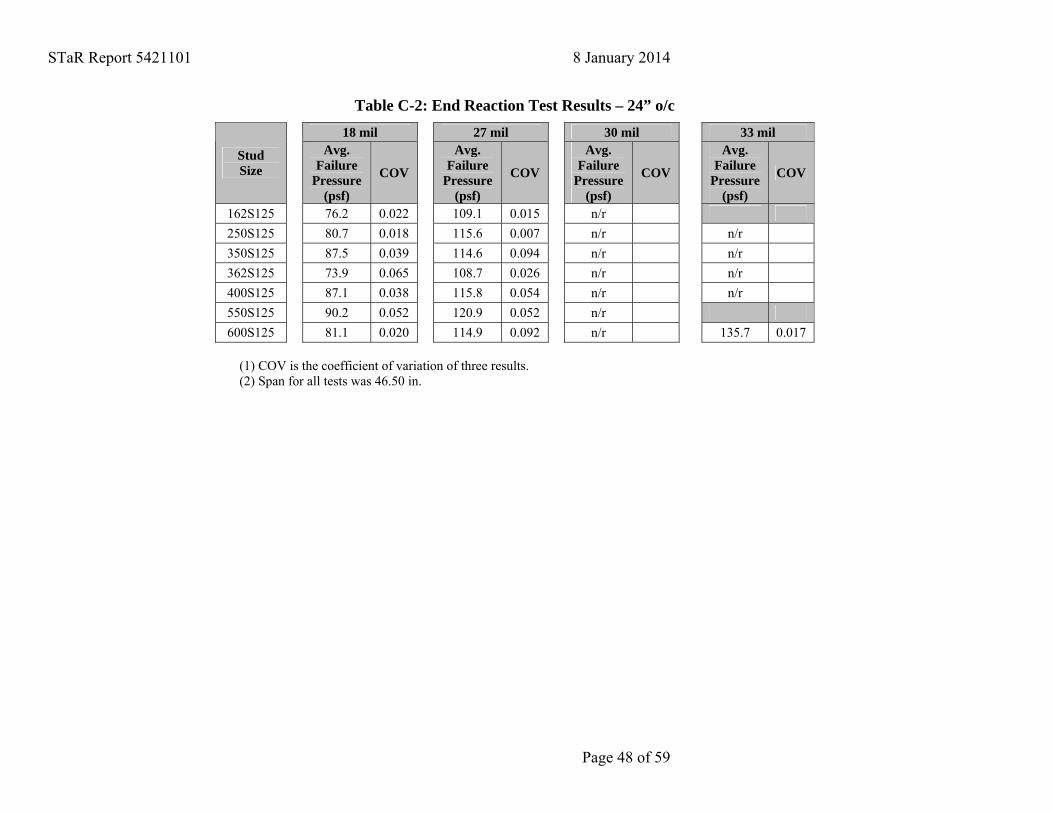
Table C-2: End Reaction Test Results – 24” o/c 18 mil 27 mil 30 mil 33 mil
Stud Size
Avg. Failure
Pressure (psf)
COV
Avg. Failure
Pressure (psf)
COV
Avg. Failure
Pressure (psf)
COV
Avg. Failure
Pressure (psf)
COV
162S125 76.2 0.022 109.1 0.015 n/r 250S125 80.7 0.018 115.6 0.007 n/r n/r 350S125 87.5 0.039 114.6 0.094 n/r n/r 362S125 73.9 0.065 108.7 0.026 n/r n/r 400S125 87.1 0.038 115.8 0.054 n/r n/r 550S125 90.2 0.052 120.9 0.052 n/r 600S125 81.1 0.020 114.9 0.092 n/r 135.7 0.017
(1) COV is the coefficient of variation of three results. (2) Span for all tests was 46.50 in.
STaR Report 5421101 8 January 2014
Page 49 of 59
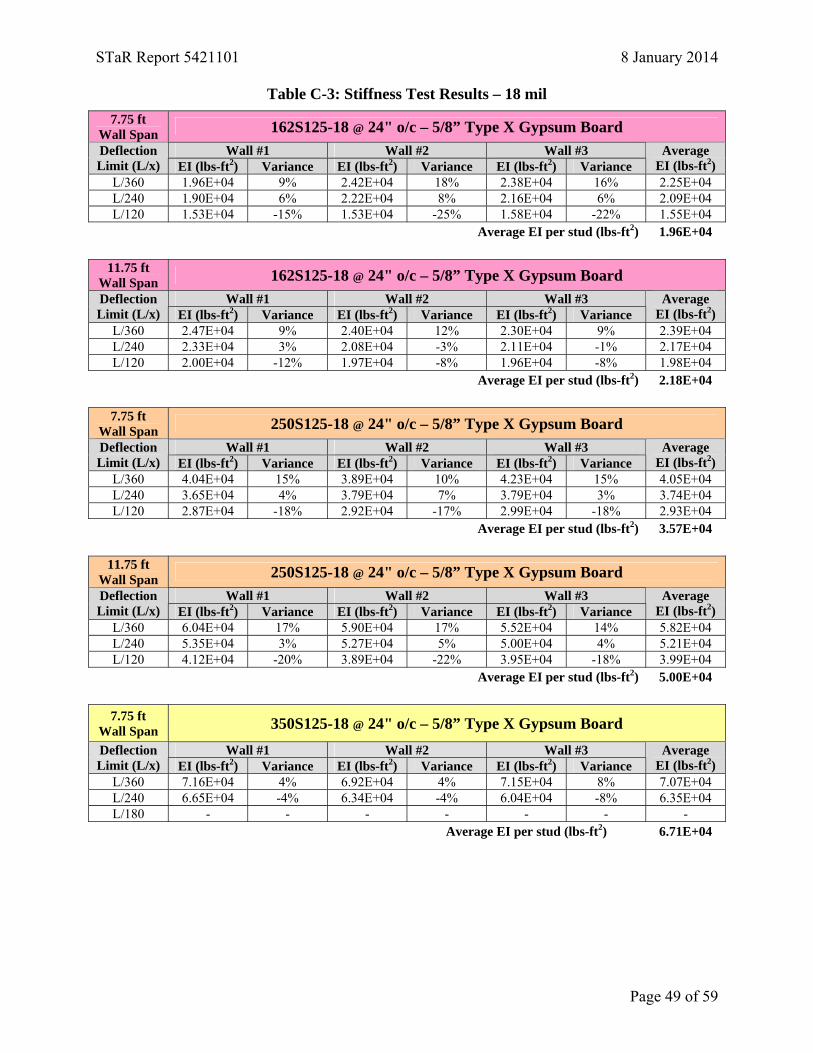
Table C-3: Stiffness Test Results – 18 mil 7.75 ft
Wall Span 162S125-18 @ 24" o/c – 5/8” Type X Gypsum Board Wall #1 Wall #2 Wall #3 Deflection
Limit (L/x) EI (lbs-ft2) Variance EI (lbs-ft2) Variance EI (lbs-ft2) Variance Average
EI (lbs-ft2) L/360 1.96E+04 9% 2.42E+04 18% 2.38E+04 16% 2.25E+04 L/240 1.90E+04 6% 2.22E+04 8% 2.16E+04 6% 2.09E+04 L/120 1.53E+04 -15% 1.53E+04 -25% 1.58E+04 -22% 1.55E+04
Average EI per stud (lbs-ft2) 1.96E+04
11.75 ft Wall Span 162S125-18 @ 24" o/c – 5/8” Type X Gypsum Board
Wall #1 Wall #2 Wall #3 Deflection Limit (L/x) EI (lbs-ft2) Variance EI (lbs-ft2) Variance EI (lbs-ft2) Variance
Average EI (lbs-ft2)
L/360 2.47E+04 9% 2.40E+04 12% 2.30E+04 9% 2.39E+04 L/240 2.33E+04 3% 2.08E+04 -3% 2.11E+04 -1% 2.17E+04 L/120 2.00E+04 -12% 1.97E+04 -8% 1.96E+04 -8% 1.98E+04
Average EI per stud (lbs-ft2) 2.18E+04
7.75 ft Wall Span 250S125-18 @ 24" o/c – 5/8” Type X Gypsum Board
Wall #1 Wall #2 Wall #3 Deflection Limit (L/x) EI (lbs-ft2) Variance EI (lbs-ft2) Variance EI (lbs-ft2) Variance
Average EI (lbs-ft2)
L/360 4.04E+04 15% 3.89E+04 10% 4.23E+04 15% 4.05E+04 L/240 3.65E+04 4% 3.79E+04 7% 3.79E+04 3% 3.74E+04 L/120 2.87E+04 -18% 2.92E+04 -17% 2.99E+04 -18% 2.93E+04
Average EI per stud (lbs-ft2) 3.57E+04
11.75 ft Wall Span 250S125-18 @ 24" o/c – 5/8” Type X Gypsum Board
Wall #1 Wall #2 Wall #3 Deflection Limit (L/x) EI (lbs-ft2) Variance EI (lbs-ft2) Variance EI (lbs-ft2) Variance
Average EI (lbs-ft2)
L/360 6.04E+04 17% 5.90E+04 17% 5.52E+04 14% 5.82E+04 L/240 5.35E+04 3% 5.27E+04 5% 5.00E+04 4% 5.21E+04 L/120 4.12E+04 -20% 3.89E+04 -22% 3.95E+04 -18% 3.99E+04
Average EI per stud (lbs-ft2) 5.00E+04
7.75 ft Wall Span 350S125-18 @ 24" o/c – 5/8” Type X Gypsum Board
Wall #1 Wall #2 Wall #3 Deflection Limit (L/x) EI (lbs-ft2) Variance EI (lbs-ft2) Variance EI (lbs-ft2) Variance
Average EI (lbs-ft2)
L/360 7.16E+04 4% 6.92E+04 4% 7.15E+04 8% 7.07E+04 L/240 6.65E+04 -4% 6.34E+04 -4% 6.04E+04 -8% 6.35E+04 L/180 - - - - - - -
Average EI per stud (lbs-ft2) 6.71E+04
STaR Report 5421101 8 January 2014
Page 50 of 59
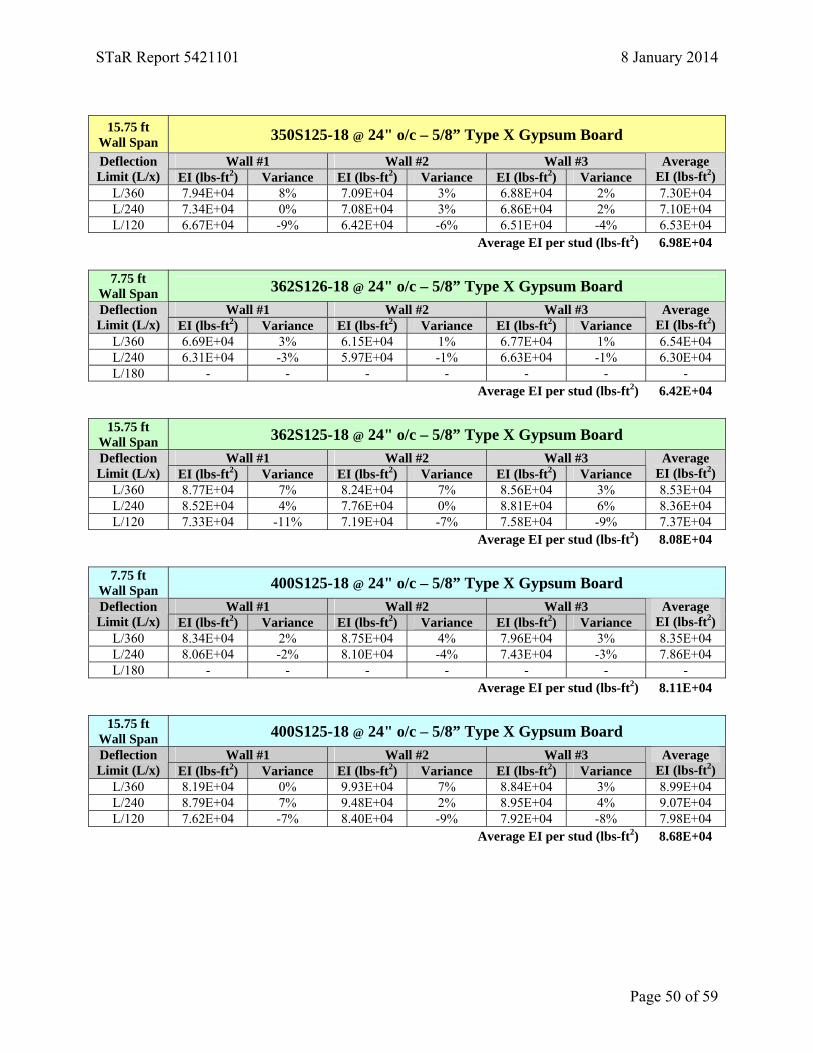
15.75 ft
Wall Span 350S125-18 @ 24" o/c – 5/8” Type X Gypsum Board Wall #1 Wall #2 Wall #3 Deflection
Limit (L/x) EI (lbs-ft2) Variance EI (lbs-ft2) Variance EI (lbs-ft2) Variance Average
EI (lbs-ft2) L/360 7.94E+04 8% 7.09E+04 3% 6.88E+04 2% 7.30E+04 L/240 7.34E+04 0% 7.08E+04 3% 6.86E+04 2% 7.10E+04 L/120 6.67E+04 -9% 6.42E+04 -6% 6.51E+04 -4% 6.53E+04
Average EI per stud (lbs-ft2) 6.98E+04
7.75 ft Wall Span 362S126-18 @ 24" o/c – 5/8” Type X Gypsum Board
Wall #1 Wall #2 Wall #3 Deflection Limit (L/x) EI (lbs-ft2) Variance EI (lbs-ft2) Variance EI (lbs-ft2) Variance
Average EI (lbs-ft2)
L/360 6.69E+04 3% 6.15E+04 1% 6.77E+04 1% 6.54E+04 L/240 6.31E+04 -3% 5.97E+04 -1% 6.63E+04 -1% 6.30E+04 L/180 - - - - - - -
Average EI per stud (lbs-ft2) 6.42E+04
15.75 ft Wall Span 362S125-18 @ 24" o/c – 5/8” Type X Gypsum Board
Wall #1 Wall #2 Wall #3 Deflection Limit (L/x) EI (lbs-ft2) Variance EI (lbs-ft2) Variance EI (lbs-ft2) Variance
Average EI (lbs-ft2)
L/360 8.77E+04 7% 8.24E+04 7% 8.56E+04 3% 8.53E+04 L/240 8.52E+04 4% 7.76E+04 0% 8.81E+04 6% 8.36E+04 L/120 7.33E+04 -11% 7.19E+04 -7% 7.58E+04 -9% 7.37E+04
Average EI per stud (lbs-ft2) 8.08E+04
7.75 ft Wall Span 400S125-18 @ 24" o/c – 5/8” Type X Gypsum Board
Wall #1 Wall #2 Wall #3 Deflection Limit (L/x) EI (lbs-ft2) Variance EI (lbs-ft2) Variance EI (lbs-ft2) Variance
Average EI (lbs-ft2)
L/360 8.34E+04 2% 8.75E+04 4% 7.96E+04 3% 8.35E+04 L/240 8.06E+04 -2% 8.10E+04 -4% 7.43E+04 -3% 7.86E+04 L/180 - - - - - - -
Average EI per stud (lbs-ft2) 8.11E+04
15.75 ft Wall Span 400S125-18 @ 24" o/c – 5/8” Type X Gypsum Board
Wall #1 Wall #2 Wall #3 Deflection Limit (L/x) EI (lbs-ft2) Variance EI (lbs-ft2) Variance EI (lbs-ft2) Variance
Average EI (lbs-ft2)
L/360 8.19E+04 0% 9.93E+04 7% 8.84E+04 3% 8.99E+04 L/240 8.79E+04 7% 9.48E+04 2% 8.95E+04 4% 9.07E+04 L/120 7.62E+04 -7% 8.40E+04 -9% 7.92E+04 -8% 7.98E+04
Average EI per stud (lbs-ft2) 8.68E+04
STaR Report 5421101 8 January 2014
Page 51 of 59
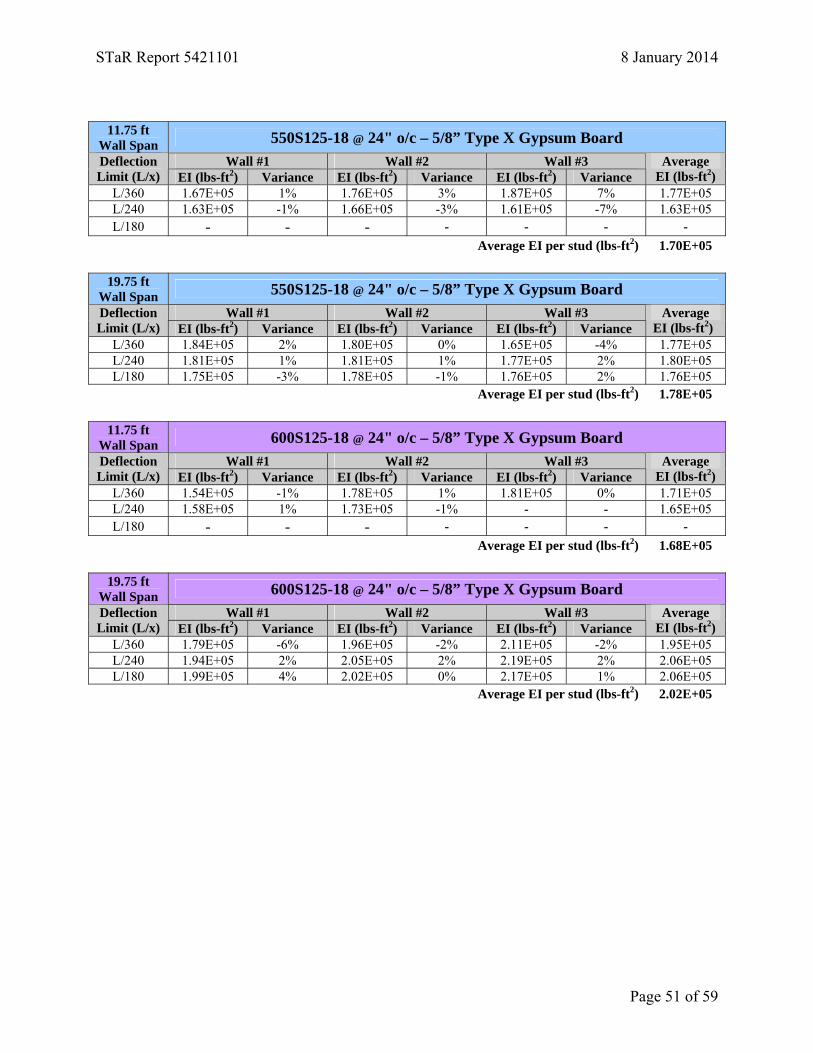
11.75 ft
Wall Span 550S125-18 @ 24" o/c – 5/8” Type X Gypsum Board Wall #1 Wall #2 Wall #3 Deflection
Limit (L/x) EI (lbs-ft2) Variance EI (lbs-ft2) Variance EI (lbs-ft2) Variance Average
EI (lbs-ft2) L/360 1.67E+05 1% 1.76E+05 3% 1.87E+05 7% 1.77E+05 L/240 1.63E+05 -1% 1.66E+05 -3% 1.61E+05 -7% 1.63E+05 L/180 - - - - - - -
Average EI per stud (lbs-ft2) 1.70E+05
19.75 ft Wall Span 550S125-18 @ 24" o/c – 5/8” Type X Gypsum Board
Wall #1 Wall #2 Wall #3 Deflection Limit (L/x) EI (lbs-ft2) Variance EI (lbs-ft2) Variance EI (lbs-ft2) Variance
Average EI (lbs-ft2)
L/360 1.84E+05 2% 1.80E+05 0% 1.65E+05 -4% 1.77E+05 L/240 1.81E+05 1% 1.81E+05 1% 1.77E+05 2% 1.80E+05 L/180 1.75E+05 -3% 1.78E+05 -1% 1.76E+05 2% 1.76E+05
Average EI per stud (lbs-ft2) 1.78E+05
11.75 ft Wall Span 600S125-18 @ 24" o/c – 5/8” Type X Gypsum Board
Wall #1 Wall #2 Wall #3 Deflection Limit (L/x) EI (lbs-ft2) Variance EI (lbs-ft2) Variance EI (lbs-ft2) Variance
Average EI (lbs-ft2)
L/360 1.54E+05 -1% 1.78E+05 1% 1.81E+05 0% 1.71E+05 L/240 1.58E+05 1% 1.73E+05 -1% - - 1.65E+05 L/180 - - - - - - -
Average EI per stud (lbs-ft2) 1.68E+05
19.75 ft Wall Span 600S125-18 @ 24" o/c – 5/8” Type X Gypsum Board
Wall #1 Wall #2 Wall #3 Deflection Limit (L/x) EI (lbs-ft2) Variance EI (lbs-ft2) Variance EI (lbs-ft2) Variance
Average EI (lbs-ft2)
L/360 1.79E+05 -6% 1.96E+05 -2% 2.11E+05 -2% 1.95E+05 L/240 1.94E+05 2% 2.05E+05 2% 2.19E+05 2% 2.06E+05 L/180 1.99E+05 4% 2.02E+05 0% 2.17E+05 1% 2.06E+05
Average EI per stud (lbs-ft2) 2.02E+05
STaR Report 5421101 8 January 2014
Page 52 of 59
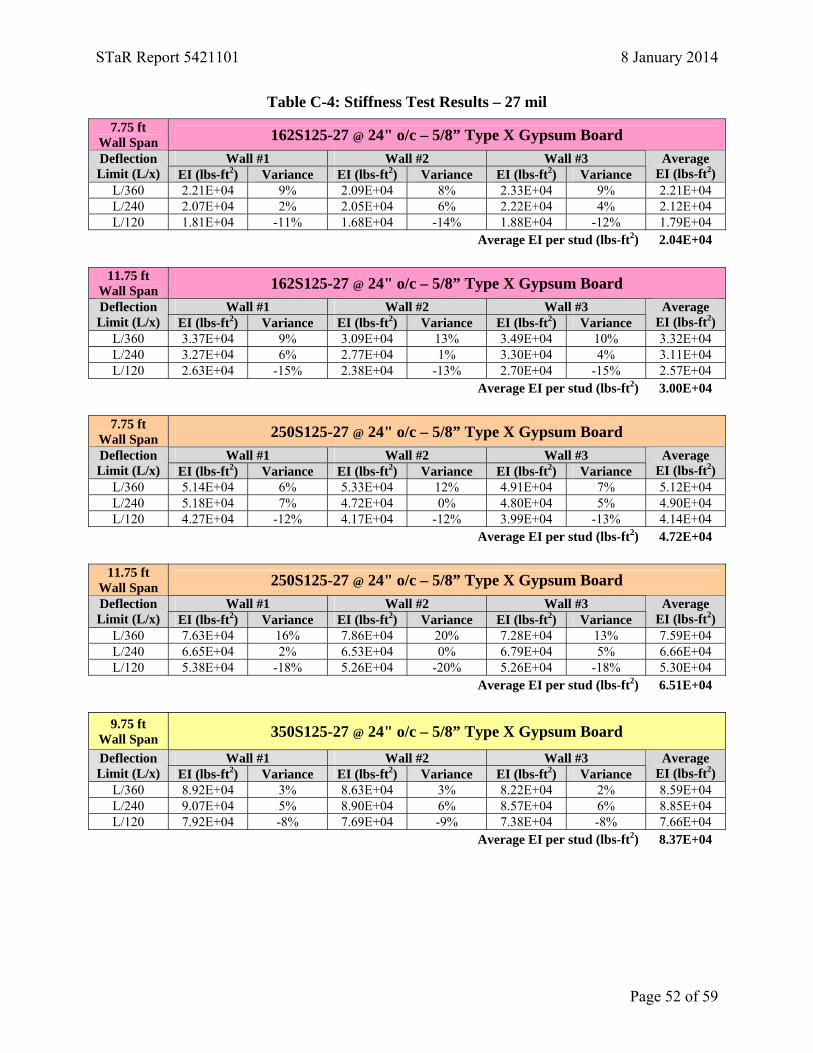
Table C-4: Stiffness Test Results – 27 mil 7.75 ft
Wall Span 162S125-27 @ 24" o/c – 5/8” Type X Gypsum Board Wall #1 Wall #2 Wall #3 Deflection
Limit (L/x) EI (lbs-ft2) Variance EI (lbs-ft2) Variance EI (lbs-ft2) Variance Average
EI (lbs-ft2) L/360 2.21E+04 9% 2.09E+04 8% 2.33E+04 9% 2.21E+04 L/240 2.07E+04 2% 2.05E+04 6% 2.22E+04 4% 2.12E+04 L/120 1.81E+04 -11% 1.68E+04 -14% 1.88E+04 -12% 1.79E+04
Average EI per stud (lbs-ft2) 2.04E+04
11.75 ft Wall Span 162S125-27 @ 24" o/c – 5/8” Type X Gypsum Board
Wall #1 Wall #2 Wall #3 Deflection Limit (L/x) EI (lbs-ft2) Variance EI (lbs-ft2) Variance EI (lbs-ft2) Variance
Average EI (lbs-ft2)
L/360 3.37E+04 9% 3.09E+04 13% 3.49E+04 10% 3.32E+04 L/240 3.27E+04 6% 2.77E+04 1% 3.30E+04 4% 3.11E+04 L/120 2.63E+04 -15% 2.38E+04 -13% 2.70E+04 -15% 2.57E+04
Average EI per stud (lbs-ft2) 3.00E+04
7.75 ft Wall Span 250S125-27 @ 24" o/c – 5/8” Type X Gypsum Board
Wall #1 Wall #2 Wall #3 Deflection Limit (L/x) EI (lbs-ft2) Variance EI (lbs-ft2) Variance EI (lbs-ft2) Variance
Average EI (lbs-ft2)
L/360 5.14E+04 6% 5.33E+04 12% 4.91E+04 7% 5.12E+04 L/240 5.18E+04 7% 4.72E+04 0% 4.80E+04 5% 4.90E+04 L/120 4.27E+04 -12% 4.17E+04 -12% 3.99E+04 -13% 4.14E+04
Average EI per stud (lbs-ft2) 4.72E+04
11.75 ft Wall Span 250S125-27 @ 24" o/c – 5/8” Type X Gypsum Board
Wall #1 Wall #2 Wall #3 Deflection Limit (L/x) EI (lbs-ft2) Variance EI (lbs-ft2) Variance EI (lbs-ft2) Variance
Average EI (lbs-ft2)
L/360 7.63E+04 16% 7.86E+04 20% 7.28E+04 13% 7.59E+04 L/240 6.65E+04 2% 6.53E+04 0% 6.79E+04 5% 6.66E+04 L/120 5.38E+04 -18% 5.26E+04 -20% 5.26E+04 -18% 5.30E+04
Average EI per stud (lbs-ft2) 6.51E+04
9.75 ft Wall Span 350S125-27 @ 24" o/c – 5/8” Type X Gypsum Board
Wall #1 Wall #2 Wall #3 Deflection Limit (L/x) EI (lbs-ft2) Variance EI (lbs-ft2) Variance EI (lbs-ft2) Variance
Average EI (lbs-ft2)
L/360 8.92E+04 3% 8.63E+04 3% 8.22E+04 2% 8.59E+04 L/240 9.07E+04 5% 8.90E+04 6% 8.57E+04 6% 8.85E+04 L/120 7.92E+04 -8% 7.69E+04 -9% 7.38E+04 -8% 7.66E+04
Average EI per stud (lbs-ft2) 8.37E+04
STaR Report 5421101 8 January 2014
Page 53 of 59
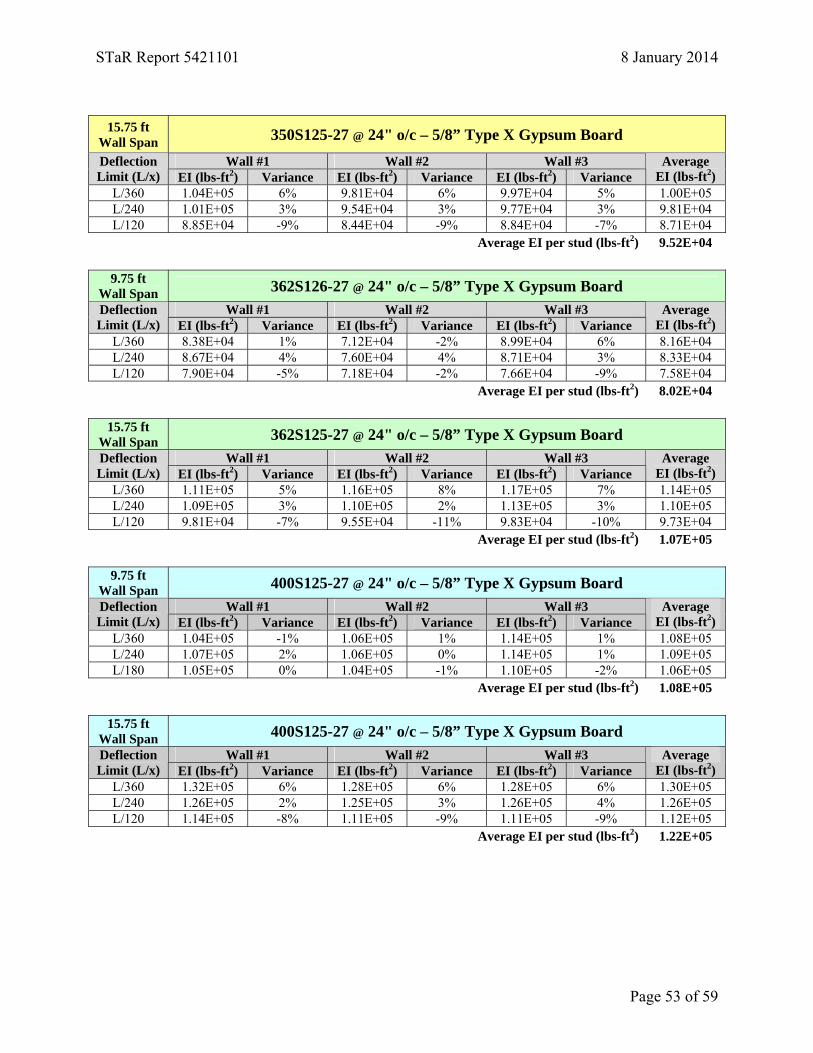
15.75 ft
Wall Span 350S125-27 @ 24" o/c – 5/8” Type X Gypsum Board Wall #1 Wall #2 Wall #3 Deflection
Limit (L/x) EI (lbs-ft2) Variance EI (lbs-ft2) Variance EI (lbs-ft2) Variance Average
EI (lbs-ft2) L/360 1.04E+05 6% 9.81E+04 6% 9.97E+04 5% 1.00E+05 L/240 1.01E+05 3% 9.54E+04 3% 9.77E+04 3% 9.81E+04 L/120 8.85E+04 -9% 8.44E+04 -9% 8.84E+04 -7% 8.71E+04
Average EI per stud (lbs-ft2) 9.52E+04
9.75 ft Wall Span 362S126-27 @ 24" o/c – 5/8” Type X Gypsum Board
Wall #1 Wall #2 Wall #3 Deflection Limit (L/x) EI (lbs-ft2) Variance EI (lbs-ft2) Variance EI (lbs-ft2) Variance
Average EI (lbs-ft2)
L/360 8.38E+04 1% 7.12E+04 -2% 8.99E+04 6% 8.16E+04 L/240 8.67E+04 4% 7.60E+04 4% 8.71E+04 3% 8.33E+04 L/120 7.90E+04 -5% 7.18E+04 -2% 7.66E+04 -9% 7.58E+04
Average EI per stud (lbs-ft2) 8.02E+04
15.75 ft Wall Span 362S125-27 @ 24" o/c – 5/8” Type X Gypsum Board
Wall #1 Wall #2 Wall #3 Deflection Limit (L/x) EI (lbs-ft2) Variance EI (lbs-ft2) Variance EI (lbs-ft2) Variance
Average EI (lbs-ft2)
L/360 1.11E+05 5% 1.16E+05 8% 1.17E+05 7% 1.14E+05 L/240 1.09E+05 3% 1.10E+05 2% 1.13E+05 3% 1.10E+05 L/120 9.81E+04 -7% 9.55E+04 -11% 9.83E+04 -10% 9.73E+04
Average EI per stud (lbs-ft2) 1.07E+05
9.75 ft Wall Span 400S125-27 @ 24" o/c – 5/8” Type X Gypsum Board
Wall #1 Wall #2 Wall #3 Deflection Limit (L/x) EI (lbs-ft2) Variance EI (lbs-ft2) Variance EI (lbs-ft2) Variance
Average EI (lbs-ft2)
L/360 1.04E+05 -1% 1.06E+05 1% 1.14E+05 1% 1.08E+05 L/240 1.07E+05 2% 1.06E+05 0% 1.14E+05 1% 1.09E+05 L/180 1.05E+05 0% 1.04E+05 -1% 1.10E+05 -2% 1.06E+05
Average EI per stud (lbs-ft2) 1.08E+05
15.75 ft Wall Span 400S125-27 @ 24" o/c – 5/8” Type X Gypsum Board
Wall #1 Wall #2 Wall #3 Deflection Limit (L/x) EI (lbs-ft2) Variance EI (lbs-ft2) Variance EI (lbs-ft2) Variance
Average EI (lbs-ft2)
L/360 1.32E+05 6% 1.28E+05 6% 1.28E+05 6% 1.30E+05 L/240 1.26E+05 2% 1.25E+05 3% 1.26E+05 4% 1.26E+05 L/120 1.14E+05 -8% 1.11E+05 -9% 1.11E+05 -9% 1.12E+05
Average EI per stud (lbs-ft2) 1.22E+05
STaR Report 5421101 8 January 2014
Page 54 of 59
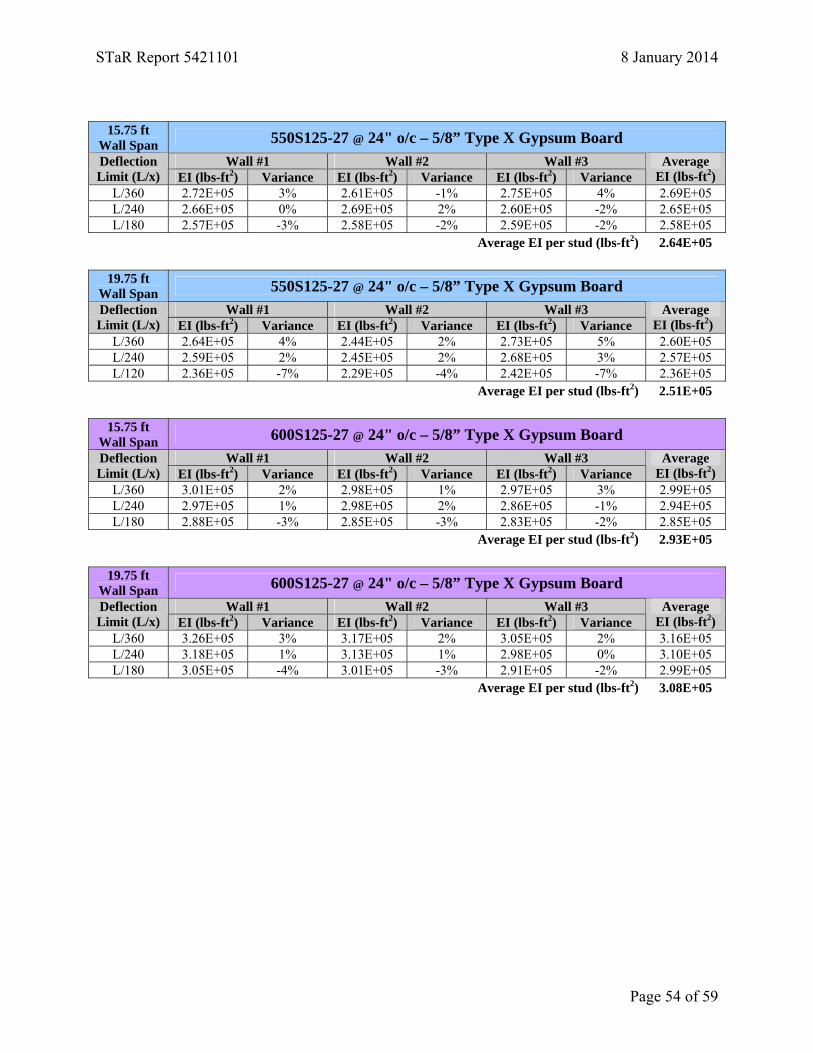
15.75 ft
Wall Span 550S125-27 @ 24" o/c – 5/8” Type X Gypsum Board Wall #1 Wall #2 Wall #3 Deflection
Limit (L/x) EI (lbs-ft2) Variance EI (lbs-ft2) Variance EI (lbs-ft2) Variance Average
EI (lbs-ft2) L/360 2.72E+05 3% 2.61E+05 -1% 2.75E+05 4% 2.69E+05 L/240 2.66E+05 0% 2.69E+05 2% 2.60E+05 -2% 2.65E+05 L/180 2.57E+05 -3% 2.58E+05 -2% 2.59E+05 -2% 2.58E+05
Average EI per stud (lbs-ft2) 2.64E+05
19.75 ft Wall Span 550S125-27 @ 24" o/c – 5/8” Type X Gypsum Board
Wall #1 Wall #2 Wall #3 Deflection Limit (L/x) EI (lbs-ft2) Variance EI (lbs-ft2) Variance EI (lbs-ft2) Variance
Average EI (lbs-ft2)
L/360 2.64E+05 4% 2.44E+05 2% 2.73E+05 5% 2.60E+05 L/240 2.59E+05 2% 2.45E+05 2% 2.68E+05 3% 2.57E+05 L/120 2.36E+05 -7% 2.29E+05 -4% 2.42E+05 -7% 2.36E+05
Average EI per stud (lbs-ft2) 2.51E+05
15.75 ft Wall Span 600S125-27 @ 24" o/c – 5/8” Type X Gypsum Board
Wall #1 Wall #2 Wall #3 Deflection Limit (L/x) EI (lbs-ft2) Variance EI (lbs-ft2) Variance EI (lbs-ft2) Variance
Average EI (lbs-ft2)
L/360 3.01E+05 2% 2.98E+05 1% 2.97E+05 3% 2.99E+05 L/240 2.97E+05 1% 2.98E+05 2% 2.86E+05 -1% 2.94E+05 L/180 2.88E+05 -3% 2.85E+05 -3% 2.83E+05 -2% 2.85E+05
Average EI per stud (lbs-ft2) 2.93E+05
19.75 ft Wall Span 600S125-27 @ 24" o/c – 5/8” Type X Gypsum Board
Wall #1 Wall #2 Wall #3 Deflection Limit (L/x) EI (lbs-ft2) Variance EI (lbs-ft2) Variance EI (lbs-ft2) Variance
Average EI (lbs-ft2)
L/360 3.26E+05 3% 3.17E+05 2% 3.05E+05 2% 3.16E+05 L/240 3.18E+05 1% 3.13E+05 1% 2.98E+05 0% 3.10E+05 L/180 3.05E+05 -4% 3.01E+05 -3% 2.91E+05 -2% 2.99E+05
Average EI per stud (lbs-ft2) 3.08E+05
STaR Report 5421101 8 January 2014
Page 55 of 59
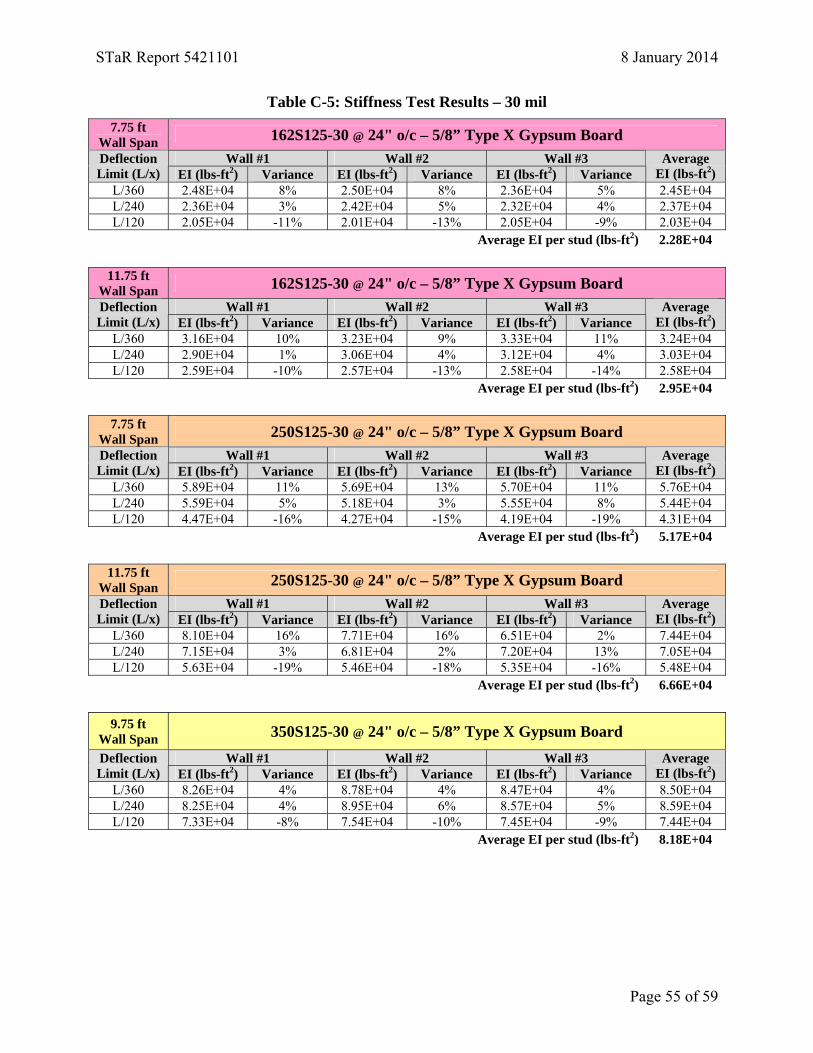
Table C-5: Stiffness Test Results – 30 mil 7.75 ft
Wall Span 162S125-30 @ 24" o/c – 5/8” Type X Gypsum Board Wall #1 Wall #2 Wall #3 Deflection
Limit (L/x) EI (lbs-ft2) Variance EI (lbs-ft2) Variance EI (lbs-ft2) Variance Average
EI (lbs-ft2) L/360 2.48E+04 8% 2.50E+04 8% 2.36E+04 5% 2.45E+04 L/240 2.36E+04 3% 2.42E+04 5% 2.32E+04 4% 2.37E+04 L/120 2.05E+04 -11% 2.01E+04 -13% 2.05E+04 -9% 2.03E+04
Average EI per stud (lbs-ft2) 2.28E+04
11.75 ft Wall Span 162S125-30 @ 24" o/c – 5/8” Type X Gypsum Board
Wall #1 Wall #2 Wall #3 Deflection Limit (L/x) EI (lbs-ft2) Variance EI (lbs-ft2) Variance EI (lbs-ft2) Variance
Average EI (lbs-ft2)
L/360 3.16E+04 10% 3.23E+04 9% 3.33E+04 11% 3.24E+04 L/240 2.90E+04 1% 3.06E+04 4% 3.12E+04 4% 3.03E+04 L/120 2.59E+04 -10% 2.57E+04 -13% 2.58E+04 -14% 2.58E+04
Average EI per stud (lbs-ft2) 2.95E+04
7.75 ft Wall Span 250S125-30 @ 24" o/c – 5/8” Type X Gypsum Board
Wall #1 Wall #2 Wall #3 Deflection Limit (L/x) EI (lbs-ft2) Variance EI (lbs-ft2) Variance EI (lbs-ft2) Variance
Average EI (lbs-ft2)
L/360 5.89E+04 11% 5.69E+04 13% 5.70E+04 11% 5.76E+04 L/240 5.59E+04 5% 5.18E+04 3% 5.55E+04 8% 5.44E+04 L/120 4.47E+04 -16% 4.27E+04 -15% 4.19E+04 -19% 4.31E+04
Average EI per stud (lbs-ft2) 5.17E+04
11.75 ft Wall Span 250S125-30 @ 24" o/c – 5/8” Type X Gypsum Board
Wall #1 Wall #2 Wall #3 Deflection Limit (L/x) EI (lbs-ft2) Variance EI (lbs-ft2) Variance EI (lbs-ft2) Variance
Average EI (lbs-ft2)
L/360 8.10E+04 16% 7.71E+04 16% 6.51E+04 2% 7.44E+04 L/240 7.15E+04 3% 6.81E+04 2% 7.20E+04 13% 7.05E+04 L/120 5.63E+04 -19% 5.46E+04 -18% 5.35E+04 -16% 5.48E+04
Average EI per stud (lbs-ft2) 6.66E+04
9.75 ft Wall Span 350S125-30 @ 24" o/c – 5/8” Type X Gypsum Board
Wall #1 Wall #2 Wall #3 Deflection Limit (L/x) EI (lbs-ft2) Variance EI (lbs-ft2) Variance EI (lbs-ft2) Variance
Average EI (lbs-ft2)
L/360 8.26E+04 4% 8.78E+04 4% 8.47E+04 4% 8.50E+04 L/240 8.25E+04 4% 8.95E+04 6% 8.57E+04 5% 8.59E+04 L/120 7.33E+04 -8% 7.54E+04 -10% 7.45E+04 -9% 7.44E+04
Average EI per stud (lbs-ft2) 8.18E+04
STaR Report 5421101 8 January 2014
Page 56 of 59
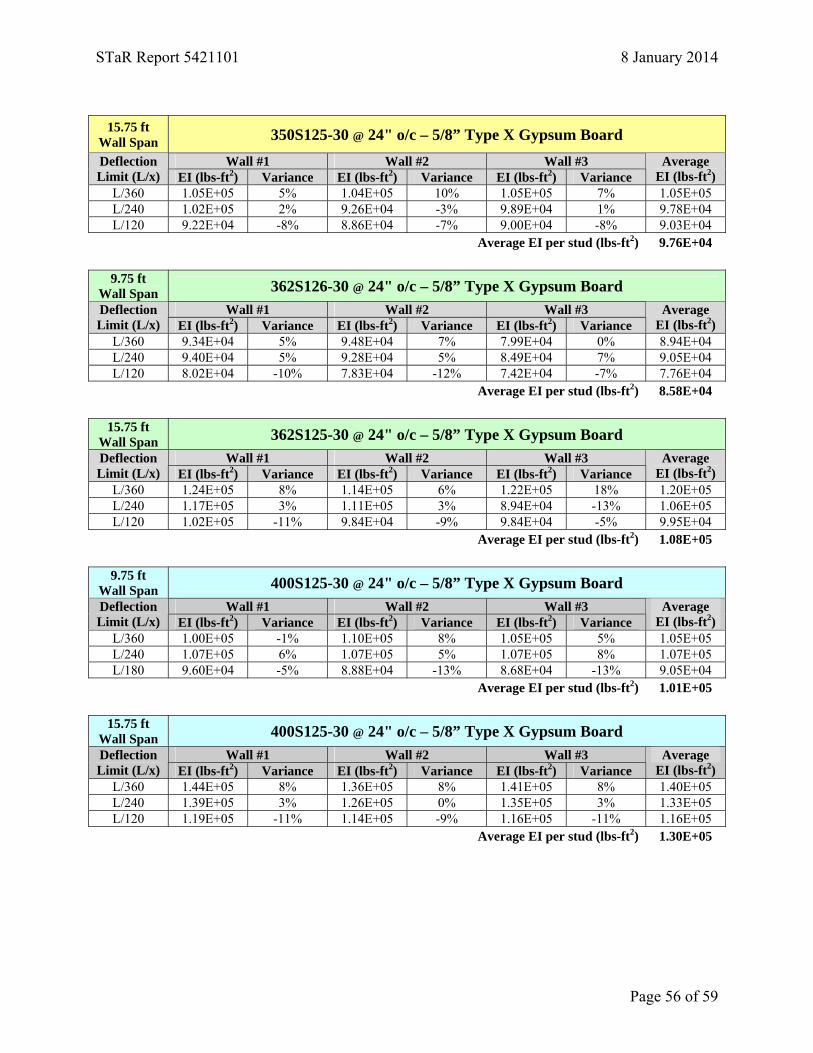
15.75 ft
Wall Span 350S125-30 @ 24" o/c – 5/8” Type X Gypsum Board Wall #1 Wall #2 Wall #3 Deflection
Limit (L/x) EI (lbs-ft2) Variance EI (lbs-ft2) Variance EI (lbs-ft2) Variance Average
EI (lbs-ft2) L/360 1.05E+05 5% 1.04E+05 10% 1.05E+05 7% 1.05E+05 L/240 1.02E+05 2% 9.26E+04 -3% 9.89E+04 1% 9.78E+04 L/120 9.22E+04 -8% 8.86E+04 -7% 9.00E+04 -8% 9.03E+04
Average EI per stud (lbs-ft2) 9.76E+04
9.75 ft Wall Span 362S126-30 @ 24" o/c – 5/8” Type X Gypsum Board
Wall #1 Wall #2 Wall #3 Deflection Limit (L/x) EI (lbs-ft2) Variance EI (lbs-ft2) Variance EI (lbs-ft2) Variance
Average EI (lbs-ft2)
L/360 9.34E+04 5% 9.48E+04 7% 7.99E+04 0% 8.94E+04 L/240 9.40E+04 5% 9.28E+04 5% 8.49E+04 7% 9.05E+04 L/120 8.02E+04 -10% 7.83E+04 -12% 7.42E+04 -7% 7.76E+04
Average EI per stud (lbs-ft2) 8.58E+04
15.75 ft Wall Span 362S125-30 @ 24" o/c – 5/8” Type X Gypsum Board
Wall #1 Wall #2 Wall #3 Deflection Limit (L/x) EI (lbs-ft2) Variance EI (lbs-ft2) Variance EI (lbs-ft2) Variance
Average EI (lbs-ft2)
L/360 1.24E+05 8% 1.14E+05 6% 1.22E+05 18% 1.20E+05 L/240 1.17E+05 3% 1.11E+05 3% 8.94E+04 -13% 1.06E+05 L/120 1.02E+05 -11% 9.84E+04 -9% 9.84E+04 -5% 9.95E+04
Average EI per stud (lbs-ft2) 1.08E+05
9.75 ft Wall Span 400S125-30 @ 24" o/c – 5/8” Type X Gypsum Board
Wall #1 Wall #2 Wall #3 Deflection Limit (L/x) EI (lbs-ft2) Variance EI (lbs-ft2) Variance EI (lbs-ft2) Variance
Average EI (lbs-ft2)
L/360 1.00E+05 -1% 1.10E+05 8% 1.05E+05 5% 1.05E+05 L/240 1.07E+05 6% 1.07E+05 5% 1.07E+05 8% 1.07E+05 L/180 9.60E+04 -5% 8.88E+04 -13% 8.68E+04 -13% 9.05E+04
Average EI per stud (lbs-ft2) 1.01E+05
15.75 ft Wall Span 400S125-30 @ 24" o/c – 5/8” Type X Gypsum Board
Wall #1 Wall #2 Wall #3 Deflection Limit (L/x) EI (lbs-ft2) Variance EI (lbs-ft2) Variance EI (lbs-ft2) Variance
Average EI (lbs-ft2)
L/360 1.44E+05 8% 1.36E+05 8% 1.41E+05 8% 1.40E+05 L/240 1.39E+05 3% 1.26E+05 0% 1.35E+05 3% 1.33E+05 L/120 1.19E+05 -11% 1.14E+05 -9% 1.16E+05 -11% 1.16E+05
Average EI per stud (lbs-ft2) 1.30E+05
STaR Report 5421101 8 January 2014
Page 57 of 59
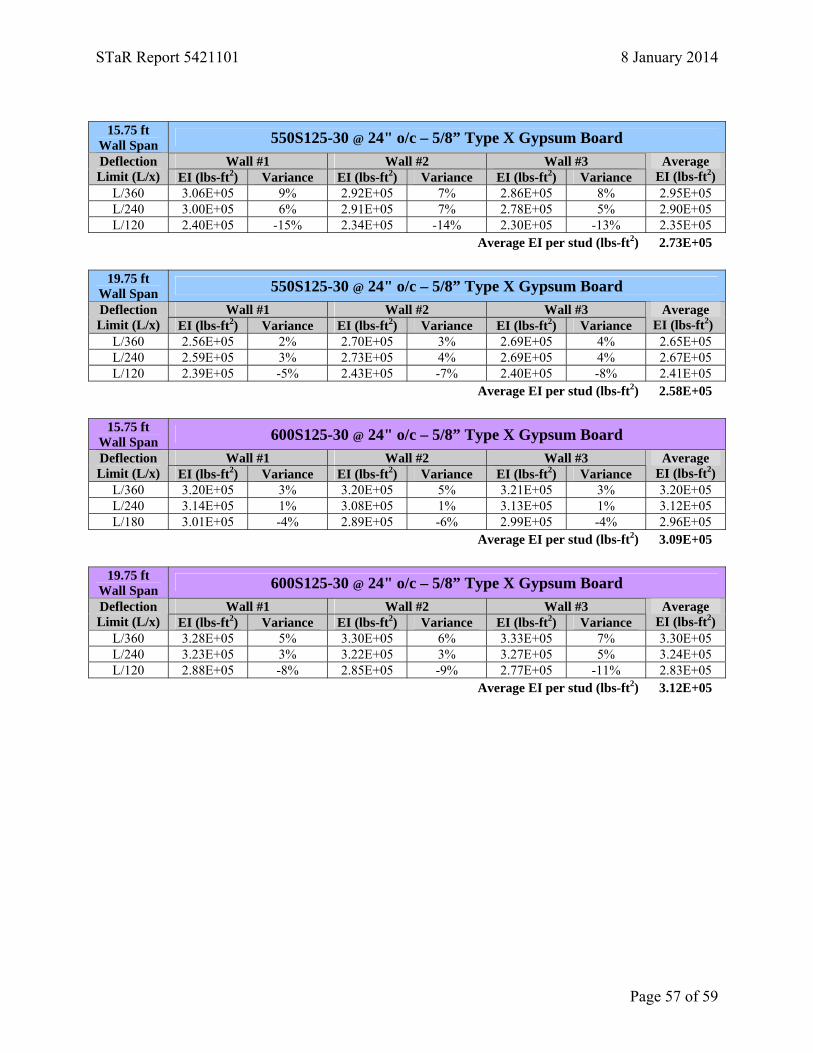
15.75 ft
Wall Span 550S125-30 @ 24" o/c – 5/8” Type X Gypsum Board Wall #1 Wall #2 Wall #3 Deflection
Limit (L/x) EI (lbs-ft2) Variance EI (lbs-ft2) Variance EI (lbs-ft2) Variance Average
EI (lbs-ft2) L/360 3.06E+05 9% 2.92E+05 7% 2.86E+05 8% 2.95E+05 L/240 3.00E+05 6% 2.91E+05 7% 2.78E+05 5% 2.90E+05 L/120 2.40E+05 -15% 2.34E+05 -14% 2.30E+05 -13% 2.35E+05
Average EI per stud (lbs-ft2) 2.73E+05
19.75 ft Wall Span 550S125-30 @ 24" o/c – 5/8” Type X Gypsum Board
Wall #1 Wall #2 Wall #3 Deflection Limit (L/x) EI (lbs-ft2) Variance EI (lbs-ft2) Variance EI (lbs-ft2) Variance
Average EI (lbs-ft2)
L/360 2.56E+05 2% 2.70E+05 3% 2.69E+05 4% 2.65E+05 L/240 2.59E+05 3% 2.73E+05 4% 2.69E+05 4% 2.67E+05 L/120 2.39E+05 -5% 2.43E+05 -7% 2.40E+05 -8% 2.41E+05
Average EI per stud (lbs-ft2) 2.58E+05
15.75 ft Wall Span 600S125-30 @ 24" o/c – 5/8” Type X Gypsum Board
Wall #1 Wall #2 Wall #3 Deflection Limit (L/x) EI (lbs-ft2) Variance EI (lbs-ft2) Variance EI (lbs-ft2) Variance
Average EI (lbs-ft2)
L/360 3.20E+05 3% 3.20E+05 5% 3.21E+05 3% 3.20E+05 L/240 3.14E+05 1% 3.08E+05 1% 3.13E+05 1% 3.12E+05 L/180 3.01E+05 -4% 2.89E+05 -6% 2.99E+05 -4% 2.96E+05
Average EI per stud (lbs-ft2) 3.09E+05
19.75 ft Wall Span 600S125-30 @ 24" o/c – 5/8” Type X Gypsum Board
Wall #1 Wall #2 Wall #3 Deflection Limit (L/x) EI (lbs-ft2) Variance EI (lbs-ft2) Variance EI (lbs-ft2) Variance
Average EI (lbs-ft2)
L/360 3.28E+05 5% 3.30E+05 6% 3.33E+05 7% 3.30E+05 L/240 3.23E+05 3% 3.22E+05 3% 3.27E+05 5% 3.24E+05 L/120 2.88E+05 -8% 2.85E+05 -9% 2.77E+05 -11% 2.83E+05
Average EI per stud (lbs-ft2) 3.12E+05
STaR Report 5421101 8 January 2014
Page 58 of 59
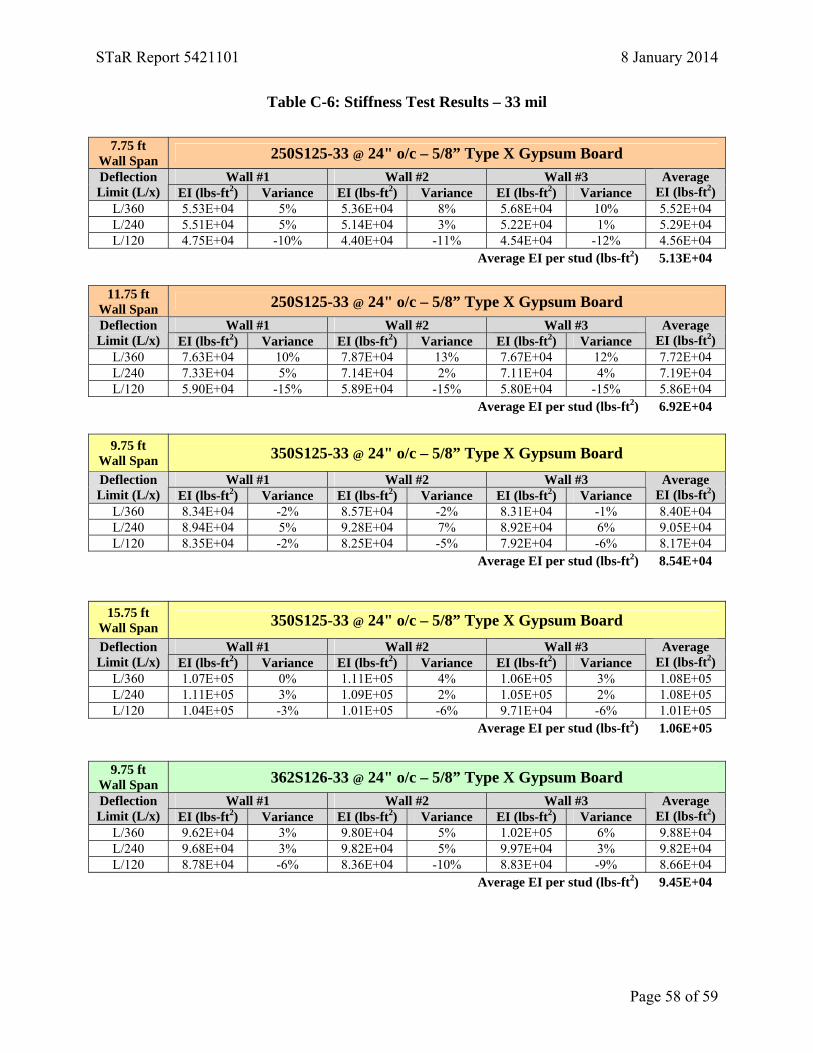
Table C-6: Stiffness Test Results – 33 mil
7.75 ft Wall Span 250S125-33 @ 24" o/c – 5/8” Type X Gypsum Board
Wall #1 Wall #2 Wall #3 Deflection Limit (L/x) EI (lbs-ft2) Variance EI (lbs-ft2) Variance EI (lbs-ft2) Variance
Average EI (lbs-ft2)
L/360 5.53E+04 5% 5.36E+04 8% 5.68E+04 10% 5.52E+04 L/240 5.51E+04 5% 5.14E+04 3% 5.22E+04 1% 5.29E+04 L/120 4.75E+04 -10% 4.40E+04 -11% 4.54E+04 -12% 4.56E+04
Average EI per stud (lbs-ft2) 5.13E+04
11.75 ft Wall Span 250S125-33 @ 24" o/c – 5/8” Type X Gypsum Board
Wall #1 Wall #2 Wall #3 Deflection Limit (L/x) EI (lbs-ft2) Variance EI (lbs-ft2) Variance EI (lbs-ft2) Variance
Average EI (lbs-ft2)
L/360 7.63E+04 10% 7.87E+04 13% 7.67E+04 12% 7.72E+04 L/240 7.33E+04 5% 7.14E+04 2% 7.11E+04 4% 7.19E+04 L/120 5.90E+04 -15% 5.89E+04 -15% 5.80E+04 -15% 5.86E+04
Average EI per stud (lbs-ft2) 6.92E+04
9.75 ft Wall Span 350S125-33 @ 24" o/c – 5/8” Type X Gypsum Board
Wall #1 Wall #2 Wall #3 Deflection Limit (L/x) EI (lbs-ft2) Variance EI (lbs-ft2) Variance EI (lbs-ft2) Variance
Average EI (lbs-ft2)
L/360 8.34E+04 -2% 8.57E+04 -2% 8.31E+04 -1% 8.40E+04 L/240 8.94E+04 5% 9.28E+04 7% 8.92E+04 6% 9.05E+04 L/120 8.35E+04 -2% 8.25E+04 -5% 7.92E+04 -6% 8.17E+04
Average EI per stud (lbs-ft2) 8.54E+04
15.75 ft
Wall Span 350S125-33 @ 24" o/c – 5/8” Type X Gypsum Board Wall #1 Wall #2 Wall #3 Deflection
Limit (L/x) EI (lbs-ft2) Variance EI (lbs-ft2) Variance EI (lbs-ft2) Variance Average
EI (lbs-ft2) L/360 1.07E+05 0% 1.11E+05 4% 1.06E+05 3% 1.08E+05 L/240 1.11E+05 3% 1.09E+05 2% 1.05E+05 2% 1.08E+05 L/120 1.04E+05 -3% 1.01E+05 -6% 9.71E+04 -6% 1.01E+05
Average EI per stud (lbs-ft2) 1.06E+05
9.75 ft
Wall Span 362S126-33 @ 24" o/c – 5/8” Type X Gypsum Board Wall #1 Wall #2 Wall #3 Deflection
Limit (L/x) EI (lbs-ft2) Variance EI (lbs-ft2) Variance EI (lbs-ft2) Variance Average
EI (lbs-ft2) L/360 9.62E+04 3% 9.80E+04 5% 1.02E+05 6% 9.88E+04 L/240 9.68E+04 3% 9.82E+04 5% 9.97E+04 3% 9.82E+04 L/120 8.78E+04 -6% 8.36E+04 -10% 8.83E+04 -9% 8.66E+04
Average EI per stud (lbs-ft2) 9.45E+04
STaR Report 5421101 8 January 2014
Page 59 of 59
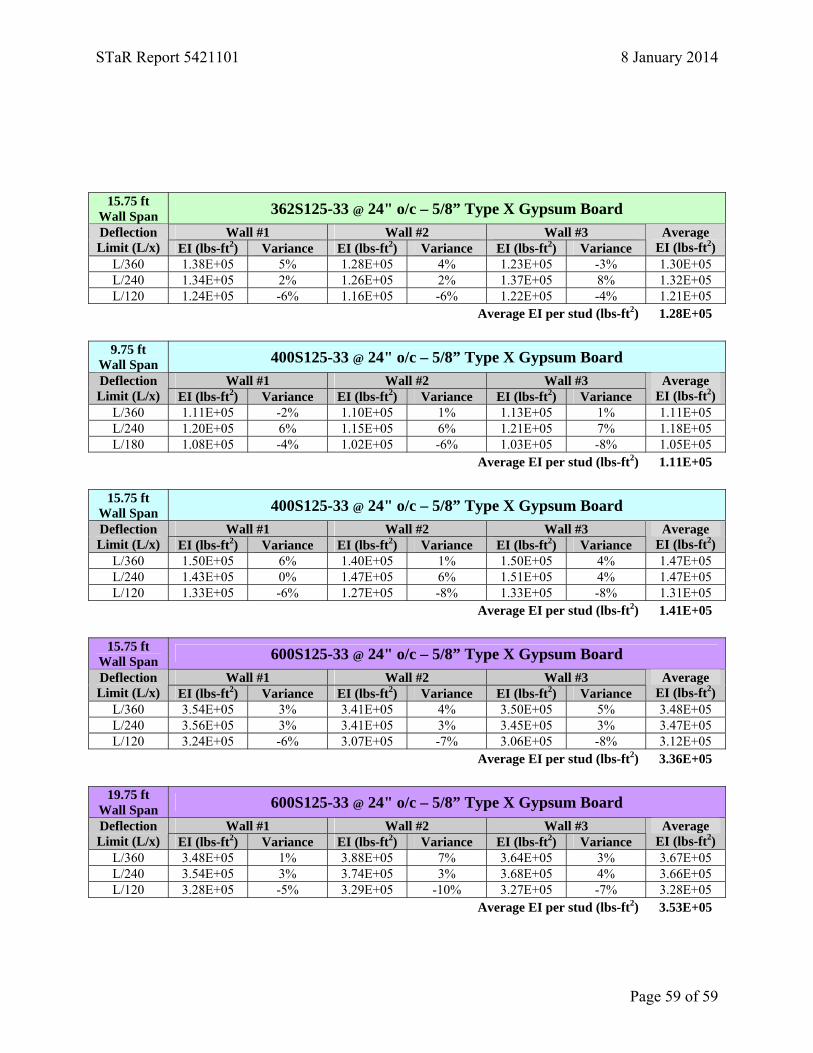
15.75 ft
Wall Span 362S125-33 @ 24" o/c – 5/8” Type X Gypsum Board Wall #1 Wall #2 Wall #3 Deflection
Limit (L/x) EI (lbs-ft2) Variance EI (lbs-ft2) Variance EI (lbs-ft2) Variance Average
EI (lbs-ft2) L/360 1.38E+05 5% 1.28E+05 4% 1.23E+05 -3% 1.30E+05 L/240 1.34E+05 2% 1.26E+05 2% 1.37E+05 8% 1.32E+05 L/120 1.24E+05 -6% 1.16E+05 -6% 1.22E+05 -4% 1.21E+05
Average EI per stud (lbs-ft2) 1.28E+05
9.75 ft Wall Span 400S125-33 @ 24" o/c – 5/8” Type X Gypsum Board
Wall #1 Wall #2 Wall #3 Deflection Limit (L/x) EI (lbs-ft2) Variance EI (lbs-ft2) Variance EI (lbs-ft2) Variance
Average EI (lbs-ft2)
L/360 1.11E+05 -2% 1.10E+05 1% 1.13E+05 1% 1.11E+05 L/240 1.20E+05 6% 1.15E+05 6% 1.21E+05 7% 1.18E+05 L/180 1.08E+05 -4% 1.02E+05 -6% 1.03E+05 -8% 1.05E+05
Average EI per stud (lbs-ft2) 1.11E+05
15.75 ft Wall Span 400S125-33 @ 24" o/c – 5/8” Type X Gypsum Board
Wall #1 Wall #2 Wall #3 Deflection Limit (L/x) EI (lbs-ft2) Variance EI (lbs-ft2) Variance EI (lbs-ft2) Variance
Average EI (lbs-ft2)
L/360 1.50E+05 6% 1.40E+05 1% 1.50E+05 4% 1.47E+05 L/240 1.43E+05 0% 1.47E+05 6% 1.51E+05 4% 1.47E+05 L/120 1.33E+05 -6% 1.27E+05 -8% 1.33E+05 -8% 1.31E+05
Average EI per stud (lbs-ft2) 1.41E+05
15.75 ft Wall Span 600S125-33 @ 24" o/c – 5/8” Type X Gypsum Board
Wall #1 Wall #2 Wall #3 Deflection Limit (L/x) EI (lbs-ft2) Variance EI (lbs-ft2) Variance EI (lbs-ft2) Variance
Average EI (lbs-ft2)
L/360 3.54E+05 3% 3.41E+05 4% 3.50E+05 5% 3.48E+05 L/240 3.56E+05 3% 3.41E+05 3% 3.45E+05 3% 3.47E+05 L/120 3.24E+05 -6% 3.07E+05 -7% 3.06E+05 -8% 3.12E+05
Average EI per stud (lbs-ft2) 3.36E+05
19.75 ft Wall Span 600S125-33 @ 24" o/c – 5/8” Type X Gypsum Board
Wall #1 Wall #2 Wall #3 Deflection Limit (L/x) EI (lbs-ft2) Variance EI (lbs-ft2) Variance EI (lbs-ft2) Variance
Average EI (lbs-ft2)
L/360 3.48E+05 1% 3.88E+05 7% 3.64E+05 3% 3.67E+05 L/240 3.54E+05 3% 3.74E+05 3% 3.68E+05 4% 3.66E+05 L/120 3.28E+05 -5% 3.29E+05 -10% 3.27E+05 -7% 3.28E+05
Average EI per stud (lbs-ft2) 3.53E+05