complexity of functional connectivity networks in mild
TRANSCRIPT
Complexity of functional connectivity networks in mild cognitive impairment subjects during a working memory task Mehran Ahmadlou Anahita Adeli Ricardo Bajo Hojjat Adeli
H I G H L I G H T S
bull We use magneto-encephalograms in patients with mild cognitive impairment (MCI) bull We investigate complexity of functional connectivity network of MCI patients using two different
measures Graph Index Complexity and Efficiency Complexity bull Efficiency Complexity is superior to Graph Index Complexity and its value at theta band can be used
for diagnosis of MCI
A B S T R A C T
Objectives The objective is to study the changes of brain activity in patients with mild cognitive impairshyment (MCI) Using magneto-encephalogram (MEG) signals the authors investigate differences of comshyplexity of functional connectivity network between MCI and normal elderly subjects during a working memory task Methods MEGs are obtained from 18 right handed patients with MCI and 19 age-matched elderly particshyipants without cognitive impairment used as the control group The brain networks complexities are measured by Graph Index Complexity (Cr) and Efficiency Complexity (Q) Results The results obtained by both measurements show complexity of functional networks involved in the working memory function in MCI subjects is reduced at alpha and theta bands compared with subshyjects with control subjects and at the theta band this reduction is more pronounced in the whole brain and intra left hemisphere Conclusions Ce would be a better measurement for showing the global differences between normal and MCI brains compared with Cr Significance The high accuracy of the classification shows Ce at theta band can be used as an index for assessing deficits associated with working memory a good biomarker for diagnosis of MCI
1 Introduction
Mild Cognitive Impairment (MCI) is a heterogeneous cognitive disorder defined as mild deficits in cognitive functions including episodic memory impairment greater than expected by age (Petersen et al 2001 Adeli et al 2005ab 2008) Prevalence of
MCI in elderly population (50-95 years) is between 58 and 185 (Collie and Maruff 2000) MCI patients have a high conversion rate approximately 50 to dementia and hence MCI as a transitional state between healthy aging and dementia is thought as an imporshytant target of treatment for dementia (Choi et al 2009 Villeneuve et al 2009 Ally et al 2009)
Working memory refers to the structures and processes involved in temporarily holding information in mind and manipulating them for further processing (Baddeley and Hitch 1974 Patalong-Ogiewa et al 2009 Ramanathan et al 2012) Impairment of working memory results in impaired executive function in MCI As such investigation of working memory deficits in MCI is of vital importance for understanding of the pathology of MCI and predicting dementia (Collie and Maruff 2000 Wenger et al 2010) MRI-based studies have found gray matter loss in medial temporal parietal and frontal regions in amnestic MCI pashytients (defined as MCI patients with impaired episodic and working memory) (Karas et al 2004 Barbeau et al 2008) In a PET study on word-pair learning Moulin et al (2007) suggested different activashytion patterns in MCI patients compared with normal elderly subshyjects During incremental learning the MCI subjects showed increased activity in the occipital regions (instead of change in frontal activations which occurs in normal subjects) and during reshytrieval they showed increased activity in the left frontal region Patalong-Ogiewa et al 2009) found MCI patients have impairshyments not only in episodic memory but also in working memory which shows the deficit is not restricted only to hippocampus but is more global
In summary the literature shows the changes of brain activity of MCI patients observed in a few neuroimaging studies have been quite variable (Gronholm et al 2007) Hence studying the impairshyment of brain networks during working memory tasks is of great interest Such a study may result in discovery of unique markers for all or specific subsets of MCI patients to be used to identify those who will develop dementia In a recent article Ahmadlou and Adeli (2011a) presented a new methodology for investigation of the structure of the brain functional connectivity and undershystanding of the brain based on graph theory and community patshytern analysis of functional connectivity graph of the brain obtained from encephalograms (EEGs) The methodology consists of three main parts fuzzy synchronization likelihood (FSL) comshymunity partitioning and decisions based on partitions Using magshyneto-encephalogram (MEG) signals in this research the authors investigate differences of complexity of functional connectivity network a global property of the brain between MCI and normal elderly subjects during a working memory task Complexity of functional connectivity network is used to indicate how the neuroshynal regions interact with each other (how much densesparse [in the sense of ratio of the connectivity to the number of brain reshygions] and randomordered [in the sense of distribution of the conshynectivity among the brain regions how much the regions are randomly connected and how much the connectivity is equal beshytween each brain region and the others]) and to determine the effishyciency of the network in transmitting information The higher the complexity during the working memory task the higher the effishyciency of the brain network in transmitting the information associshyated with the working memory
In this research the complexity is computed using two different measures Graph Index Complexity and Efficiency Complexity (Kim and Wilhelm 2008 Bello-Orgaz et al 2012) These measures have been selected because they can measure the global complexshyity of the brain functional connectivity network after quantifying the constructed network using synchronization methods (Besio et al 2011 Han et al 2011 Serletis et al 2013 Rangaprakash et al 2013) The global complexity quantifies the structure of conshynections in a network and determines where it is between random
and rigid structures Complexity in the brain network is a vital characteristic for feasible synchronization and efficient informashytion transmission (Ahmadlou et al 2012a 2013) This means havshying a short and strong pathway between brain regions so that the information can flow easily with optimum number of connections The common concept of correlation or connectivity between brain regions is just a local concept If all brain regions connect to each other with equally strong connections the global network may not be efficient for transmission of the information from one region to another region (since it is paying a lot of extra costconnections) Indeed some areas are hubs (usually high level processing regions) and need more connectivity and other areas do not need high connectivity It is the distribution of these connectivities among the brain regions that determines the efficiency of the brain network
The Graph Index Complexity has been used in other branches of sciences usually to study complexity of social and economic netshyworks The authors were the first researchers to introduce the conshycept of visibility graph in neuroscience but for measuring the complexity of the EEC signals and not for measuring the global complexity of functional brain networks (Ahmadlou et al 2010) They utilized the Graph Index Complexity to measure complexity of the EEC signals The Efficiency Complexity has been used in the neuroscience literature as one of the Small-World Network components (Watts and Strogatz 1998 Han et al 2011) but in this research it is used as an index of complexity of network irreshyspective of the concept of Small-World Network
Many studies show oscillations as well as deficits in theta and alpha frequency bands during working memory tasks in healthy subjects and also MCI patients (Klimesch 1999 Stam 2000 Bastiaansen et al 2002 Schmiedt et al 2005 Deiber et al 2009 Khader et al 2010 Morgan et al 2013) Hence in this study the complexity of functional connectivity networks during the working memory task is analyzed in the theta and alpha frequency bands
2 Methods
21 Participants
All subjects or legal representatives provided written consent to participate in the study which was approved by the local ethics committee of the Hospital Cliacutenico Universitario San Carlos Eighteen right handed patients with MCI were recruited from the Geriatric Unit of the Hospital Cliacutenico Universitario San Carlos Madrid In addition nineteen age-matched elderly participants without cognishytive impairment were included as the control group Age and years of education were matched to the MCI group (for details see Bajo et al 20102012 the same subjects were used in that study) 10 years for the MCI group and 11 years for controls To confirm the absence of memory complaints a score of 0 was required in a 4-question quesshytionnaire (see Mitchell 2008) None of the participants had a history of neurological or psychiatric condition
The diagnosis of MCI was made according to previously pubshylished criteria proposed by Petersen et al (Grundman et al 2004 Petersen 2004) Thus MCI patients fulfilled the following criteria (1) cognitive complaint corroborated by an informant (a person who stays with the patient at least for half a day 4 days a week) (2) objective cognitive impairment documented by delayed recall in the Logical Memory II subtest of the Wechsler Memory Scale-III-Revised (score sgl650 for patients with more than 15 years of education score sg850 for patients with 8-15 years of education) (3) normal general cognitive function as assessed by a clinician during a structured interview with the patient and an informant and additionally a Mini Mental State Examination (MMSE) score greater than 24 (4) relatively preserved daily living
activities as measured by the Lawton scale (5) not sufficiently impaired cognitively or functionally to meet criteria for dementia Age and years of education were matched to the MCI group According to their clinical and neuropsychological profile all subshyjects in this group met criteria for multi-domain MCI (Petersen 2004) None of the subjects with MCI had evidence of depression as measured using the geriatric depression scale (score lower than 9) (Yesavage and Brooks 1991)
MCI subjects and healthy participants underwent a neuropsyshychological assessment in order to establish their cognitive status with respect to multiple cognitive functions Specifically memory impairment was assessed using the Logical Memory immediate (LM1) and delayed (LM2) subtests of the Wechsler Memory Scale-III-Revised Two scales of cognitive and functional status were applied as well the Spanish version of the MMSE (Lobo et al 1979) and the Global Deterioration ScaleFunctional Assessshyment Staging (GDSFAST) It should be noted that the data used in this research are sufficient to make general diagnosis of MCI For the purposes of this paper the MCI subtype is not critical
22 Sternberg task
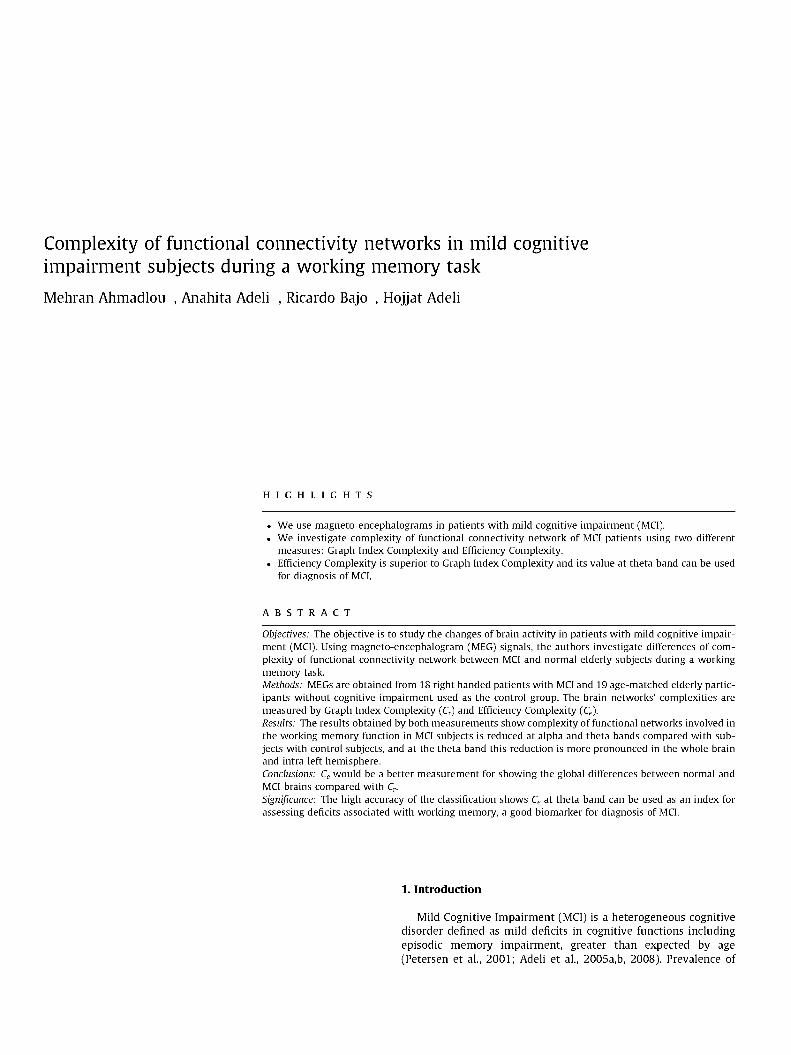
Sternberg Task (Sternberg 1966) is a well-known task for studying working memory used especially in MEG studies (Tula-dhar et al 2007 Deeny et al 2008 Maestu et al 2008 Stephane et al 2010 Brookes et al 2011 Kurimoto et al 2012) Magneto-encephalography (MEG) scans were obtained in the context of a modified version of the Sternbergs letter-probe task (deToledo-Morrell et al 1991 Maestuacute et al 2001) in which a set of five letshyters was presented and subjects were asked to keep the letters in mind After the presentation of the five-letter set a series of single letters (1000 ms in duration with a random ISI between 2 and 3 s) was introduced one at a time and participants were asked to press a button with their right hand when a member of the previous set was detected (Fig 1) The list consisted of 250 letters in which half were targets (previously presented letters) and half distracters (not previously presented letters) Subjects undertook a training series before the actual test The subjects responses were classified into four different categories according to the subjects perforshymance in the experiment hits false alarms correct rejections and omissions Only hits were considered for further analysis beshycause the authors were interested in evaluating the functional conshynectivity patterns which support recognition success The
Fig 1 Representation of the memory task paradigm In the encoding phase participants are instructed to memorize 5 letters that is SMAQE In the recognition phase participants are instructed to make a matchnon-match button-press to indicate that the presented letter matched any of the encoded ones
Jffl 7 bdquo 72 71 94 131 113Q5 7 3 51 5 deg 70 9 3 9
7 4 gt 31 30 49 114 75 52
32 69
112130 1lt8
14
133
|_ 1 1 6 98
134
48 6 8 9 1 33 15 raquo 29 4 7
b B
16 4 13 28 bdquo 90 46 6~
132 Q6 5 3
1 1 5 97 6 54 34 17 5 2 7 7 5 5 35 18 6 1 1 1 26 45 6 6
78 56
57 3 7 deg
148
129
110
89
147
128 146
1 1 7 135
79
102
101 119
137 ^ ^ 120
138
109 1 2 7 R 36 19 7 iquest 1 0 25 44 6 5 8 8 1 4 5
20 8 | 9 24 iquestn 108126 64 87 1 4 4
107 Wf
61 ~ p 2 ^43
83 8 4
21 06 23
100 8 0 5 8 bdquo 3 9 40 41 6 3 8 6 36118 _ 8 1
5 9 60
103
121
139
104
122
140
8 5 106
105 1 2 4
trade 142 123
141
Fig 2 The brain map of the 148 loci where MEG is recorded The vertical line partitions the whole brain into the left (L) and right (R) hemispheres
percentage of hits (80 control group and 84 MCI group) and corshyrect rejections (92 control group and 89 MCI group) was high enough in both groups indicating that participants actively enshygaged in the task No significant difference between the two groups during the memory task was revealed between groups either with respect to the targets (total number of hits misses and reaction time) or to the distracters (correct rejections false alarms and reaction time)
23 MEG recording
The 148-channel MEG (Fig 2) signals were recorded with a 254 Hz sampling frequency and a band pass of 05-50 Hz using a 148-channel whole-head magnetometer (MAGNES 2500 WH 4-D Neuroimaging) confined in a magnetically shielded room in order to reduce the environmental noise All MEG recordings were conshyducted in the morning between 900 AM and 1200 AM During the MEG register subjects performed the Sternberg memory task Fig 3 shows samples of MEG signals at three locations in the fronshytal central and parietal lobes for an MCI (left a b and c respecshytively) and a normal (right d e and f respectively) subject An environmental noise reduction algorithm using reference channels at a distance from the MEG sensors was applied to the data Thereshyafter single trial epochs were visually inspected by an experienced investigator and epochs containing visible blinks eye movements or muscular artifacts were excluded from further analysis All time epochs had one second length without baseline (baseline was not studied) Since the MEG signals have a complex dynamic neuroloshygists are not able to read MEGs or find visual markers Our research provides a methodology to reveal the differences between the two groups
All data were converted to MATLAB format (mat) The MATLAB data of each subject contains a 3-D matrix 148 (number of chanshynels) x 230 (number of sample per epoch) x number of epochs the number of epochs per subject varies between 29 and 100 epochs (some records are discarded because of artifacts)
24 Functional connectivity
Measurements of synchronizations between different brain sigshynals are quantified interdependencies between the associated neushyronal regions Synchronization measurements are classified in two general categories linear methods and nonlinear methods The authors have recently used nonlinear synchronization techniques
20 40 BO 80 100 120 140 160 180 200 220
s a m p l e t i m e
V bullmdash 20 40 60 86 100 120 140 166 186 266 226
e
20 40 60 80 100 120 140 160 180 200 220
20 40 66 86 166 126 146 166 1 BO 200 220
Fig 3 Samples of MEG signals at three locations in frontal central and parietal lobes for an MCI (left a-c respectively) and a normal (right d-f respectively) subject
such as synchronization likelihood (introduced by Stam and van Dijk (2002) fuzzy synchronization likelihood (introduced by Ahmadlou and Adeli (2011b) and visibility graph similarity (introduced by Ahmadlou and Adeli (2012)) for diagnosis of attention deficithyper-activity disorder (ADHD) (Ahmadlou and Adeli 2010b 2012 Ahmadlou and Adeli 2011 ab Ahmadlou et al 2012a) Autism Specshytrum Disorder (ASD) (Ahmadlou et al 2012b) and Major Depressive Disorder (MDD) (Ahmadlou et al 2012c) A large number of sequential sample times is needed for nonlinear synchronization measurements (usually more than 10000 sample times) Each epoch of the MEG signal to be analyzed contains only 230 sample times which precludes the application of nonlinear synchronization methods As such in this research the functional connectivity analshyysis is accomplished through a linear method the classic cross-corshyrelation function
25 Functional connectivity network
A functional connectivity matrix is constructed using the correshylation coefficients between signals of all pair-wise combinations of the channels Fig 4 shows how an example 148-channel MEG set is transformed to its functional connectivity network Computed corshyrelation coefficients between channel pairs are entries of a 148 x 148 connectivity matrix Indeed the connectivity matrix is the adjacency matrix of the weighted connectivity network Fig 4a and b show the grand average connectivity matrices of norshymal and MCI subjects respectively The light intensity of each array indicates the strength of the connectivity The darker intensity indicates a lower value in the connectivity matrices Fig 4a and b illustrate the average connectivity matrices in the networks of the whole brain left hemisphere and right hemisphere of the healthy and MCI groups In the next step the complexity of these networks will be computed for comparison
26 Measuring complexity of networks
In the past decade or so two measures have been proposed in the statistics literature for measuring complexity of a given unshyweighted graph (a graph whose edges have only two value 0 and 1) with JV nodes (Kim and Wilhelm 2008) They are described in Section 26 The original functional connectivity graphs obtained
by neuroimaging tools are weighted graphs but researchers often simplify them by converting them to a binary or unweighted graph using a threshold In doing so significant information is lost Since weights of connectivity graph contain a major part of its structural information (Barrat et al 2004 Li et al 2007) the authors avoid converting it to a binary graph In this study two complexity meashysures are used for a given weighted graph (whose edges have real values in the range of 0 and 1) with JV nodes
261 Graph Index Complexity Cr
Let r be the largest eigenvalue of the adjacency matrix of a weighted or unweighted graph The Graph Index Complexity Cr indicates the diversity or heterogeneity of distribution of the edges over all the nodes defined as (Kim and Wilhelm 2008)
Cr = 4c(l - c)
where
r-2cos(7t(N + l)) N - l -2cos(7i(N + l))
0)
(2)
The index Cr varies between 0 and 1 the more complex the graphs structure the larger will be Cr
262 Efficiency Complexity Ce
Efficiency of a weighted graph is computed by the short path length (the shortest path connecting the pairs edges) of the graph (the shorter the path length the higher the efficiency) which indishycates the speed of information transition from a node to another node of the graph It has been shown that many social and natural networks are of the so-called small-world networks which means coexistence of small short path lengths between nodes with relashytively sufficient number (and not too many more than the suffishycient number) of connections between the nodes There is a positive correlation between the efficiency of a network and the number of its edges The efficiency of a graph is defined as (Latora and Marchiori 2003) (They used it as a characteristic of small-world network but we are using it as a characteristic of complexity of networks)
1
~N(N-^2uUM Efi (3)
Right Hemisphere Left Hemisphere
Right Hemisphere Left Hemisphere
Fig 4 Grand average connectivity matrix of the (a) normal subjects and (b) MCI subjects
where diexcliexcl is defined as inverse of the weight between iexclth node and jth node The index Ce is presented as an overall measure of routing efficiency characteristics of the graph and information transmission flexibility of the network In this research Ce is a measure of the exshytent of average connectivity or overall routing efficiency and flexishybility of the neocortex network which helps different neuronal areas of the network to be synchronized with each other in different situations This feasibility in synchronization is a key point in information transmission and accomplishment of all behavioral and cognitive activities (Ahmadlou et al 2012a) In this way effishyciency of functional connectivity matrices which correspond to neuronal networks structures in the alpha (8-12 Hz) and theta (4-8 Hz) sub-bands are computed
27 Statistical analysis and classification
The one-way Analysis of Variance (ANOVA) was used to evalushyate the ability of the Ce and Cr indices at theta and alpha bands to discriminate between normal and MCI groups Next the Enhanced Probabilistic Neural Network (EPNN) developed by the authors reshycently (Ahmadlou and Adeli 2010a) as an improved version of PNN (Adeli and Panakkat 2009 Lopez-Rubio et al 2011) and a powershy
ful classification technique is used to classify the two groups based on the most discriminating features Local decision circles enable EPNN to incorporate local information and non-homogeneity existshying in the training population The circle has a radius which limits the contribution of the local decision Two parameters the spread parameter and the radius of local decision circles are optimized to maximize the performance of the model Inputs of the EPNN are the features discovered by the one-way ANOVA in the previous step EPNN consists of an input layer with number of nodes equal to the number of the selected features a pattern layer which comshyputes the likelihood of the input data to each training data using two local and global Bayesian rules a summation layer which comshyputes the likelihood of the input data to each class (in this work MCI and healthy) and an output layer with one node which assigns the input data to the class with maximum likelihood The number of nodes in the pattern layer is equal to the number of training data sets and the number of nodes in the summation layer is the same as the number of classes (ie 2) The EPNN has shown successful reshysults in previous studies for diagnosis of autism cerebral palsy and major depression (Ahmadlou et al 2012cd Sajedi et al 2013)
3 Results
31 Clinical evaluations
Table 1 summarizes the demographic and clinical information (age MMSE CDS LM1 and LM2) for both groups The data set used in this study did not include any information about premorbid IQ smoking ApoE typing and the head CT or MRI images from the subshyjects (MCI and Control) The authors acknowledge that this inforshymation would have made the study more valuable
The MCI group performed significantly worse on tests of memshyory ie LM1 and LM2 than normal controls (p lt 00001) The fact that the sample of MCI subjects data used in this research came from a memory clinic rather than from a population-based sample explains the high proportion of amnestic MCI
32 Graph Index Complexity Cr
Table 2 shows the mean and standard deviation of Cr for the whole brain intra left and right hemispheric and inter hemishyspheric neuronal networks (see Fig 2) at alpha and theta bands as well as the associated ANOVA p-values and F-values in discrimshyination of the MCI and healthy elderly groups It shows Cr of the whole brain at alpha band is significantly different between the two groups (p-value lt005) while the ability of Cr in the whole brain and intra left hemisphere in distinguishing the two groups at theta band is much higher (p-value lt00001) Also at the theta band the Cr of the inter-hemispheric network is significantly deshycreased in MCI group (p-value lt005) Fig 5 shows distribution of Cr of the brain neuronal network at (a) alpha and (b) theta (c) Cr
Table 1 Demographic and clinical information of the control and MCI groups (Bajo et al 2010)
Control
MCI
Sample (
19(12 Female) 18(11 Female)
sex) Age
716 plusmn8
748 plusmn 3
MMSE
295 plusmn07
277 plusmn1
CDS
1
3
LM1
425 plusmn 8
191 plusmn5
LM2
267 plusmn 7
131 plusmn6
MMSE Mini Mental State Exam (maximum score is 30) CDS Global Deterioration Scale LM1 Logical Memory immediate recall LM2 Logical Memory delayed recall
p-value for distinguishing the control and MCI groups is significant at the 00001 level
Table 2 First order statistical characteristics of Cr of the whole brain intra left and right hemispheric and inter hemispheric neuronal networks at alpha and theta bands as well as the associated ANOVA p-values and F-values in discrimination of the two groups (M and Std stand for mean and standard deviation respectively)
Band Subjects Whole brain Intra left hemispheric Intra right hemispheric Inter hemispheric
M plusmn Std p-val (F) M plusmn Std p-val (F) M plusmn Std p-val (F) M plusmn Std p-val (F)
Alpha Normal MCI
9828 plusmn009 0246(551)
9866 plusmn 007
Theta Normal MCI
867 plusmn 050
832 plusmn 039 58134 x 1 0 - 5 (2112)
9779 plusmn012
9814 plusmn008
710 plusmn041
693 plusmn 029
1066 (275)
96811 x 10- 5 (1950)
9908 plusmn009 1023(282)
9928 plusmn 005
1023 plusmn053 971 plusmn037
5329 (41)
9875 plusmn010
9900 plusmn 006
994 plusmn 057
933 plusmn 052
0872 (311)
0119 (706)
Correlation is significant at the 005 level Correlation is significant at the 001 level
0995
0985
098
0975
097
0965
096
0955
S a
--
H LJ
-
-
0995 -
099 -
0985
098 -
0975
097
0965 -
Fig 5 C of brain neuronal network at (a) alpha and (b) theta (c) C of intra left hemispheric network at theta and (d) C of inter hemispheric network at theta
Table 3 First order statistical characteristics of Ce of the whole brain intra left and right hemispheric and inter hemispheric neuronal networks at alpha and theta bands as well as the associated ANOVA p-values and F values in discrimination of the two groups (M and Std stand for mean and standard deviation respectively)
Band Subjects Whole brain Intra left hemispheric Intra right hemispheric Inter hemispheric
M plusmn Std p-val (F) M plusmn Std p-val (F) M plusmn Std p-val (F) M plusmn Std p-val (F)
Alpha
Theta
Normal MCI
Normal MCI
1121 plusmn041 1105 plusmn036
867 plusmn 050
832 plusmn 039
0068 (83)
56533 x 10- 5 (2115)
1091 plusmn040 1074 plusmn033
710 plusmn041
693 plusmn 029
052 (406)
74952 x 10~ (203)
1037 plusmn045 1029 plusmn031
1023 plusmn053 971 plusmn037
1664 (20)
5366 (39)
1078 plusmn 045 1066 plusmn 033
994 plusmn 057
933 plusmn 052
1069 (274)
0026(106)
Correlation is significant at the 005 level Correlation is significant at the 001 level
of intra left hemispheric network at theta and (d) Cr of inter hemishyspheric network at theta In all cases Cr is decreased in MCI subjects
33 Efficiency Complexity Ce
The same results with slightly better p-values were obtained by Ce Table 3 shows the mean and standard deviation of Ce of the whole brain intra left and right hemispheric and inter hemishyspheric neuronal networks at alpha and theta bands as well as the associated ANOVA p-values and F-values in discrimination of
the MCI and healthy elderly groups It is observed that at alpha band only Ce of the hole brain is significantly different between the two groups (p-value lt001) while at theta band the ability of Ce in the whole brain and intra left hemisphere in distinguishing the two groups is much higher (p-value lt00001) Also at the theta band Ce of the inter-hemispheric network is significantly deshycreased in MCI group (p-value lt001) Fig 6 shows distribution of Ce of the brain neuronal network at (a) alpha and (b) theta (c) Ce
of intra left hemispheric network at theta and (d) Ce of inter hemishyspheric network at theta In all cases the Ce is decreased in MCI subjects
078
076
072
068
066
064
C
bull
S -i i y
bull
Fig 6 Ce of brain neuronal network at (a) alpha and (b) theta (c) Ce of intra left hemispheric network at theta and (d) Ce of inter hemispheric network at theta
The complexity of the brain network (Ce and Cr) was computed in other subbands delta (05-4 Hz) beta (13-30 Hz) and gamma (30-70 Hz)) as well The results did not indicate any meaningful difference
34 Classification
Since the ANOVA tests showed Ce of the whole brain and intra left hemisphere at theta band are the most discriminating features (see Tables 2 and 3) the classification was accomplished based on those two features There are three standard methods of cross-valshyidation Leave-one-out K-fold and repeated random sub-samshypling We used the repeated random sub-sampling cross validation method because based on our previous studies we found it more reliable than others
A cross validation of repeated random sub-sampling of data with testing-to-training data ratio of 20-80 was performed over 100 repetitions to report reliably accurate classification results An average accuracy of 976 was obtained using the EPNN classishyfier with sensitivity of 992 and specificity of 948
It should be noted that a conventional method of classification that is the linear discriminant analysis (LDA) was also employed in this research An accuracy of 928 was obtained substantially less than that obtained by the EPNN
4 Discussion and conclusion
Impaired working memory is a major problem in MCI espeshycially in amnestic MCI Previous studies have investigated various local brain networks and regions associated with impaired working memory in subjects with MCI Decreasing posterior alpha power in MCI patients (Babiloni et al 2008) gray matter loss in temporal parietal and frontal regions (Karas et al 2004 Barbeau et al 2008) and increased activity of occipital regions in MCI subjects during incremental learning (Moulin et al 2007) are some of the major findings previously reported Although there are some studshyies on functional connectivity of MCIs brain (Goacutemez et al 2009
Escudero et al 2011) only a few researchers have investigated the global organization of brain networks in MCI (de Haan et al 2012)
Several studies indicate that an increase in the task difficulty reshyquires further synchronization of the brain network (Korobeinik-ova and Karatygin 2012 Bernarding et al 2013) The authors hypothesize that MCI subjects are more inefficient in the task exeshycution They need to make a greater effort to perform the same task
In this paper in order to study global variations in the working memory of the MCI brain relative to the normal brain the authors examined the complexity of functional networks of whole inter-hemispheric and intra-hemispheric brain of MCI subjects during the Sternberg task and compared it with those of normal subjects The networks complexities were measured by Graph Index Comshyplexity (Cr) and Efficiency Complexity (Ce) As theta and alpha bands are well-known frequencies involved in working memory functions the Cr and Ce were computed and investigated in these frequency bands for both MCI and normal subjects
The results obtained by both measurements (Cr and Ce) showed complexity of functional networks involved in the working memshyory function in MCI subjects were reduced at both alpha and theta bands compared with subjects with normal cognition and at the theta band this reduction is more pronounced in the whole brain and intra left hemisphere This means the connectivity of the funcshytional brain network in MCI subjects is such that the network has less efficiency with slower information transmission during the verbal working memory task Since the verbal and phonological information is processed mainly in the left hemisphere a possible explanation of finding more deficits in the left hemisphere in our study is that we used a verbal task Also the results show that Ce
would be a better measurement for showing the global differences between normal and MCI brains (with p-values less than 00001) compared with Cr Furthermore the high accuracy of the classificashytion shows Ce at theta band can be used as an index for assessing deficits associated with working memory a good biomarker for diagnosis of MCI Further studies are needed to determine if this inshydex can be used in the pre-MCI stage to determine which individ-
uals with normal cognition will go onto develop MCI as this would be useful for prognostication and for the institution of therapies once they become available The results show the differences of the network complexity between the two groups are more signifishycant in the left intra-hemispheric network relative to the right one This may be explained by the fact that semantic processing and also word learning are more associated with left hemisphere (espeshycially left prefrontal cortex and left temporal cortex) and hence it is why complexity of the left intra-hemispheric network during the Sternberg task has been changed much more in MCI compared with the right intra-hemispheric network (Gronholm et al 2007 Clement et al 2010)
Since the Efficiency Complexity in the MCI group is clearly lowshyer than in the Control Group this research verifies the authors hypothesis Both groups are performing comparably in the Sternshyberg task but with a different efficiency
As noted in the Section 1 Ahmadlou and Adeli (2011a) preshysented a new methodology for investigation of the structure of the brain functional connectivity based on graph theory and comshymunity pattern analysis of functional connectivity graph of the brain obtained from EEGs From the viewpoint of Functional Conshynectivity analysis compared with EEGs where one specific channel is needed as the reference for the other channels the main advanshytage of MEG records is no reference channel is needed (see Knake 2006 Leahy et al 1998) Other advantages are that MEG presents a better signal to noise ratio especially in the high frequency bands and the fact that biological tissue is much more transparent (see Muthukumaraswamy 2013 for a review) to magnetic fields (MEG) than to EEGs thus making MEG a bit more sensitive Finally the authors overarching research ideology advances a multi-modshyal measurement and analysis approach as the most effective way to investigate the complex brain system
Only one set of five letters was used This would substantially affect the interpretation Consequently one may consider the task applied to be an atypical short-term memory task Considering the relatively small size of the data sample (18+19 subjects) the reshysults may be considered preliminary Additional studies are needed to validate the consistency of the outcomes presented in this article
References
Adeli H Ghosh-Dastidar S Dadmehr N Alzheimers disease and models of computation imaging classification and neural models J Alzheimers Dis 2005a7187-99
Adeli H Ghosh-Dastidar S Dadmehr N Alzheimers disease models of computation and analysis of EEGs Clin EEC Neurosci 2005b36131-40
Adeli H Ghosh-Dastidar S Dadmehr N A spatio-temporal wavelet-chaos methodology for EEG-based diagnosis of Alzheimers disease Neurosci Lett 2008444190-4
Adeli H Panakkat A A probabilistic neural network for earthquake magnitude prediction Neural Netw 2009221018-24
Ahmadlou M Adeli H Enhanced probabilistic neural network with local decision circles a robust classifier Integr Comput-Aid E 2010a17197-210
Ahmadlou M Adeli H Wavelet-synchronization methodology a new approach for EEG-based diagnosis of ADHD Clin EEC Neurosci 2010b41l-10
Ahmadlou M Adeli H Functional community analysis of brain a new approach for EEG-based investigation of the brain pathology Neurolmage 2011a58401-8
Ahmadlou M Adeli H Fuzzy synchronization likelihood with application to attention-deficithyperactivity disorder Clin EEC Neurosci 2011b426-13
Ahmadlou M Adeli H Visibility graph similarity a new measure of generalized synchronization in coupled dynamic systems Physica D 2012241326-32
Ahmadlou M Adeli H Adeli A New diagnostic EEC markers of the Alzheimers disease using visibility graph J Neural Transm 20101171099-109
Ahmadlou M Adeli H Amir A Graph theoretical analysis of organization of functional brain networks in ADHD Clin EEC Neurosci 2012a435-13
Ahmadlou M Adeli H Adeli A Improved visibility graph fractality with application for diagnosis of autism spectrum disorder Physica A 2012b3914720-6
Ahmadlou M Adeli H Adeli A Fractality analysis of frontal brain in major depressive disorder IntJ Psychophysiol 2012c85206-ll
Ahmadlou M Adeli H Adeli A Fuzzy synchronization likelihood-wavelet methodology for diagnosis of autism spectrum disorder J Neurosci Methods 2012d211203-9
Ahmadlou M Ahmadi K Rezazade M Azad-Marzabadi E Global organization of functional brain connectivity in methamphetamine abusers Clin Neurophysiol 20131241122-31
Ally BA McKeever JD Waring JD Budson AE Preserved frontal memorial processing for pictures in patients with mild cognitive impairment Neuropsychologia 2009472044-55
Babiloni C Frisoni GB Pievani M Toscano L Del Percio C Geroldi C et al White-matter vascular lesions correlate with alpha EEC sources in mild cognitive impairment Neuropsychologia 2008461707-20
Baddeley AD Hitch G Working memory In Bower GA editor The psychology of learning and motivation advances in research and theory 1974vol 8 New York Academic Press 1974 p 47-89
Bajo R Maest F Nevado A Sancho M Gutieacuterrez R Campo P et al Functional connectivity in mild cognitive impairment during a memory task implications for the disconnection hypothesis J Alzheimers Dis 201022 183-93
Bajo R Castellanos NP Cuesta P Aurtenetxe S Garcia-Prieto J Gil-Gregorio P et al Differential patterns of connectivity in progressive mild cognitive impairment Brain Connect 2012221-4
Barbeau EJ Ranjeva JP Didic M Confort-Gouny S Felician O Soulier E et al Profile of memory impairment and gray matter loss in amnestic mild cognitive impairment Neuropsychologia 2008461009-19
Barrat A Barthelemy M Pastor-Satorras R Vespignani A The architecture of complex weighted networks PNAS 20041013747-52
Bastiaansen MCM Posthuma D Groot PFC de Geus EJC Event-related alpha and theta responses in a visuo-spatial working memory task Clin Neurophysiol 20021131882-93
Bello-Orgaz G Menendez H Camacho D Adaptive K-means algorithm for overlapped graph clustering IntJ Neural Syst 2012221250018
Bernarding C Strauss DJ Hannemann R Seidler H Corona-Strauss FI Neural correlates of listening effort related factors influence of age and hearing impairment Brain Res Bull 20139121-30
Besio WG Liu X Wang L Medvedev AV Koka K Transcutaneous focal electrical stimulation via concentric ring electrodes reduces synchrony induced by pentylenetetrazole in beta and gamma bands in rats Int J Neural Syst 201121139-49
Brookes MJ Wood JR Stevenson CM Zumer JM White TP Liddle PF et al Changes in brain network activity during working memory tasks a magnetoencephalography study Neuroimage 2011551804-15
Choi EH Jung KI Jun AY Kang SW Clinical characteristics of patients in a dementia prevention center J Neurol Sci 2009283291-2
Clement F Belleville S Mellah S Functional neuroanatomy of the encoding and retrieval processes of verbal episodic memory in MCI Cortex 2010461005-15
Collie A Maruff P The neuropsychology of preclinical Alzheimers disease and mild cognitive impairment Neurosci Biobehav Rev 200024365-74
Deeny SP Poeppel D Zimmerman JB Roth SM Brandauer J Witkowski S et al Exercise APOE and working memory MEG and behavioral evidence for benefit of exercise in epsilon4 carriers Biol Psychol 200878179-87
de Haan W Mott K van Straaten EC Scheltens P Stam CJ Activity dependent degeneration explains hub vulnerability in Alzheimers disease PLoS Comput Biol 20128el002582
Deiber MP Ibanez V Missonnier P Herrmann F Fazio-Costa L Gold G et al Abnormal-induced theta activity supports early directed-attention network deficits in progressive MCI Neurobiol Aging 2009301444-52
deToledo-Morrell L Evers S Hoeppner TJ Morrell F Garroacuten DC Fox JH A stress test for memory dysfunction electrophysiologic manifestations of early Alzheimers disease Arch Neurol 199148605-9
Escudero J Sanei S Jarchi D Absolo D Hornero R Regional coherence evaluation in mild cognitive impairment and Alzheimers disease based on adaptively extracted magnetoencephalogram rhythms Physiol Meas 2011321163-80
Goacutemez C Stam CJ Hornero R Fernndez A Maest F Disturbed beta band functional connectivity in patients with mild cognitive impairment an MEG study IEEE Trans Biomed Eng 2009561683-90
Gronholm P Rinne JO Vorobyev VA Laine M Neural correlates of naming newly learned objects in MCI Neuropsychologia 2007452355-68
Grundman M Petersen RC Ferris SH Thomas RG Aisen PS Bennett DA et al Mild cognitive impairment can be distinguished from Alzheimer disease and normal aging for clinical trials Arch Neurol 20046159-66
Han F Wiercigroch M Fang JA Wang Z Excitement and synchronization of small-world neuronal networks with short-term synaptic plasticity Int J Neural Syst 201121415-25
Karas G Scheltens P Rombouts S Visser P van Schijndel R Fox N et al Global and local gray matter loss in mild cognitive impairment and Alzheimers disease Neuroimage 200423708-16
Khader PH Jost K Ranganath C Rosier F Theta and alpha oscillations during working-memory maintenance predict successful long-term memory encoding Neurosci Lett 2010468339-43
Kim J Wilhelm T What is a complex graph Physica A 20083872637-52 Klimesch W EEC alpha and theta oscillations reflect cognitive and memory
performance a review and analysis Brain Res Rev 199929169-95 Knake S Halgren E Shiraishi H Hara K Hamer HM Grant PE et al The value of
multichannel MEG and EEC in the presurgical evaluation of 70 epilepsy patients Epilepsy Res 20066980-6
Korobeinikova II Karatygin NA Spectral-coherent characteristics of EEC alpha rhythm in different efficiency of visual spatial task performance in humans Bull Exp Biol Med 2012153601-4
Kurimoto R Ishii R Canuet L Ikezawa K Iwase M Azechi M et al Induced oscillatory responses during the Sternbergs visual memory task in patients with Alzheimers disease and mild cognitive impairment Neuroimage 2012594132-40
Latora V Marchiori M Economic small-world behavior in weighted networks Eur PhysJB 200332249-63
Leahy RM Mosher JC Spencer ME Huang MX Lewine JD A study of dipole localization accuracy for MEG and EEC using a human skull phantom Electroencephalogr Clin Neurophysiol 1998107159-73
Li W Lin Y Liu Y The structure of weighted small-world networks Physica A 2007376708-18
Lobo A Ezquerra J Gomez BF Sala JM Seva DA Cognocitive mini-test (a simple practical test to detect intellectual changes in medical patients) Actas Luso Esp Neurol Psiquiatr Cientildee Afines 19797189-202
Lopez-Rubio E Luque-Baena RM Domiacutenguez E Foreground detection in video sequences with probabilistic self-organizing maps Int J Neural Syst 201121225-46
Maest F Fernandez A Simos PG Gil-Gregorio P Amo C Rodriguez R et al Spatio-temporal patterns of brain magnetic activity during a memory task in Alzheimers disease Neuroreport 2001123917-22
Maest F Campo P Del Ro D Moratti S Gil-Gregorio P Fernndez A et al Increased biomagnetic activity in the ventral pathway in mild cognitive impairment Clin Neurophysiol 20081191320-7
Mitchell AJ Is it time to separate subjective cognitive complaints from the diagnosis of mild cognitive impairment Age Ageing 200837497-9
Morgan HM Jackson MC van Koningsbruggen MG Shapiro KL Linden DEJ Frontal and parietal theta burst TMS impairs working memory for visual-spatial conjunctions Brain Stimul 20136122-9
Moulin CJ Laine M Rinne JO Kaasinen V Sipila H Hiltunen J et al Brain function during multi-trial learning in mild cognitive impairment a PET activation study Brain Res 20071136132-41
Muthukumaraswamy SD High frequency brain activity and muscle artifacts in MEGEEG a review and recommendations Front Hum Neurosci 2013 http dxdoiorg103389fnhum201300138
Patalong-Ogiewa MB Siuda JS Opala GM Working and episodic memory in the MCI group J Neurol Sci 2009283291
Petersen RC Mild cognitive impairment as a diagnostic entity J Intern Med 2004256183-94
Petersen RC Doody R Kurz A Mohs RC Morris JC Rabins PV et al Current concepts in mild cognitive impairment Arch Neurol 2001581985-92
Ramanathan K Ning N Dhanasekar D Guoqi L Luping S Vadakkepat P Presynaptic learning and memory with a persistent firing neuron and a habituating synapse A model of short term persistent habituation Int J Neural Syst 2012221250015
Rangaprakash D Hu X Deshpande G Phase synchronization in brain networks derived from correlation between probabilities of Recurrences in functional MRI data Int J Neural Syst 2013231350003
Sajedi F Ahmadlou M Vameghi R Gharib M Hemmati S Linear and nonlinear analysis of brain dynamics in children with cerebral palsy Res Dev Disabil 2013341388-96
Schmiedt C Brand A Hildebrandt H Basar-Eroglu C Event-related theta oscillations during working memory tasks in patients with schizophrenia and healthy controls Cognitive Brain Res 200525936-47
Serletis D Carien PL Vahante TA Bardakjian BL Phase synchronization of neuronal noise in mouse Hippocampal epileptiform dynamics Int J Neural Syst 2013231250033
Stam CJ Brain dynamics in theta and alpha frequency bands and working memory performance in humans Neurosci Lett 2000286115-8
Stam CJ van Dijk BW Synchronization likelihood an unbiased measure of generalized synchronization in multivariate data sets Physica D 2002163236-51
Stephane M Ince NF Kuskowski M Leuthold A Tewfik AH Nelson K et al Neural oscillations associated with the primacy and recency effects of verbal working memory Neurosci Lett 2010473172-7
Sternberg S High-speed scanning in human memory Science 1966153652-4 Tuladhar AM ter Huurne N Schoffelen JM Maris E Oostenveld R Jensen 0 Parietoshy
occipital sources account for the increase in alpha activity with working memory load Hum Brain Mapp 200728785-92
Villeneuve S Belleville S Lacombe J Labelle MA Enriquez-Rosas A Gauthier S Episodic memory deficits in vascular and non vascular mild cognitive impairment J Neurol Sci 2009283291
Watts DJ Strogatz SH Collective dynamics of small-world networks Nature 1998393409-10
Wenger MJ Negash S Petersen RC Petersen L Modeling and estimating recall processing capacity sensitivity and diagnostic utility in application to mild cognitive impairment J Math Psychol 20105473-89
Yesavage JA Brooks JO On the importance of longitudinal research in Alzheimers disease J Am Geriatr Soc 199139942-9

MCI in elderly population (50-95 years) is between 58 and 185 (Collie and Maruff 2000) MCI patients have a high conversion rate approximately 50 to dementia and hence MCI as a transitional state between healthy aging and dementia is thought as an imporshytant target of treatment for dementia (Choi et al 2009 Villeneuve et al 2009 Ally et al 2009)
Working memory refers to the structures and processes involved in temporarily holding information in mind and manipulating them for further processing (Baddeley and Hitch 1974 Patalong-Ogiewa et al 2009 Ramanathan et al 2012) Impairment of working memory results in impaired executive function in MCI As such investigation of working memory deficits in MCI is of vital importance for understanding of the pathology of MCI and predicting dementia (Collie and Maruff 2000 Wenger et al 2010) MRI-based studies have found gray matter loss in medial temporal parietal and frontal regions in amnestic MCI pashytients (defined as MCI patients with impaired episodic and working memory) (Karas et al 2004 Barbeau et al 2008) In a PET study on word-pair learning Moulin et al (2007) suggested different activashytion patterns in MCI patients compared with normal elderly subshyjects During incremental learning the MCI subjects showed increased activity in the occipital regions (instead of change in frontal activations which occurs in normal subjects) and during reshytrieval they showed increased activity in the left frontal region Patalong-Ogiewa et al 2009) found MCI patients have impairshyments not only in episodic memory but also in working memory which shows the deficit is not restricted only to hippocampus but is more global
In summary the literature shows the changes of brain activity of MCI patients observed in a few neuroimaging studies have been quite variable (Gronholm et al 2007) Hence studying the impairshyment of brain networks during working memory tasks is of great interest Such a study may result in discovery of unique markers for all or specific subsets of MCI patients to be used to identify those who will develop dementia In a recent article Ahmadlou and Adeli (2011a) presented a new methodology for investigation of the structure of the brain functional connectivity and undershystanding of the brain based on graph theory and community patshytern analysis of functional connectivity graph of the brain obtained from encephalograms (EEGs) The methodology consists of three main parts fuzzy synchronization likelihood (FSL) comshymunity partitioning and decisions based on partitions Using magshyneto-encephalogram (MEG) signals in this research the authors investigate differences of complexity of functional connectivity network a global property of the brain between MCI and normal elderly subjects during a working memory task Complexity of functional connectivity network is used to indicate how the neuroshynal regions interact with each other (how much densesparse [in the sense of ratio of the connectivity to the number of brain reshygions] and randomordered [in the sense of distribution of the conshynectivity among the brain regions how much the regions are randomly connected and how much the connectivity is equal beshytween each brain region and the others]) and to determine the effishyciency of the network in transmitting information The higher the complexity during the working memory task the higher the effishyciency of the brain network in transmitting the information associshyated with the working memory
In this research the complexity is computed using two different measures Graph Index Complexity and Efficiency Complexity (Kim and Wilhelm 2008 Bello-Orgaz et al 2012) These measures have been selected because they can measure the global complexshyity of the brain functional connectivity network after quantifying the constructed network using synchronization methods (Besio et al 2011 Han et al 2011 Serletis et al 2013 Rangaprakash et al 2013) The global complexity quantifies the structure of conshynections in a network and determines where it is between random
and rigid structures Complexity in the brain network is a vital characteristic for feasible synchronization and efficient informashytion transmission (Ahmadlou et al 2012a 2013) This means havshying a short and strong pathway between brain regions so that the information can flow easily with optimum number of connections The common concept of correlation or connectivity between brain regions is just a local concept If all brain regions connect to each other with equally strong connections the global network may not be efficient for transmission of the information from one region to another region (since it is paying a lot of extra costconnections) Indeed some areas are hubs (usually high level processing regions) and need more connectivity and other areas do not need high connectivity It is the distribution of these connectivities among the brain regions that determines the efficiency of the brain network
The Graph Index Complexity has been used in other branches of sciences usually to study complexity of social and economic netshyworks The authors were the first researchers to introduce the conshycept of visibility graph in neuroscience but for measuring the complexity of the EEC signals and not for measuring the global complexity of functional brain networks (Ahmadlou et al 2010) They utilized the Graph Index Complexity to measure complexity of the EEC signals The Efficiency Complexity has been used in the neuroscience literature as one of the Small-World Network components (Watts and Strogatz 1998 Han et al 2011) but in this research it is used as an index of complexity of network irreshyspective of the concept of Small-World Network
Many studies show oscillations as well as deficits in theta and alpha frequency bands during working memory tasks in healthy subjects and also MCI patients (Klimesch 1999 Stam 2000 Bastiaansen et al 2002 Schmiedt et al 2005 Deiber et al 2009 Khader et al 2010 Morgan et al 2013) Hence in this study the complexity of functional connectivity networks during the working memory task is analyzed in the theta and alpha frequency bands
2 Methods
21 Participants
All subjects or legal representatives provided written consent to participate in the study which was approved by the local ethics committee of the Hospital Cliacutenico Universitario San Carlos Eighteen right handed patients with MCI were recruited from the Geriatric Unit of the Hospital Cliacutenico Universitario San Carlos Madrid In addition nineteen age-matched elderly participants without cognishytive impairment were included as the control group Age and years of education were matched to the MCI group (for details see Bajo et al 20102012 the same subjects were used in that study) 10 years for the MCI group and 11 years for controls To confirm the absence of memory complaints a score of 0 was required in a 4-question quesshytionnaire (see Mitchell 2008) None of the participants had a history of neurological or psychiatric condition
The diagnosis of MCI was made according to previously pubshylished criteria proposed by Petersen et al (Grundman et al 2004 Petersen 2004) Thus MCI patients fulfilled the following criteria (1) cognitive complaint corroborated by an informant (a person who stays with the patient at least for half a day 4 days a week) (2) objective cognitive impairment documented by delayed recall in the Logical Memory II subtest of the Wechsler Memory Scale-III-Revised (score sgl650 for patients with more than 15 years of education score sg850 for patients with 8-15 years of education) (3) normal general cognitive function as assessed by a clinician during a structured interview with the patient and an informant and additionally a Mini Mental State Examination (MMSE) score greater than 24 (4) relatively preserved daily living
activities as measured by the Lawton scale (5) not sufficiently impaired cognitively or functionally to meet criteria for dementia Age and years of education were matched to the MCI group According to their clinical and neuropsychological profile all subshyjects in this group met criteria for multi-domain MCI (Petersen 2004) None of the subjects with MCI had evidence of depression as measured using the geriatric depression scale (score lower than 9) (Yesavage and Brooks 1991)
MCI subjects and healthy participants underwent a neuropsyshychological assessment in order to establish their cognitive status with respect to multiple cognitive functions Specifically memory impairment was assessed using the Logical Memory immediate (LM1) and delayed (LM2) subtests of the Wechsler Memory Scale-III-Revised Two scales of cognitive and functional status were applied as well the Spanish version of the MMSE (Lobo et al 1979) and the Global Deterioration ScaleFunctional Assessshyment Staging (GDSFAST) It should be noted that the data used in this research are sufficient to make general diagnosis of MCI For the purposes of this paper the MCI subtype is not critical
22 Sternberg task
Sternberg Task (Sternberg 1966) is a well-known task for studying working memory used especially in MEG studies (Tula-dhar et al 2007 Deeny et al 2008 Maestu et al 2008 Stephane et al 2010 Brookes et al 2011 Kurimoto et al 2012) Magneto-encephalography (MEG) scans were obtained in the context of a modified version of the Sternbergs letter-probe task (deToledo-Morrell et al 1991 Maestuacute et al 2001) in which a set of five letshyters was presented and subjects were asked to keep the letters in mind After the presentation of the five-letter set a series of single letters (1000 ms in duration with a random ISI between 2 and 3 s) was introduced one at a time and participants were asked to press a button with their right hand when a member of the previous set was detected (Fig 1) The list consisted of 250 letters in which half were targets (previously presented letters) and half distracters (not previously presented letters) Subjects undertook a training series before the actual test The subjects responses were classified into four different categories according to the subjects perforshymance in the experiment hits false alarms correct rejections and omissions Only hits were considered for further analysis beshycause the authors were interested in evaluating the functional conshynectivity patterns which support recognition success The
Fig 1 Representation of the memory task paradigm In the encoding phase participants are instructed to memorize 5 letters that is SMAQE In the recognition phase participants are instructed to make a matchnon-match button-press to indicate that the presented letter matched any of the encoded ones
Jffl 7 bdquo 72 71 94 131 113Q5 7 3 51 5 deg 70 9 3 9
7 4 gt 31 30 49 114 75 52
32 69
112130 1lt8
14
133
|_ 1 1 6 98
134
48 6 8 9 1 33 15 raquo 29 4 7
b B
16 4 13 28 bdquo 90 46 6~
132 Q6 5 3
1 1 5 97 6 54 34 17 5 2 7 7 5 5 35 18 6 1 1 1 26 45 6 6
78 56
57 3 7 deg
148
129
110
89
147
128 146
1 1 7 135
79
102
101 119
137 ^ ^ 120
138
109 1 2 7 R 36 19 7 iquest 1 0 25 44 6 5 8 8 1 4 5
20 8 | 9 24 iquestn 108126 64 87 1 4 4
107 Wf
61 ~ p 2 ^43
83 8 4
21 06 23
100 8 0 5 8 bdquo 3 9 40 41 6 3 8 6 36118 _ 8 1
5 9 60
103
121
139
104
122
140
8 5 106
105 1 2 4
trade 142 123
141
Fig 2 The brain map of the 148 loci where MEG is recorded The vertical line partitions the whole brain into the left (L) and right (R) hemispheres
percentage of hits (80 control group and 84 MCI group) and corshyrect rejections (92 control group and 89 MCI group) was high enough in both groups indicating that participants actively enshygaged in the task No significant difference between the two groups during the memory task was revealed between groups either with respect to the targets (total number of hits misses and reaction time) or to the distracters (correct rejections false alarms and reaction time)
23 MEG recording
The 148-channel MEG (Fig 2) signals were recorded with a 254 Hz sampling frequency and a band pass of 05-50 Hz using a 148-channel whole-head magnetometer (MAGNES 2500 WH 4-D Neuroimaging) confined in a magnetically shielded room in order to reduce the environmental noise All MEG recordings were conshyducted in the morning between 900 AM and 1200 AM During the MEG register subjects performed the Sternberg memory task Fig 3 shows samples of MEG signals at three locations in the fronshytal central and parietal lobes for an MCI (left a b and c respecshytively) and a normal (right d e and f respectively) subject An environmental noise reduction algorithm using reference channels at a distance from the MEG sensors was applied to the data Thereshyafter single trial epochs were visually inspected by an experienced investigator and epochs containing visible blinks eye movements or muscular artifacts were excluded from further analysis All time epochs had one second length without baseline (baseline was not studied) Since the MEG signals have a complex dynamic neuroloshygists are not able to read MEGs or find visual markers Our research provides a methodology to reveal the differences between the two groups
All data were converted to MATLAB format (mat) The MATLAB data of each subject contains a 3-D matrix 148 (number of chanshynels) x 230 (number of sample per epoch) x number of epochs the number of epochs per subject varies between 29 and 100 epochs (some records are discarded because of artifacts)
24 Functional connectivity
Measurements of synchronizations between different brain sigshynals are quantified interdependencies between the associated neushyronal regions Synchronization measurements are classified in two general categories linear methods and nonlinear methods The authors have recently used nonlinear synchronization techniques
20 40 BO 80 100 120 140 160 180 200 220
s a m p l e t i m e
V bullmdash 20 40 60 86 100 120 140 166 186 266 226
e
20 40 60 80 100 120 140 160 180 200 220
20 40 66 86 166 126 146 166 1 BO 200 220
Fig 3 Samples of MEG signals at three locations in frontal central and parietal lobes for an MCI (left a-c respectively) and a normal (right d-f respectively) subject
such as synchronization likelihood (introduced by Stam and van Dijk (2002) fuzzy synchronization likelihood (introduced by Ahmadlou and Adeli (2011b) and visibility graph similarity (introduced by Ahmadlou and Adeli (2012)) for diagnosis of attention deficithyper-activity disorder (ADHD) (Ahmadlou and Adeli 2010b 2012 Ahmadlou and Adeli 2011 ab Ahmadlou et al 2012a) Autism Specshytrum Disorder (ASD) (Ahmadlou et al 2012b) and Major Depressive Disorder (MDD) (Ahmadlou et al 2012c) A large number of sequential sample times is needed for nonlinear synchronization measurements (usually more than 10000 sample times) Each epoch of the MEG signal to be analyzed contains only 230 sample times which precludes the application of nonlinear synchronization methods As such in this research the functional connectivity analshyysis is accomplished through a linear method the classic cross-corshyrelation function
25 Functional connectivity network
A functional connectivity matrix is constructed using the correshylation coefficients between signals of all pair-wise combinations of the channels Fig 4 shows how an example 148-channel MEG set is transformed to its functional connectivity network Computed corshyrelation coefficients between channel pairs are entries of a 148 x 148 connectivity matrix Indeed the connectivity matrix is the adjacency matrix of the weighted connectivity network Fig 4a and b show the grand average connectivity matrices of norshymal and MCI subjects respectively The light intensity of each array indicates the strength of the connectivity The darker intensity indicates a lower value in the connectivity matrices Fig 4a and b illustrate the average connectivity matrices in the networks of the whole brain left hemisphere and right hemisphere of the healthy and MCI groups In the next step the complexity of these networks will be computed for comparison
26 Measuring complexity of networks
In the past decade or so two measures have been proposed in the statistics literature for measuring complexity of a given unshyweighted graph (a graph whose edges have only two value 0 and 1) with JV nodes (Kim and Wilhelm 2008) They are described in Section 26 The original functional connectivity graphs obtained
by neuroimaging tools are weighted graphs but researchers often simplify them by converting them to a binary or unweighted graph using a threshold In doing so significant information is lost Since weights of connectivity graph contain a major part of its structural information (Barrat et al 2004 Li et al 2007) the authors avoid converting it to a binary graph In this study two complexity meashysures are used for a given weighted graph (whose edges have real values in the range of 0 and 1) with JV nodes
261 Graph Index Complexity Cr
Let r be the largest eigenvalue of the adjacency matrix of a weighted or unweighted graph The Graph Index Complexity Cr indicates the diversity or heterogeneity of distribution of the edges over all the nodes defined as (Kim and Wilhelm 2008)
Cr = 4c(l - c)
where
r-2cos(7t(N + l)) N - l -2cos(7i(N + l))
0)
(2)
The index Cr varies between 0 and 1 the more complex the graphs structure the larger will be Cr
262 Efficiency Complexity Ce
Efficiency of a weighted graph is computed by the short path length (the shortest path connecting the pairs edges) of the graph (the shorter the path length the higher the efficiency) which indishycates the speed of information transition from a node to another node of the graph It has been shown that many social and natural networks are of the so-called small-world networks which means coexistence of small short path lengths between nodes with relashytively sufficient number (and not too many more than the suffishycient number) of connections between the nodes There is a positive correlation between the efficiency of a network and the number of its edges The efficiency of a graph is defined as (Latora and Marchiori 2003) (They used it as a characteristic of small-world network but we are using it as a characteristic of complexity of networks)
1
~N(N-^2uUM Efi (3)
Right Hemisphere Left Hemisphere
Right Hemisphere Left Hemisphere
Fig 4 Grand average connectivity matrix of the (a) normal subjects and (b) MCI subjects
where diexcliexcl is defined as inverse of the weight between iexclth node and jth node The index Ce is presented as an overall measure of routing efficiency characteristics of the graph and information transmission flexibility of the network In this research Ce is a measure of the exshytent of average connectivity or overall routing efficiency and flexishybility of the neocortex network which helps different neuronal areas of the network to be synchronized with each other in different situations This feasibility in synchronization is a key point in information transmission and accomplishment of all behavioral and cognitive activities (Ahmadlou et al 2012a) In this way effishyciency of functional connectivity matrices which correspond to neuronal networks structures in the alpha (8-12 Hz) and theta (4-8 Hz) sub-bands are computed
27 Statistical analysis and classification
The one-way Analysis of Variance (ANOVA) was used to evalushyate the ability of the Ce and Cr indices at theta and alpha bands to discriminate between normal and MCI groups Next the Enhanced Probabilistic Neural Network (EPNN) developed by the authors reshycently (Ahmadlou and Adeli 2010a) as an improved version of PNN (Adeli and Panakkat 2009 Lopez-Rubio et al 2011) and a powershy
ful classification technique is used to classify the two groups based on the most discriminating features Local decision circles enable EPNN to incorporate local information and non-homogeneity existshying in the training population The circle has a radius which limits the contribution of the local decision Two parameters the spread parameter and the radius of local decision circles are optimized to maximize the performance of the model Inputs of the EPNN are the features discovered by the one-way ANOVA in the previous step EPNN consists of an input layer with number of nodes equal to the number of the selected features a pattern layer which comshyputes the likelihood of the input data to each training data using two local and global Bayesian rules a summation layer which comshyputes the likelihood of the input data to each class (in this work MCI and healthy) and an output layer with one node which assigns the input data to the class with maximum likelihood The number of nodes in the pattern layer is equal to the number of training data sets and the number of nodes in the summation layer is the same as the number of classes (ie 2) The EPNN has shown successful reshysults in previous studies for diagnosis of autism cerebral palsy and major depression (Ahmadlou et al 2012cd Sajedi et al 2013)
3 Results
31 Clinical evaluations
Table 1 summarizes the demographic and clinical information (age MMSE CDS LM1 and LM2) for both groups The data set used in this study did not include any information about premorbid IQ smoking ApoE typing and the head CT or MRI images from the subshyjects (MCI and Control) The authors acknowledge that this inforshymation would have made the study more valuable
The MCI group performed significantly worse on tests of memshyory ie LM1 and LM2 than normal controls (p lt 00001) The fact that the sample of MCI subjects data used in this research came from a memory clinic rather than from a population-based sample explains the high proportion of amnestic MCI
32 Graph Index Complexity Cr
Table 2 shows the mean and standard deviation of Cr for the whole brain intra left and right hemispheric and inter hemishyspheric neuronal networks (see Fig 2) at alpha and theta bands as well as the associated ANOVA p-values and F-values in discrimshyination of the MCI and healthy elderly groups It shows Cr of the whole brain at alpha band is significantly different between the two groups (p-value lt005) while the ability of Cr in the whole brain and intra left hemisphere in distinguishing the two groups at theta band is much higher (p-value lt00001) Also at the theta band the Cr of the inter-hemispheric network is significantly deshycreased in MCI group (p-value lt005) Fig 5 shows distribution of Cr of the brain neuronal network at (a) alpha and (b) theta (c) Cr
Table 1 Demographic and clinical information of the control and MCI groups (Bajo et al 2010)
Control
MCI
Sample (
19(12 Female) 18(11 Female)
sex) Age
716 plusmn8
748 plusmn 3
MMSE
295 plusmn07
277 plusmn1
CDS
1
3
LM1
425 plusmn 8
191 plusmn5
LM2
267 plusmn 7
131 plusmn6
MMSE Mini Mental State Exam (maximum score is 30) CDS Global Deterioration Scale LM1 Logical Memory immediate recall LM2 Logical Memory delayed recall
p-value for distinguishing the control and MCI groups is significant at the 00001 level
Table 2 First order statistical characteristics of Cr of the whole brain intra left and right hemispheric and inter hemispheric neuronal networks at alpha and theta bands as well as the associated ANOVA p-values and F-values in discrimination of the two groups (M and Std stand for mean and standard deviation respectively)
Band Subjects Whole brain Intra left hemispheric Intra right hemispheric Inter hemispheric
M plusmn Std p-val (F) M plusmn Std p-val (F) M plusmn Std p-val (F) M plusmn Std p-val (F)
Alpha Normal MCI
9828 plusmn009 0246(551)
9866 plusmn 007
Theta Normal MCI
867 plusmn 050
832 plusmn 039 58134 x 1 0 - 5 (2112)
9779 plusmn012
9814 plusmn008
710 plusmn041
693 plusmn 029
1066 (275)
96811 x 10- 5 (1950)
9908 plusmn009 1023(282)
9928 plusmn 005
1023 plusmn053 971 plusmn037
5329 (41)
9875 plusmn010
9900 plusmn 006
994 plusmn 057
933 plusmn 052
0872 (311)
0119 (706)
Correlation is significant at the 005 level Correlation is significant at the 001 level
0995
0985
098
0975
097
0965
096
0955
S a
--
H LJ
-
-
0995 -
099 -
0985
098 -
0975
097
0965 -
Fig 5 C of brain neuronal network at (a) alpha and (b) theta (c) C of intra left hemispheric network at theta and (d) C of inter hemispheric network at theta
Table 3 First order statistical characteristics of Ce of the whole brain intra left and right hemispheric and inter hemispheric neuronal networks at alpha and theta bands as well as the associated ANOVA p-values and F values in discrimination of the two groups (M and Std stand for mean and standard deviation respectively)
Band Subjects Whole brain Intra left hemispheric Intra right hemispheric Inter hemispheric
M plusmn Std p-val (F) M plusmn Std p-val (F) M plusmn Std p-val (F) M plusmn Std p-val (F)
Alpha
Theta
Normal MCI
Normal MCI
1121 plusmn041 1105 plusmn036
867 plusmn 050
832 plusmn 039
0068 (83)
56533 x 10- 5 (2115)
1091 plusmn040 1074 plusmn033
710 plusmn041
693 plusmn 029
052 (406)
74952 x 10~ (203)
1037 plusmn045 1029 plusmn031
1023 plusmn053 971 plusmn037
1664 (20)
5366 (39)
1078 plusmn 045 1066 plusmn 033
994 plusmn 057
933 plusmn 052
1069 (274)
0026(106)
Correlation is significant at the 005 level Correlation is significant at the 001 level
of intra left hemispheric network at theta and (d) Cr of inter hemishyspheric network at theta In all cases Cr is decreased in MCI subjects
33 Efficiency Complexity Ce
The same results with slightly better p-values were obtained by Ce Table 3 shows the mean and standard deviation of Ce of the whole brain intra left and right hemispheric and inter hemishyspheric neuronal networks at alpha and theta bands as well as the associated ANOVA p-values and F-values in discrimination of
the MCI and healthy elderly groups It is observed that at alpha band only Ce of the hole brain is significantly different between the two groups (p-value lt001) while at theta band the ability of Ce in the whole brain and intra left hemisphere in distinguishing the two groups is much higher (p-value lt00001) Also at the theta band Ce of the inter-hemispheric network is significantly deshycreased in MCI group (p-value lt001) Fig 6 shows distribution of Ce of the brain neuronal network at (a) alpha and (b) theta (c) Ce
of intra left hemispheric network at theta and (d) Ce of inter hemishyspheric network at theta In all cases the Ce is decreased in MCI subjects
078
076
072
068
066
064
C
bull
S -i i y
bull
Fig 6 Ce of brain neuronal network at (a) alpha and (b) theta (c) Ce of intra left hemispheric network at theta and (d) Ce of inter hemispheric network at theta
The complexity of the brain network (Ce and Cr) was computed in other subbands delta (05-4 Hz) beta (13-30 Hz) and gamma (30-70 Hz)) as well The results did not indicate any meaningful difference
34 Classification
Since the ANOVA tests showed Ce of the whole brain and intra left hemisphere at theta band are the most discriminating features (see Tables 2 and 3) the classification was accomplished based on those two features There are three standard methods of cross-valshyidation Leave-one-out K-fold and repeated random sub-samshypling We used the repeated random sub-sampling cross validation method because based on our previous studies we found it more reliable than others
A cross validation of repeated random sub-sampling of data with testing-to-training data ratio of 20-80 was performed over 100 repetitions to report reliably accurate classification results An average accuracy of 976 was obtained using the EPNN classishyfier with sensitivity of 992 and specificity of 948
It should be noted that a conventional method of classification that is the linear discriminant analysis (LDA) was also employed in this research An accuracy of 928 was obtained substantially less than that obtained by the EPNN
4 Discussion and conclusion
Impaired working memory is a major problem in MCI espeshycially in amnestic MCI Previous studies have investigated various local brain networks and regions associated with impaired working memory in subjects with MCI Decreasing posterior alpha power in MCI patients (Babiloni et al 2008) gray matter loss in temporal parietal and frontal regions (Karas et al 2004 Barbeau et al 2008) and increased activity of occipital regions in MCI subjects during incremental learning (Moulin et al 2007) are some of the major findings previously reported Although there are some studshyies on functional connectivity of MCIs brain (Goacutemez et al 2009
Escudero et al 2011) only a few researchers have investigated the global organization of brain networks in MCI (de Haan et al 2012)
Several studies indicate that an increase in the task difficulty reshyquires further synchronization of the brain network (Korobeinik-ova and Karatygin 2012 Bernarding et al 2013) The authors hypothesize that MCI subjects are more inefficient in the task exeshycution They need to make a greater effort to perform the same task
In this paper in order to study global variations in the working memory of the MCI brain relative to the normal brain the authors examined the complexity of functional networks of whole inter-hemispheric and intra-hemispheric brain of MCI subjects during the Sternberg task and compared it with those of normal subjects The networks complexities were measured by Graph Index Comshyplexity (Cr) and Efficiency Complexity (Ce) As theta and alpha bands are well-known frequencies involved in working memory functions the Cr and Ce were computed and investigated in these frequency bands for both MCI and normal subjects
The results obtained by both measurements (Cr and Ce) showed complexity of functional networks involved in the working memshyory function in MCI subjects were reduced at both alpha and theta bands compared with subjects with normal cognition and at the theta band this reduction is more pronounced in the whole brain and intra left hemisphere This means the connectivity of the funcshytional brain network in MCI subjects is such that the network has less efficiency with slower information transmission during the verbal working memory task Since the verbal and phonological information is processed mainly in the left hemisphere a possible explanation of finding more deficits in the left hemisphere in our study is that we used a verbal task Also the results show that Ce
would be a better measurement for showing the global differences between normal and MCI brains (with p-values less than 00001) compared with Cr Furthermore the high accuracy of the classificashytion shows Ce at theta band can be used as an index for assessing deficits associated with working memory a good biomarker for diagnosis of MCI Further studies are needed to determine if this inshydex can be used in the pre-MCI stage to determine which individ-
uals with normal cognition will go onto develop MCI as this would be useful for prognostication and for the institution of therapies once they become available The results show the differences of the network complexity between the two groups are more signifishycant in the left intra-hemispheric network relative to the right one This may be explained by the fact that semantic processing and also word learning are more associated with left hemisphere (espeshycially left prefrontal cortex and left temporal cortex) and hence it is why complexity of the left intra-hemispheric network during the Sternberg task has been changed much more in MCI compared with the right intra-hemispheric network (Gronholm et al 2007 Clement et al 2010)
Since the Efficiency Complexity in the MCI group is clearly lowshyer than in the Control Group this research verifies the authors hypothesis Both groups are performing comparably in the Sternshyberg task but with a different efficiency
As noted in the Section 1 Ahmadlou and Adeli (2011a) preshysented a new methodology for investigation of the structure of the brain functional connectivity based on graph theory and comshymunity pattern analysis of functional connectivity graph of the brain obtained from EEGs From the viewpoint of Functional Conshynectivity analysis compared with EEGs where one specific channel is needed as the reference for the other channels the main advanshytage of MEG records is no reference channel is needed (see Knake 2006 Leahy et al 1998) Other advantages are that MEG presents a better signal to noise ratio especially in the high frequency bands and the fact that biological tissue is much more transparent (see Muthukumaraswamy 2013 for a review) to magnetic fields (MEG) than to EEGs thus making MEG a bit more sensitive Finally the authors overarching research ideology advances a multi-modshyal measurement and analysis approach as the most effective way to investigate the complex brain system
Only one set of five letters was used This would substantially affect the interpretation Consequently one may consider the task applied to be an atypical short-term memory task Considering the relatively small size of the data sample (18+19 subjects) the reshysults may be considered preliminary Additional studies are needed to validate the consistency of the outcomes presented in this article
References
Adeli H Ghosh-Dastidar S Dadmehr N Alzheimers disease and models of computation imaging classification and neural models J Alzheimers Dis 2005a7187-99
Adeli H Ghosh-Dastidar S Dadmehr N Alzheimers disease models of computation and analysis of EEGs Clin EEC Neurosci 2005b36131-40
Adeli H Ghosh-Dastidar S Dadmehr N A spatio-temporal wavelet-chaos methodology for EEG-based diagnosis of Alzheimers disease Neurosci Lett 2008444190-4
Adeli H Panakkat A A probabilistic neural network for earthquake magnitude prediction Neural Netw 2009221018-24
Ahmadlou M Adeli H Enhanced probabilistic neural network with local decision circles a robust classifier Integr Comput-Aid E 2010a17197-210
Ahmadlou M Adeli H Wavelet-synchronization methodology a new approach for EEG-based diagnosis of ADHD Clin EEC Neurosci 2010b41l-10
Ahmadlou M Adeli H Functional community analysis of brain a new approach for EEG-based investigation of the brain pathology Neurolmage 2011a58401-8
Ahmadlou M Adeli H Fuzzy synchronization likelihood with application to attention-deficithyperactivity disorder Clin EEC Neurosci 2011b426-13
Ahmadlou M Adeli H Visibility graph similarity a new measure of generalized synchronization in coupled dynamic systems Physica D 2012241326-32
Ahmadlou M Adeli H Adeli A New diagnostic EEC markers of the Alzheimers disease using visibility graph J Neural Transm 20101171099-109
Ahmadlou M Adeli H Amir A Graph theoretical analysis of organization of functional brain networks in ADHD Clin EEC Neurosci 2012a435-13
Ahmadlou M Adeli H Adeli A Improved visibility graph fractality with application for diagnosis of autism spectrum disorder Physica A 2012b3914720-6
Ahmadlou M Adeli H Adeli A Fractality analysis of frontal brain in major depressive disorder IntJ Psychophysiol 2012c85206-ll
Ahmadlou M Adeli H Adeli A Fuzzy synchronization likelihood-wavelet methodology for diagnosis of autism spectrum disorder J Neurosci Methods 2012d211203-9
Ahmadlou M Ahmadi K Rezazade M Azad-Marzabadi E Global organization of functional brain connectivity in methamphetamine abusers Clin Neurophysiol 20131241122-31
Ally BA McKeever JD Waring JD Budson AE Preserved frontal memorial processing for pictures in patients with mild cognitive impairment Neuropsychologia 2009472044-55
Babiloni C Frisoni GB Pievani M Toscano L Del Percio C Geroldi C et al White-matter vascular lesions correlate with alpha EEC sources in mild cognitive impairment Neuropsychologia 2008461707-20
Baddeley AD Hitch G Working memory In Bower GA editor The psychology of learning and motivation advances in research and theory 1974vol 8 New York Academic Press 1974 p 47-89
Bajo R Maest F Nevado A Sancho M Gutieacuterrez R Campo P et al Functional connectivity in mild cognitive impairment during a memory task implications for the disconnection hypothesis J Alzheimers Dis 201022 183-93
Bajo R Castellanos NP Cuesta P Aurtenetxe S Garcia-Prieto J Gil-Gregorio P et al Differential patterns of connectivity in progressive mild cognitive impairment Brain Connect 2012221-4
Barbeau EJ Ranjeva JP Didic M Confort-Gouny S Felician O Soulier E et al Profile of memory impairment and gray matter loss in amnestic mild cognitive impairment Neuropsychologia 2008461009-19
Barrat A Barthelemy M Pastor-Satorras R Vespignani A The architecture of complex weighted networks PNAS 20041013747-52
Bastiaansen MCM Posthuma D Groot PFC de Geus EJC Event-related alpha and theta responses in a visuo-spatial working memory task Clin Neurophysiol 20021131882-93
Bello-Orgaz G Menendez H Camacho D Adaptive K-means algorithm for overlapped graph clustering IntJ Neural Syst 2012221250018
Bernarding C Strauss DJ Hannemann R Seidler H Corona-Strauss FI Neural correlates of listening effort related factors influence of age and hearing impairment Brain Res Bull 20139121-30
Besio WG Liu X Wang L Medvedev AV Koka K Transcutaneous focal electrical stimulation via concentric ring electrodes reduces synchrony induced by pentylenetetrazole in beta and gamma bands in rats Int J Neural Syst 201121139-49
Brookes MJ Wood JR Stevenson CM Zumer JM White TP Liddle PF et al Changes in brain network activity during working memory tasks a magnetoencephalography study Neuroimage 2011551804-15
Choi EH Jung KI Jun AY Kang SW Clinical characteristics of patients in a dementia prevention center J Neurol Sci 2009283291-2
Clement F Belleville S Mellah S Functional neuroanatomy of the encoding and retrieval processes of verbal episodic memory in MCI Cortex 2010461005-15
Collie A Maruff P The neuropsychology of preclinical Alzheimers disease and mild cognitive impairment Neurosci Biobehav Rev 200024365-74
Deeny SP Poeppel D Zimmerman JB Roth SM Brandauer J Witkowski S et al Exercise APOE and working memory MEG and behavioral evidence for benefit of exercise in epsilon4 carriers Biol Psychol 200878179-87
de Haan W Mott K van Straaten EC Scheltens P Stam CJ Activity dependent degeneration explains hub vulnerability in Alzheimers disease PLoS Comput Biol 20128el002582
Deiber MP Ibanez V Missonnier P Herrmann F Fazio-Costa L Gold G et al Abnormal-induced theta activity supports early directed-attention network deficits in progressive MCI Neurobiol Aging 2009301444-52
deToledo-Morrell L Evers S Hoeppner TJ Morrell F Garroacuten DC Fox JH A stress test for memory dysfunction electrophysiologic manifestations of early Alzheimers disease Arch Neurol 199148605-9
Escudero J Sanei S Jarchi D Absolo D Hornero R Regional coherence evaluation in mild cognitive impairment and Alzheimers disease based on adaptively extracted magnetoencephalogram rhythms Physiol Meas 2011321163-80
Goacutemez C Stam CJ Hornero R Fernndez A Maest F Disturbed beta band functional connectivity in patients with mild cognitive impairment an MEG study IEEE Trans Biomed Eng 2009561683-90
Gronholm P Rinne JO Vorobyev VA Laine M Neural correlates of naming newly learned objects in MCI Neuropsychologia 2007452355-68
Grundman M Petersen RC Ferris SH Thomas RG Aisen PS Bennett DA et al Mild cognitive impairment can be distinguished from Alzheimer disease and normal aging for clinical trials Arch Neurol 20046159-66
Han F Wiercigroch M Fang JA Wang Z Excitement and synchronization of small-world neuronal networks with short-term synaptic plasticity Int J Neural Syst 201121415-25
Karas G Scheltens P Rombouts S Visser P van Schijndel R Fox N et al Global and local gray matter loss in mild cognitive impairment and Alzheimers disease Neuroimage 200423708-16
Khader PH Jost K Ranganath C Rosier F Theta and alpha oscillations during working-memory maintenance predict successful long-term memory encoding Neurosci Lett 2010468339-43
Kim J Wilhelm T What is a complex graph Physica A 20083872637-52 Klimesch W EEC alpha and theta oscillations reflect cognitive and memory
performance a review and analysis Brain Res Rev 199929169-95 Knake S Halgren E Shiraishi H Hara K Hamer HM Grant PE et al The value of
multichannel MEG and EEC in the presurgical evaluation of 70 epilepsy patients Epilepsy Res 20066980-6
Korobeinikova II Karatygin NA Spectral-coherent characteristics of EEC alpha rhythm in different efficiency of visual spatial task performance in humans Bull Exp Biol Med 2012153601-4
Kurimoto R Ishii R Canuet L Ikezawa K Iwase M Azechi M et al Induced oscillatory responses during the Sternbergs visual memory task in patients with Alzheimers disease and mild cognitive impairment Neuroimage 2012594132-40
Latora V Marchiori M Economic small-world behavior in weighted networks Eur PhysJB 200332249-63
Leahy RM Mosher JC Spencer ME Huang MX Lewine JD A study of dipole localization accuracy for MEG and EEC using a human skull phantom Electroencephalogr Clin Neurophysiol 1998107159-73
Li W Lin Y Liu Y The structure of weighted small-world networks Physica A 2007376708-18
Lobo A Ezquerra J Gomez BF Sala JM Seva DA Cognocitive mini-test (a simple practical test to detect intellectual changes in medical patients) Actas Luso Esp Neurol Psiquiatr Cientildee Afines 19797189-202
Lopez-Rubio E Luque-Baena RM Domiacutenguez E Foreground detection in video sequences with probabilistic self-organizing maps Int J Neural Syst 201121225-46
Maest F Fernandez A Simos PG Gil-Gregorio P Amo C Rodriguez R et al Spatio-temporal patterns of brain magnetic activity during a memory task in Alzheimers disease Neuroreport 2001123917-22
Maest F Campo P Del Ro D Moratti S Gil-Gregorio P Fernndez A et al Increased biomagnetic activity in the ventral pathway in mild cognitive impairment Clin Neurophysiol 20081191320-7
Mitchell AJ Is it time to separate subjective cognitive complaints from the diagnosis of mild cognitive impairment Age Ageing 200837497-9
Morgan HM Jackson MC van Koningsbruggen MG Shapiro KL Linden DEJ Frontal and parietal theta burst TMS impairs working memory for visual-spatial conjunctions Brain Stimul 20136122-9
Moulin CJ Laine M Rinne JO Kaasinen V Sipila H Hiltunen J et al Brain function during multi-trial learning in mild cognitive impairment a PET activation study Brain Res 20071136132-41
Muthukumaraswamy SD High frequency brain activity and muscle artifacts in MEGEEG a review and recommendations Front Hum Neurosci 2013 http dxdoiorg103389fnhum201300138
Patalong-Ogiewa MB Siuda JS Opala GM Working and episodic memory in the MCI group J Neurol Sci 2009283291
Petersen RC Mild cognitive impairment as a diagnostic entity J Intern Med 2004256183-94
Petersen RC Doody R Kurz A Mohs RC Morris JC Rabins PV et al Current concepts in mild cognitive impairment Arch Neurol 2001581985-92
Ramanathan K Ning N Dhanasekar D Guoqi L Luping S Vadakkepat P Presynaptic learning and memory with a persistent firing neuron and a habituating synapse A model of short term persistent habituation Int J Neural Syst 2012221250015
Rangaprakash D Hu X Deshpande G Phase synchronization in brain networks derived from correlation between probabilities of Recurrences in functional MRI data Int J Neural Syst 2013231350003
Sajedi F Ahmadlou M Vameghi R Gharib M Hemmati S Linear and nonlinear analysis of brain dynamics in children with cerebral palsy Res Dev Disabil 2013341388-96
Schmiedt C Brand A Hildebrandt H Basar-Eroglu C Event-related theta oscillations during working memory tasks in patients with schizophrenia and healthy controls Cognitive Brain Res 200525936-47
Serletis D Carien PL Vahante TA Bardakjian BL Phase synchronization of neuronal noise in mouse Hippocampal epileptiform dynamics Int J Neural Syst 2013231250033
Stam CJ Brain dynamics in theta and alpha frequency bands and working memory performance in humans Neurosci Lett 2000286115-8
Stam CJ van Dijk BW Synchronization likelihood an unbiased measure of generalized synchronization in multivariate data sets Physica D 2002163236-51
Stephane M Ince NF Kuskowski M Leuthold A Tewfik AH Nelson K et al Neural oscillations associated with the primacy and recency effects of verbal working memory Neurosci Lett 2010473172-7
Sternberg S High-speed scanning in human memory Science 1966153652-4 Tuladhar AM ter Huurne N Schoffelen JM Maris E Oostenveld R Jensen 0 Parietoshy
occipital sources account for the increase in alpha activity with working memory load Hum Brain Mapp 200728785-92
Villeneuve S Belleville S Lacombe J Labelle MA Enriquez-Rosas A Gauthier S Episodic memory deficits in vascular and non vascular mild cognitive impairment J Neurol Sci 2009283291
Watts DJ Strogatz SH Collective dynamics of small-world networks Nature 1998393409-10
Wenger MJ Negash S Petersen RC Petersen L Modeling and estimating recall processing capacity sensitivity and diagnostic utility in application to mild cognitive impairment J Math Psychol 20105473-89
Yesavage JA Brooks JO On the importance of longitudinal research in Alzheimers disease J Am Geriatr Soc 199139942-9
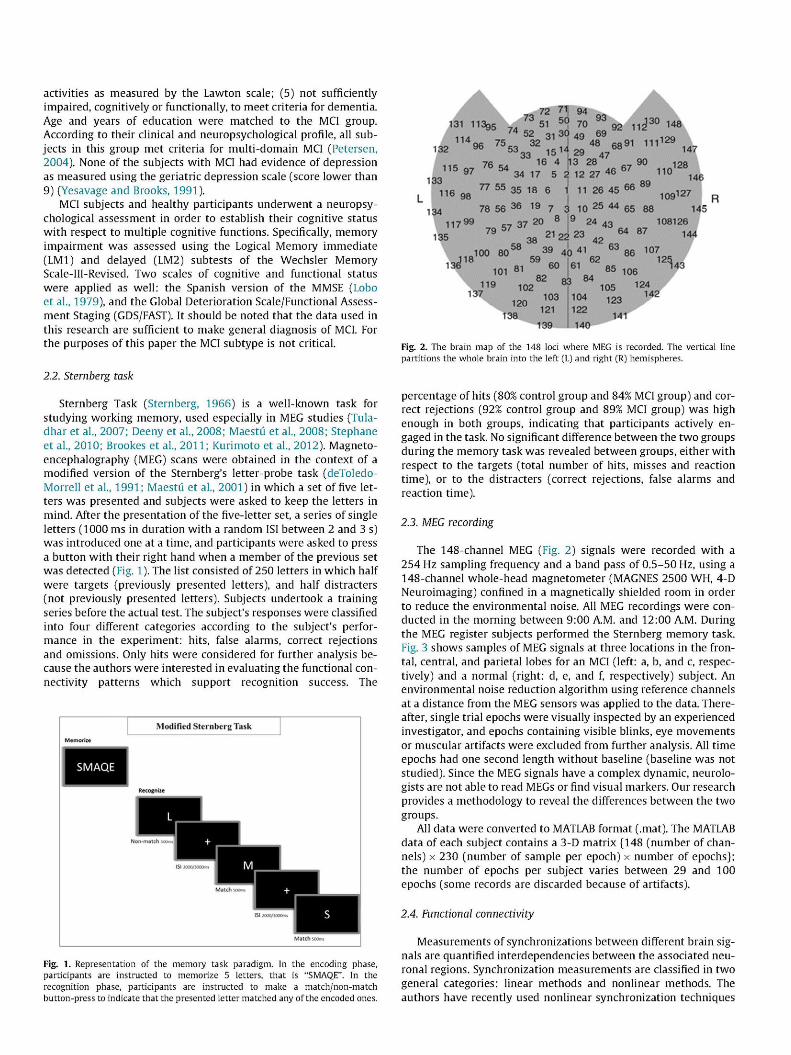

Right Hemisphere Left Hemisphere
Right Hemisphere Left Hemisphere
Fig 4 Grand average connectivity matrix of the (a) normal subjects and (b) MCI subjects
where diexcliexcl is defined as inverse of the weight between iexclth node and jth node The index Ce is presented as an overall measure of routing efficiency characteristics of the graph and information transmission flexibility of the network In this research Ce is a measure of the exshytent of average connectivity or overall routing efficiency and flexishybility of the neocortex network which helps different neuronal areas of the network to be synchronized with each other in different situations This feasibility in synchronization is a key point in information transmission and accomplishment of all behavioral and cognitive activities (Ahmadlou et al 2012a) In this way effishyciency of functional connectivity matrices which correspond to neuronal networks structures in the alpha (8-12 Hz) and theta (4-8 Hz) sub-bands are computed
27 Statistical analysis and classification
The one-way Analysis of Variance (ANOVA) was used to evalushyate the ability of the Ce and Cr indices at theta and alpha bands to discriminate between normal and MCI groups Next the Enhanced Probabilistic Neural Network (EPNN) developed by the authors reshycently (Ahmadlou and Adeli 2010a) as an improved version of PNN (Adeli and Panakkat 2009 Lopez-Rubio et al 2011) and a powershy
ful classification technique is used to classify the two groups based on the most discriminating features Local decision circles enable EPNN to incorporate local information and non-homogeneity existshying in the training population The circle has a radius which limits the contribution of the local decision Two parameters the spread parameter and the radius of local decision circles are optimized to maximize the performance of the model Inputs of the EPNN are the features discovered by the one-way ANOVA in the previous step EPNN consists of an input layer with number of nodes equal to the number of the selected features a pattern layer which comshyputes the likelihood of the input data to each training data using two local and global Bayesian rules a summation layer which comshyputes the likelihood of the input data to each class (in this work MCI and healthy) and an output layer with one node which assigns the input data to the class with maximum likelihood The number of nodes in the pattern layer is equal to the number of training data sets and the number of nodes in the summation layer is the same as the number of classes (ie 2) The EPNN has shown successful reshysults in previous studies for diagnosis of autism cerebral palsy and major depression (Ahmadlou et al 2012cd Sajedi et al 2013)
3 Results
31 Clinical evaluations
Table 1 summarizes the demographic and clinical information (age MMSE CDS LM1 and LM2) for both groups The data set used in this study did not include any information about premorbid IQ smoking ApoE typing and the head CT or MRI images from the subshyjects (MCI and Control) The authors acknowledge that this inforshymation would have made the study more valuable
The MCI group performed significantly worse on tests of memshyory ie LM1 and LM2 than normal controls (p lt 00001) The fact that the sample of MCI subjects data used in this research came from a memory clinic rather than from a population-based sample explains the high proportion of amnestic MCI
32 Graph Index Complexity Cr
Table 2 shows the mean and standard deviation of Cr for the whole brain intra left and right hemispheric and inter hemishyspheric neuronal networks (see Fig 2) at alpha and theta bands as well as the associated ANOVA p-values and F-values in discrimshyination of the MCI and healthy elderly groups It shows Cr of the whole brain at alpha band is significantly different between the two groups (p-value lt005) while the ability of Cr in the whole brain and intra left hemisphere in distinguishing the two groups at theta band is much higher (p-value lt00001) Also at the theta band the Cr of the inter-hemispheric network is significantly deshycreased in MCI group (p-value lt005) Fig 5 shows distribution of Cr of the brain neuronal network at (a) alpha and (b) theta (c) Cr
Table 1 Demographic and clinical information of the control and MCI groups (Bajo et al 2010)
Control
MCI
Sample (
19(12 Female) 18(11 Female)
sex) Age
716 plusmn8
748 plusmn 3
MMSE
295 plusmn07
277 plusmn1
CDS
1
3
LM1
425 plusmn 8
191 plusmn5
LM2
267 plusmn 7
131 plusmn6
MMSE Mini Mental State Exam (maximum score is 30) CDS Global Deterioration Scale LM1 Logical Memory immediate recall LM2 Logical Memory delayed recall
p-value for distinguishing the control and MCI groups is significant at the 00001 level
Table 2 First order statistical characteristics of Cr of the whole brain intra left and right hemispheric and inter hemispheric neuronal networks at alpha and theta bands as well as the associated ANOVA p-values and F-values in discrimination of the two groups (M and Std stand for mean and standard deviation respectively)
Band Subjects Whole brain Intra left hemispheric Intra right hemispheric Inter hemispheric
M plusmn Std p-val (F) M plusmn Std p-val (F) M plusmn Std p-val (F) M plusmn Std p-val (F)
Alpha Normal MCI
9828 plusmn009 0246(551)
9866 plusmn 007
Theta Normal MCI
867 plusmn 050
832 plusmn 039 58134 x 1 0 - 5 (2112)
9779 plusmn012
9814 plusmn008
710 plusmn041
693 plusmn 029
1066 (275)
96811 x 10- 5 (1950)
9908 plusmn009 1023(282)
9928 plusmn 005
1023 plusmn053 971 plusmn037
5329 (41)
9875 plusmn010
9900 plusmn 006
994 plusmn 057
933 plusmn 052
0872 (311)
0119 (706)
Correlation is significant at the 005 level Correlation is significant at the 001 level
0995
0985
098
0975
097
0965
096
0955
S a
--
H LJ
-
-
0995 -
099 -
0985
098 -
0975
097
0965 -
Fig 5 C of brain neuronal network at (a) alpha and (b) theta (c) C of intra left hemispheric network at theta and (d) C of inter hemispheric network at theta
Table 3 First order statistical characteristics of Ce of the whole brain intra left and right hemispheric and inter hemispheric neuronal networks at alpha and theta bands as well as the associated ANOVA p-values and F values in discrimination of the two groups (M and Std stand for mean and standard deviation respectively)
Band Subjects Whole brain Intra left hemispheric Intra right hemispheric Inter hemispheric
M plusmn Std p-val (F) M plusmn Std p-val (F) M plusmn Std p-val (F) M plusmn Std p-val (F)
Alpha
Theta
Normal MCI
Normal MCI
1121 plusmn041 1105 plusmn036
867 plusmn 050
832 plusmn 039
0068 (83)
56533 x 10- 5 (2115)
1091 plusmn040 1074 plusmn033
710 plusmn041
693 plusmn 029
052 (406)
74952 x 10~ (203)
1037 plusmn045 1029 plusmn031
1023 plusmn053 971 plusmn037
1664 (20)
5366 (39)
1078 plusmn 045 1066 plusmn 033
994 plusmn 057
933 plusmn 052
1069 (274)
0026(106)
Correlation is significant at the 005 level Correlation is significant at the 001 level
of intra left hemispheric network at theta and (d) Cr of inter hemishyspheric network at theta In all cases Cr is decreased in MCI subjects
33 Efficiency Complexity Ce
The same results with slightly better p-values were obtained by Ce Table 3 shows the mean and standard deviation of Ce of the whole brain intra left and right hemispheric and inter hemishyspheric neuronal networks at alpha and theta bands as well as the associated ANOVA p-values and F-values in discrimination of
the MCI and healthy elderly groups It is observed that at alpha band only Ce of the hole brain is significantly different between the two groups (p-value lt001) while at theta band the ability of Ce in the whole brain and intra left hemisphere in distinguishing the two groups is much higher (p-value lt00001) Also at the theta band Ce of the inter-hemispheric network is significantly deshycreased in MCI group (p-value lt001) Fig 6 shows distribution of Ce of the brain neuronal network at (a) alpha and (b) theta (c) Ce
of intra left hemispheric network at theta and (d) Ce of inter hemishyspheric network at theta In all cases the Ce is decreased in MCI subjects
078
076
072
068
066
064
C
bull
S -i i y
bull
Fig 6 Ce of brain neuronal network at (a) alpha and (b) theta (c) Ce of intra left hemispheric network at theta and (d) Ce of inter hemispheric network at theta
The complexity of the brain network (Ce and Cr) was computed in other subbands delta (05-4 Hz) beta (13-30 Hz) and gamma (30-70 Hz)) as well The results did not indicate any meaningful difference
34 Classification
Since the ANOVA tests showed Ce of the whole brain and intra left hemisphere at theta band are the most discriminating features (see Tables 2 and 3) the classification was accomplished based on those two features There are three standard methods of cross-valshyidation Leave-one-out K-fold and repeated random sub-samshypling We used the repeated random sub-sampling cross validation method because based on our previous studies we found it more reliable than others
A cross validation of repeated random sub-sampling of data with testing-to-training data ratio of 20-80 was performed over 100 repetitions to report reliably accurate classification results An average accuracy of 976 was obtained using the EPNN classishyfier with sensitivity of 992 and specificity of 948
It should be noted that a conventional method of classification that is the linear discriminant analysis (LDA) was also employed in this research An accuracy of 928 was obtained substantially less than that obtained by the EPNN
4 Discussion and conclusion
Impaired working memory is a major problem in MCI espeshycially in amnestic MCI Previous studies have investigated various local brain networks and regions associated with impaired working memory in subjects with MCI Decreasing posterior alpha power in MCI patients (Babiloni et al 2008) gray matter loss in temporal parietal and frontal regions (Karas et al 2004 Barbeau et al 2008) and increased activity of occipital regions in MCI subjects during incremental learning (Moulin et al 2007) are some of the major findings previously reported Although there are some studshyies on functional connectivity of MCIs brain (Goacutemez et al 2009
Escudero et al 2011) only a few researchers have investigated the global organization of brain networks in MCI (de Haan et al 2012)
Several studies indicate that an increase in the task difficulty reshyquires further synchronization of the brain network (Korobeinik-ova and Karatygin 2012 Bernarding et al 2013) The authors hypothesize that MCI subjects are more inefficient in the task exeshycution They need to make a greater effort to perform the same task
In this paper in order to study global variations in the working memory of the MCI brain relative to the normal brain the authors examined the complexity of functional networks of whole inter-hemispheric and intra-hemispheric brain of MCI subjects during the Sternberg task and compared it with those of normal subjects The networks complexities were measured by Graph Index Comshyplexity (Cr) and Efficiency Complexity (Ce) As theta and alpha bands are well-known frequencies involved in working memory functions the Cr and Ce were computed and investigated in these frequency bands for both MCI and normal subjects
The results obtained by both measurements (Cr and Ce) showed complexity of functional networks involved in the working memshyory function in MCI subjects were reduced at both alpha and theta bands compared with subjects with normal cognition and at the theta band this reduction is more pronounced in the whole brain and intra left hemisphere This means the connectivity of the funcshytional brain network in MCI subjects is such that the network has less efficiency with slower information transmission during the verbal working memory task Since the verbal and phonological information is processed mainly in the left hemisphere a possible explanation of finding more deficits in the left hemisphere in our study is that we used a verbal task Also the results show that Ce
would be a better measurement for showing the global differences between normal and MCI brains (with p-values less than 00001) compared with Cr Furthermore the high accuracy of the classificashytion shows Ce at theta band can be used as an index for assessing deficits associated with working memory a good biomarker for diagnosis of MCI Further studies are needed to determine if this inshydex can be used in the pre-MCI stage to determine which individ-
uals with normal cognition will go onto develop MCI as this would be useful for prognostication and for the institution of therapies once they become available The results show the differences of the network complexity between the two groups are more signifishycant in the left intra-hemispheric network relative to the right one This may be explained by the fact that semantic processing and also word learning are more associated with left hemisphere (espeshycially left prefrontal cortex and left temporal cortex) and hence it is why complexity of the left intra-hemispheric network during the Sternberg task has been changed much more in MCI compared with the right intra-hemispheric network (Gronholm et al 2007 Clement et al 2010)
Since the Efficiency Complexity in the MCI group is clearly lowshyer than in the Control Group this research verifies the authors hypothesis Both groups are performing comparably in the Sternshyberg task but with a different efficiency
As noted in the Section 1 Ahmadlou and Adeli (2011a) preshysented a new methodology for investigation of the structure of the brain functional connectivity based on graph theory and comshymunity pattern analysis of functional connectivity graph of the brain obtained from EEGs From the viewpoint of Functional Conshynectivity analysis compared with EEGs where one specific channel is needed as the reference for the other channels the main advanshytage of MEG records is no reference channel is needed (see Knake 2006 Leahy et al 1998) Other advantages are that MEG presents a better signal to noise ratio especially in the high frequency bands and the fact that biological tissue is much more transparent (see Muthukumaraswamy 2013 for a review) to magnetic fields (MEG) than to EEGs thus making MEG a bit more sensitive Finally the authors overarching research ideology advances a multi-modshyal measurement and analysis approach as the most effective way to investigate the complex brain system
Only one set of five letters was used This would substantially affect the interpretation Consequently one may consider the task applied to be an atypical short-term memory task Considering the relatively small size of the data sample (18+19 subjects) the reshysults may be considered preliminary Additional studies are needed to validate the consistency of the outcomes presented in this article
References
Adeli H Ghosh-Dastidar S Dadmehr N Alzheimers disease and models of computation imaging classification and neural models J Alzheimers Dis 2005a7187-99
Adeli H Ghosh-Dastidar S Dadmehr N Alzheimers disease models of computation and analysis of EEGs Clin EEC Neurosci 2005b36131-40
Adeli H Ghosh-Dastidar S Dadmehr N A spatio-temporal wavelet-chaos methodology for EEG-based diagnosis of Alzheimers disease Neurosci Lett 2008444190-4
Adeli H Panakkat A A probabilistic neural network for earthquake magnitude prediction Neural Netw 2009221018-24
Ahmadlou M Adeli H Enhanced probabilistic neural network with local decision circles a robust classifier Integr Comput-Aid E 2010a17197-210
Ahmadlou M Adeli H Wavelet-synchronization methodology a new approach for EEG-based diagnosis of ADHD Clin EEC Neurosci 2010b41l-10
Ahmadlou M Adeli H Functional community analysis of brain a new approach for EEG-based investigation of the brain pathology Neurolmage 2011a58401-8
Ahmadlou M Adeli H Fuzzy synchronization likelihood with application to attention-deficithyperactivity disorder Clin EEC Neurosci 2011b426-13
Ahmadlou M Adeli H Visibility graph similarity a new measure of generalized synchronization in coupled dynamic systems Physica D 2012241326-32
Ahmadlou M Adeli H Adeli A New diagnostic EEC markers of the Alzheimers disease using visibility graph J Neural Transm 20101171099-109
Ahmadlou M Adeli H Amir A Graph theoretical analysis of organization of functional brain networks in ADHD Clin EEC Neurosci 2012a435-13
Ahmadlou M Adeli H Adeli A Improved visibility graph fractality with application for diagnosis of autism spectrum disorder Physica A 2012b3914720-6
Ahmadlou M Adeli H Adeli A Fractality analysis of frontal brain in major depressive disorder IntJ Psychophysiol 2012c85206-ll
Ahmadlou M Adeli H Adeli A Fuzzy synchronization likelihood-wavelet methodology for diagnosis of autism spectrum disorder J Neurosci Methods 2012d211203-9
Ahmadlou M Ahmadi K Rezazade M Azad-Marzabadi E Global organization of functional brain connectivity in methamphetamine abusers Clin Neurophysiol 20131241122-31
Ally BA McKeever JD Waring JD Budson AE Preserved frontal memorial processing for pictures in patients with mild cognitive impairment Neuropsychologia 2009472044-55
Babiloni C Frisoni GB Pievani M Toscano L Del Percio C Geroldi C et al White-matter vascular lesions correlate with alpha EEC sources in mild cognitive impairment Neuropsychologia 2008461707-20
Baddeley AD Hitch G Working memory In Bower GA editor The psychology of learning and motivation advances in research and theory 1974vol 8 New York Academic Press 1974 p 47-89
Bajo R Maest F Nevado A Sancho M Gutieacuterrez R Campo P et al Functional connectivity in mild cognitive impairment during a memory task implications for the disconnection hypothesis J Alzheimers Dis 201022 183-93
Bajo R Castellanos NP Cuesta P Aurtenetxe S Garcia-Prieto J Gil-Gregorio P et al Differential patterns of connectivity in progressive mild cognitive impairment Brain Connect 2012221-4
Barbeau EJ Ranjeva JP Didic M Confort-Gouny S Felician O Soulier E et al Profile of memory impairment and gray matter loss in amnestic mild cognitive impairment Neuropsychologia 2008461009-19
Barrat A Barthelemy M Pastor-Satorras R Vespignani A The architecture of complex weighted networks PNAS 20041013747-52
Bastiaansen MCM Posthuma D Groot PFC de Geus EJC Event-related alpha and theta responses in a visuo-spatial working memory task Clin Neurophysiol 20021131882-93
Bello-Orgaz G Menendez H Camacho D Adaptive K-means algorithm for overlapped graph clustering IntJ Neural Syst 2012221250018
Bernarding C Strauss DJ Hannemann R Seidler H Corona-Strauss FI Neural correlates of listening effort related factors influence of age and hearing impairment Brain Res Bull 20139121-30
Besio WG Liu X Wang L Medvedev AV Koka K Transcutaneous focal electrical stimulation via concentric ring electrodes reduces synchrony induced by pentylenetetrazole in beta and gamma bands in rats Int J Neural Syst 201121139-49
Brookes MJ Wood JR Stevenson CM Zumer JM White TP Liddle PF et al Changes in brain network activity during working memory tasks a magnetoencephalography study Neuroimage 2011551804-15
Choi EH Jung KI Jun AY Kang SW Clinical characteristics of patients in a dementia prevention center J Neurol Sci 2009283291-2
Clement F Belleville S Mellah S Functional neuroanatomy of the encoding and retrieval processes of verbal episodic memory in MCI Cortex 2010461005-15
Collie A Maruff P The neuropsychology of preclinical Alzheimers disease and mild cognitive impairment Neurosci Biobehav Rev 200024365-74
Deeny SP Poeppel D Zimmerman JB Roth SM Brandauer J Witkowski S et al Exercise APOE and working memory MEG and behavioral evidence for benefit of exercise in epsilon4 carriers Biol Psychol 200878179-87
de Haan W Mott K van Straaten EC Scheltens P Stam CJ Activity dependent degeneration explains hub vulnerability in Alzheimers disease PLoS Comput Biol 20128el002582
Deiber MP Ibanez V Missonnier P Herrmann F Fazio-Costa L Gold G et al Abnormal-induced theta activity supports early directed-attention network deficits in progressive MCI Neurobiol Aging 2009301444-52
deToledo-Morrell L Evers S Hoeppner TJ Morrell F Garroacuten DC Fox JH A stress test for memory dysfunction electrophysiologic manifestations of early Alzheimers disease Arch Neurol 199148605-9
Escudero J Sanei S Jarchi D Absolo D Hornero R Regional coherence evaluation in mild cognitive impairment and Alzheimers disease based on adaptively extracted magnetoencephalogram rhythms Physiol Meas 2011321163-80
Goacutemez C Stam CJ Hornero R Fernndez A Maest F Disturbed beta band functional connectivity in patients with mild cognitive impairment an MEG study IEEE Trans Biomed Eng 2009561683-90
Gronholm P Rinne JO Vorobyev VA Laine M Neural correlates of naming newly learned objects in MCI Neuropsychologia 2007452355-68
Grundman M Petersen RC Ferris SH Thomas RG Aisen PS Bennett DA et al Mild cognitive impairment can be distinguished from Alzheimer disease and normal aging for clinical trials Arch Neurol 20046159-66
Han F Wiercigroch M Fang JA Wang Z Excitement and synchronization of small-world neuronal networks with short-term synaptic plasticity Int J Neural Syst 201121415-25
Karas G Scheltens P Rombouts S Visser P van Schijndel R Fox N et al Global and local gray matter loss in mild cognitive impairment and Alzheimers disease Neuroimage 200423708-16
Khader PH Jost K Ranganath C Rosier F Theta and alpha oscillations during working-memory maintenance predict successful long-term memory encoding Neurosci Lett 2010468339-43
Kim J Wilhelm T What is a complex graph Physica A 20083872637-52 Klimesch W EEC alpha and theta oscillations reflect cognitive and memory
performance a review and analysis Brain Res Rev 199929169-95 Knake S Halgren E Shiraishi H Hara K Hamer HM Grant PE et al The value of
multichannel MEG and EEC in the presurgical evaluation of 70 epilepsy patients Epilepsy Res 20066980-6
Korobeinikova II Karatygin NA Spectral-coherent characteristics of EEC alpha rhythm in different efficiency of visual spatial task performance in humans Bull Exp Biol Med 2012153601-4
Kurimoto R Ishii R Canuet L Ikezawa K Iwase M Azechi M et al Induced oscillatory responses during the Sternbergs visual memory task in patients with Alzheimers disease and mild cognitive impairment Neuroimage 2012594132-40
Latora V Marchiori M Economic small-world behavior in weighted networks Eur PhysJB 200332249-63
Leahy RM Mosher JC Spencer ME Huang MX Lewine JD A study of dipole localization accuracy for MEG and EEC using a human skull phantom Electroencephalogr Clin Neurophysiol 1998107159-73
Li W Lin Y Liu Y The structure of weighted small-world networks Physica A 2007376708-18
Lobo A Ezquerra J Gomez BF Sala JM Seva DA Cognocitive mini-test (a simple practical test to detect intellectual changes in medical patients) Actas Luso Esp Neurol Psiquiatr Cientildee Afines 19797189-202
Lopez-Rubio E Luque-Baena RM Domiacutenguez E Foreground detection in video sequences with probabilistic self-organizing maps Int J Neural Syst 201121225-46
Maest F Fernandez A Simos PG Gil-Gregorio P Amo C Rodriguez R et al Spatio-temporal patterns of brain magnetic activity during a memory task in Alzheimers disease Neuroreport 2001123917-22
Maest F Campo P Del Ro D Moratti S Gil-Gregorio P Fernndez A et al Increased biomagnetic activity in the ventral pathway in mild cognitive impairment Clin Neurophysiol 20081191320-7
Mitchell AJ Is it time to separate subjective cognitive complaints from the diagnosis of mild cognitive impairment Age Ageing 200837497-9
Morgan HM Jackson MC van Koningsbruggen MG Shapiro KL Linden DEJ Frontal and parietal theta burst TMS impairs working memory for visual-spatial conjunctions Brain Stimul 20136122-9
Moulin CJ Laine M Rinne JO Kaasinen V Sipila H Hiltunen J et al Brain function during multi-trial learning in mild cognitive impairment a PET activation study Brain Res 20071136132-41
Muthukumaraswamy SD High frequency brain activity and muscle artifacts in MEGEEG a review and recommendations Front Hum Neurosci 2013 http dxdoiorg103389fnhum201300138
Patalong-Ogiewa MB Siuda JS Opala GM Working and episodic memory in the MCI group J Neurol Sci 2009283291
Petersen RC Mild cognitive impairment as a diagnostic entity J Intern Med 2004256183-94
Petersen RC Doody R Kurz A Mohs RC Morris JC Rabins PV et al Current concepts in mild cognitive impairment Arch Neurol 2001581985-92
Ramanathan K Ning N Dhanasekar D Guoqi L Luping S Vadakkepat P Presynaptic learning and memory with a persistent firing neuron and a habituating synapse A model of short term persistent habituation Int J Neural Syst 2012221250015
Rangaprakash D Hu X Deshpande G Phase synchronization in brain networks derived from correlation between probabilities of Recurrences in functional MRI data Int J Neural Syst 2013231350003
Sajedi F Ahmadlou M Vameghi R Gharib M Hemmati S Linear and nonlinear analysis of brain dynamics in children with cerebral palsy Res Dev Disabil 2013341388-96
Schmiedt C Brand A Hildebrandt H Basar-Eroglu C Event-related theta oscillations during working memory tasks in patients with schizophrenia and healthy controls Cognitive Brain Res 200525936-47
Serletis D Carien PL Vahante TA Bardakjian BL Phase synchronization of neuronal noise in mouse Hippocampal epileptiform dynamics Int J Neural Syst 2013231250033
Stam CJ Brain dynamics in theta and alpha frequency bands and working memory performance in humans Neurosci Lett 2000286115-8
Stam CJ van Dijk BW Synchronization likelihood an unbiased measure of generalized synchronization in multivariate data sets Physica D 2002163236-51
Stephane M Ince NF Kuskowski M Leuthold A Tewfik AH Nelson K et al Neural oscillations associated with the primacy and recency effects of verbal working memory Neurosci Lett 2010473172-7
Sternberg S High-speed scanning in human memory Science 1966153652-4 Tuladhar AM ter Huurne N Schoffelen JM Maris E Oostenveld R Jensen 0 Parietoshy
occipital sources account for the increase in alpha activity with working memory load Hum Brain Mapp 200728785-92
Villeneuve S Belleville S Lacombe J Labelle MA Enriquez-Rosas A Gauthier S Episodic memory deficits in vascular and non vascular mild cognitive impairment J Neurol Sci 2009283291
Watts DJ Strogatz SH Collective dynamics of small-world networks Nature 1998393409-10
Wenger MJ Negash S Petersen RC Petersen L Modeling and estimating recall processing capacity sensitivity and diagnostic utility in application to mild cognitive impairment J Math Psychol 20105473-89
Yesavage JA Brooks JO On the importance of longitudinal research in Alzheimers disease J Am Geriatr Soc 199139942-9
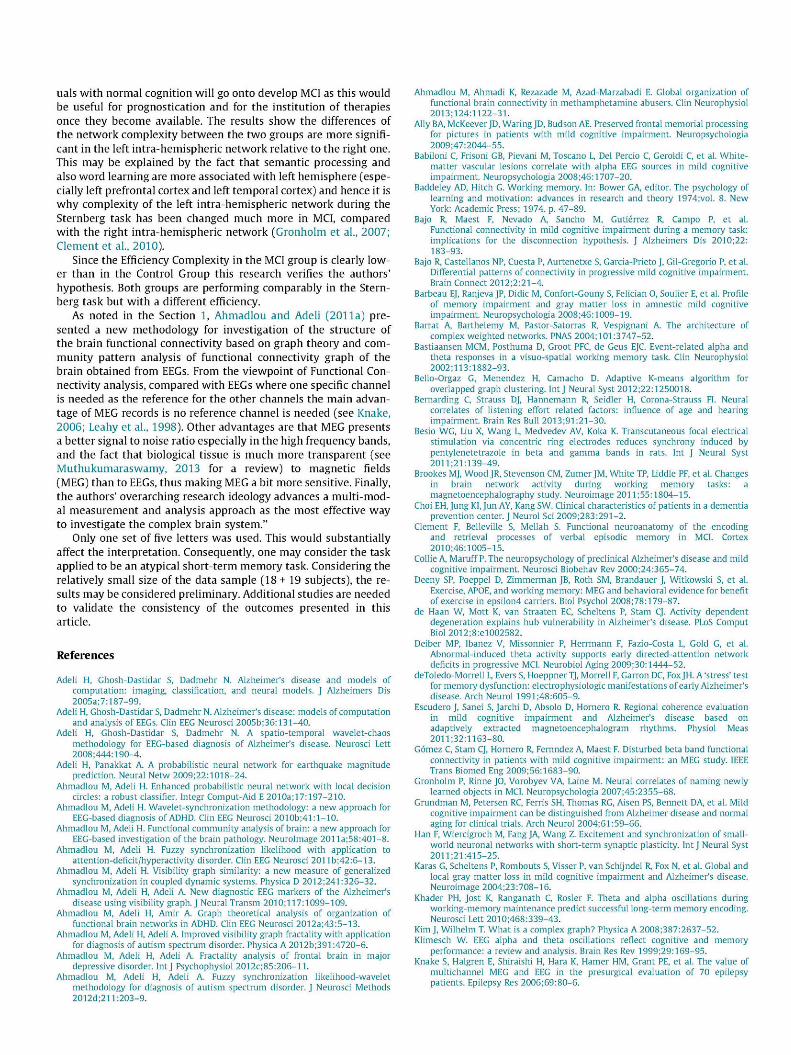