comparison of second wind triton ... - unt digital library
TRANSCRIPT

Technical Report NREL/TP-550-47429 February 2010
Comparison of Second Wind Triton Data with Meteorological Tower Measurements G. Scott, D. Elliott, and M. Schwartz

National Renewable Energy Laboratory 1617 Cole Boulevard, Golden, Colorado 80401-3393 303-275-3000 • www.nrel.gov
NREL is a national laboratory of the U.S. Department of Energy Office of Energy Efficiency and Renewable Energy Operated by the Alliance for Sustainable Energy, LLC
Contract No. DE-AC36-08-GO28308
Technical Report NREL/TP-550-47429 February 2010
Comparison of Second Wind Triton Data with Meteorological Tower Measurements G. Scott, D. Elliott, and M. Schwartz
Prepared under Task No. 5500.4000
NOTICE
This report was prepared as an account of work sponsored by an agency of the United States government. Neither the United States government nor any agency thereof, nor any of their employees, makes any warranty, express or implied, or assumes any legal liability or responsibility for the accuracy, completeness, or usefulness of any information, apparatus, product, or process disclosed, or represents that its use would not infringe privately owned rights. Reference herein to any specific commercial product, process, or service by trade name, trademark, manufacturer, or otherwise does not necessarily constitute or imply its endorsement, recommendation, or favoring by the United States government or any agency thereof. The views and opinions of authors expressed herein do not necessarily state or reflect those of the United States government or any agency thereof.
Available electronically at http://www.osti.gov/bridge
Available for a processing fee to U.S. Department of Energy and its contractors, in paper, from:
U.S. Department of Energy Office of Scientific and Technical Information P.O. Box 62 Oak Ridge, TN 37831-0062 phone: 865.576.8401 fax: 865.576.5728 email: mailto:[email protected]
Available for sale to the public, in paper, from: U.S. Department of Commerce National Technical Information Service 5285 Port Royal Road Springfield, VA 22161 phone: 800.553.6847 fax: 703.605.6900 email: [email protected] online ordering: http://www.ntis.gov/ordering.htm
Printed on paper containing at least 50% wastepaper, including 20% postconsumer waste

iii
List of Abbreviations/Acronyms agl above ground level GPS global positioning system m meter m/s meters per second NREL National Renewable Energy Laboratory sodar SOund Detection And Ranging TI turbulence intensity
iv
Table of Contents 1 Introduction ................................................................................................................. 1
1.1 Measurement Project Description ....................................................................... 1 1.2 Sodar Configuration ............................................................................................ 1 1.3 Meteorological Tower Configuration ................................................................. 2 1.4 Site Layout and Typical Conditions ................................................................... 2
2 Data Filtering .............................................................................................................. 3 2.1 Triton Data Filtering ........................................................................................... 3 2.2 Tower Data Filtering ........................................................................................... 3 2.3 Directional Data Filtering ................................................................................... 3
3 Overall Triton Performance ........................................................................................ 3 3.1 Sodar Operational Uptime (Gross Data Recovery) ............................................ 3 3.2 Percent of Valid Data versus Height ................................................................... 4
4 Correlation Comparison: Triton vs. Meteorological Tower ....................................... 4 4.1 Data Analysis ...................................................................................................... 4
4.1.1 Correlation Coefficient at Tower Heights ....................................................... 4 4.1.2 Wind Direction Distribution Comparison ....................................................... 6 4.1.3 Wind Shear Profile Analysis ........................................................................... 7 4.1.4 Turbulence Intensity Comparison (Triton vs. Tower) .................................... 8
5 Average Wind Speed Comparison with Tower Data .................................................. 9 5.1 Average Wind Speed Comparison: Only Directional Filters Applied .............. 10 5.2 Average Wind Speed Comparison: With All Filters Applied .......................... 10
6 Conclusions ............................................................................................................... 11 7 References ................................................................................................................. 12

1
1 Introduction
With the increased interest in remote sensing of wind information in recent years, it is important to determine the reliability and accuracy of new wind measurement technologies if they are to replace or supplement conventional tower-based measurements. In this study, we present the results of an analysis characterizing the measurement performance of a state-of-the-art SOund Detection And Ranging (sodar) device when compared to a high-quality tower measurement program.
Second Wind Inc. (Somerville, MA, USA) provided NREL with more than six months of data from a measurement program conducted near an operating wind farm in western Texas.
1.1 Measurement Project Description This project collected data from a Second Wind Triton sodar unit and from an 80m meteorological tower located 200m away. An operating wind farm with about a dozen turbines was located to the north of the tower and sodar.
This study compares data from a 6.5-month (198-day) period covering 2008:11:18:1620Z to 2009:06:04:1620Z. This period of record was set by the availability of data from the meteorological tower, and the sodar data set was edited to match it. There are 28513 10-minute periods in the period of record.
1.2 Sodar Configuration The Second Wind Triton is a state-of-the-art sodar device designed for use in wind energy applications. The Triton uses a patent pending hexagonal speaker array to efficiently focus sound beams to improve signal-to-noise ratio accuracy and decrease disruption. The array is housed in a tri-lobed acoustic enclosure to reduce the chance of sound artifacts disrupting data. The unit is two meters tall with a 2-meter by 3-meter footprint, and includes internal controls to compensate for uneven ground and a built-in GPS and compass to identify the time and location of the data. More information is available at http://www.secondwind.com.
The Triton was programmed to save one record every 10 minutes. Each record includes data from 10 heights between 40m and 200m above ground. (The 50m and 80m heights coincided with the measurement heights on the meteorological tower.) Data returned at each height include wind direction, horizontal and vertical wind speeds, and turbulence intensity. The system also records data quality indicators (0% to 100%) for both wind speed and turbulence intensity. These data quality values were used to screen the data for this analysis.
New firmware, that increased the bandwidth from ±200Hz to ±250Hz, was installed on the Triton on May 5th, 2009, which furthermore increased the capture of valid data at higher wind speeds. No obvious differences in the data were noticed after the upgrade. The post-upgrade period is relatively short; therefore, no detailed analysis, before or after installation, was performed.
2
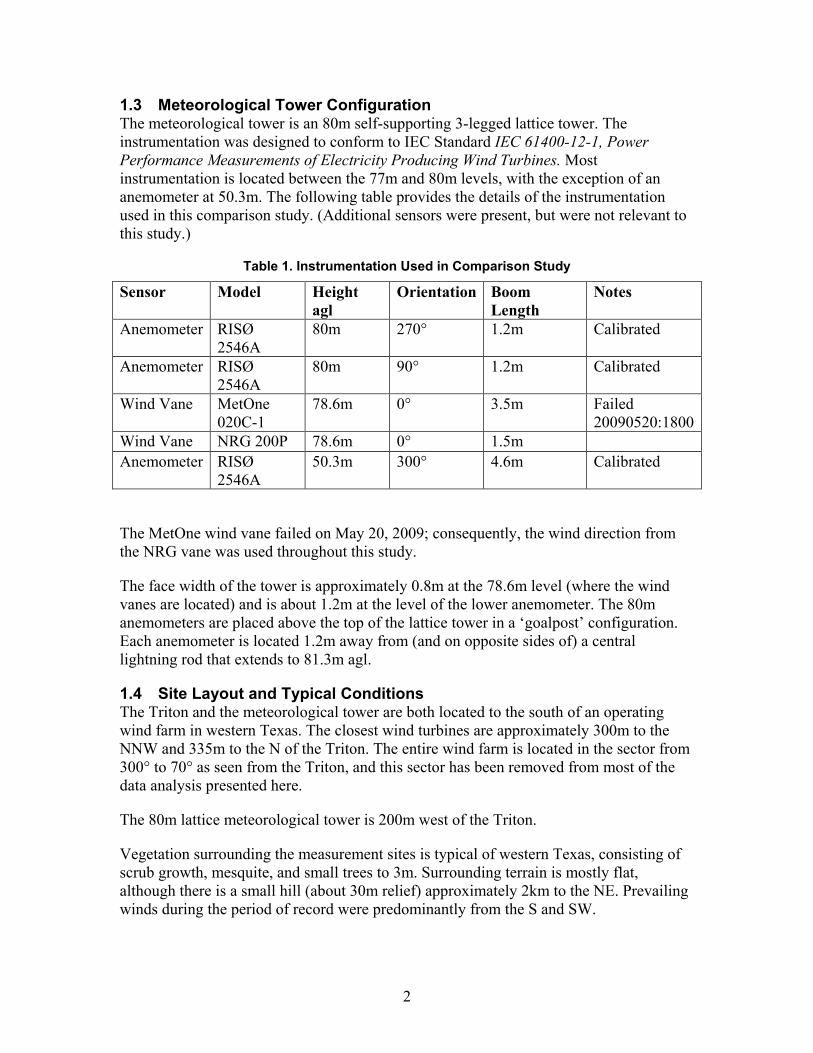
1.3 Meteorological Tower Configuration The meteorological tower is an 80m self-supporting 3-legged lattice tower. The instrumentation was designed to conform to IEC Standard IEC 61400-12-1, Power Performance Measurements of Electricity Producing Wind Turbines. Most instrumentation is located between the 77m and 80m levels, with the exception of an anemometer at 50.3m. The following table provides the details of the instrumentation used in this comparison study. (Additional sensors were present, but were not relevant to this study.)
Table 1. Instrumentation Used in Comparison Study
Sensor Model Height agl
Orientation Boom Length
Notes
Anemometer RISØ 2546A
80m 270° 1.2m Calibrated
Anemometer RISØ 2546A
80m 90° 1.2m Calibrated
Wind Vane MetOne 020C-1
78.6m 0° 3.5m Failed 20090520:1800
Wind Vane NRG 200P 78.6m 0° 1.5m Anemometer RISØ
2546A 50.3m 300° 4.6m Calibrated
The MetOne wind vane failed on May 20, 2009; consequently, the wind direction from the NRG vane was used throughout this study.
The face width of the tower is approximately 0.8m at the 78.6m level (where the wind vanes are located) and is about 1.2m at the level of the lower anemometer. The 80m anemometers are placed above the top of the lattice tower in a ‘goalpost’ configuration. Each anemometer is located 1.2m away from (and on opposite sides of) a central lightning rod that extends to 81.3m agl.
1.4 Site Layout and Typical Conditions The Triton and the meteorological tower are both located to the south of an operating wind farm in western Texas. The closest wind turbines are approximately 300m to the NNW and 335m to the N of the Triton. The entire wind farm is located in the sector from 300° to 70° as seen from the Triton, and this sector has been removed from most of the data analysis presented here.
The 80m lattice meteorological tower is 200m west of the Triton.
Vegetation surrounding the measurement sites is typical of western Texas, consisting of scrub growth, mesquite, and small trees to 3m. Surrounding terrain is mostly flat, although there is a small hill (about 30m relief) approximately 2km to the NE. Prevailing winds during the period of record were predominantly from the S and SW.

3
2 Data Filtering
2.1 Triton Data Filtering Sodar data needs to be filtered to remove low-quality and spurious data before any analysis can be performed. In this study, we used the Second Wind filtering criteria specified in Walls (2009):
1. Wind speed quality factor >= 90% 2. Vertical wind speed (absolute magnitude) <= 1.5 m/s 3. Turbulence quality factor >= 90% (used only for turbulence intensity analysis).
The second criterion removes records where precipitation may be interpreted by the Triton as a strong vertical wind speed.
2.2 Tower Data Filtering Data from the meteorological tower must also be filtered before analysis. Basic filtering consists of removing all records where the recorded wind speed is less than 0.5 m/s. A typical anemometer has a calibration offset of about 0.35 m/s; therefore, setting a minimum wind speed of 0.5 m/s assures that the anemometer is measuring a wind speed greater than the offset.
The meteorological tower for this study had two anemometers at the 80m level, mounted in a ‘goal-post’ configuration at 90° and 270°. If the wind is out of one of these directions, one anemometer will be in the wind shadow of the other. Taking the maximum of the two anemometers is a simple way to remove any equipment shadow effects, although it does not account for any speed-up effects. The maximum 80m wind speed is used in all calculations where sample-to-sample comparisons are made.
More stringent filtering is applied when comparing average wind speeds. The average of the two anemometers is used and a narrower directional filter is applied to reduce the effects of flow distortions.
2.3 Directional Data Filtering Because an operating wind farm is located within a few hundred meters of the sodar, it was necessary to remove a large sector from the analysis data set. This sector included all wind directions from 300° to 70° (as measured by the NRG wind vane at 78.6m). A total of 9309 records (about 32% of the total) were removed.
3 Overall Triton Performance
3.1 Sodar Operational Uptime (Gross Data Recovery) Uptime is defined as a sampling period where at least one wind speed measurement (at any level) is reported. Operational uptime of the Triton was 98.27% (28019 of 28513 samples). The longest data outage was 256 samples (42.7 hours) on 2009:03:08. There were also outages of 57, 39, 32, 19, and 10 samples and a few dozen outages of 1 to 3 samples.
4
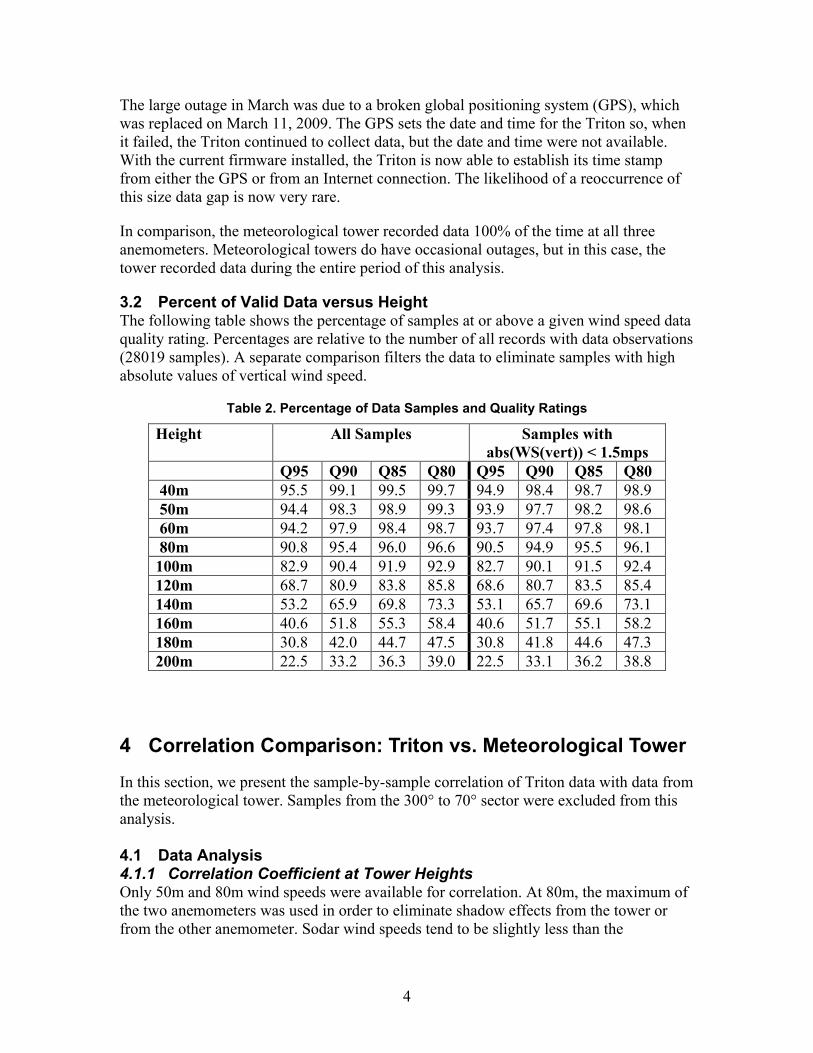
The large outage in March was due to a broken global positioning system (GPS), which was replaced on March 11, 2009. The GPS sets the date and time for the Triton so, when it failed, the Triton continued to collect data, but the date and time were not available. With the current firmware installed, the Triton is now able to establish its time stamp from either the GPS or from an Internet connection. The likelihood of a reoccurrence of this size data gap is now very rare.
In comparison, the meteorological tower recorded data 100% of the time at all three anemometers. Meteorological towers do have occasional outages, but in this case, the tower recorded data during the entire period of this analysis.
3.2 Percent of Valid Data versus Height The following table shows the percentage of samples at or above a given wind speed data quality rating. Percentages are relative to the number of all records with data observations (28019 samples). A separate comparison filters the data to eliminate samples with high absolute values of vertical wind speed.
Table 2. Percentage of Data Samples and Quality Ratings
Height All Samples Samples with abs(WS(vert)) < 1.5mps
Q95 Q90 Q85 Q80 Q95 Q90 Q85 Q80 40m 95.5 99.1 99.5 99.7 94.9 98.4 98.7 98.9 50m 94.4 98.3 98.9 99.3 93.9 97.7 98.2 98.6 60m 94.2 97.9 98.4 98.7 93.7 97.4 97.8 98.1 80m 90.8 95.4 96.0 96.6 90.5 94.9 95.5 96.1 100m 82.9 90.4 91.9 92.9 82.7 90.1 91.5 92.4 120m 68.7 80.9 83.8 85.8 68.6 80.7 83.5 85.4 140m 53.2 65.9 69.8 73.3 53.1 65.7 69.6 73.1 160m 40.6 51.8 55.3 58.4 40.6 51.7 55.1 58.2 180m 30.8 42.0 44.7 47.5 30.8 41.8 44.6 47.3 200m 22.5 33.2 36.3 39.0 22.5 33.1 36.2 38.8
4 Correlation Comparison: Triton vs. Meteorological Tower
In this section, we present the sample-by-sample correlation of Triton data with data from the meteorological tower. Samples from the 300° to 70° sector were excluded from this analysis. 4.1 Data Analysis 4.1.1 Correlation Coefficient at Tower Heights Only 50m and 80m wind speeds were available for correlation. At 80m, the maximum of the two anemometers was used in order to eliminate shadow effects from the tower or from the other anemometer. Sodar wind speeds tend to be slightly less than the

5
corresponding meteorological tower speeds, as shown by the following linear fits and in Figures 1 and 2.
80m: Sodar = 0.9576*Met + 0.1715 R2 = 0.974 (R 0.987) Npts = 17721 50m: Sodar= 0.9620*Met + 0.1104 R2 = 0.966 (R 0.983) Npts = 14365
Figure 1. Comparison of wind speed data from 80m height.
Figure 2. Comparison of wind speed data from 50m height.
6
Additional directional filtering of the 50m data was required to remove tower shadow effects that decreased the correlation at wind speeds of 5 to 15 m/s. Using only the sector from 150° to 280°, the characteristics of the 50m correlation are very similar to those at 80m.
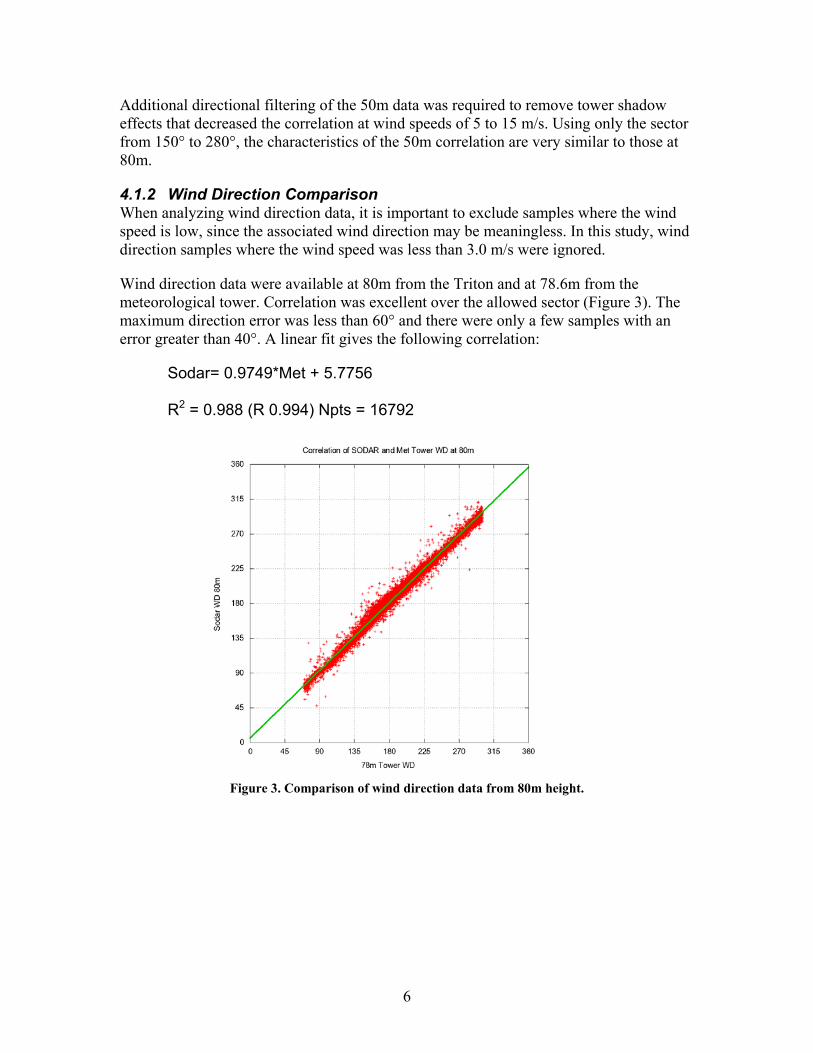
4.1.2 Wind Direction Comparison When analyzing wind direction data, it is important to exclude samples where the wind speed is low, since the associated wind direction may be meaningless. In this study, wind direction samples where the wind speed was less than 3.0 m/s were ignored.
Wind direction data were available at 80m from the Triton and at 78.6m from the meteorological tower. Correlation was excellent over the allowed sector (Figure 3). The maximum direction error was less than 60° and there were only a few samples with an error greater than 40°. A linear fit gives the following correlation:
Sodar= 0.9749*Met + 5.7756 R2 = 0.988 (R 0.994) Npts = 16792
Figure 3. Comparison of wind direction data from 80m height.

7
Figure 4. Wind direction distributions at 80m
Figure 4 shows the wind direction distributions measured at the tower and by the sodar at the 80m height. The overall shapes and magnitudes of the distributions are in good agreement, although there is a slight clockwise rotation of the sodar distribution. This rotation could be the result of misalignment of either instrument, or it could be evidence of a real effect where winds are diverted by local obstructions at one of the measurement sites. All directions were used in this analysis. It is possible that the spiky appearance of the distributions between 330° and 60° is caused by the upwind wind farm, but this cannot be confirmed from the data.
4.1.3 Wind Shear Profile Analysis Wind shear on the meteorological tower could only be computed between the 50m and 80m levels, using the 50m anemometer (oriented at 300°) and the 80m “A” anemometer (oriented at 270°). Shear was only computed when the 50m speed on both the tower and the sodar were at least 3.0 m/s. The shear calculation was further restricted to only the most frequent wind direction sector of 150° to 220°. Shears were also categorized into daytime and nighttime shears, with daytime being defined as 0700 to 1850 local time (regardless of the time of year).
As shown in Table 3, the average shears measured by the Triton compared very well to those from the meteorological tower, with differences of all shear exponents less than 2%. These observed differences in shear exponents are comparable to the expected differences in average wind speed comparisons.
8
Table 3. Wind Shear Analyses
Shear Exponent Sodar Met Nsamp All 0.244 0.240 10241 Day 0.137 0.131 4908 Night 0.343 0.340 5333
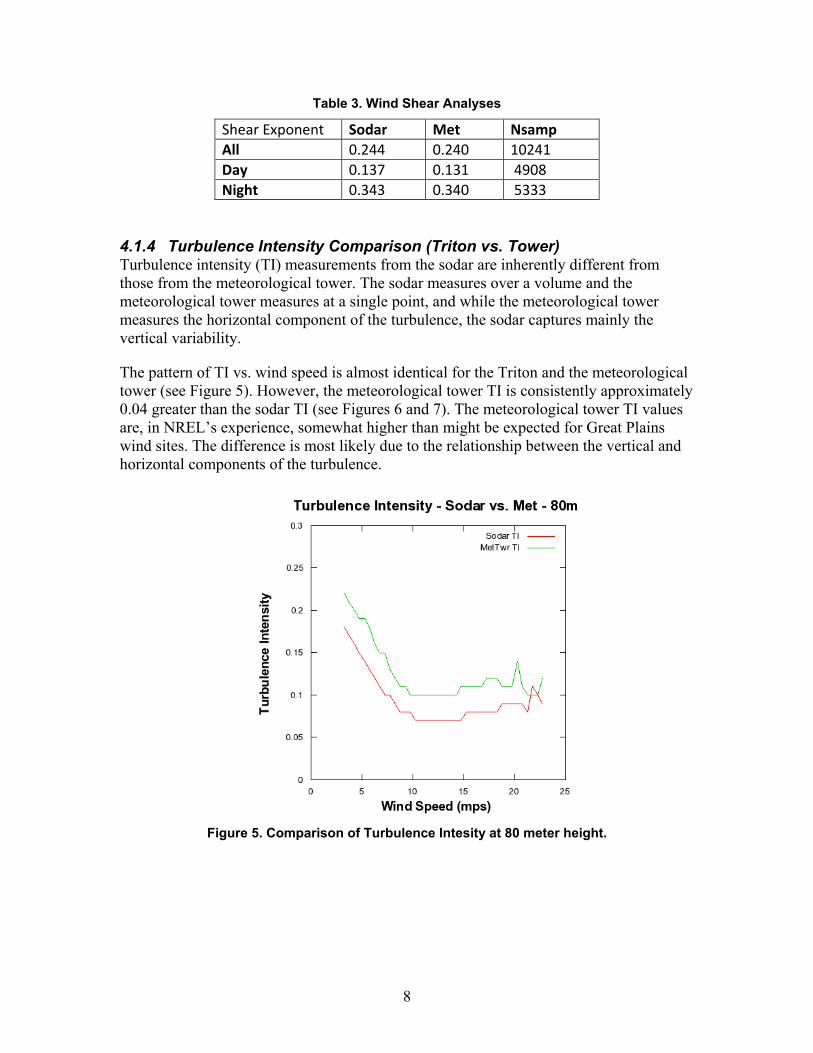
4.1.4 Turbulence Intensity Comparison (Triton vs. Tower) Turbulence intensity (TI) measurements from the sodar are inherently different from those from the meteorological tower. The sodar measures over a volume and the meteorological tower measures at a single point, and while the meteorological tower measures the horizontal component of the turbulence, the sodar captures mainly the vertical variability.
The pattern of TI vs. wind speed is almost identical for the Triton and the meteorological tower (see Figure 5). However, the meteorological tower TI is consistently approximately 0.04 greater than the sodar TI (see Figures 6 and 7). The meteorological tower TI values are, in NREL’s experience, somewhat higher than might be expected for Great Plains wind sites. The difference is most likely due to the relationship between the vertical and horizontal components of the turbulence.
Figure 5. Comparison of Turbulence Intesity at 80 meter height.

9
Figure 6. Turbulence Intensity from sodar at 80 m.
Figure 7. Turbulence Intensity from meteorological tower at 80 m.
5 Average Wind Speed Comparison with Tower Data
When comparing average wind speeds between the sodar and the tower, more stringent filters need to be applied. Using the maximum of the two anemometers can lead to a high

10
bias in the meteorological tower average, so we use the average of the two, restricted to those samples where the two values are very close.
Additional directional filtering should also be applied to the meteorological tower data in order to remove tower shadow and other flow distortion effects. Guidelines from Second Wind suggested limiting the direction sectors to two 30° bands oriented 45° away from the booms: 120° <= WD <=150° and 210° <= WD <= 240°. However, it was found that this eliminated most of the measurements, leading to reduced confidence in the final correlation. We investigated the directional relationship between the two 80m anemometers mounted in goal-post configuration, as well as their absolute magnitudes, and found that the sector from 120° to 240° had no obvious flow effects, so this wider sector was used in the final analysis. Including this sector resulted in about three times as much data being available for correlation.
5.1 Average Wind Speed Comparison: Only Directional Filters Applied Simple directional filtering to remove the samples affected by the nearby wind farm was applied, which removed 8861 samples. With this basic filter applied, the average sodar wind speed was 9.377 m/s and the average meteorological tower speed was 9.580 m/s, a ratio of 1.022.
5.2 Average Wind Speed Comparison: With All Filters Applied The following filters were applied:
• Sodar data quality at least 95%
• Sodar vertical wind speed (absolute value) less than 1.0 m/s
• Ratio of 80m anemometers on meteorological tower is from 0.98 to 1.02
• Both 80m meteorological tower wind speeds at least 2.0 m/s
• Wind direction at 80m on meteorological tower is from 120° to 240°.
After all these filters were applied, 13511 records (47.4% of total) were used to compute the average wind speeds. The average sodar wind speed was 10.217 m/s and the average meteorological tower speed was 10.427 m/s, a tower-to-sodar ratio of 1.021. The linear fit to all 13511 samples was:
WS(Sodar) = 0.9529*WS(met) + 0.281
R2 = 0.969 R = 0.984
Inclusion of the sector from 150 to 210 significantly increased the average wind speeds of both the sodar and tower, when compared to data from the narrow bands suggested by Second Wind. This sector includes much of the prevailing (and higher speed) winds seen at this site. However, the overall correlation coefficients and wind speed ratios had only minor changes when including this sector, leading us to believe that the goal-post mounting of the 80m anemometers does a good job of eliminating most flow effects. The
11
choice of directional sectors to use for wind speed comparison analysis will differ from site to site, and will depend on tower configuration, prevailing wind directions, wind speed distribution by direction, and other factors. We suggest experimenting with the directional sectors removed to achieve a good balance between removing too much data and including data that may be affected by tower or other flow effects.
6 Conclusions
The National Renewable Energy Laboratory (NREL) has completed an analysis of the wind resource data provided by Second Wind Inc. Ten-minute data samples over a 198-day period were collected from an 80m meteorological tower and a Triton sodar system from a measurement program conducted near an operating wind farm in western Texas. It is important to note that NREL did not participate in the measurement phase of this study. The tower configuration, specification of the locations of the meteorological tower and Triton, and the collection of data were all done by the wind farm developer with assistance from Second Wind. The collected data were then sent to NREL for analysis.
Our analysis of the sample Triton data set shows excellent agreement with the tower measurements. Given the 200m distance between the sodar and the meteorological tower, it would be unreasonable to expect a perfect correlation between the two datasets. Based on our analysis of the data provided, we offer the following observations:
• The operational uptime was greater than 98%, demonstrating the Triton’s operational reliability during this 198-day period.
• The Triton’s measured wind speeds correlated well to the meteorological tower, but were generally slightly lower. The correlation coefficients were greater than 0.983 at both heights (50m and 80m).
• The Triton’s measured wind direction also correlated very well to the tower data when the sector containing the wind farm was removed. At 80m, the correlation coefficient calculated between the Triton and the wind vane was 0.994.
• The wind direction distributions as measured by the Triton and the tower were consistent. A slight rotation of the directions may be attributable to instrument alignment, or may reflect an actual difference in the wind direction over the horizontal distance of 200m between the meteorological tower and the Triton.
• The percent of valid data (Q >= 90%) measured by the Triton was greater than 95% at 80m and was approximately 81% at 120m.
• The shear exponents calculated from the tower and Triton data were comparable in terms of overall shear as well as daytime and nighttime shear.
• There is a discrepancy in the average turbulence intensity as measured by the two instruments. At 80m, the Triton measured an average TI of 0.100, while the average 80m TI on the meteorological tower was 0.132. A similar relationship

12
holds true at 50m. Both the Triton and tower captured the expected relationship between turbulence and wind speed, but the curve for the meteorological tower is consistently approximately 0.04 higher than the sodar curve. The TI values from the sodar are consistent with normal Great Plains TI values. More work is needed to determine why the meteorological tower TIs are so high and, if they are valid, why they differ so much from the sodar values.
• The average wind speed measured by the Triton and tower were very similar at all heights. At 80m, the difference in average wind speeds between the Triton and the meteorological tower was 2.1%.
• Future analyses of longer data periods (e.g. at least one year) are needed to address seasonal and annual performance comparisons.
• This study did not investigate the effects of precipitation or extreme weather events on sodar performance. Further work is recommended to determine how much and whether the sodar signal degrades during periods of precipitation.
7 References
Walls, Liz (2009), Guidelines for Triton Data Analysis and Comparison to Nearby Met Tower Measurements, Second Wind, Inc.
International Electrotechnical Commission (2005). Wind Turbines – Part 12-1: Power Performance Measurements of Electricity Producing Wind Turbines. IEC Technical Report 61400-12-1. Geneva, Switzerland.

F1147-E(10/2008)
REPORT DOCUMENTATION PAGE Form Approved OMB No. 0704-0188
The public reporting burden for this collection of information is estimated to average 1 hour per response, including the time for reviewing instructions, searching existing data sources, gathering and maintaining the data needed, and completing and reviewing the collection of information. Send comments regarding this burden estimate or any other aspect of this collection of information, including suggestions for reducing the burden, to Department of Defense, Executive Services and Communications Directorate (0704-0188). Respondents should be aware that notwithstanding any other provision of law, no person shall be subject to any penalty for failing to comply with a collection of information if it does not display a currently valid OMB control number. PLEASE DO NOT RETURN YOUR FORM TO THE ABOVE ORGANIZATION. 1. REPORT DATE (DD-MM-YYYY)
February 2010 2. REPORT TYPE
Technical Report 3. DATES COVERED (From - To)
4. TITLE AND SUBTITLE
Comparison of Second Wind Triton Data with Meteorological Tower Measurements
5a. CONTRACT NUMBER DE-AC36-08-GO28308
5b. GRANT NUMBER
5c. PROGRAM ELEMENT NUMBER
6. AUTHOR(S) G. Scott D. Elliott and M. Schwartz , ,
5d. PROJECT NUMBER NREL/TP-550-47429
5e. TASK NUMBER 5500.4000
5f. WORK UNIT NUMBER
7. PERFORMING ORGANIZATION NAME(S) AND ADDRESS(ES) National Renewable Energy Laboratory 1617 Cole Blvd. Golden, CO 80401-3393
8. PERFORMING ORGANIZATION REPORT NUMBER NREL/TP-550-47429
9. SPONSORING/MONITORING AGENCY NAME(S) AND ADDRESS(ES)
10. SPONSOR/MONITOR'S ACRONYM(S) NREL
11. SPONSORING/MONITORING AGENCY REPORT NUMBER
12. DISTRIBUTION AVAILABILITY STATEMENT National Technical Information Service U.S. Department of Commerce 5285 Port Royal Road Springfield, VA 22161
13. SUPPLEMENTARY NOTES
14. ABSTRACT (Maximum 200 Words) With the increased interest in remote sensing of wind information in recent years, it is important to determine the reliability and accuracy of new wind measurement technologies if they are to replace or supplement conventional tower-based measurements. In this study, we present the results of an analysis characterizing the measurement performance of a state-of-the-art SOund Detection And Ranging (sodar) device when compared to a high-quality tower measurement program. Second Wind Inc. (Somerville, MA, USA) provided NREL with more than six months of data from a measurement program conducted near an operating wind farm in western Texas.
15. SUBJECT TERMS NREL; National Renewable Energy Laboratory; SRRL; sodar; Second Wind; tower measurement; wind measurement
16. SECURITY CLASSIFICATION OF: 17. LIMITATION OF ABSTRACT
UL
18. NUMBER OF PAGES
19a. NAME OF RESPONSIBLE PERSON a. REPORT
Unclassified b. ABSTRACT Unclassified
c. THIS PAGE Unclassified 19b. TELEPHONE NUMBER (Include area code)
Standard Form 298 (Rev. 8/98) Prescribed by ANSI Std. Z39.18