comparison of triton sodar data to meteorological tower wind
TRANSCRIPT

NREL is a national laboratory of the U.S. Department of Energy, Office of Energy Efficiency & Renewable Energy, operated by the Alliance for Sustainable Energy, LLC.
Contract No. DE-AC36-08GO28308
Comparison of Triton SODAR Data to Meteorological Tower Wind Measurement Data in Hebei Province, China Yi Yuechun and Wang Jixue HYDROCHINA Wang Hongfang, Li Guimin, and Yang Bolin MLN Software George Scott, Dennis Elliott, and David Kline National Renewable Energy Laboratory
Technical Report NREL/TP-5000-52709 January 2012

NREL is a national laboratory of the U.S. Department of Energy, Office of Energy Efficiency & Renewable Energy, operated by the Alliance for Sustainable Energy, LLC.
National Renewable Energy Laboratory 1617 Cole Boulevard Golden, Colorado 80401 303-275-3000 • www.nrel.gov
Contract No. DE-AC36-08GO28308
Comparison of Triton SODAR Data to Meteorological Tower Wind Measurement Data in Hebei Province, China Yi Yuechun and Wang Jixue HYDROCHINA Wang Hongfang, Li Guimin, and Yang Bolin MLN Software George Scott, Dennis Elliott, and David Kline National Renewable Energy Laboratory
Prepared under Task No. WFK61010
Technical Report NREL/TP-5000-52709 January 2012

NOTICE
This report was prepared as an account of work sponsored by an agency of the United States government. Neither the United States government nor any agency thereof, nor any of their employees, makes any warranty, express or implied, or assumes any legal liability or responsibility for the accuracy, completeness, or usefulness of any information, apparatus, product, or process disclosed, or represents that its use would not infringe privately owned rights. Reference herein to any specific commercial product, process, or service by trade name, trademark, manufacturer, or otherwise does not necessarily constitute or imply its endorsement, recommendation, or favoring by the United States government or any agency thereof. The views and opinions of authors expressed herein do not necessarily state or reflect those of the United States government or any agency thereof.
Available electronically at http://www.osti.gov/bridge
Available for a processing fee to U.S. Department of Energy and its contractors, in paper, from:
U.S. Department of Energy Office of Scientific and Technical Information P.O. Box 62 Oak Ridge, TN 37831-0062 phone: 865.576.8401 fax: 865.576.5728 email: mailto:[email protected]
Available for sale to the public, in paper, from:
U.S. Department of Commerce National Technical Information Service 5285 Port Royal Road Springfield, VA 22161 phone: 800.553.6847 fax: 703.605.6900 email: [email protected] online ordering: http://www.ntis.gov/help/ordermethods.aspx
Cover Photos: (left to right) PIX 16416, PIX 17423, PIX 16560, PIX 17613, PIX 17436, PIX 17721
Printed on paper containing at least 50% wastepaper, including 10% post consumer waste.

1
Table of Contents
1 Introduction ............................................................................................................. 3 1.1 Measurement Project Description ................................................................................ 3 1.2 Triton Configuration .................................................................................................... 3 1.3 Meteorological Tower Configuration ........................................................................... 4 1.4 Site Layout and Typical Conditions ............................................................................. 5
2 Data Filtering .......................................................................................................... 6 2.1 Triton Data Filtering ..................................................................................................... 6 2.2 Tower Data Filtering .................................................................................................... 7 2.3 Directional Data Filtering............................................................................................. 7
3 Overall Triton Performance .................................................................................... 8 3.1 SODAR Operational Uptime ....................................................................................... 8 3.2 Percent of Valid Data versus Height ............................................................................. 8
4 Correlation Comparison: Triton versus Meteorological Tower .............................. 9 4.1 Correlation Coefficient at Tower Heights .................................................................... 9 4.2 Wind Direction Comparison ...................................................................................... 12 4.3 Wind Shear Profile Analysis ...................................................................................... 15 4.4 Turbulence Intensity Comparison (Triton versus Tower) ........................................... 17
5 Average Wind Speed Comparison with Stringent Filters Applied ........................ 18
6 Analysis for Possible Causes of Wind Speed Bias ............................................... 21 6.1 Temperature ................................................................................................................ 22 6.2 Humidity .................................................................................................................... 22 6.3 Wind Direction ........................................................................................................... 23
7 Conclusions ........................................................................................................... 23
8 References ............................................................................................................. 26
Appendix 1 ................................................................................................................... 27
Appendix 2 ................................................................................................................... 34

2
Table of Figures Figure 1. Triton installed at site. ....................................................................................................... 4
Figure 2. 70 m meteorological tower configuration .......................................................................... 5
Figure 3. Nearest turbine and meteorological tower as seen from Triton. ........................................ 6
Figure 4. Triton recovery rate by height and signal quality (samples with high vertical wind speed excluded) ........................................................................................................................................... 9
Figure 5. Comparison of wind speed data from 70 m height .......................................................... 10
Figure 6. Comparison of wind speed data from 50 m height .......................................................... 11
Figure 7. 70 m wind speed distributions from Triton and met tower .............................................. 12
Figure 8. 50 m wind speed distributions from Triton and met tower .............................................. 12
Figure 9. Comparison of wind direction data from 70 m height ..................................................... 13
Figure 10. Comparison of wind direction data from 50 m height ................................................... 14
Figure 11. Wind direction distributions at 70 m .............................................................................. 15
Figure 12. Wind direction distributions at 50 m .............................................................................. 15
Figure 13. Wind shear profile analysis of Triton and wind tower ................................................... 17
Figure 14. Comparison of turbulence intensity at 70 m height ....................................................... 18
Figure 15. Comparison of turbulence intensity at 50 m height ....................................................... 18
Figure 16. Comparison of highest quality wind speed data at 70 m with stringent filters applied . 20
Figure 17. Comparison of highest quality wind speed data at 50 m with stringent filters applied . 21
Figure 18. 70 m high wind speed bias and temperature plot ........................................................... 22
Figure 19. Deviation of 70 m high wind speed and humidity scatter ............................................. 22
Figure 20. 68 m high mast wind direction and speed deviation plot ............................................... 23
Table of Tables
Table 1. Instrumentation used in comparison study .......................................................................... 4
Table 2. Location of measurement sites ............................................................................................ 6
Table 3. Percentage of data samples and quality ratings for Triton ................................................... 8
Table 4. Wind shear exponent analyses ........................................................................................... 16
Table 2-1 Deviation between Triton and MetTwr in each bin ...................................................... 34
F

3
1 Introduction
With the increased interest in remote sensing of wind information in recent years, it is important to determine the reliability and accuracy of new wind measurement technologies if they are to replace or supplement conventional tower-based measurements. In view of this, HYDROCHINA Corporation (HYDROCHINA) and the United States National Renewable Energy Laboratory (NREL) conducted a comparative test near a wind farm in Hebei Province, China. We present the results of an analysis characterizing the measurement performance of a state-of-the-art Sound Detection and Ranging (SODAR) device when compared to a traditional tower measurement program.
NREL performed the initial analysis of a three-month period and sent the results to HYDROCHINA. When another month of data became available, HYDROCHINA and their consultant Beijing Millenium Engineering Software (MLN) repeated NREL’s analysis on the complete data set, also adding sensitivity analysis for temperature, humidity, and wind speed (Section 6). This report presents the results of HYDROCHINA’s final analysis of the four-month period.
1.1 Measurement Project Description This project collected data from a Second Wind Triton SODAR unit and from a 70 m meteorological tower located 80 m to the east.
This study compares data from a 120-day period covering January 1 to April 30, 2011.
1.2 Triton Configuration The Second Wind Triton is a SODAR device designed for use in wind energy applications. The Triton uses a patent-pending hexagonal speaker array to efficiently focus sound beams to improve signal-to-noise ratio accuracy and decrease disruption. The array is housed in a tri-lobed acoustic enclosure to reduce the chance of sound artifacts disrupting data. Each of the three beams samples a volume of atmosphere at each measurement height that is within 5° of the beam centerline and about 20 m thick, centered on the measurement level. The unit is two meters tall, with a two meter by three meter footprint (Fig. 1), and includes internal controls to compensate for uneven ground. It has a built-in GPS to identify the time and location of the data. More information is available at http://www.secondwind.com.
The Triton was programmed to save one record every 10 minutes. Each record includes data from 11 heights, between 30 m and 200 m above the ground. The 50 m and 70 m heights coincided with the measurement heights on the meteorological tower. Data returned at each height includes wind direction, horizontal and vertical wind speeds, and turbulence intensity. The system also recorded data quality indicators (0% to 100%) for both wind speed and turbulence intensity. These data

4
quality values, which incorporate signal-to-noise ratio, signal strength and data recovery rate, were used to screen the data for this analysis.
Figure 1. Triton installed at site. Photo by Dennis Elliott, NREL/PIX 19940
1.3 Meteorological Tower Configuration The meteorological tower is a 70 m guyed, 3-legged lattice tower (Fig. 2). The instrumentation was designed to conform to IEC Standard IEC 61400-12-1, Power Performance Measurements of Electricity Producing Wind Turbines. The two primary levels of instrumentation are located at 50 m and 70 m. Table 1 provides the details of the instrumentation used in this comparison study. (Additional sensors were present, but the measurements were not relevant to this study.) Anemometer calibration sheets are presented in Appendix 1.
Table 1. Instrumentation used in comparison study
Channel Sensor Model Height
agl
Boom
Orientation
Boom
Length
Notes
C1 Anemometer
(eastern)
RISØ
2546A
70 m 90° 1.8 m Calibrated
SN#9899
C2 Anemometer
(western)
RISØ
2546A
70 m 270° 1.8 m Calibrated
SN#9898
C3 Anemometer RISØ
2546A
50 m 270° 1.8 m Calibrated
SN#9897
A1 Wind Vane Second
Wind
PVI
68 m 270° 1.8 m
A3 Wind Vane Second
Wind
PVI
48 m 270° 1.8 m
The face width of the tower is approximately 0.5 m. All three anemometers and both wind vanes are mounted on 1.8 m booms extending east and west of the tower.

5
There also were sonic anemometers (not shown in Fig. 2) installed at both the 50 m and 70 m levels on 1.5 m booms extending to the northeast.
Figure 2. 70 m meteorological tower configuration
1.4 Site Layout and Typical Conditions Vegetation surrounding the measurement sites is slightly rolling grassland. The Triton is at an altitude of approximately 1525 m. The 70 m lattice meteorological tower is 80 m east of the Triton, at an altitude of 1532 m. There is an operating wind turbine 210 m to the northeast of the Triton. The specific location of the measurement sites and the wind turbine are shown in Table 2, and a picture of the site is shown in Figure 3.

6
Prevailing winds during the period of record were predominantly from the northwest, with a small fraction from the south. The percentage of winds from other directions was insignificant.
Table 2. Location of measurement sites
Object description Elevation Distance from Triton Height
Triton 1525 m 0 2 m
Wind turbine 1526 m 213 m 65m+37.5 m
Wind Tower 1532 m 83 m 70 m
Figure 3. Nearest turbine and meteorological tower as seen from Triton. Photo by Dennis Elliott, NREL/PIX 53709.
2 Data Filtering
2.1 Triton Data Filtering SODAR data was filtered to remove low-quality and spurious data before any analysis was performed. In this study, we used the Second Wind filtering criteria specified in Walls (2009):
1. Wind speed quality factor >= 90%
2. Vertical wind speed (absolute magnitude) <= 1.5 m/s
3. Turbulence quality factor >= 90% (used only for turbulence intensity analysis).

7
The second criterion removes records in which precipitation may be interpreted by the Triton as a strong vertical wind speed.
2.2 Tower Data Filtering Data from the meteorological tower also must be filtered before analysis. Basic filtering consists of removing all records in which the recorded wind speed is less than 0.5 m/s. A typical anemometer has a calibration offset of about 0.35 m/s; therefore, setting a minimum wind speed of 0.5 m/s assures that the anemometer is measuring a wind speed greater than the offset.
Periods of suspected icing also were removed from the tower data. These were identified by a combination of low temperatures, very low standard deviations of wind vane readings, and large differences between the SODAR and tower wind speeds.
2.3 Directional Data Filtering Initial analysis of the data showed that the prevailing direction was northwest, with more than 70% of the winds falling in the sector from 270° to 360°. A secondary (and much smaller) peak occurred around 170° to 180°.
A number of factors affected wind data from certain directions:
• a wind turbine located to the northeast of the Triton will affect the northeast wind;
• the tower structure affected the western cup when the wind was from the northeast to the southeast, and it affected the eastern cup when the wind was from the northwest to the southwest;
• the sonic anemometers affected the western cup anemometer values when the wind was from the northeast;
• there were very few samples recorded from the SE, increasing uncertainty in this sector;
• a wiring problem caused recorded tower wind speeds to be abnormally low when the wind was from the 0°-30° sector
Considering all these factors, we used only the data from the northwest sector (270° to 360°) for most analysis, although the southerly sector also is used for wind direction correlation to improve the fit.

8
3 Overall Triton Performance
3.1 SODAR Operational Uptime Uptime is defined as a sampling period in which at least one wind speed measurement (at any level) is reported. Operational uptime of the Triton was 98.41% (17005 of 17280 samples). The longest data outage was 257 samples (about 43 hours) from 2011:02:12:0830 to 2011:02:14:0310, caused by a software error and compounded by a temporary loss in communication. There were also a few single sample outages. These short outages are caused by a database problem, and while the data are recoverable, they were not recovered for this study.
In comparison, the meteorological tower recorded data 99.97% of the time at all three anemometers. (There was loss of five samples from 2011:01:12:0110 to 2011:01:12:0150 [5 of 17280 samples].)
3.2 Percent of Valid Data versus Height Table 3 and Figure 4 show the percentage of samples at or above a given wind speed data quality rating. Percentages are relative to the number of all records with data observations (17005 samples). A separate comparison filters the data to eliminate samples with high absolute values of vertical wind speed.
Table 3. Percentage of data samples and quality ratings for Triton
Height (m) All Samples Samples with abs(WS(vert)) < 1.5ms
Q95 Q90 Q85 Q80 Q95 Q90 Q85 Q80 30 91.25% 98.23% 98.79% 99.05% 91.10% 98.06% 98.62% 98.88% 40 90.33% 98.28% 98.97% 99.28% 90.16% 98.07% 98.76% 99.06% 50 89.93% 97.85% 98.72% 99.26% 89.79% 97.65% 98.52% 99.05% 60 88.01% 96.31% 97.52% 98.19% 87.88% 96.15% 97.32% 97.99% 70 85.14% 94.57% 96.08% 96.82% 85.05% 94.44% 95.94% 96.66% 80 80.56% 92.17% 94.22% 95.32% 80.51% 92.05% 94.08% 95.17%
100 67.26% 83.85% 87.29% 89.64% 67.21% 83.78% 87.20% 89.56% 120 50.26% 69.71% 74.37% 78.30% 50.26% 69.71% 74.37% 78.30% 140 33.00% 52.76% 58.65% 63.52% 33.00% 52.76% 58.65% 63.52% 160 19.58% 35.99% 41.69% 46.82% 19.58% 35.99% 41.69% 46.82% 200 6.67% 14.33% 17.94% 21.16% 6.66% 14.24% 17.80% 20.96%

9
Figure 4. Triton recovery rate by height and signal quality (samples with high vertical wind speed excluded)
These recovery rates are slightly lower than the average rates observed at other Triton installations. For example, in NREL’s previous study of a Triton in west Texas, recovery rates (Q90 with vertical wind speed filtering) at 60 m and 80 m were 97.4% and 94.9% respectively, about 1% to 3% greater than those observed at the site. A possible explanation is that the data were collected over four winter months, resulting in an average ambient temperature of -7.74°C.
SODAR signal strength is affected by atmospheric conditions. Moisture and turbulence both enhance signal returns. The cold dry night air at the test site represents the most likely cause for the slight decrease in data recovery rates as compared to the Texas site.
4 Correlation Comparison: Triton versus Meteorological Tower
In this section, we present the sample-by-sample correlation of Triton data with data from the meteorological tower. Except for the wind direction analysis, only samples from the 270° to 360° sector were used in this analysis. Periods of suspected icing events also were removed.
4.1 Correlation Coefficient at Tower Heights Only 50 m and 70 m wind speeds were available for correlation. At 70 m, the western (C2) anemometer was used since the eastern anemometer was strongly affected by tower shadow when winds were from the prevailing direction. SODAR wind speeds tend to be very slightly less than the corresponding meteorological tower speeds, as shown by the following linear fits and in Figures 5 and 6. Ratios of average SODAR speed to average tower speed were 0.9904 at 70 m and 0.9851 at 50 m.

10
70m: SODAR = 0.977 *Met + 0.111 R2 = 0.971 (R 0.985) Npts = 9931
50m: SODAR = 0.994*Met - 0.076 R2 = 0.973 (R 0.986) Npts = 10279
Figure 5. Comparison of wind speed data from 70 m height

11
Figure 6. Comparison of wind speed data from 50 m height
Figures 7 and 8 show the frequency distribution curves by wind speed at 70 m and 50 m, respectively, for the Triton and the tower. The distribution curves between the Triton and the tower are in very good agreement. The max deviation is 0.6% (in 8-8.5 bin) at 70 m and 0.93% (in 4.5-5 bins) at 50 m, as shown in the table in Appendix 2.

12
Figure 7. 70 m wind speed distributions from Triton and met tower
Figure 8. 50 m wind speed distributions from Triton and met tower
4.2 Wind Direction Comparison When analyzing wind direction data, it is important to exclude samples where the wind speed is low, since the associated wind direction may be meaningless. In this study, wind direction samples in which the wind speed was less than 3.0 m/s were ignored.

13
Wind direction data were available at 50 m and 70 m from the Triton and at 48 m and 68 m from the meteorological tower. After removing samples with low wind speed or suspected vane icing, correlation was very good over the remaining samples (Fig. 9 and 10). A linear fit gives the following correlation:
70m: SODARWD= 1.004*MetWD + 4.57 R2 = 0.998 (R 0.999) Npts = 14778
50m: SODARWD= 1.007*MetWD + 4.134 R2 = 0.997 (R 0.998) Npts = 15083
Figure 9. Comparison of wind direction data from 70 m height

14
Figure 10. Comparison of wind direction data from 50 m height
Figures 11 and 12 show the wind direction distributions measured by the tower and the SODAR at the 70 m and 50 m heights, respectively. The overall shape and magnitude of the distributions are in very good agreement, although there is a slight clockwise rotation (about 5°) in the SODAR distribution. This same rotation is seen in the correlation of Figures 9 and 10, and is most likely caused by the alignment of the tower to magnetic north while the Triton was aligned to true north.

15
Figure 11. Wind direction distributions at 70 m
Figure 12. Wind direction distributions at 50 m
4.3 Wind Shear Profile Analysis Wind shear on the meteorological tower could only be computed between the 50 m and 70 m levels, using the 50 m anemometer and the 70 m C2 (western) anemometer (both oriented at 270°). Shear was only computed when the 50 m speeds on both the tower and the SODAR were at least 3.0 m/s. The shear calculation was further restricted to only the most frequent wind direction sector of 270° to 360°. Shears also were

16
categorized into daytime and nighttime shears, with daytime being defined as 0800 to 1750 local time (an approximation for the winter months).
As shown in Table 5, the average shears measured by the Triton were somewhat higher than those from the meteorological tower, with most of the differences occurring in the nighttime hours. It should be noted that 20 m (70 m – 50 m) is a relatively thin layer over which to compute wind shear, and that uncertainty may be higher.
Table 4. Wind shear exponent analyses
SODAR Met Nsamp
All 0.166 0.141 10012 Day 0.056 0.058 4287
Night 0.249 0.203 5725
Figure 13 shows the comparison of average shears for each 10-minute interval during the day. The difference between the nighttime shears for the SODAR and the met tower is unclear, but some of the causes of this difference can be seen from an analysis of the diurnal wind speeds. The spread between the SODAR 50 m speed and the met tower 50 m speed is larger during the nighttime than it is in the daytime, while the 70 m speeds track each other much better. The overall effect is to increase the SODAR shear during the night. The cause of this difference should be investigated to see if the effect is dependent on wind speed, seasonal variations, or other factors. Under conditions of very high shear, SODAR measurements at low heights can be slightly lower than point (anemometer) measurements due to the low speeds at the bottom of the sample volume. These speed differences, which are more pronounced at the lower levels, can lead to an increase in the shear exponent. It should be noted that the nighttime Triton speeds are about 1% lower than the anemometer values at 70 m, and about 2.5% lower at 50 m. The narrow 20 m interval used for calculating shear can cause these small speed differences to result in a relatively large shear exponent difference.

17
Figure 13. Wind shear profile analysis of Triton and wind tower
4.4 Turbulence Intensity Comparison (Triton versus Tower) Turbulence intensity (TI) measurements from the SODAR are inherently different from those of the meteorological tower. The SODAR measures over volume and the meteorological tower measures at a single point. In addition, the meteorological tower measures the horizontal component of the turbulence, while the SODAR captures mainly the vertical variability.
Over most wind speeds, the SODAR and met tower average TI are generally in good agreement as shown in Figures 14 and 15, with the SODAR measuring slightly lower turbulence intensity than the met tower. At 70 m, the SODAR TI appears to be higher than the met tower value at higher wind speeds (above about 12 m/s), but a lack of data in this speed range make it difficult to quantify. SecondWind has performed a study comparing the TI values measured by 11 Tritons with those from adjacent met towers, and the results observed here are consistent with SecondWind’s empirical relationship, at least over the predominant wind speed range around 7 m/s.

18
Figure 14. Comparison of turbulence intensity at 70 m height
Figure 15. Comparison of turbulence intensity at 50 m height
5 Average Wind Speed Comparison with Stringent Filters Applied
For a more precise comparison of average wind speeds between the SODAR and the tower, more stringent filters need to be applied to extract the highest quality data from both the SODAR and the tower. It is desirable to use a combination of two cup anemometers for the tower speed to reduce bias and direction effects. However, due to the placement of the eastern 70 m anemometer in the tower shadow of the

19
prevailing northwesterly winds, its data were not judged to be of high enough quality, so we were forced to do the analysis with a single cup anemometer (70 m western).
Additional directional filtering also should be applied to the meteorological tower data to remove tower shadow and other flow distortion effects. Guidelines from Second Wind (Walls, 2009) suggested limiting the direction sectors to two 30° bands oriented 45° away from the booms: 210° to 240° and 300° to 330°.
The following filters were applied:
• SODAR data quality at least 95%
• SODAR vertical wind speed (absolute value) less than 1.0 m/s
• 70 m (50 m) meteorological tower wind speed at least 2.0 m/s
• SODAR wind direction at 70 m (50 m) is from 210° to 240° or 300° to 330°.
After all these filters were applied, 4473 records (26% of total) and 4596 records (27% of total) were used to compute the average wind speeds, and the correlation analyses are shown in Figures 16 and 17 for 70 m and 50 m, respectively. At 70 m, the average SODAR wind speed was 8.450 m/s and the average tower speed was 8.481 m/s, a SODAR-to-tower ratio of 0.996. At 50 m, the average SODAR wind speed was 8.126 m/s and the average tower speed was 8.198 m/s, a SODAR-to-tower ratio of 0.991. The linear fits were:
70m: WS(SODAR) = 0.986*WS(met) + 0.142 R2 = 0.965 (R 0.982) Npts = 4473
50m: WS(SODAR) = 0.974*WS(met) + 0.282 R2 = 0.965 (R 0.982) Npts = 4596

20
Figure 16. Comparison of highest quality wind speed data at 70 m with stringent filters applied

21
Figure 17. Comparison of highest quality wind speed data at 50 m with stringent filters applied
6 Analysis for Possible Causes of Wind Speed Bias
Although the Triton and tower measurements are in generally good agreement, there is a certain amount of bias to the wind speed data. To eliminate concerns over possible effects of other variables, HYDROCHINA investigated the dependence of wind speed bias on various factors. For this analysis, wind speed bias is defined as the Triton wind speed minus the met tower wind speed.
The following filters were applied:
• Triton Wind speed quality factor >= 90% • Triton Vertical wind speed (absolute magnitude) <= 1.5 m/s • Tower Wind speed >= 0.5 m/s • Triton and tower direction >= 270°
22
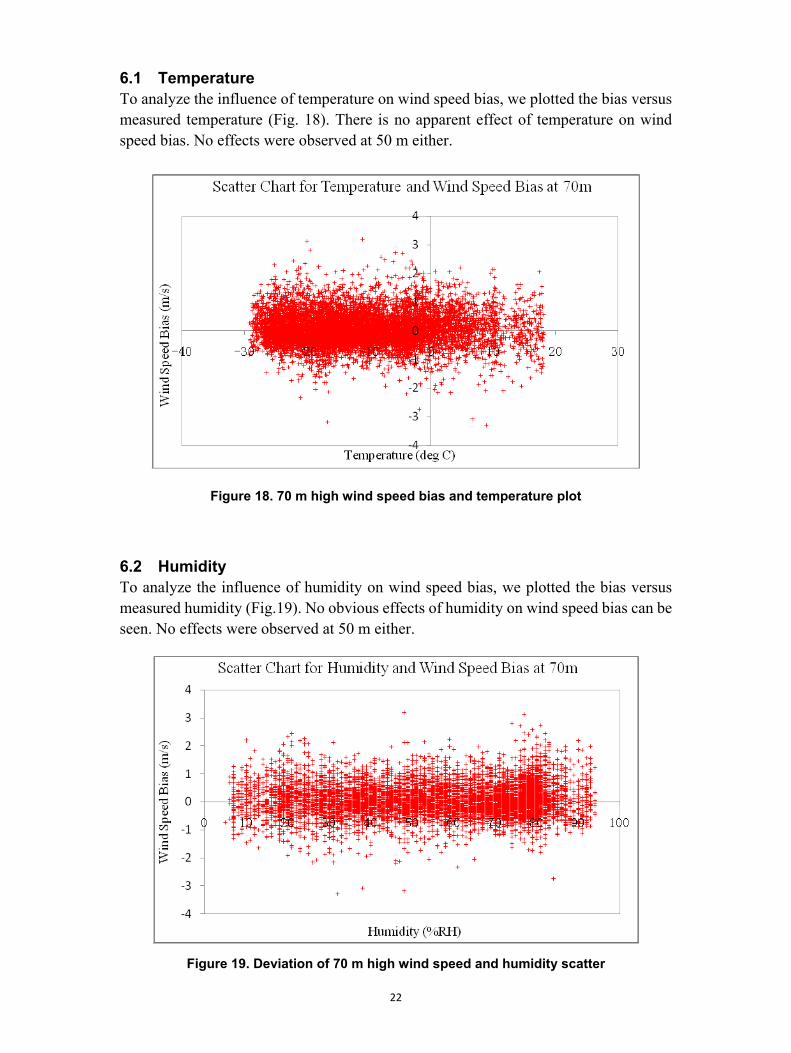
6.1 Temperature To analyze the influence of temperature on wind speed bias, we plotted the bias versus measured temperature (Fig. 18). There is no apparent effect of temperature on wind speed bias. No effects were observed at 50 m either.
Figure 18. 70 m high wind speed bias and temperature plot
6.2 Humidity To analyze the influence of humidity on wind speed bias, we plotted the bias versus measured humidity (Fig.19). No obvious effects of humidity on wind speed bias can be seen. No effects were observed at 50 m either.
Figure 19. Deviation of 70 m high wind speed and humidity scatter

23
6.3 Wind Direction To analyze the influence of wind direction on wind speed bias, we plotted the bias versus wind direction (Fig.20) over the northwest quadrant. No obvious effects of wind direction on wind speed bias can be seen.
Figure 20. 68 m high mast wind direction and speed deviation plot
7 Conclusions
We have completed an analysis of the wind resource data over a 120-day period based on ten-minute data samples. Data was collected at a 70 m meteorological tower and a Triton SODAR system from a measurement program conducted in China’s Hebei Province.

24
Our analysis of the wind speeds and directions measured by the Triton shows excellent agreement with the tower measurements, with correlation coefficients of 0.96 or better and slopes very near unity. Given the 80 m distance between the SODAR and the meteorological tower, it would be unreasonable to expect a perfect correlation between the two datasets. Based on our analysis of the data, we offer the following observations:
• The operational uptime was 98.4%, demonstrating the Triton’s operational reliability during this 120-day period.
• The percent of valid high quality data (Q >= 90%) measured by the Triton was 94.4% at 70 m and 83.8% at 100 m.
• The Triton’s measured wind speeds correlated well to the meteorological tower, and were generally within 1% to 2% of the tower value. The ratio of the average SODAR speed to the average tower speed was approximately 0.99 at 70 m and 0.985 at 50 m. The correlation coefficients were greater than 0.965 at both heights (50 m and 70 m).
• The Triton’s measured wind direction also correlated very well to the tower data when the sectors with bad or no data were removed. The correlation coefficients calculated between the Triton and the wind vane were 0.998 at both 50 m and 70 m.
• The wind direction distributions as measured by the Triton and the tower were consistent. A slight rotation of the directions is caused by the alignment of the tower to magnetic north while the Triton was aligned to true north.
• The site is characterized by very low wind shear during the daylight hours (0900 to 1700 local time), and both instruments capture this very well. Nighttime shears are considerably higher, and the Triton nighttime shears are about 23% higher than those measured on the tower. This appears to be caused by low SODAR wind speeds at 50 m (but not at 70 m) during the nighttime hours, but the reason for these low speeds has not been determined.
• Average turbulence intensity values from the SODAR and the met tower are in generally good agreement, with the SODAR measuring slightly lower average turbulence intensity (0.080) than the tower (0.088).
• An examination by HYDROCHINA of the SODAR and tower wind speed bias versus air temperature, humidity, and wind direction did not indicate any significant dependence of the bias on any of these quantities.
• Using data based on the most stringent data filtering (SODAR signal quality >= 95% and restricted wind directions), the average wind speed measured by the Triton and tower were very similar at both heights. The ratio of average

25
wind speeds between the Triton and the meteorological tower was 0.996 at 70 m and 0.991 at 50 m. However, using the stringent filtering did not provide a significant improvement over the results obtained using the basic data filtering. The stringent filtering resulted in a slight improvement in the ratio of average wind speeds, but a slight reduction in the correlation coefficient.
• The validation test and subsequent data analysis did not include an investigation into the effects of precipitation, or extreme weather events on Triton’s performance. Further work is recommended to determine whether, and by how much, the Triton’s performance is improved or degraded under such conditions.
The Triton showed a high data recovery rate in the test period and acceptable correlation with the mast data. It could be applied in wind resource assessment in conjunction with a measurement mast for a better understanding of wind characteristics, and can be used as a good reference for micrositing of wind turbines.
The purpose of this test was to validate the Triton’s reliability and data accuracy by correlating Triton data with that from a nearby tower, and that purpose has been satisfied. The four-month test period only enabled a partial analysis of performance during various seasonal climatic conditions. Should the wind farm developer wish to analyze Triton’s performance over various seasons, an extended system test and data analysis would be recommended.

26
8 References
International Electrotechnical Commission (2005). Wind Turbines – Part 12-1: Power Performance Measurements of Electricity Producing Wind Turbines. IEC Technical Report 61400-12-1. Geneva, Switzerland.
Scott, G.; Elliott, D.; Schwartz, M. (2010). Comparison of Second Wind Triton Data with Meteorological Tower Measurements. http://www.nrel.gov/docs/fy10osti/47429.pdf 18 pp.; NREL Report No. TP-550-47429.
Walls, Liz (2009), Guidelines for Triton Data Analysis and Comparison to Nearby Met Tower Measurements, Second Wind, Inc. http://www.secondwind.com/PDFdocs/CorrelationStudy092209.pdf

27
Appendix 1
Anemometer Calibration Sheets

CAL Reg.nr. 452
Accreditation to ISO 17025
Page 1 of 2
CERTIFICATE FOR CALIBRATION OF CUP ANEMOMETER Certificate number: 10.02.5373 Date of issue: September 8, 2010
Type: WindSensor P2546A Cup Anemometer Serial number: 9899
Manufacturer: WindSensor, Søkrogen 9, 4000 Roskilde, Denmark
Client: Second Wind Inc., 366 Summer Street, Somerville, MA 02144, USA
Anemometer received: September 3, 2010 Anemometer calibrated: September 4, 2010
Calibrated by: jj Calibration procedure: IEC 61400-12-1, MEASNET
Certificate prepared by: soh Approved by: Calibration engineer, soh
Calibration equation obtained: v [m/s] = 0.63363 · f [Hz] + 0.19039
Standard uncertainty, slope: 0.00078 Standard uncertainty, offset: 0.04379
Covariance: -0.0000038 (m/s)²/Hz Coefficient of correlation:
Absolute maximum deviation: 0.019 m/s at 11.242 m/s
Barometric pressure: 1025.2 hPa Relative humidity: 28.8%
Succession Velocity Temperature in Wind Frequency, Deviation, Uncertainty pressure, q. wind tunnel control room velocity, v. f. d. uc (k=2) [Pa] [°C] [°C] [m/s] [Hz] [m/s] [m/s]
2 9.99 30.0 23.1 4.128 6.2082 0.004 0.028 4 15.44 29.9 23.1 5.130 7.8094 -0.008 0.032 6 22.14 29.7 23.1 6.142 9.4002 -0.005 0.037 8 30.17 29.6 23.0 7.168 11.0315 -0.012 0.042 10 39.34 29.5 23.0 8.184 12.6039 0.007 0.048 12 50.14 29.5 23.0 9.238 14.2711 0.005 0.054
13-last 61.77 29.4 23.0 10.253 15.8665 0.009 0.060 11 74.24 29.5 23.0 11.242 17.4118 0.019 0.065 9 88.34 29.6 23.0 12.266 19.0611 -0.002 0.071 7 103.60 29.7 23.1 13.286 20.6699 -0.002 0.077 5 119.72 29.8 23.1 14.285 22.2737 -0.019 0.083 3 138.06 30.0 23.1 15.344 23.9026 0.009 0.089
1-first 156.81 30.3 23.2 16.361 25.5292 -0.005 0.095
Frequency, f. [Hz]32241680
Vel
ocity
, v [m
/s]
20
15
10
5
0
Frequency, f. [Hz]
32241680
Dev
iatio
n, d
. [m
/s] 0.1
0.0
-0.1
28

EQUIPMENT USED
Serial number Description - Boundary layer wind tunnel. 1256 Control cup anemometer. - Mounting tube, D = 25 mm t1 PT100 temperature sensor, wind tunnel. t2 PT100 temperature sensor, control room. 9904031 PPC500 Furness pressure manometer X4650038 HMW71U Humidity transmitter X4350042 PTB100AVaisala analogue barometer. P11 Pitot tube 001551 Computer Board. 16 bit A/D data acquisition board. - PC dedicated to data acquisition.
Traceable calibrations of the equipment are carried out by external accredited institutions: Furness (PPC500) and Saab Metech. A real-time analysis module within the data acquisition software detects pulse frequency.
Photo of a cup anemometer in the wind tunnel. The shown anemometer is of the same type as the calibrated one.
UNCERTAINTIES
The documented uncertainty is the total combined uncertainty at 95% confidence level (k=2) in accordance with EA-4/02. The uncertainty at 10 m/s comply with the requirements in the MEASNET procedure that prescribes an absolute uncertainty less than 0.1 m/s at a mean wind velocity of 10 m/s, that is 1%. See Document 97.00.004 “MEASNET - Test report on the calibration campaign” for further details.
Certificate number: 10.02.5373
This certificate must not be reproduced, except in full, without the approval of S. O. Hansen ApS Page 2 of 2 29

CAL Reg.nr. 452
Accreditation to ISO 17025
Page 1 of 2
CERTIFICATE FOR CALIBRATION OF CUP ANEMOMETER Certificate number: 10.02.5370 Date of issue: September 8, 2010
Type: WindSensor P2546A Cup Anemometer Serial number: 9898
Manufacturer: WindSensor, Søkrogen 9, 4000 Roskilde, Denmark
Client: Second Wind Inc., 366 Summer Street, Somerville, MA 02144, USA
Anemometer received: September 3, 2010 Anemometer calibrated: September 4, 2010
Calibrated by: mfh Calibration procedure: IEC 61400-12-1, MEASNET
Certificate prepared by: soh Approved by: Calibration engineer, soh
Calibration equation obtained: v [m/s] = 0.63253 · f [Hz] + 0.20004
Standard uncertainty, slope: 0.00080 Standard uncertainty, offset: 0.04275
Covariance: -0.0000040 (m/s)²/Hz Coefficient of correlation:
Absolute maximum deviation: 0.020 m/s at 11.247 m/s
Barometric pressure: 1024.7 hPa Relative humidity: 29.0%
Succession Velocity Temperature in Wind Frequency, Deviation, Uncertainty pressure, q. wind tunnel control room velocity, v. f. d. uc (k=2) [Pa] [°C] [°C] [m/s] [Hz] [m/s] [m/s]
2 9.97 29.5 23.2 4.120 6.2030 -0.003 0.028 4 15.51 29.3 23.2 5.138 7.8282 -0.013 0.032 6 22.18 29.2 23.2 6.143 9.4057 -0.007 0.037 8 30.14 29.1 23.2 7.160 10.9919 0.007 0.042 10 39.40 29.0 23.1 8.184 12.6228 0.000 0.048 12 50.07 29.0 23.1 9.226 14.2666 0.002 0.054
13-last 61.56 28.9 23.1 10.229 15.8264 0.018 0.060 11 74.40 29.0 23.1 11.247 17.4332 0.020 0.065 9 88.39 29.1 23.2 12.261 19.0624 0.003 0.071 7 103.54 29.2 23.2 13.273 20.6772 -0.006 0.077 5 120.14 29.3 23.2 14.300 22.3024 -0.007 0.083 3 137.97 29.5 23.2 15.328 23.9403 -0.015 0.089
1-first 156.92 29.8 23.2 16.356 25.5397 0.001 0.095
Frequency, f. [Hz]32241680
Vel
ocity
, v [m
/s]
20
15
10
5
0
Frequency, f. [Hz]
32241680
Dev
iatio
n, d
. [m
/s] 0.1
0.0
-0.1
30

EQUIPMENT USED
Serial number Description - Boundary layer wind tunnel. 1256 Control cup anemometer. - Mounting tube, D = 25 mm t1 PT100 temperature sensor, wind tunnel. t2 PT100 temperature sensor, control room. 9904031 PPC500 Furness pressure manometer X4650038 HMW71U Humidity transmitter X4350042 PTB100AVaisala analogue barometer. P11 Pitot tube 001551 Computer Board. 16 bit A/D data acquisition board. - PC dedicated to data acquisition.
Traceable calibrations of the equipment are carried out by external accredited institutions: Furness (PPC500) and Saab Metech. A real-time analysis module within the data acquisition software detects pulse frequency.
Photo of a cup anemometer in the wind tunnel. The shown anemometer is of the same type as the calibrated one.
UNCERTAINTIES
The documented uncertainty is the total combined uncertainty at 95% confidence level (k=2) in accordance with EA-4/02. The uncertainty at 10 m/s comply with the requirements in the MEASNET procedure that prescribes an absolute uncertainty less than 0.1 m/s at a mean wind velocity of 10 m/s, that is 1%. See Document 97.00.004 “MEASNET - Test report on the calibration campaign” for further details.
Certificate number: 10.02.5370
This certificate must not be reproduced, except in full, without the approval of S. O. Hansen ApS Page 2 of 2 31

CAL Reg.nr. 452
Accreditation to ISO 17025
Page 1 of 2
CERTIFICATE FOR CALIBRATION OF CUP ANEMOMETER Certificate number: 10.02.5371 Date of issue: September 8, 2010
Type: WindSensor P2546A Cup Anemometer Serial number: 9897
Manufacturer: WindSensor, Søkrogen 9, 4000 Roskilde, Denmark
Client: Second Wind Inc., 366 Summer Street, Somerville, MA 02144, USA
Anemometer received: September 3, 2010 Anemometer calibrated: September 4, 2010
Calibrated by: mfh Calibration procedure: IEC 61400-12-1, MEASNET
Certificate prepared by: soh Approved by: Calibration engineer, soh
Calibration equation obtained: v [m/s] = 0.62927 · f [Hz] + 0.22882
Standard uncertainty, slope: 0.00076 Standard uncertainty, offset: 0.03561
Covariance: -0.0000036 (m/s)²/Hz Coefficient of correlation:
Absolute maximum deviation: 0.015 m/s at 10.264 m/s
Barometric pressure: 1024.8 hPa Relative humidity: 28.9%
Succession Velocity Temperature in Wind Frequency, Deviation, Uncertainty pressure, q. wind tunnel control room velocity, v. f. d. uc (k=2) [Pa] [°C] [°C] [m/s] [Hz] [m/s] [m/s]
2 9.95 29.7 23.2 4.118 6.1922 -0.007 0.028 4 15.53 29.5 23.2 5.143 7.8258 -0.010 0.032 6 22.15 29.4 23.2 6.141 9.3977 -0.001 0.037 8 30.31 29.3 23.2 7.182 11.0620 -0.007 0.043 10 39.49 29.2 23.1 8.196 12.6557 0.004 0.048 12 50.16 29.1 23.1 9.237 14.2952 0.012 0.054
13-last 61.95 29.1 23.1 10.264 15.9227 0.015 0.060 11 74.62 29.2 23.1 11.266 17.5205 0.012 0.066 9 88.01 29.3 23.2 12.238 19.0657 0.012 0.071 7 103.37 29.4 23.2 13.265 20.7182 -0.001 0.077 5 119.66 29.5 23.2 14.276 22.3389 -0.010 0.083 3 137.82 29.7 23.2 15.324 24.0097 -0.013 0.089
1-first 156.85 30.0 23.2 16.357 25.6378 -0.005 0.095
Frequency, f. [Hz]32241680
Vel
ocity
, v [m
/s]
20
15
10
5
0
Frequency, f. [Hz]
32241680
Dev
iatio
n, d
. [m
/s] 0.1
0.0
-0.1
32

EQUIPMENT USED
Serial number Description - Boundary layer wind tunnel. 1256 Control cup anemometer. - Mounting tube, D = 25 mm t1 PT100 temperature sensor, wind tunnel. t2 PT100 temperature sensor, control room. 9904031 PPC500 Furness pressure manometer X4650038 HMW71U Humidity transmitter X4350042 PTB100AVaisala analogue barometer. P11 Pitot tube 001551 Computer Board. 16 bit A/D data acquisition board. - PC dedicated to data acquisition.
Traceable calibrations of the equipment are carried out by external accredited institutions: Furness (PPC500) and Saab Metech. A real-time analysis module within the data acquisition software detects pulse frequency.
Photo of a cup anemometer in the wind tunnel. The shown anemometer is of the same type as the calibrated one.
UNCERTAINTIES
The documented uncertainty is the total combined uncertainty at 95% confidence level (k=2) in accordance with EA-4/02. The uncertainty at 10 m/s comply with the requirements in the MEASNET procedure that prescribes an absolute uncertainty less than 0.1 m/s at a mean wind velocity of 10 m/s, that is 1%. See Document 97.00.004 “MEASNET - Test report on the calibration campaign” for further details.
Certificate number: 10.02.5371
This certificate must not be reproduced, except in full, without the approval of S. O. Hansen ApS Page 2 of 2
33

34
Appendix 2
Comparison of Wind Speed Distributions – Triton vs. Meteorological Tower
Table 2-1 Deviation between Triton and MetTwr in each bin
Wind
speed
bin (m/s)
Frequency (pct) at 50 m Frequency (pct) at 70 m
Triton MetTwr Triton minus
MetTwr Triton MetTwr
Triton minus MetTwr
[0-0.5) 0.01 0.01 0.00 0 0 0.00 [0.5-1) 0.03 0.01 0.02 0.08 0.05 0.03 [1-1.5) 0.26 0.19 0.07 0.13 0.12 0.01 [1.5-2) 0.45 0.41 0.04 0.39 0.42 -0.03 [2-2.5) 1.22 1.09 0.14 0.57 0.56 0.01 [2.5-3) 1.83 1.60 0.22 1.13 1.06 0.07 [3-3.5) 2.49 2.24 0.24 1.91 1.82 0.09 [3.5-4) 2.77 2.67 0.10 2.24 2.36 -0.12 [4-4.5) 3.51 3.58 -0.07 2.87 2.89 -0.02 [4.5-5) 4.23 3.30 0.93 3.28 2.80 0.48 [5-5.5) 3.74 3.83 -0.09 3.46 3.13 0.33 [5.5-6) 4.21 4.40 -0.18 4.08 3.88 0.20 [6-6.5) 4.99 4.55 0.44 3.99 4.26 -0.27 [6.5-7) 5.00 5.28 -0.28 4.86 4.61 0.25 [7-7.5) 5.98 5.64 0.34 5.16 5.68 -0.52 [7.5-8) 5.88 6.00 -0.12 5.70 5.42 0.28 [8-8.5) 6.16 6.17 -0.01 6.45 5.85 0.60 [8.5-9) 5.85 5.91 -0.06 6.03 6.30 -0.27 [9-9.5) 5.96 6.38 -0.42 6.44 6.22 0.22 [9.5-10) 5.53 5.82 -0.28 6.16 6.63 -0.46 [10-10.5) 4.99 4.90 0.09 5.84 5.88 -0.04 [10.5-11) 4.36 4.89 -0.53 5.43 5.44 -0.01 [11-11.5) 4.37 4.33 0.04 4.48 4.69 -0.21 [11.5-12) 3.45 3.85 -0.41 4.17 4.31 -0.14 [12-12.5) 3.08 3.02 0.06 3.84 3.80 0.04 [12.5-13) 2.33 2.50 -0.17 3.15 3.45 -0.30 [13-13.5) 2.12 1.73 0.39 2.47 2.38 0.09 [13.5-14) 1.34 1.44 -0.10 1.66 1.75 -0.09 [14-14.5) 1.15 1.03 0.12 1.44 1.14 0.30 [14.5-15) 0.72 0.79 -0.07 0.81 1.01 -0.20 [15-15.5) 0.57 0.69 -0.12 0.66 0.68 -0.02 [15.5-16) 0.42 0.42 0.00 0.41 0.47 -0.06 [16-16.5) 0.26 0.41 -0.15 0.33 0.34 -0.01 [16.5-17) 0.19 0.18 0.01 0.12 0.24 -0.12

35
[17-17.5) 0.17 0.21 -0.05 0.08 0.09 -0.01 [17.5-18) 0.14 0.19 -0.06 0.07 0.10 -0.03 [18-18.5) 0.09 0.08 0.01 0.06 0.06 0.00 [18.5-19) 0.05 0.09 -0.04 0.01 0.05 -0.04 [19-19.5) 0.05 0.07 -0.02 0.01 0.02 -0.01 [19.5-20) 0.04 0.07 -0.03 0.00 0.01 -0.01 [20-20.5) 0.03 0.02 0.01 0.00 0.01 -0.01 [20.5-21) 0.00 0.00 0.00 0.00 0.00 0.00 [21-21.5) 0.00 0.02 -0.02 0.01 0.00 0.01 [21.5-22) 0.00 0.01 -0.01 0.00 0.00 0.00 ≥ 22 0.00 0.00 0.00 0.00 0.01 -0.01