meten van wind met meetmasten, sodar en lidar t.b.v ...o triton (second wind) o aq500 (aqsystems)...
TRANSCRIPT
www.ecn.nl
Meten van wind met meetmasten, Sodar
en Lidar t.b.v. windparkoptimalisatie en
wind resource assessments
Peter Eecen
Programme Development Manager Wind Energy
KNMI Wind-op-zeedag, De Bilt 2014-11-28
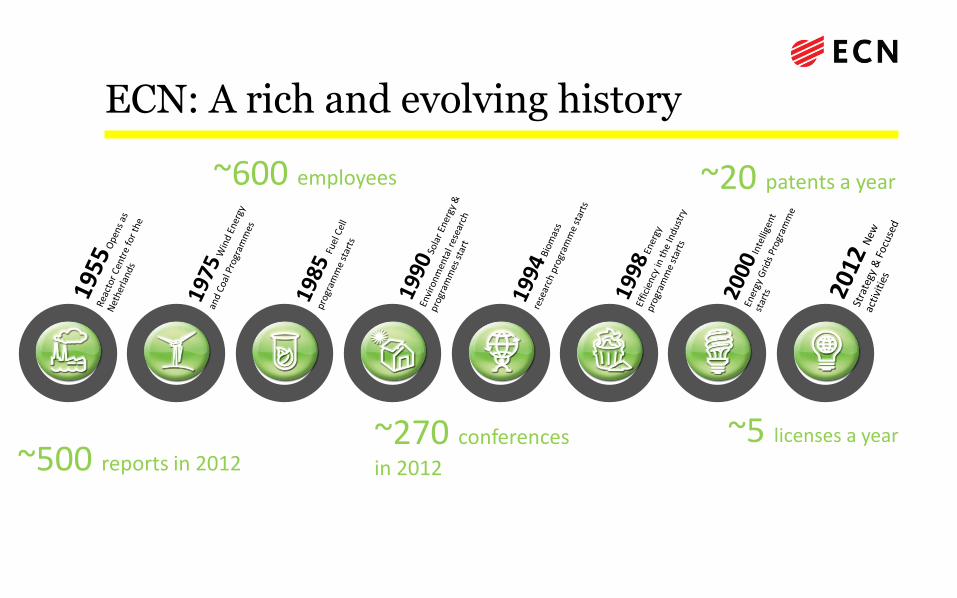
ECN: A rich and evolving history
~600 employees
~500 reports in 2012 ~270 conferences
in 2012
~20 patents a year
~5 licenses a year

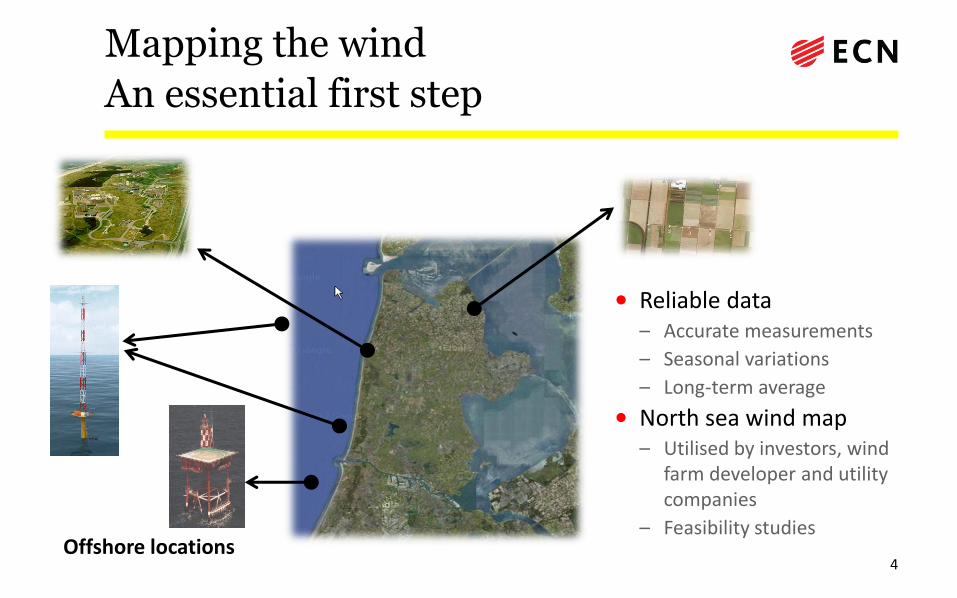
Mapping the wind
An essential first step
• Reliable data – Accurate measurements
– Seasonal variations
– Long-term average
• North sea wind map – Utilised by investors, wind
farm developer and utility companies
– Feasibility studies
4 Offshore locations

ECN offshore wind atlas
• Based on Hirlam + available measurements
• Delivered 2003
• Indication of offshore wind speeds (yearly average) at 90m height.
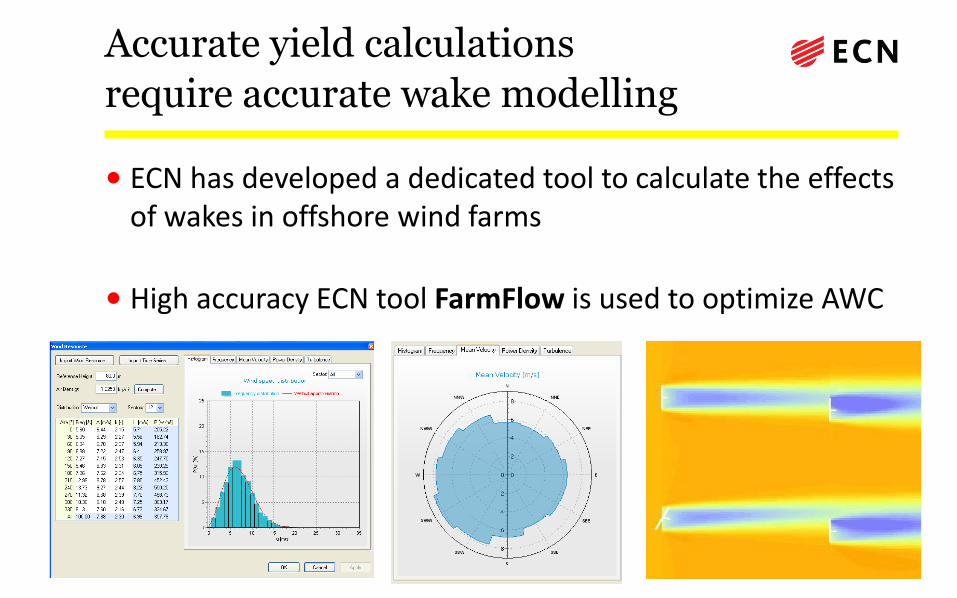
Accurate yield calculations
require accurate wake modelling
• ECN has developed a dedicated tool to calculate the effects of wakes in offshore wind farms
• High accuracy ECN tool FarmFlow is used to optimize AWC

Add benchmark

Wind measurements
Knowing the wind
Mast wind speed and direction*
Nacelle wind speed and direction* Nacelle position
Indicative wake position
*Measurement data from ECN Test-site
Wieringermeer – The Netherlands
How can remote sensing best be used
in wind power development

LAWINE: Lidar Application for
WINd farm Efficiency
Technology and services are developed to use LIDAR systems in offshore wind power plants to significantly reduce the cost of energy Partners: ECN, XEMC Darwind, Avent Lidar, Delft University of Technology Collaboration: Windscanner partners
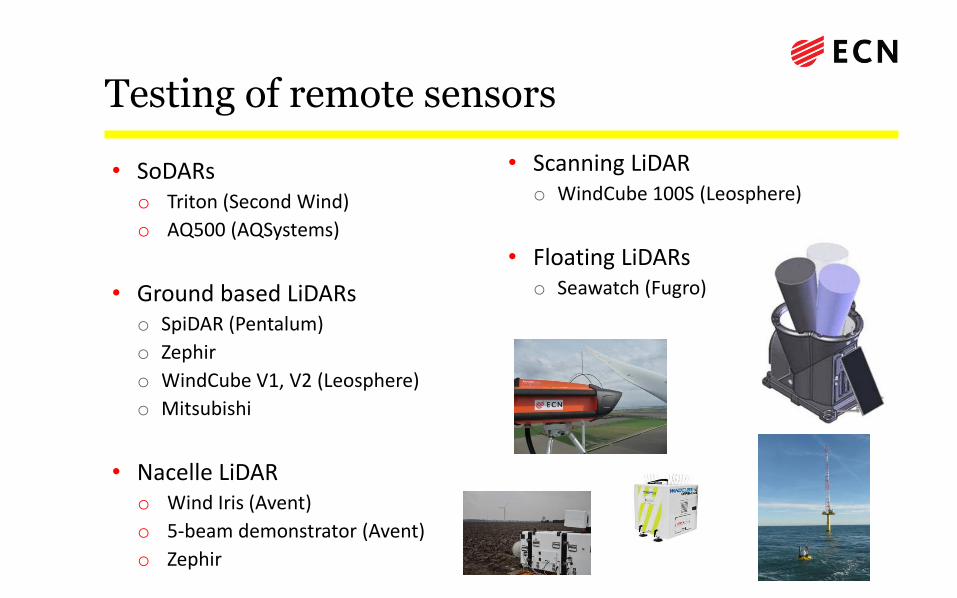
Testing of remote sensors
• SoDARs o Triton (Second Wind)
o AQ500 (AQSystems)
• Ground based LiDARs o SpiDAR (Pentalum)
o Zephir
o WindCube V1, V2 (Leosphere)
o Mitsubishi
• Nacelle LiDAR o Wind Iris (Avent)
o 5-beam demonstrator (Avent)
o Zephir
• Scanning LiDAR o WindCube 100S (Leosphere)
• Floating LiDARs o Seawatch (Fugro)
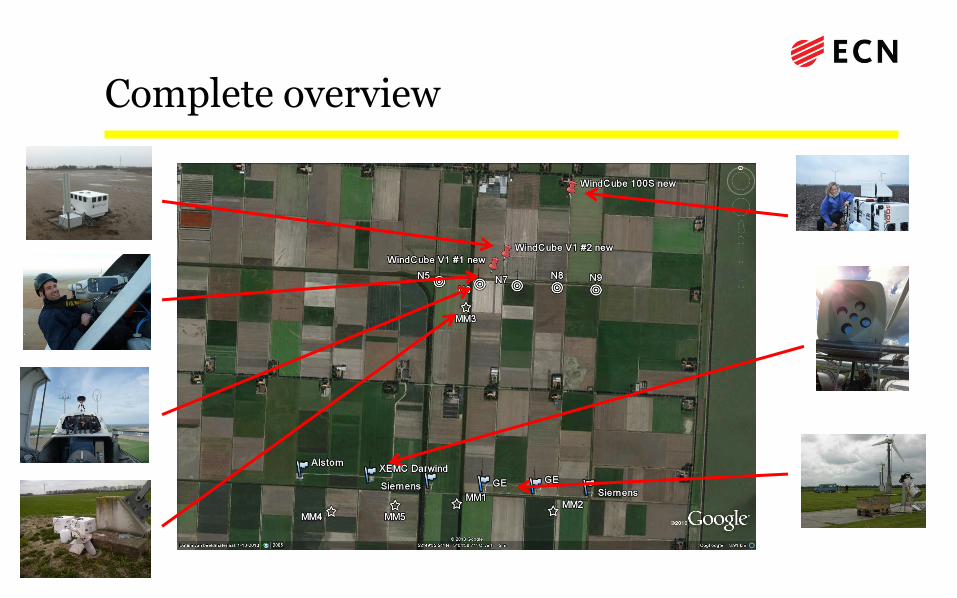
Complete overview

Results: Ground based LiDAR
• Ground based LiDAR Excellent agreement between mast and gb LiDAR
Bin averages: a = 1.0054, R2 = 0.99985
Scatter: a = 1.0148, R2 = 0.99377
Remote sensing calibration
CDV IEC 61400-12-1
NORSEWiND criterium
• Scanning LiDAR First wakes captured by scanning LiDAR
Wakes of research turbines
Valerie Kumer UBergen

Results: ground based LiDAR TI
Turbulence intensity comparison
• Cup vs LiDAR @80m Cup TI lower
At higher wind speeds comparison better
• Sonic vs LiDARs @108m LiDARs agree
Sonic TI bit lower
• Reasons Upspeeding cup?
Volume averaging LiDAR?

Results: Rotor equivalent ws (REWS)
• Wind speed Hub height: 80m
REWS: 52m, 60m, 80m, 100m & 108m
• Power curve REWS ~0.05m/s lower
REWS Power curve little bit higher
• AEP@8m/s HH: 7222 MWh
REW: 7283 MWh
Difference: 0.8%
00
500
1,000
1,500
2,000
2,500
3,000
00 05 10 15 20 25P
ow
er
[kW
]
Wind speed [m/s]
Power curve
HH
REWS
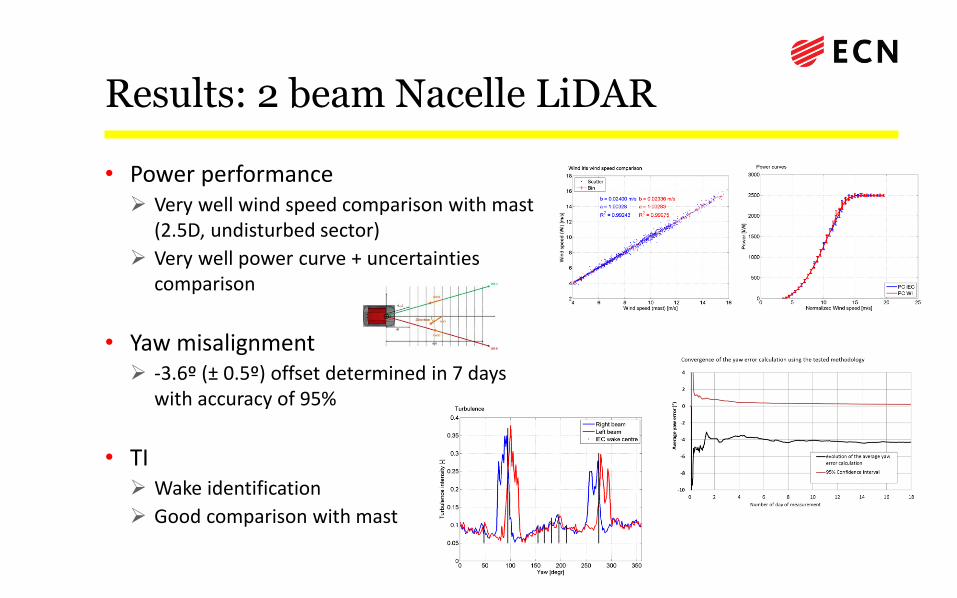
Results: 2 beam Nacelle LiDAR
• Power performance Very well wind speed comparison with mast
(2.5D, undisturbed sector)
Very well power curve + uncertainties comparison
• Yaw misalignment -3.6º (± 0.5º) offset determined in 7 days
with accuracy of 95%
• TI Wake identification
Good comparison with mast

Results: 5 beam nacelle LiDAR
• Availability 99.67%
• Wind speed comparison 2 beam configuration (LOS2 & LOS4)
LiDAR@185m vs MM@383m
a = 0.9998, R2 = 0.9961
• Wind shear 2 beam configuration (LOS0 & LOS3)
LiDAR@185m vs MM@383m
www.ecn.nl
Meteorological Measurements @ North Sea
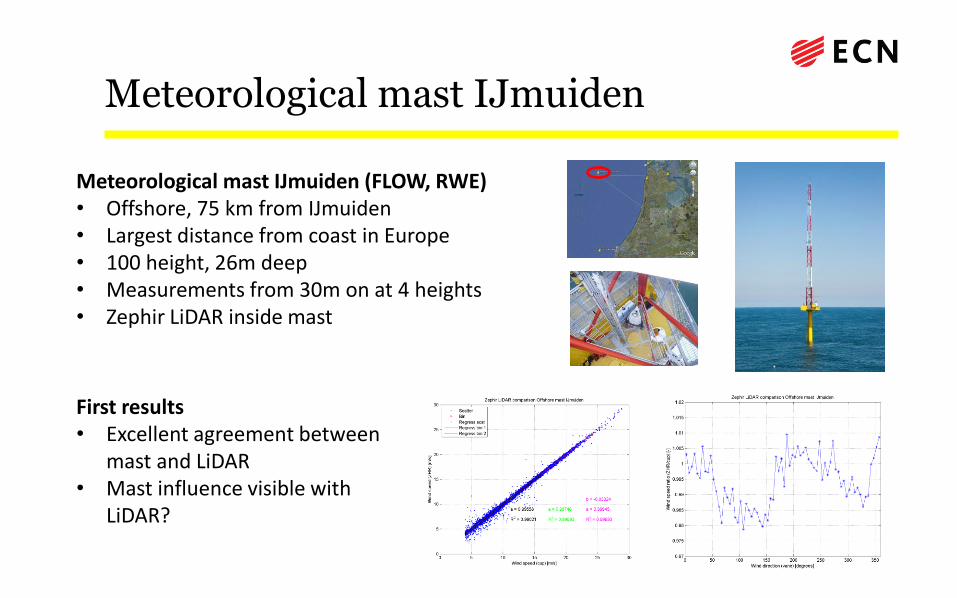
Meteorological mast IJmuiden
Meteorological mast IJmuiden (FLOW, RWE) • Offshore, 75 km from IJmuiden • Largest distance from coast in Europe • 100 height, 26m deep • Measurements from 30m on at 4 heights • Zephir LiDAR inside mast
First results • Excellent agreement between
mast and LiDAR • Mast influence visible with
LiDAR?

Lichteiland Goeree Measurement Station

Planned Europlatform Measurement Station
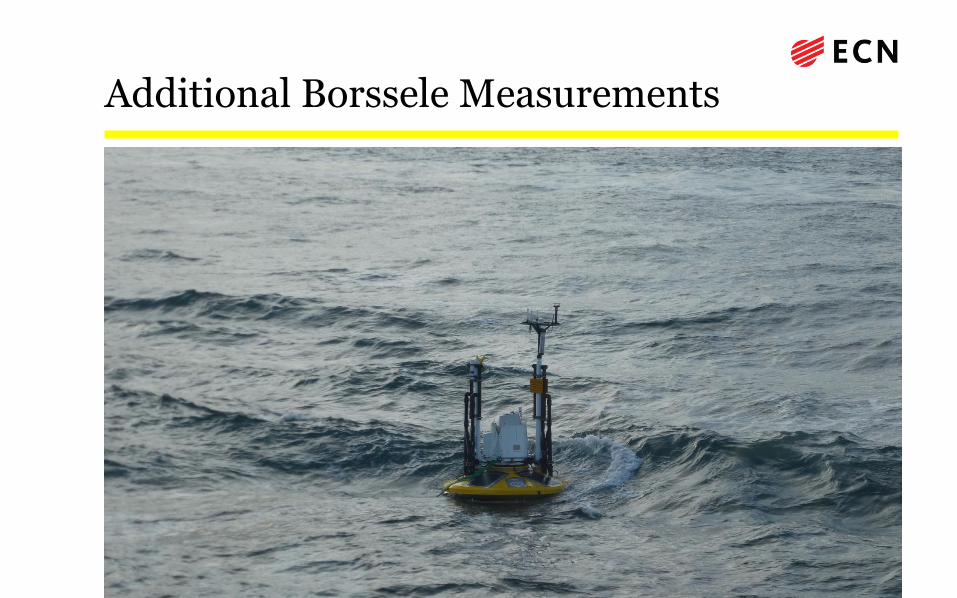
Additional Borssele Measurements
Dank voor uw aandacht
Peter Eecen
Programme Development Manager Wind Energy
ECN
Westerduinweg 3 P.O. Box 1
1755 LE Petten 1755 ZG Petten
The Netherlands The Netherlands
T +31 88 515 82 79 [email protected]
M +31 6 205 43133 www.ecn.nl