comparison of hplc-uv, gc-fid, and gc-ms...
TRANSCRIPT

COMPARISON OF HPLC-UV, GC-FID, AND GC-MS
FOR THE ANALYSIS OF COCAINE AND
BENZOYLECGONINE FROM
VITREOUS HUMOR AND
BRAIN TISSUE
By
ADREA TILLER
Bachelor of Science
Lenoir-Rhyne College
Hickory, NC
2003
Submitted to the Faculty of the Graduate College of the
Oklahoma State University in partial fulfillment of the requirements for
the Degree of MASTER OF SCIENCE
July, 2006
ii
COMPARISON OF HPLC-UV, GC-FID, AND GC-MS
FOR THE ANALYSIS OF COCAINE AND
BENZOYLECGONINE FROM
VITREOUS HUMOR AND
BRAIN TISSUE
Thesis approved:
_______Dr. David Wallace______ Advisor
_______Dr. Robert Allen________
Committee Member
_______Dr. Tom Glass__________ Committee Member
_______Dr. Gordon Emslie_______
Dean of the Graduate College
iii
ACKNOWLEDGEMENTS I would like to thank Oklahoma State University for giving me this opportunity to learn
and enrich my research experience. I am also very thankful for the guidance and help
from my advisor, Dr. David Wallace. My committee members, Dr. Robert Allen and Dr.
Tom Glass, have also made this experience great with their help and wisdom. I would
also like to thank Mr. Mark Boese and the Tulsa Police Department Crime Lab for use of
their equipment and their knowledge they shared with me. Thanks to my family and
friends for all their continued support, love, and understanding throughout my graduate
school experience. Special thanks to my wonderful boyfriend, Craig, for his continued
love, support, and strength he has given me.
iv
TABLE OF CONTENTS Chapter Page I. Introduction ........................................................................................................1
A. Cocaine.....................................................................................................3 B. Metabolites...............................................................................................6 C. Systemic and Local Effects.......................................................................7 D. Nervous System Effects ............................................................................9 E. Dopaminergic System ...............................................................................11 F. Mechanisms of Cocaine Toxicity..............................................................13
G. Redistribution...........................................................................................15 H. Brain and Vitreous Studies ......................................................................17 I. Use of Blood/Plasma for Analysis .............................................................18 J. Summary and Significance of Study ..........................................................18
II. Materials and Methods .........................................................................................21 A. Chemicals and Drugs ................................................................................21 B. Animal Model ............................................................................................21 C. In vivo Analysis .........................................................................................21 D. Solid Phase Extraction..............................................................................22 1. HPLC ...................................................................................................22 2. GC-FID ................................................................................................23 3. GC-MS .................................................................................................23 E. Chromatography .......................................................................................24 1. HPLC ...................................................................................................24 2. GC-FID ................................................................................................24 3. GC-MS .................................................................................................25 F. Statistical Analysis ....................................................................................25 III. Results.................................................................................................................27 A. Preliminary Studies ..................................................................................27 1. HPLC Validation .................................................................................27 2. Assay Validation ..................................................................................27 3. Narc - 2 vs. Hexane Extractions .........................................................31 4. Narc -2 Column Variability and Time Course Variability ..................31 B. Chromatography......................................................................................33 1. HPLC ...................................................................................................33
v
2. GC-FID ..............................................................................................37 3. GC-MS ...............................................................................................41 IV. Discussion...........................................................................................................48 A. HPLC Validation ......................................................................................48 B. Assay Validation .......................................................................................49 C. Narc-2 and Bond Elut Extractions vs. Hexane Extractions ....................50 D. Narc-2 Column Variability and Time Course Variability .......................51 E. Chromatography ......................................................................................52 1. HPLC ...................................................................................................53 2. GC-FID ................................................................................................54 3. GC-MS .................................................................................................55 F. Future Directions .....................................................................................59 Bibliography ..............................................................................................................60
vi
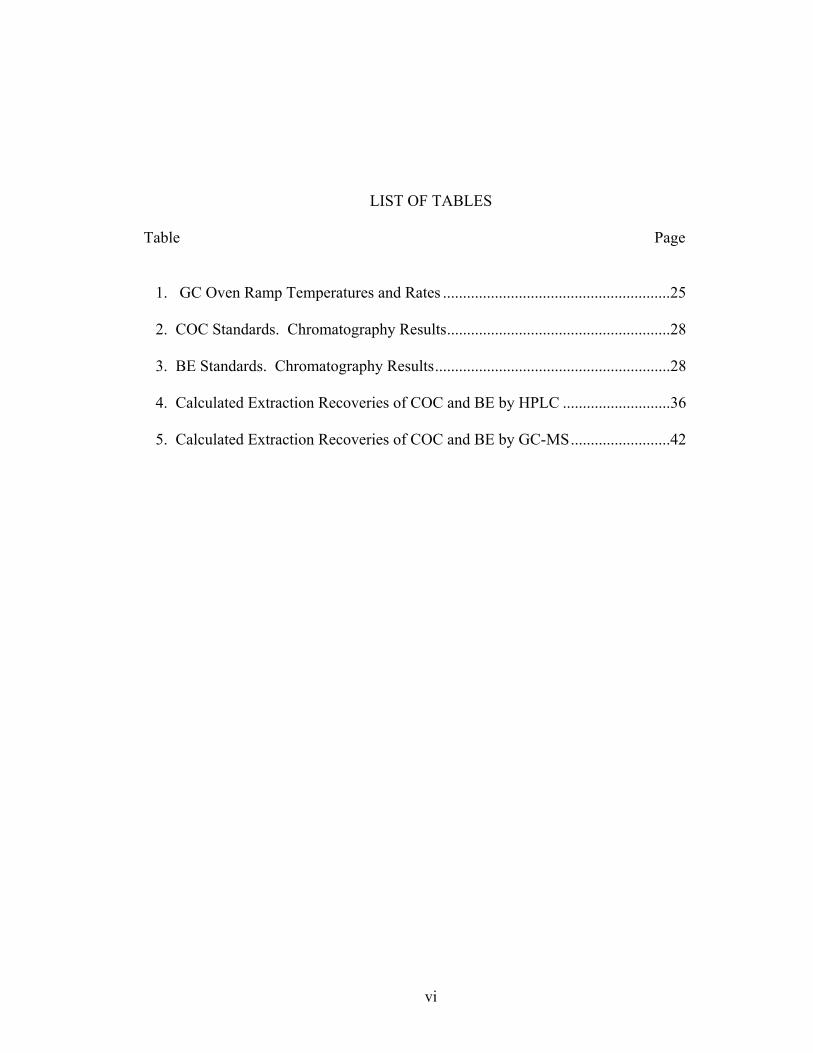
LIST OF TABLES Table Page
1. GC Oven Ramp Temperatures and Rates .........................................................25 2. COC Standards. Chromatography Results........................................................28 3. BE Standards. Chromatography Results...........................................................28 4. Calculated Extraction Recoveries of COC and BE by HPLC ...........................36 5. Calculated Extraction Recoveries of COC and BE by GC-MS.........................42

vii
LIST OF FIGURES
Figure Page 1. Structure of COC ...............................................................................................4 2. COC Metabolism Products ................................................................................6
3. Standards Analysis............................................................................................28 A. COC Concentration vs. Height .............................................................28 B. BE Concentration vs. Height................................................................28
4. HPLC Chromatograph – COC Standard, 1500ng/ml ........................................29 5. HPLC Chromatograph – BE Standard, 1500ng/ml............................................30 6. Narc-2 Column Variability ................................................................................32 7. Degradation of COC Post-Extraction ................................................................32 8. HPLC Chromatograph of VH Extraction ..........................................................34 9. HPLC Chromatograph of Brain Extraction .......................................................35 10. Analysis of Recovery of COC and BE from VH and Brain Tissue on HPLC...36 11. GC-FID Chromatograph – COC Standard, 40ug/ml .........................................38 12. GC-FID Chromatograph – Bupivacaine Standard, 100ug/ml............................39 13. GC-FID Chromatograph of VH Extraction .......................................................40 14. GC-FID Chromatograph of Brain Extraction ....................................................41 15. Analysis of Recovery of COC and BE from VH and Brain Tissue on GC-MS 42 16. GC-MS Chromatograph of VH Extraction – COC and COC Ions....................43 17. GC-MS Chromatograph of VH Extraction – BE and BE Ions ..........................44 18. GC-MS Chromatograph of Brain Extraction – COC and COC Ions.................45

viii
19. GC-MS Chromatograph of Brain Extraction – BE and BE Ions .......................46
ix
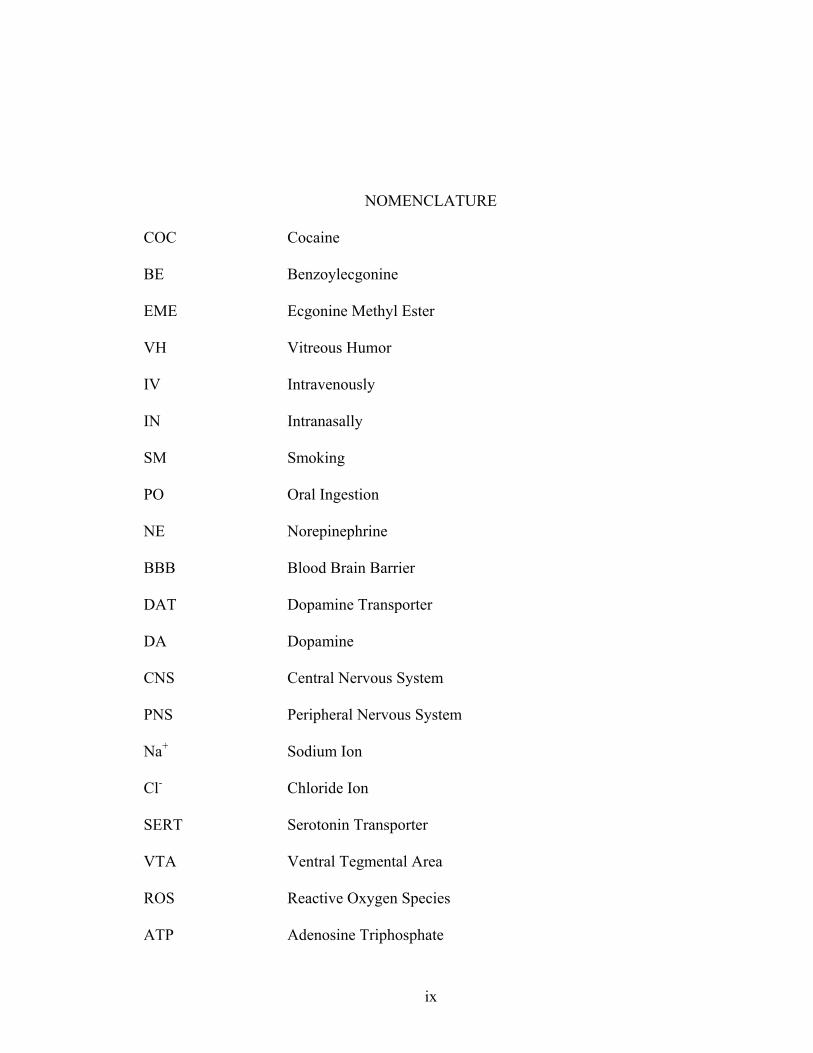
NOMENCLATURE COC Cocaine BE Benzoylecgonine EME Ecgonine Methyl Ester VH Vitreous Humor IV Intravenously IN Intranasally SM Smoking PO Oral Ingestion NE Norepinephrine BBB Blood Brain Barrier DAT Dopamine Transporter DA Dopamine CNS Central Nervous System PNS Peripheral Nervous System Na+ Sodium Ion Cl- Chloride Ion SERT Serotonin Transporter VTA Ventral Tegmental Area ROS Reactive Oxygen Species ATP Adenosine Triphosphate
x
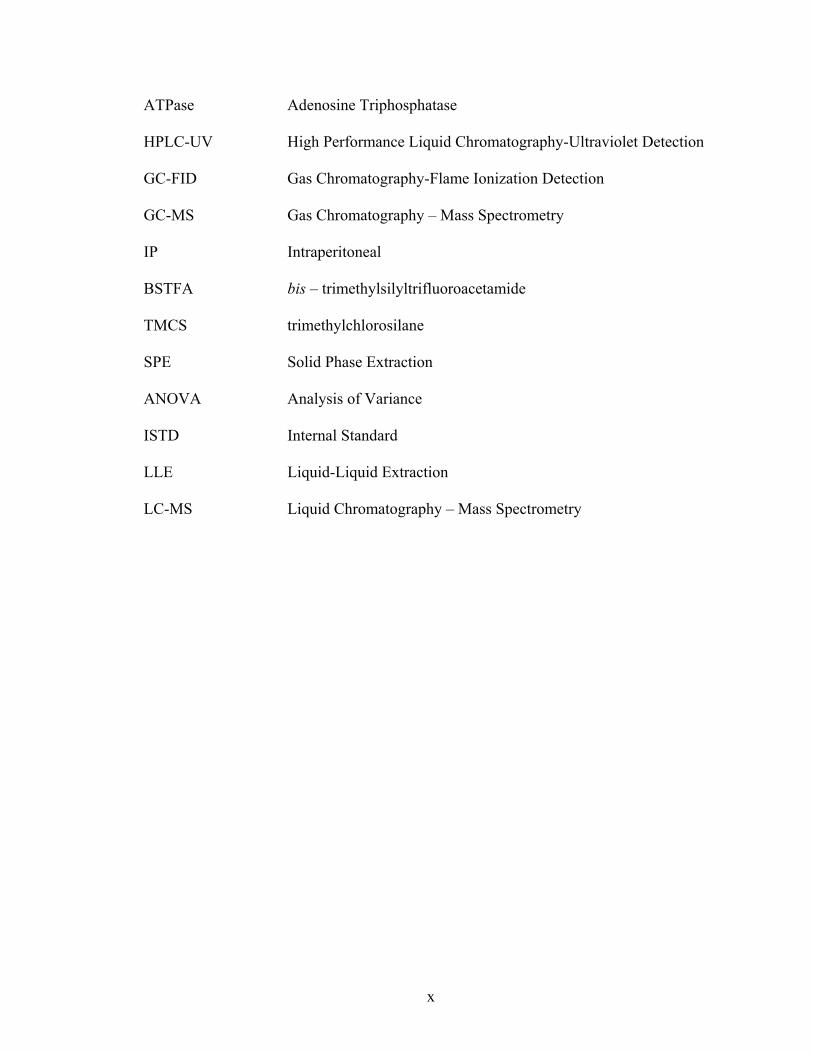
ATPase Adenosine Triphosphatase HPLC-UV High Performance Liquid Chromatography-Ultraviolet Detection GC-FID Gas Chromatography-Flame Ionization Detection GC-MS Gas Chromatography – Mass Spectrometry IP Intraperitoneal BSTFA bis – trimethylsilyltrifluoroacetamide TMCS trimethylchlorosilane SPE Solid Phase Extraction ANOVA Analysis of Variance ISTD Internal Standard LLE Liquid-Liquid Extraction LC-MS Liquid Chromatography – Mass Spectrometry
1
I. Introduction
As opposed to analyzing clinically derived specimens, the nature of the
postmortem environment has led to difficulty in interpreting the significance of drug
levels observed due to drug instability after death (Drummer, 2004). There is little
known about predicting antemortem drug levels in the body from the postmortem drug
levels. Factors like redistribution, postmortem environment in the body, such as
temperature and pH, have hindered the development of a rate at which antemortem drug
levels can be extrapolated from the postmortem levels (Hearn et al., 1991). Also,
artifacts from poor body condition and poor sampling can limit the interpretation of the
drug analysis (Drummer, 2004). Each drug or toxin introduced into the body has
different types or mechanisms for breakdown and redistribution (Hearn et al., 1991). It is
important to know the stability of the drug being analyzed in a postmortem setting since
the biological matrices being used may have been exposed to the environment for a long
period of time (Drummer, 2004). Assumptions about the relationship between the
concentrations of substances found postmortem in autopsy specimens to the
concentration that existed at or near the time of death are made by toxicologists or
pathologists (Hearn et al., 1991). These assumptions could lead to an inaccurate
determination of antemortem drug levels. Inaccurate results could then lead to a
wrongful interpretation of the cause and mechanism of death.
Cocaine (COC) continues to breakdown and undergo hydrolysis postmortem.
COC, in ante- and postmortem samples, undergoes degradation and metabolism by
2
esterases in plasma and the liver to benzoylecgonine (BE) and ecgonine methyl ester
(EME). COC can also be stored in tissue antemortem and subsequently released by
redistributive processes postmortem (Mackey-Bojack et al., 2000). Several tissues allow
for the release of drugs following death such as, the gastrointestinal tract, lungs, liver, and
myocardium. Later, processes like cell autolysis and putrefaction all contribute to
redistribution (Pelissier-Alicot et al., 2003). The continuous degradation of COC
postmortem and the redistribution of COC from stored tissue to blood makes it difficult
to estimate antemortem COC levels (Mackey-Bojack et al., 2000).
In performing toxicological analysis and screening for an unknown compound in
the living person, the most common specimens for drug analyses are blood and urine.
The detection of the unknown compound or drug in postmortem specimens can pose
some difficulty because of redistributive processes and altered specimens, which may
limit the capabilities of screening processes (Drummer and Gerostamoulos, 2002). But,
in a postmortem setting several specimens, such as liver, muscle, fat, bone, brain,
vitreous humor (VH), bile, hair, and nails can be used for analysis for special
circumstances (Drummer, 2004). Blood, plasma, or serum can be used for screening
processes when looking for a target analyte, but urine is still the sample of choice for any
non-target screen of unknown drugs (Maurer, 2005b). Urine is the sample of choice
because the concentrations of drugs are higher in urine in comparison to blood or saliva.
Blood continues to be used for analysis since the unchanged drug is present and
detectable in the homogenous matrix (Moeller and Kraemer, 2002).
Given the widespread use and availability of COC, it is remarkable that a
relationship between the postmortem COC blood levels and toxicity of antemortem levels

3
has not yet been established (Karch et al., 1998). The aim of the present studies is to
determine whether COC metabolism can be backtracked from the postmortem COC
concentration in the VH and brain tissue to arrive at the antemortem concentration. If the
antemortem COC level can be extrapolated from the postmortem level, it would aid
toxicologists and pathologists in determining if a person was under the influence at or
near the time of death, and if the drug played any role in the death.
A. Cocaine
C17H21NO4, commonly known as COC is an alkaloid found in two major forms:
COC hydrochloride and crack COC. COC hydrochloride is a white powder and crack is
COC hydrochloride processed into a free base form by a reaction with bicarbonate or
ammonia (Lewis et al., 2004). Structurally COC contains a hydrophobic region
represented by a benzene ring and a hydrophilic region that contains a secondary or
tertiary amine (Levine, 2003) (Figure 1). COC comes from the leaves of the
Erythroxylum coca plant found in the Andes mountain region of South America. This
plant can reach nine feet tall, prefers high elevations, and the leaves are available for
harvesting up to three times a year (Levine, 2003). For over 2,000 years the leaves of the
coca plant have been chewed by the Indians of Peru, Columbia, and Bolivia (Benowitz,
1993). This plant was believed to be created by Inti, the sun god of the Incas, as a gift to
aid in relieving the hunger and thirst of the Incas. COC was used experimentally as well
as clinically after Albert Neimann in 1859 isolated and extracted the alkaloid from the
leaves of the coca plant (Billman, 1990). COC was added to elixirs, wine, potions, and
Coca Cola™ by using the leaves for a flavoring agent (Knuepfer, 2003). As COC was
used on a widespread basis, addiction concerns began to grow. COC is classified under
4
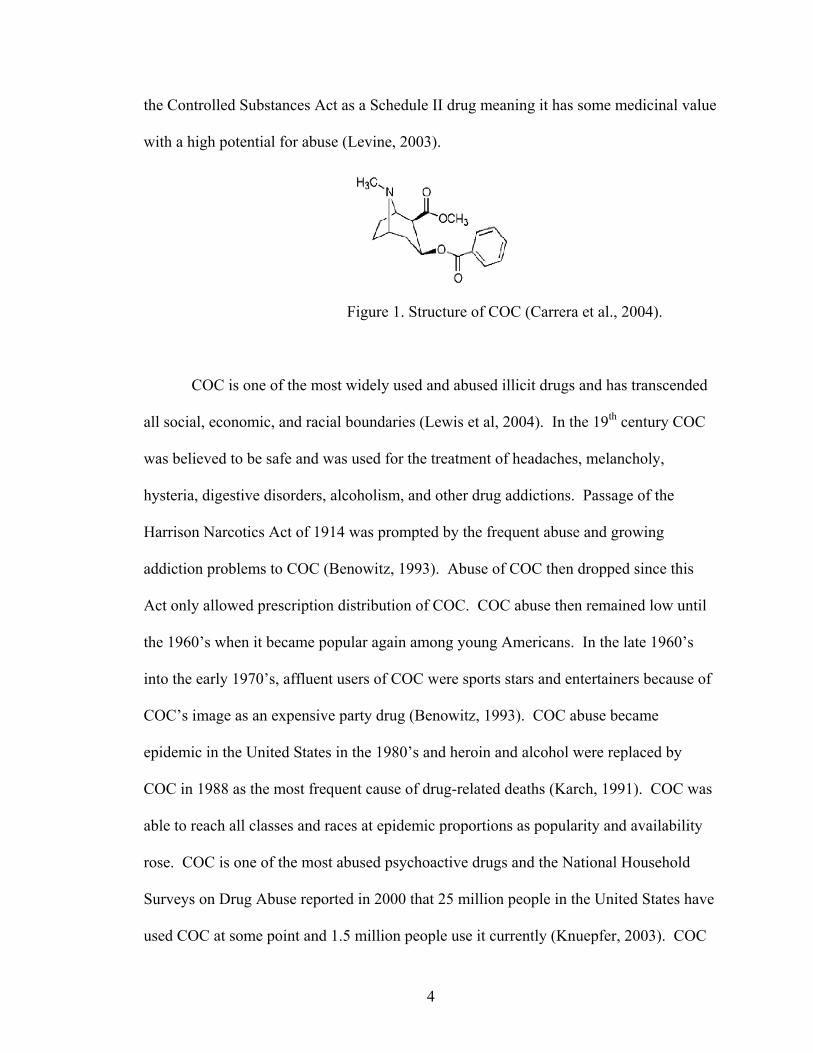
the Controlled Substances Act as a Schedule II drug meaning it has some medicinal value
with a high potential for abuse (Levine, 2003).
Figure 1. Structure of COC (Carrera et al., 2004).
COC is one of the most widely used and abused illicit drugs and has transcended
all social, economic, and racial boundaries (Lewis et al, 2004). In the 19th century COC
was believed to be safe and was used for the treatment of headaches, melancholy,
hysteria, digestive disorders, alcoholism, and other drug addictions. Passage of the
Harrison Narcotics Act of 1914 was prompted by the frequent abuse and growing
addiction problems to COC (Benowitz, 1993). Abuse of COC then dropped since this
Act only allowed prescription distribution of COC. COC abuse then remained low until
the 1960’s when it became popular again among young Americans. In the late 1960’s
into the early 1970’s, affluent users of COC were sports stars and entertainers because of
COC’s image as an expensive party drug (Benowitz, 1993). COC abuse became
epidemic in the United States in the 1980’s and heroin and alcohol were replaced by
COC in 1988 as the most frequent cause of drug-related deaths (Karch, 1991). COC was
able to reach all classes and races at epidemic proportions as popularity and availability
rose. COC is one of the most abused psychoactive drugs and the National Household
Surveys on Drug Abuse reported in 2000 that 25 million people in the United States have
used COC at some point and 1.5 million people use it currently (Knuepfer, 2003). COC
5
use has accounted for a larger percentage of hospital admissions compared to any other
illicit or illegal drug (Knuepfer, 2003). The National Institute of Health reported a cost
estimation of $97.7 billion for hospital admissions, loss of income, and criminal acts
relating to illicit drug use in 1992 alone. The occurrence of COC toxicity seems to be
substantially under reported since several deaths do not present as such, and therefore are
not classified as being related to COC (Knuepfer, 2003). Incidences are also under
reported due to the fact that some COC deaths may present as vascular problems instead
of being directly related to COC. Also, even though there have been continued efforts of
drug enforcement and treatment, COC and crack are still a large problem in the United
States as well as the world (Jenkins, 1999). Epidemiological studies have suggested that
about 17% of COC users become dependent on the drug (Nader and Czoty, 2005).
COC can be administered intravenously (IV), intranasally (IN), by smoking (SM),
and by oral ingestion (PO) (Levine, 2003). The only route to produce 100% bio-
availability is the IV route. The SM route is able to produce the same euphoria as the IV
route because of the rapid delivery to the brain and it has bioavailability ranging from
57% to 70%. IN bioavailability seems to be dose-dependent and can range anywhere
from 25% to 94% depending on the individual. The PO route of administration is least
used since the bioavailability is only about 20% (Levine, 2003). The low bioavailability
in comparison to other routes is due to first-pass effects. Low euphoric effects are also
seen from the PO route due to a low efficiency for delivery to the brain. The high or
euphoria related to COC exposure is dependent on plasma concentrations, not dose. Peak
plasma concentrations develop rapidly after IV and SM routes and the peak plasma
concentrations are delayed after IN and PO routes (Levine, 2003). A range of 20-100mg
6
is the common IN dose, which can be a lot higher in chronic or heavy users (Verstraete,
2004).
B. Metabolites
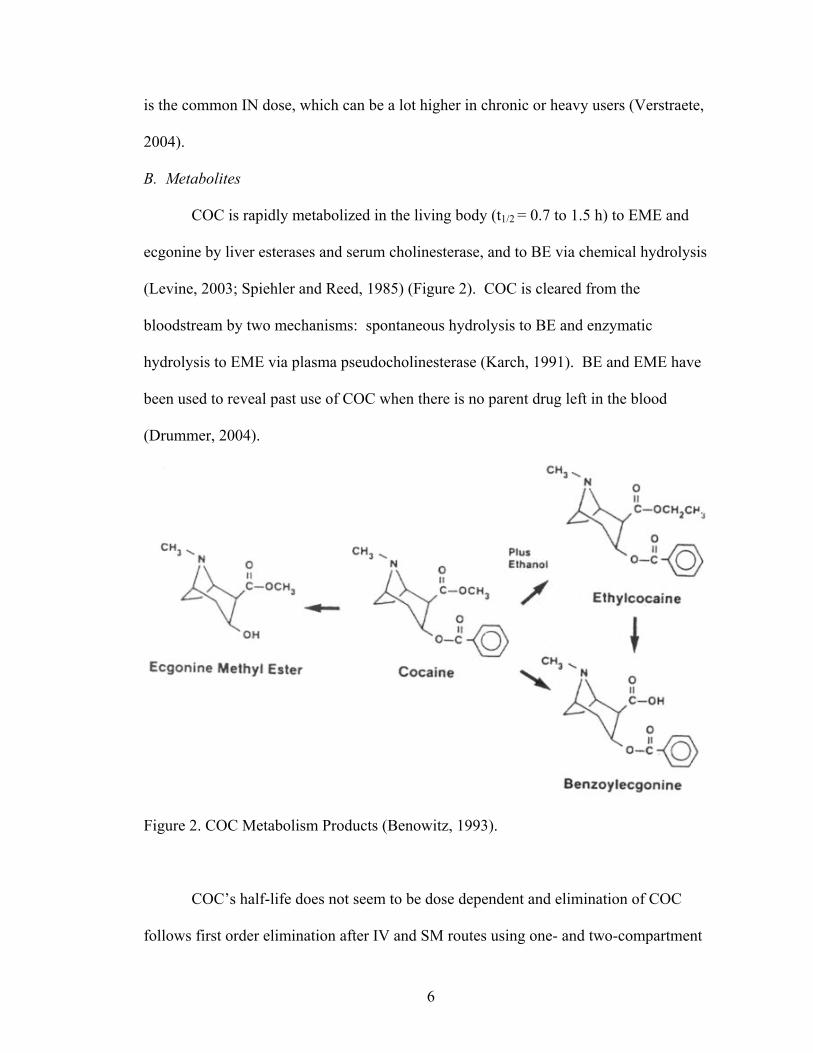
COC is rapidly metabolized in the living body (t1/2 = 0.7 to 1.5 h) to EME and
ecgonine by liver esterases and serum cholinesterase, and to BE via chemical hydrolysis
(Levine, 2003; Spiehler and Reed, 1985) (Figure 2). COC is cleared from the
bloodstream by two mechanisms: spontaneous hydrolysis to BE and enzymatic
hydrolysis to EME via plasma pseudocholinesterase (Karch, 1991). BE and EME have
been used to reveal past use of COC when there is no parent drug left in the blood
(Drummer, 2004).
Figure 2. COC Metabolism Products (Benowitz, 1993).
COC’s half-life does not seem to be dose dependent and elimination of COC
follows first order elimination after IV and SM routes using one- and two-compartment

7
models. BE is measurable in the plasma 15-30 minutes after COC administration
(Levine, 2003). BE’s elimination rate is slower in comparison to its formulation rate,
which provides a longer half-life and a higher accumulation in plasma when COC
concentrations are decreasing (Levine, 2003).
Metabolism of COC is rapid and less than 5% is excreted in the urine unchanged
(Benowitz, 1993). The hydrolysis to BE accounts for about 45% of COC metabolism and
enzymatic hydrolysis to EME accounts for about 40% (Benowitz, 1993). COC contains
ester linkages, similar to ester-linked local anesthetics, which allow for the hydrolysis and
deactivation of the drug in the body. The ester group also becomes vulnerable to in vitro
hydrolysis (Levine, 2003). Since COC can rapidly be metabolized to BE, the COC
concentration found postmortem may not be indicative of initial exposure (Spiehler and
Reed, 1985). COC is unstable in several biological matrices and analysis of its initial
concentration becomes complicated due to vulnerability to hydrolysis in cholinesterase
containing specimens like blood and plasma (Cingolani et al., 2004). Spontaneous
hydrolysis of COC is known to occur after death, which further confounds postmortem
COC findings and the problem of trying to relate postmortem to antemortem drug levels
(Mackey-Bojack et al., 2000). These metabolic reactions complicate any interpretation of
COC and its metabolite concentrations in the various biological specimens (Levine,
2003).
C. Systemic and Local Effects
COC causes several cardiovascular effects and potentiates cardiovascular
diseases. COC use can result in myocardial infarction, arrhythmias and angina pectoris
(Mittleman and Wetli, 1987). Myocardial infarction results from increased myocardial
8
work due to a demand for oxygen, coronary vasospasm, and thrombosis. Arrhythmias
result from sympathetic nerve stimulation and myocarditis. The most common type of
arrhythmia observed in COC users is sinus tachycardia (Benowitz, 1993).
COC is a potent vasoconstrictor and can severely constrict the cerebral
vasculature. These adrenergic effects are due to the blocking of reuptake of the
catecholamine, norepinephrine (NE) (Billman, 1990). COC also causes vasculitis (an
inflammation in the brain vessel walls) and decreases cerebral blood flow (Carrera et al.,
2004). COC increases heart rate and decreases skin temperature, consistent with the
release of catecholamines (Benowitz, 1993). First time users may experience the
complications of COC like cerebral vasculitis, ischemic stroke, brain hemorrhages, and
intestinal ischemia. These complications are related to the high numbers of mortality
seen in young, inexperienced adult COC users (Strickland et al., 1993). Cardiovascular
diseases like contraction bands, cardiomyopathy, accelerated atherosclerosis, and
endocarditis are all complications related to COC use. Chronic use of COC causes the
same complications as acute exposure as well as an acceleration of atherosclerosis. Both
arrhythmias and sudden death from COC use can be seen in chronic and acute exposure
(Kloner et al., 1992). COC can also increase platelet aggregation, which can lead to
stroke or other vascular disorders (Benowitz, 1993).
When COC is administered through the nasal cavity it is able to cause ischemia,
necrosis, and infections of the nasal sinuses and mucosa. It can also cause several
pulmonary complications like pulmonary hemorrhages and edema, obliterative
bronchiolitis, asthma, and abnormalities in gas-exchange (Perper and Van Thiel, 1992).
Because of the fact that smoking crack COC leads to a rapid euphoric effect caused by
9
rapid absorption into the pulmonary circulation, it has largely replaced IN and IV routes
of administration. Smoking crack COC is able to produce several pulmonary
complications because smoking exposes the lungs to several impurities, contaminants,
pryloysis products, and vaporized alkaloidal cocaine. All of these products can cause
airway and lung injury (Tashkin, 2001).
D. Nervous System Effects
COC readily crosses the blood brain barrier (BBB) because it has a low molecular
weight (303.35) and is highly lipophilic. Rapid entry into the brain can cause the acute
effect of euphoria by the stimulation of the dopaminergic system. The euphoric effect
felt by COC users seems to be due to the occupancy of COC on 50% of the striatal
dopamine transporter (DAT) binding sites (Kalasinsky et al., 2000). COC also produces
an increase in energy, alertness, and self-confidence. At higher doses it causes
restlessness, paranoia, anxiety, agitation, and aggressive behavior (Buttner et al., 2003).
COC in moderation is able to produce arousal, a sense of friendliness, psychomotor
stimulation, loquaciousness, and tremor (Benowitz, 1993), which are similar to the
effects of amphetamine. Amphetamines and COC share toxicological features, i.e. a
potent nerve stimulant. COC can also produce seizures and movement disorders.
Seizures manifest after a decrease in the seizure threshold or because of an induction of
cardiac arrhythmia. Movement disorders are commonly present in COC users and are
due to dopaminergic transmission alterations in the nigrostriatal motor system (Drummer,
2004).
COC has been shown to augment sympathetic action in cardiac and other tissues.
It also increases the adrenergic response by inhibiting the uptake of catecholamines into
10
nerve terminals (Billman, 1990). COC is able to block the reuptake of catecholamines
like NE and dopamine (DA) at the presynaptic level in both the central nervous system
(CNS) and the peripheral nervous system (PNS) (Kloner et al., 1992). COC primarily
acts on the DAT in the brain. COC indirectly acts as a monoamine agonist at DA,
serotonin, and NE receptors by binding to the respective transporters (Nader and Cztoy,
2005). The net results of DAT blockade are heightened levels of DA in the synapse as
well as stimulation of the DA receptors (Benowitz, 1993). These heightened levels of
activate the two families of DA receptors, D1- and D2- like. The D2-like receptors have
been linked to drug abuse (Nader and Cztoy, 2005). Also, because of increased
extracellular DA via the blockade of DAT, COC is able to cause the activation of motor
and reward pathways in the midbrain, heighten locomotor activity, and heighten the
euphoria felt by the user (Mortensen and Amara, 2003).
COC seems to be the only naturally occurring local anesthetic (Knuepfer, 2003).
COC exhibits its anesthetic properties by blocking sodium (fast) channels through
binding to the inside of the sodium ion (Na+) channel membrane. This in turn inhibits
action potentials in nerve and cardiac tissue and inhibits further conduction of the Na+
(Billman, 1990; Knuepfer, 2003). By blocking the Na+ channels, COC slows neuronal
transmission (Benowitz, 1993). This blocking occurs in the myocardium and results in a
depression of depolarization and conduction velocity. All of the excess catecholamines
at the postsynaptic sites cause sympathomimetic stimulation of the CNS, heart muscle,
and vascular smooth muscle (Kloner et al, 1992). COC is able to cause a physiological
response resembling sympathetic nervous system actions by blocking the reuptake of
catecholamines.
11
When COC binds to the NE transporter and DAT, there is a marked increase in
the synaptic concentrations of these monoamines (NE and DA). As previously
mentioned, COC blocks the reuptake of NE, which results in autonomic effects and it
blocks the reuptake of DA, which results in CNS effects. DA has receptors on both the
presynaptic and postsynaptic dopamine and non-dopamine axon nerve terminals (Harvey,
2004). Nearly 80% of DA in the brain is found in the corpus striatum (Siegel et al.,
1999). DA as a neurotransmitter is able to affect the functioning of locomotor activity,
motivation, the reward system, and cognitive processes (Bannon, 2005). Since COC is
able to affect the DAT and reuptake of DA into the cell, it is able to exert its affects at
several places in the CNS on process involved with DA.
E. Dopaminergic System
The neurotransmitter DA controls locomotor activity and is involved in reward
and goal oriented behavior pathways. The DAT is seen specifically in dopaminergic
neurons of the substantia nigra and the ventral tegmental brain areas. The striatum,
prefrontal cortex, and nucleus accumbens contain dopaminergic neuron projections.
DAT is present and expressed throughout the nerve cell on the axons, soma, and
dendrites at the plasma membrane of these projections. DAT is responsible for regulating
DA signal amplitude and duration, as well as the activation of extrasynaptic receptors by
clearing DA from the extracellular spaces (Mortensen and Amara, 2003). DA release is
also associated with the rewarding effects of COC in the mesolimbic and mesocortical
pathways of the brain (Benowitz, 1993). DA projections in the brain contain the above-
mentioned areas as well as the neostriatal pathway, mesolimbic pathway, mesocortical
pathway, and tuberohypophysial pathway. The neostriatal pathway regulates motor
12
movement and the mesolimbic pathway regulates mood and reward systems. The last
two pathways, mesocortical and tuberohypophysial, area able to mediate cognitive
processes and inhibit prolactin release, respectively. Any disruption of these pathways
could result in a disruption of motor skills, mood, cognitive abilities, and endocrine
balance (Harvey, 2004).
DAT is a part of the Na+ and chloride ion (Cl-)-dependent neurotransmitter
transporter family. Norepinephrine and serotonin are also included in this transporter
family. DA transmission is mediated by receptors on the membrane belonging to a seven
transmembrane domain, G-protein coupled family of receptors, with five receptor
subtypes (Anderson and Pierce, 2005). DA is transported against the concentration
gradient inwardly across the plasma membrane using the sodium gradient. The
stoichiometry of DA transport is one DA, two Na+, and one Cl-, which results in transport
that is potentially electrogenic. DAT is able to transport DA in the reverse direction (into
extracellular space) following exposure to amphetamine, COC, and related drugs
(Bannon, 2005). COC inhibits DAT in the nucleus accumbens and striatum (Itzhak et al.,
1999). COC is a DAT binding transport inhibitor, which inhibits the uptake of released
DA, causing and increase in extracellular DA. Since DAT is able to regulate and limit
DA signaling, it is able to modify human behavior (Bannon, 2005). For most abused
drugs, the dopaminergic system is a primary mediator of the euphoric effects and reward
systems (Stephens et al., 2004). DA projection to the prefrontal cortex, nucleus
accumbens, and amygdala are primary sites of action for COC (Kalivas, 2004). When
COC binds to DAT and inhibits uptake of extracellular DA, the result is increased DA.
13
This then activates the reward pathways of the brain, increases locomotor activity, and
heightens euphoria associated with COC use (Mortensen and Amara, 2003).
F. Mechanisms of Cocaine Toxicity
COC has a specific binding site on the DAT (Benowitz, 1993). When an acute
dose of COC is administered, both NE and DA concentrations in the brain are briefly
elevated and then the concentrations drop to levels below normal; represented by the rush
and crash felt by the user (Levine, 2003). Also after an acute dose of COC, potentiation
in DA cells and glutaminergic input is sensitized from the prefrontal cortex. Glutamate
transmission is also a primary contributor to enduring neuroplasticity in the brain and to
development and expression of COC addiction (Kalivas, 2004). The DA reuptake
system, or pump, is the primary target of COC in the brain, thereby blocking the DAT
and preventing the reuptake of DA in the presynaptic dopaminergic neuron (Benowitz,
1993; Levine, 2003). DAT is inhibited by COC binding to the sodium-binding site on the
transporter. By binding to the sodium-binding site on DAT, cocaine is then able to alter
the shape of the chloride-binding site, resulting in inhibition of binding for both ions.
Since reuptake is inhibited, there is increased extracellular DA. This produces long-term
stimulation of the DA receptor in the postsynaptic neuron since the translocation of DA
across the presynaptic neuron membrane is inhibited (Levine, 2003).
Limiting catecholamine action and clearing them from the synaptic cleft is the
primary goal of neuronal uptake (Levine, 2003). COC blocks the serotonin transporter
(SERT) in a similar way as the DAT. COC blocks serotonin reuptake by binding to the
SERT, which causes increased serotonin in extracellular spaces. This increase then
causes activation of the serotonin receptors (Muller and Huston, 2006). When COC
14
blocks neuronal uptake of catecholamines, it is able to intensify the effects of those
catecholamines. Changes in the DAT in the mesolimbic areas of the brain are observed
following chronic COC exposure. Chronic users of COC continuously expose
themselves to COC to compensate for the up-regulation of COC binding sites, which
results in the need for more COC for continuation of its rewarding effects (Levine, 2003).
After an overdose, chronic users show higher levels of ionotropic glutamate receptor
subunits in the ventral tegmental area (VTA). In the VTA site, increased DA release
causes a cascade facilitating cellular changes elsewhere in the brain (Kalivas, 2004).
Uptake inhibitors, like COC, are able to up-regulate transporter surface expression
(Mortensen and Amara, 2003). Cell culture studies by Daws et al (2002) have shown that
an increase in DAT transport activity upon COC dose is accounted for by a parallel
increase in DAT cell surface expression. Studies have shown that DAT blockers like
COC are able to increase DAT cell membrane expression while increasing extracellular
DA levels (Kahlig and Galli, 2003). COC’s toxicity comes from the fact that it is able to
block catecholamine reuptake as well as produce free radicals.
Free radicals like reactive oxygen species (ROS) can be generated after in vivo
exposure to COC. COC-induced ROS may be linked to teratogenicity and genotoxicity
(Yu et al., 1999). The mechanism of ROS formation from COC is the N-demethylation
of COC by oxidative enzymes producing N-hydroxynorcocaine. N-hydroxynorcocaine
can then quickly convert to a free radical metabolite, norcocaine nitroxide. This free
radical metabolite is able to deplete glutathione, resulting in lipid peroxidation. Also,
during biotransoformation of COC, superoxides produce hydroxyl radicals. The
metabolites of COC may possibly induce hydroxyl radical production when hydrogen
15
peroxide is metabolized to superoxide ion in the presence of a water molecule (Yu et al.,
1999). Overexposure to ROS is linked to degenerative diseases, like aging and cancers;
therefore, chronic COC use can lead to excessive exposure to ROS and increasing the
likelihood of developing cancers (Yu, 1999). The autoxidation of DA is a second source
of ROS. DA can form reactive quinone species that then can modify and damage
macromolecules such as DNA, lipids, and proteins. DA has the potential to be toxic
forming the DA-quinone when a pair of oxygen atoms on the DA catechol ring consist of
unpaired electrons on the outer orbitals (Stokes et al., 2000).
G. Redistribution of Cocaine
Drug redistribution is defined as the movement of drugs and other chemical toxins
between bodily fluids, organs, and tissues postmortem (Cook et al., 2000). Redistribution
is a complex process and phenomenon resulting from the disruption of cell membranes,
diffusion of a drug from a higher concentration to a lower concentration, postmortem
metabolism, or chemical changes of the compounds, thereby affecting the ability to
determinate drug concentrations in postmortem samples (Drummer, 2004; Teixiera et al.,
2004). Since COC is subject to redistribution, this process may allow for release of COC
out of the respective organ it was stored in into the blood. Then because spontaneous
hydrolysis and postmortem metabolism of COC do occur, the net effect might cause COC
blood concentrations to increase, decrease, or stay the same (Hearn et al., 1991). The rate
and extent of redistribution can vary. Factors like the nature of the drug and postmortem
interval affect the extent of redistribution (Cook et al., 2000).
During the early stages postmortem, there are several mechanisms that contribute
to the phenomenon of redistribution. In a hypoxic state there is a rapid decrease in

16
available adenosine triphosphate (ATP) and adenosine triphosphatase (ATPase), which
results in a failure of the sodium/potassium pumps. Mitochondria and plasma
membranes then become damaged allowing the drug accumulated in the cell to be
released into the surrounding tissues. Also, both intracellular and extracellular pH values
decrease due to lactate accumulation via anaerobic metabolism. These conditions
occurring postmortem may allow for the leakage of intracellular drugs into extracellular
spaces. Even though these mechanisms are known to transpire postmortem and
contribute to redistribution, it is not known if one mechanism is predominant (Moriya and
Hashimoto, 1999).
COC is able to store and accumulate into tissues, like the brain and liver, with
moderate affinity (volume of distribution = 2 – 3 L/ kg). These tissues can then serve as
a depot from which COC can be released into the blood. Increases in COC concentration
seen in the blood of the heart, aorta, and femoral vein suggest that the postmortem
redistribution or release of COC from tissue stores may overwhelm the effects of
spontaneous hydrolysis (Benowitz, 1993; Hearn et al., 1991). The redistribution process
is of significance to COC since it is of high lipid solubility and can store in tissues in
higher concentrations in relation to blood (Drummer, 2004). Cook et al, (2000) used
other drugs like amitriptyline, methadone, and salicylate to show the dangers of
correlating postmortem drug concentrations to antemortem concentrations. They
revealed that in every case studied, the postmortem concentration was as high as or
higher than the original antemortem concentration at time of death due to drug
redistribution (Cook et al., 2000). It is important to note that precaution must be taken
when trying to extrapolate an antemortem drug level from the found postmortem
17
concentration. There has not yet been a standard extrapolation procedure set since
several mechanisms are involved with postmortem redistribution.
H. Brain and Vitreous Studies
Brain tissue has been used for determining substance concentrations by
toxicologists for several years. Brain tissue has been shown to be less susceptible to
spontaneous hydrolysis and postmortem redistribution, which yields another matrix for
analysis of COC than simply using blood alone (Drummer, 2004). Spiehler and Reed
(1985) showed that brain tissue can be a better specimen for analyzing COC than
postmortem blood since at peak cocaine plasma concentrations, the brain cocaine
concentration was over four times the plasma concentration. They also stated that since
COC is found with heterogeneous distribution throughout the brain, the regional source
for a tissue sample used for postmortem analysis would not produce a source of variation
in concentration.
VH has been found to be useful when analyzing COC and its metabolites and has
been used for several years for the detection of ethanol in the body. VH can be helpful
when blood is not available for analysis (Drummer, 2004; Mackey-Bojack et al., 2000).
VH is less likely to undergo the same postmortem changes as blood, i.e. redistribution.
The VH is basically like a buffer solution, a salt solution with very little protein present
(Drummer and Gerostamoulos, 2002). VH is a clean fluid since it contains less protein
than urine, is easily collected, and shows a high stability (Fernandez et al., 2006). Like
the brain, VH limits transport across its membrane and drug transport is restricted by the
lipid solubility of that drug. VH can be used for sampling in place of blood when the
body has been subjected to burning, decomposition, or a considerable amount of bleeding
18
(Scott and Oliver, 2001). Since VH is a simple matrix, it is suitable as a complimentary
specimen to blood when needed. If blood samples are decomposed or absent, the use of
VH in forensic toxicology could be helpful to quantify toxic substances (Teixeira et al.,
2004). VH analysis allows for certification of the presence of COC and metabolites
when no blood is available, but cannot be used to estimate drug levels in the blood
(Fernandez et al., 2006).
I. Use of Blood/Plasma for Analysis
The relevant matrices for analysis of drugs are whole blood, plasma, and serum.
Blood is used for drug analysis since it is a homogenous matrix and drugs can be detected
just after exposure and prior to any metabolism (Moeller et al., 1998). Even though urine
is a very common specimen for drug analysis, blood allows for a suggestion that the
person was not simply exposed to the drug, but the drug could have played a part in the
person’s impairment. A drug does not need to exceed toxic amounts to play a role in the
person’s death (Levine, 2003). For the most part, even if a drug observed in blood
analysis is the only remarkable finding at death, the detected drug(s) will not be deemed
the cause of death. COC, however, may be an exception to this general rule. When COC
is determined in the blood, if there are no other findings present, death can be certified as
a result of COC intoxication (Jenkins, 1999).
J. Summary and Significance of Study
COC, a psychostimulant, has been found to be in widespread use in the United
States and can cause several cardiovascular, PNS, and CNS complications. It is found
with heterogeneous distribution in the brain and is able to cross the BBB rapidly. It is
broken down into its inactive metabolites, BE and EME, through chemical and enzymatic
19
hydrolysis respectively. Because of the phenomenon of redistribution and spontaneous
hydrolysis to its metabolites postmortem, a rate has yet to be established to extrapolate
the antemortem drug concentrations at or near the time of death from postmortem
findings.
Since the rate at which COC is metabolized has not been established and it is
difficult to relate antemortem COC levels to postmortem specimens, this study is aimed
at comparing high performance-liquid chromatography with ultraviolet detection (HPLC-
UV), gas chromatography-flame ionization detection (GC-FID), and gas
chromatography-mass spectrometry (GC-MS) for the analysis of COC and BE in VH and
brain tissue. Previous studies focused on prescription drugs, other drugs of abuse, and
site differences in drug levels in the specimen (Clauwaert et al., 2000; Cook et al., 2000;
Hearn et al., 1991). This present study deals specifically with analyzing COC and BE
and comparing three analytical methods. Non-fatal doses of COC are being used to
resemble a user under the influence at or near the time of death. Rats are being used as
the animal model since they have previously been found to mimic the postmortem drug
concentration changes that occur in humans (Hilberg et al., 1993).
Case studies have found it difficult to find a valid relationship between postmortem
and antemortem drug levels because time of death and antemortem drug levels were not
known (Karch et al., 1998). This study will compare known COC levels injected into the
rat while comparing which analytical method is best for detecting adequate COC and BE
levels. If a better analytical method emerges for analyzing VH and brain tissue, this will
aid toxicologists and pathologists to better determine antemortem COC levels from
postmortem drug levels and possibly draw correlations to previously studied drugs.
20
• AIM # 1: Comparison of extraction techniques and assay validation.
Solid phase extractions will be done on J.T. Baker Narc-2 SPE columns and
Varian Bond Elut Certify SPE columns. Liquid-liquid extractions with hexane
will also be performed to determine the best extraction method.
• AIM # 2: In vivo analysis of COC metabolism in the brain and VH.
Male Sprague-Dawley rats (4-6 mo) will receive intraperitoneal (IP) injection of
15mg/kg COC at time zero (N = 4). After 10-15 minutes (peak plasma COC
concentration following IP injection), they will be euthanized in order to examine
the brain tissue and tap the VH. Both the VH and brain tissue samples will be
analyzed on the HPLC-UV, GC-FID, and GC-MS.
The research questions are as follows: Are COC and BE levels in the VH and
brain measurable by HPLC-UV, GC-FID, and GC-MS? and can these levels help
determine the rate at which COC metabolizes? The hypothesis is that GC-MS will be a
better analytical tool to quantitate COC and BE in VH and brain tissue than HPLC-UV
and GC-FID. Also, VH and brain tissue will be useful samples for finding adequate
levels of COC and its metabolites.
21
II. Materials and Methods
A. Chemicals and Drugs
COC hydrochloride and BE were obtained from Isotec (Miamisburg, OH). The
internal standard used for HPLC was bupivacaine from Sigma-Aldrich (St. Louis, MO).
Internal standards from Isotec (Miamisburg, OH) for GC-MS were d3-cocaine and d3-
benzoylecgonine. The derivatizing agent used for GC analysis was bis-
trimethylsilyltrifluoro-acetamide (BTSFA) and trimethylchlorosilane (TMCS), (99:1).
Concentrations of 165ng/ml, 500ng/ml, 750ng/ml, and 1500ng/ml for both BE and COC
were made in mobile phase and analyzed on the HPLC to produce a standard curve.
100µg/ml of bupivacaine was used as the internal standard spike and 30µg/ml of COC
was used as the standard for analysis. For GC-FID, 7.5µg/ml of COC and 100µg/ml of
bupivacaine were used as the standards. GC-MS internal standards were 30µg/ml d3-
cocaine and 30µg/ml d3-benzoylecgonine.
B. Animal Model
Male Sprague-Dawley rats (4-6 mos) were the animal model used for in vivo
analysis of COC metabolism. At this age range, rats are in their young adult period. The
animal insurance number is A367901. The protocol is 96-97-03, effective 1/20/2000.
C. In vivo analysis
Rats were given an IP injection of 15mg/kg COC at time zero. After 15 minutes
when BE first appears in the plasma, they were euthanized (Levine, 2003). VH was
removed and preserved with 1% sodium fluoride in a micro-centrifuge tube and stored at
22
-20°C prior to analysis. The whole brain was removed and sectioned into 4mm slabs
containing the ventral and dorsal striatum areas. These areas were frozen in liquid
nitrogen and stored at -80°C prior to analysis.
D. Solid Phase Extraction
1. HPLC
BAKERBOND spe™ narc™-2, 3ml (125mg) extraction columns from J.T. Baker
were used for the assay validation (Phillipsburg, NJ). Varian (Palo Alto, CA) Bond Elut
Certify, 130 mg, columns were used for solid phase extraction (SPE). The protocol was
adapted from the Varian manual for extraction of COC and BE from VH and brain tissue
instead of serum, plasma, or whole blood. For VH sample preparation, each sample was
thawed and then centrifuged for three minutes. The supernatant was removed and added
to 4ml of 100mM potassium phosphate buffer (pH 6.0) containing 100µg/ml bupivacaine.
In order to prepare the brain sample for extraction, the sectioned brain was thawed and
placed in 2ml of 100mM potassium phosphate buffer (pH 6.0). It was then homogenized
by a hand held tissue homogenizer and centrifuged for three minutes. The supernatant
was removed and added to 4ml potassium phosphate buffer containing 100µg/ml
bupivacaine. The brain, buffer, and internal standard were then taken up into a 5ml
syringe and filtered through a 0.45µ filter. The SPE column was conditioned first with
2ml methanol and 2 ml of 100mM potassium phosphate buffer (pH 6.0). The sample was
then added at approximately 2 ml/minute, followed by a wash of 6mL HPLC grade water
and 3ml of 1M acetic acid. The column was then allowed to dry under vacuum for five
minutes at ambient temperature. After five minutes of drying, 6ml of methanol was
added to the column. The last step, elution, was done by adding 2ml of
23
methanol/ammonium hydroxide (98:2) while collecting it at approximately 2ml/min. All
extractions were performed on a BAKER spe-12G Glass Column Processor (J.T. Baker,
Phillipsburg, NJ). After extraction, the liquid was evaporated by speed vacuum and the
resulting COC or BE was reconstituted in mobile phase to run on the HPLC for analysis.
2. GC-FID
For the GC-FID, the protocol was the same as the HPLC methods. After the
eluate was dried in the speed vacuum, the resulting COC or BE was reconstituted in 40µl
BSTFA, TMS (99:1), vortexed, and held at 100°C for 25 minutes. The liquid was then
evaporated off again in a speed vacuum and reconstituted in 40µl methlyene chloride.
The sample was then run through the GC-FID, producing a chromatograph for each
sample.
3. GC-MS
Bond Elut Certify SPE columns (Varian, Palo Alto, CA) were also used for
extraction prior to GC-MS analysis. The protocol was adapted from the Varian manual
for COC and BE extraction from VH and brain tissue instead of serum, plasma, or whole
blood. Both the VH and brain tissue sample preparation were the same as the HPLC
method except for the internal standards. 30µg/ml of d3-cocaine and 30µg/ml of d3-
benzoylecgonine were added to the 4ml of potassium phosphate buffer (pH 6.0) for each
sample. The column was conditioned with 2ml of methanol and 2ml of 100mM
potassium phosphate buffer (pH 6.0). The sample was loaded onto the column at a rate
of approximately 1-2ml /minute. The column was rinsed with 6ml HPLC grade water,
3ml of 1M acetic acid, and allowed to dry under vacuum for five minutes. Following
drying, 6ml of methanol was added to the column. Elution was accomplished by adding
24
2ml methylene chloride/isopropyl alcohol (80:20) containing 2% ammonium hydroxide
while collecting at approximately 1-2ml/minute. The eluate was placed in a speed
vacuum and evaporated to dryness. The derivatization step consisted of adding 50µl
BSTFA (with 1% TMCS), vortexing, and held at 70ºC for 20 minutes.
E. Chromatography
1. HPLC
The mobile phase consisted of 80% acetonitrile and 20% 0.01M potassium
phosphate adjusted to a pH of 3.0. All chemicals used were of HPLC grade from Sigma-
Aldrich (St. Louis, MO). The 0.01M potassium phosphate was filtered by the Millipore
filtration system through a two-micron filter. It was then degassed for ten minutes with
helium. Chromatography was performed at ambient temperature on a Supelcosil™ LC-Si
5μm, 15cm x 4.6mm column (Supelco, PA). The HPLC consisted of a Beckman System
Gold autosampler 507 with a 100μl loop, System Gold 126AA solvent module, and
System Gold 166 detector. The flow rate was set at 1ml/minute and the UV wavelength
was set to 254 nm. The Gold Chromatography Data System analyzed the samples to
produce a chromatograph.
2. GC-FID
Analysis was performed on an Agilent 6890N Network GC System with an on
board FID (Palo Alto, CA). An Agilent HP-5MS capillary column (30m X 0.25mm i.d.,
0.25µm film thickness) was used for chromatographic separation (Palo Alto, CA). The
GC-FID oven operated at an initial temperature of 120°C with a ramp of 7°C/min to end
at a final temperature of 225°C. Helium was the carrier gas flowing at 2ml/min with a
hydrogen flame in the detector. The total run time was 15 min. It was run in split less
25
mode with an injector temperature of 250°C. The FID temperature was set at 300°C.
Before each injection the needle was pre-cleaned with 2µl of the sample. 5µl of each
sample was injected and then the needle was washed with 3µl of methlylene chloride
(Sigma-Aldrich, St. Louis, MO).
3. GC-MS
Analysis was performed on an Agilent 6890N Network GC System (Palo Alto,
CA) interfaced with an Agilent 5873 Inert Mass Selective Detector (Palo Alto, CA). An
Agilent HP-5MS capillary column (30m X 0.25mm i.d., 0.25µm film thickness) was used
for chromatographic separation (Palo Alto, CA). The oven temperature profile was the
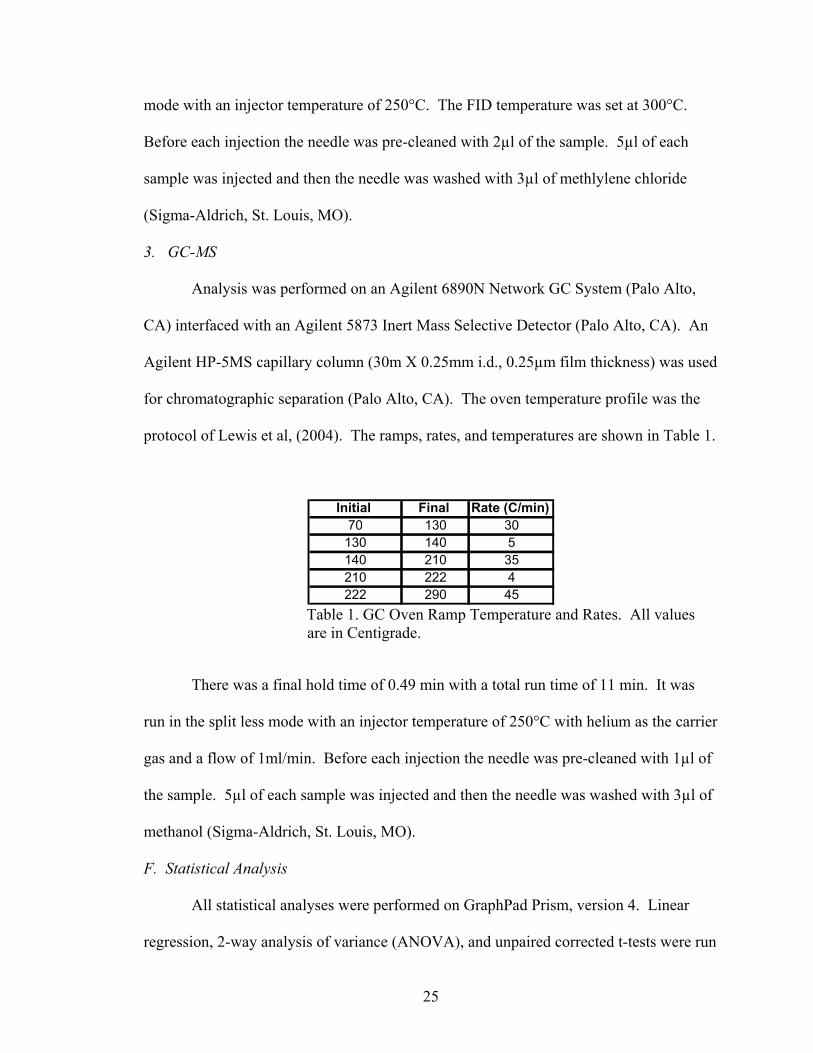
protocol of Lewis et al, (2004). The ramps, rates, and temperatures are shown in Table 1.
Initial Final Rate (C/min)70 130 30130 140 5140 210 35210 222 4222 290 45
Table 1. GC Oven Ramp Temperature and Rates. All values are in Centigrade.
There was a final hold time of 0.49 min with a total run time of 11 min. It was
run in the split less mode with an injector temperature of 250°C with helium as the carrier
gas and a flow of 1ml/min. Before each injection the needle was pre-cleaned with 1µl of
the sample. 5µl of each sample was injected and then the needle was washed with 3µl of
methanol (Sigma-Aldrich, St. Louis, MO).
F. Statistical Analysis
All statistical analyses were performed on GraphPad Prism, version 4. Linear
regression, 2-way analysis of variance (ANOVA), and unpaired corrected t-tests were run

26
on the respective results in order to statistically analyze the appropriate data. Significant
differences were based on the p value, p<0.05 for all analyses done.
27
III. Results
A. Preliminary Studies 1. HPLC Validation
Four different mobile phases (A-D) were tested to optimize detection and quantitation
limits for HPLC analysis. Three of the four (A-C) consisted of 45mM ammonium
acetate. Each one was modified by changing the organic solvent strength. The
composition of A is 10% methanol and 10% acetonitrile adjusted to pH 6.0 with 0.1M
HCl. B contained 40% methanol and 40% acetonitrile adjusted to pH 6.0 with 0.1M HCl.
The composition of C is 20% methanol and 20% acetonitrile adjusted to pH 3.0 with
0.1M HCl. Lastly, the mobile phase used for the injections (D) was 80% acetonitrile and
20% potassium phosphate adjusted from pH 4.5 to pH 3.0 with 0.1M HCl. Reduction in
pH permitted the best separation on the chromatograph, shown in Table 2 and 3. Also,
this mobile phase was suggested by Isotec (Miamisburg, OH) on their certificate of
analysis sheet that came with the preparation COC standard.
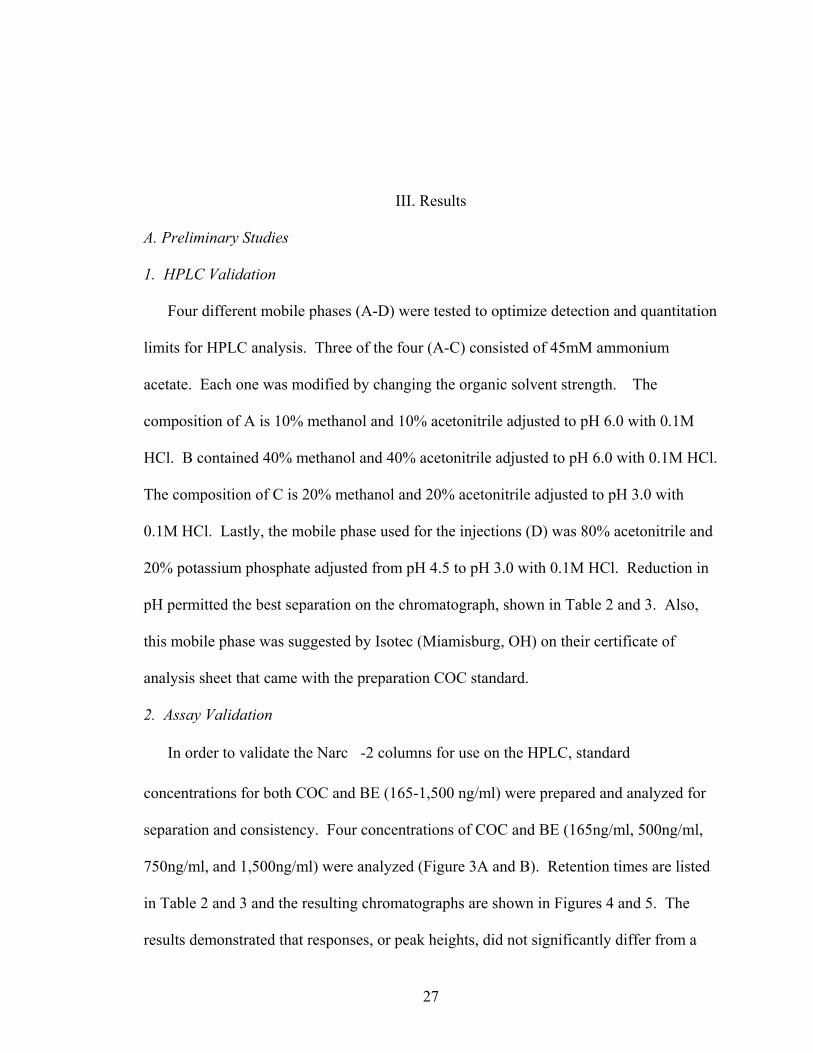
2. Assay Validation
In order to validate the Narc -2 columns for use on the HPLC, standard
concentrations for both COC and BE (165-1,500 ng/ml) were prepared and analyzed for
separation and consistency. Four concentrations of COC and BE (165ng/ml, 500ng/ml,
750ng/ml, and 1,500ng/ml) were analyzed (Figure 3A and B). Retention times are listed
in Table 2 and 3 and the resulting chromatographs are shown in Figures 4 and 5. The
results demonstrated that responses, or peak heights, did not significantly differ from a

28
slope of 1. These findings suggest that both COC and BE standards yield linear
responses at the concentrations tested, for both sets of standards following Narc-2
extraction.
0 500 1000 1500 20000
10
20
30
40
50
COC Conc. (ng)
Hei
ght (
mA
U)
0 500 1000 1500 20000
10
20
30
40
50
BE Conc. (ng)H
eigh
t (m
AU
)
Figure 3. Standards Analysis. (A) COC Concentration vs. Height and (B) BE Concentration vs. Height.
COC Conc. (ng)
Height (mAU)
Retention Time (min)
165 5.265 5.700 500 15.286 5.683 750 26.431 5.683
1500 45.171 5.667
Table 2. COC Standards. Chromatography Results
BE Conc. (ng) Height (mAU)
Retention Time (min)
165 5.424 6.508
500 16.037 6.45
750 23.435 6.508
1500 45.476 6.433
Table 3. BE Standards. Chromatography Results.

29
Figure 4. HPLC Chromatograph – COC Standard, 1500ng/ml.
COC
30
Figure 5. HPLC Chromatograph – BE Standard, 1500ng/ml
BE

31
3. Narc-2 vs. Hexane Extractions
Six different hexane extractions were done. Each one was spiked with 2µg/ml
bupivacaine and 2µg/ml COC. The average recovery for bupivacaine from hexane was
23.65%. The average recovery for COC from hexane was 9.623%. Ten different Narc -
2 extractions were run for comparison. The average bupivacaine recovery was 94.07%.
The average COC recovery was 229.38% and BE was 104.38%.
Due to the greater than 100% recovery for COC and BE, Narc-2 extractions with
no drug standard were run and the chromatograph showed extraneous peaks. The COC
and BE percent recovery of greater than 100% is due to 1) an unknown elution peak
interference or 2) an problem with the evaporation/reconstitution of the sample leading to
inclusion of a contaminant.
4. Narc-2 Column Variability and Time Course Variability
To determine the reproducibility of Narc-2 extractions, four different extractions
were run using bupivacaine, COC, and BE standards. Peak heights were compared
between the four columns. Also, in order to determine the stability of COC post-
extraction, four time points were used after extraction. The results of column variability
over time (Figure 6) and COC degradation post-extraction (Figure 7) are shown. No
significant difference on column variability shows that these SPE columns can be used
for analysis with confidence that no variability will be introduced due to column effect.
32
0 30 60 90 120 1500
2
4
6
8
10Column 1Column 2Column 3Column 4
Time (min)
Hei
ght (
mAU
)
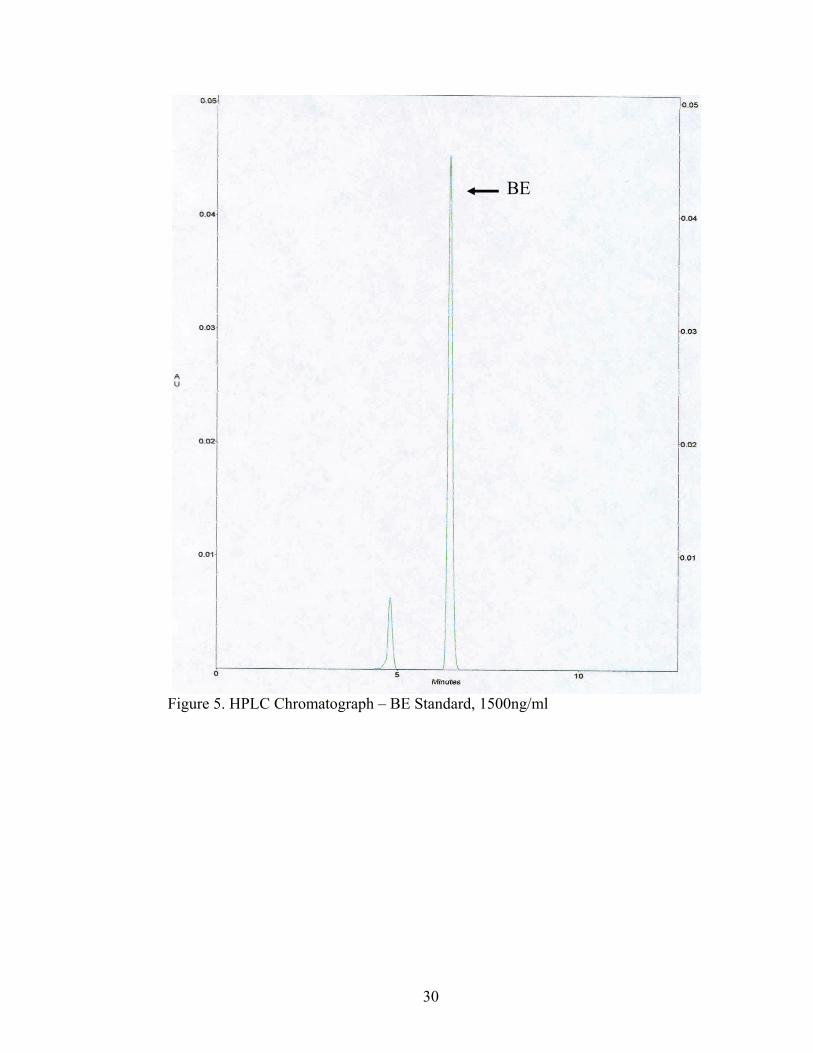
Figure 6. Narc-2 Column Variability. On each of the four columns a COC standard extraction was done and the eluent collected was run on the HPLC
for analysis. A 2-way ANOVA demonstrated there was no effect of column on COC standard peak heights (p=0.0923).
0 30 60 1200
1
2
3
4
5
6
Time (min)
Hei
ght (
mAU
)
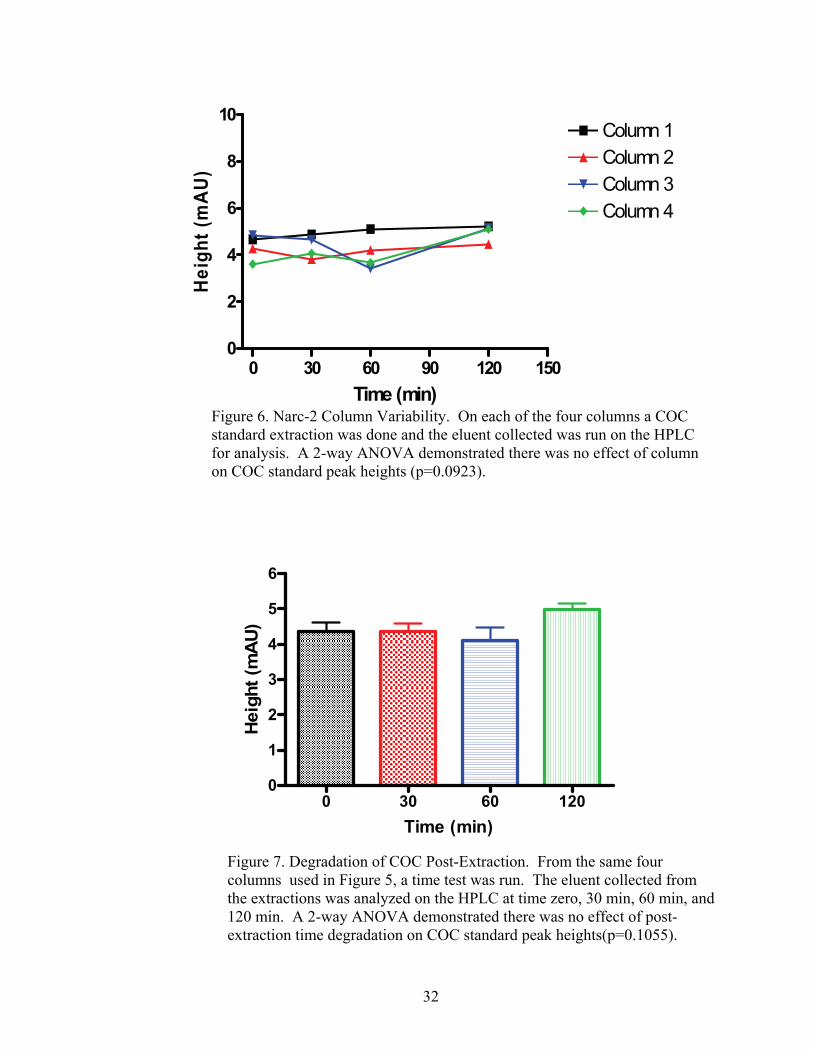
Figure 7. Degradation of COC Post-Extraction. From the same four columns used in Figure 5, a time test was run. The eluent collected from the extractions was analyzed on the HPLC at time zero, 30 min, 60 min, and 120 min. A 2-way ANOVA demonstrated there was no effect of post-extraction time degradation on COC standard peak heights(p=0.1055).
33
Data analysis using a 2-way ANOVA demonstrated that there was no interactive effect of column by time (p=0.1922) on peak height of a COC standard. Thus, samples
could be analyzed up to 120 minutes after SPE with no effect on peak height. Therefore,
samples can be extracted up to two hours following sample preparation with no loss of
sensitivity.
B. Chromatography 1. HPLC
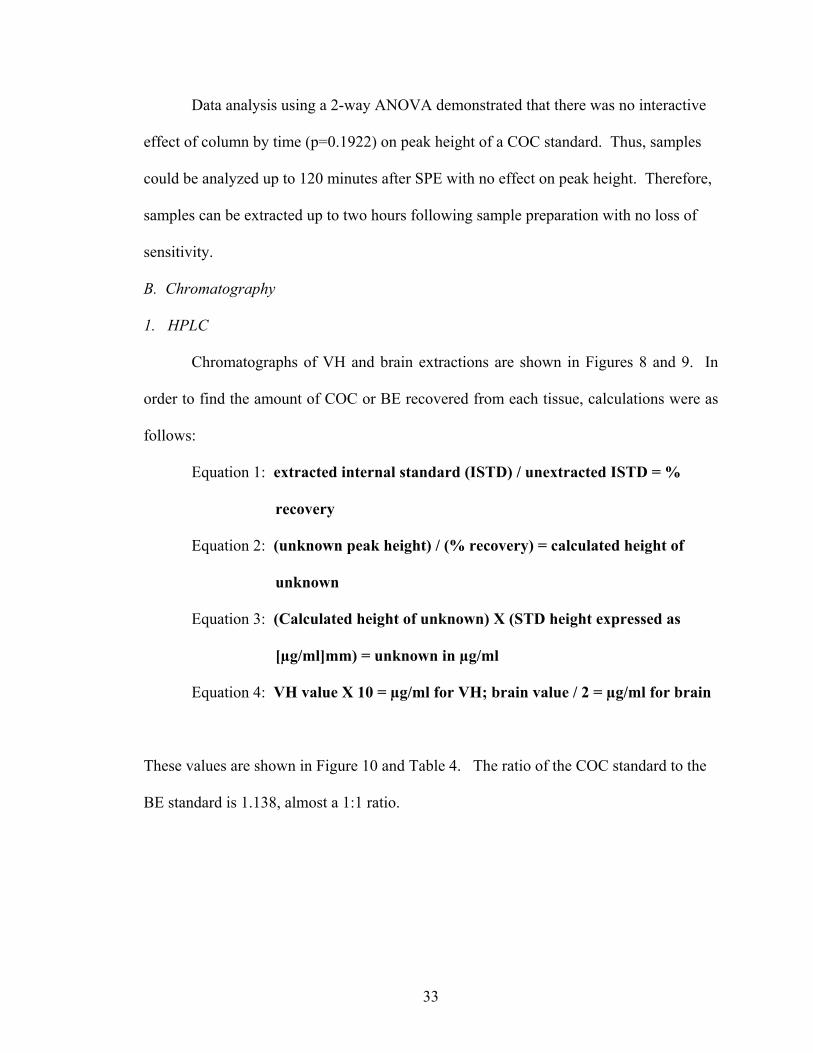
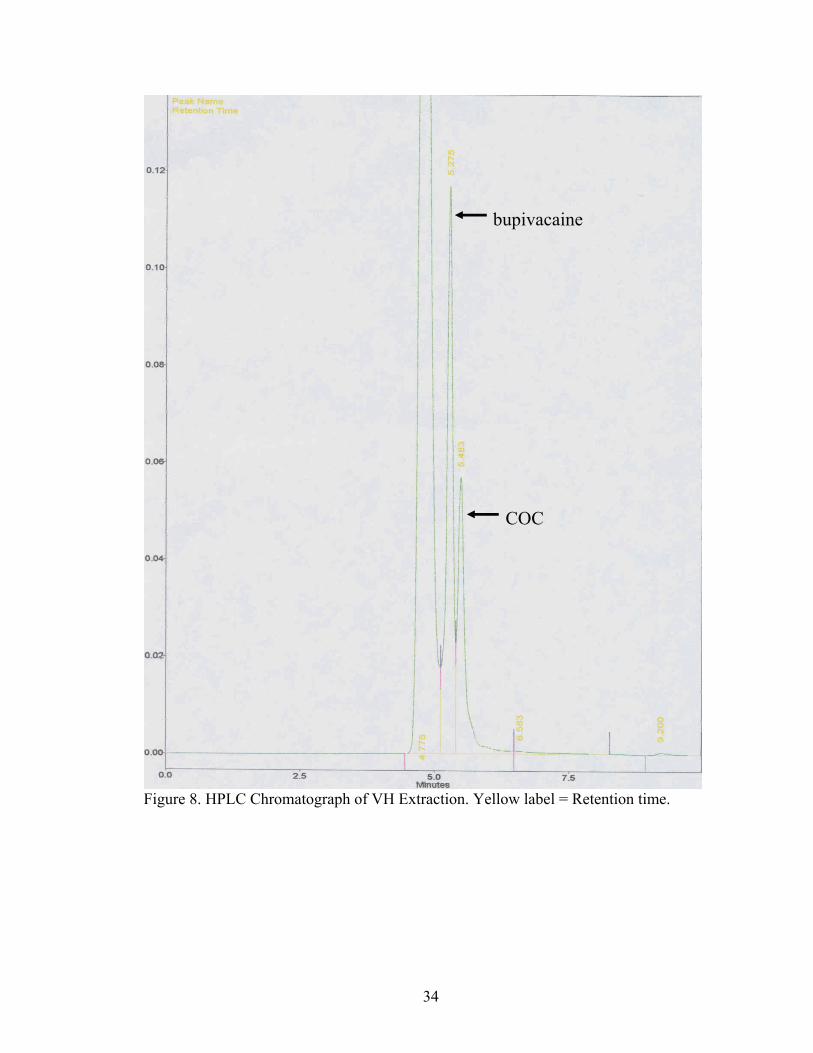
Chromatographs of VH and brain extractions are shown in Figures 8 and 9. In
order to find the amount of COC or BE recovered from each tissue, calculations were as
follows:
Equation 1: extracted internal standard (ISTD) / unextracted ISTD = %
recovery
Equation 2: (unknown peak height) / (% recovery) = calculated height of
unknown
Equation 3: (Calculated height of unknown) X (STD height expressed as
[µg/ml]mm) = unknown in µg/ml
Equation 4: VH value X 10 = µg/ml for VH; brain value / 2 = µg/ml for brain
These values are shown in Figure 10 and Table 4. The ratio of the COC standard to the
BE standard is 1.138, almost a 1:1 ratio.
34
Figure 8. HPLC Chromatograph of VH Extraction. Yellow label = Retention time.
COC
bupivacaine
35
Figure 9. HPLC Chromatograph of Brain Extraction.
bupivacaine
COC
BE
36
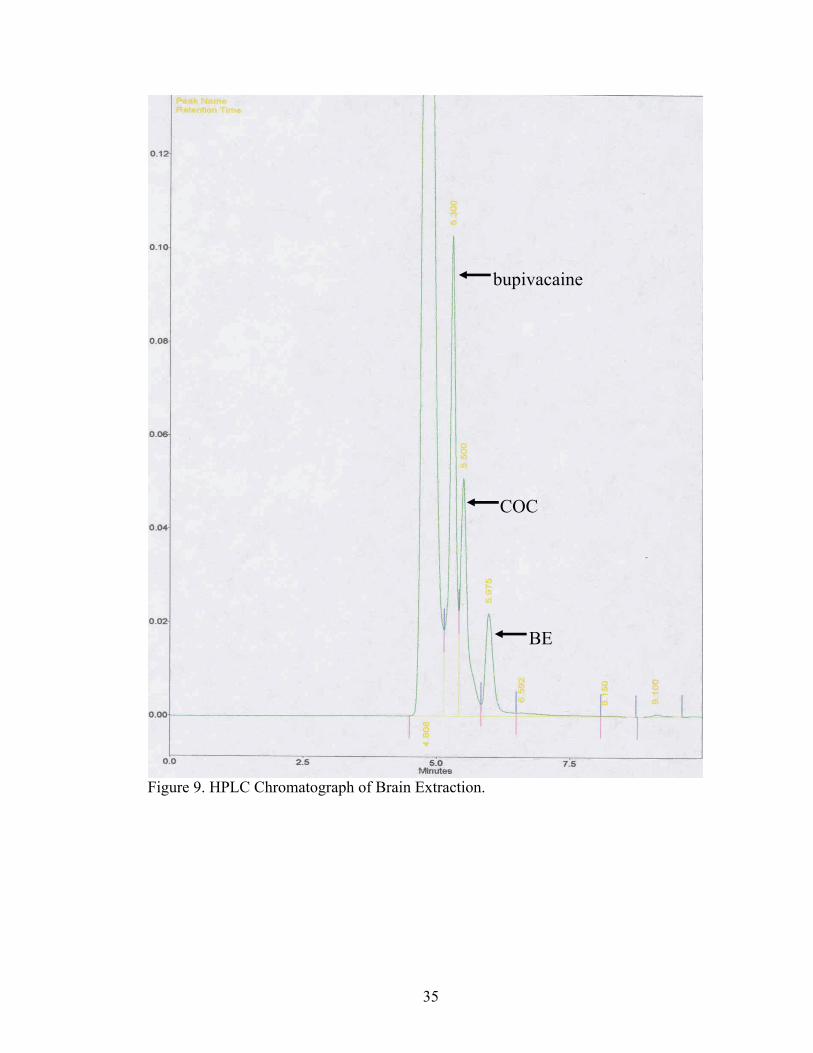
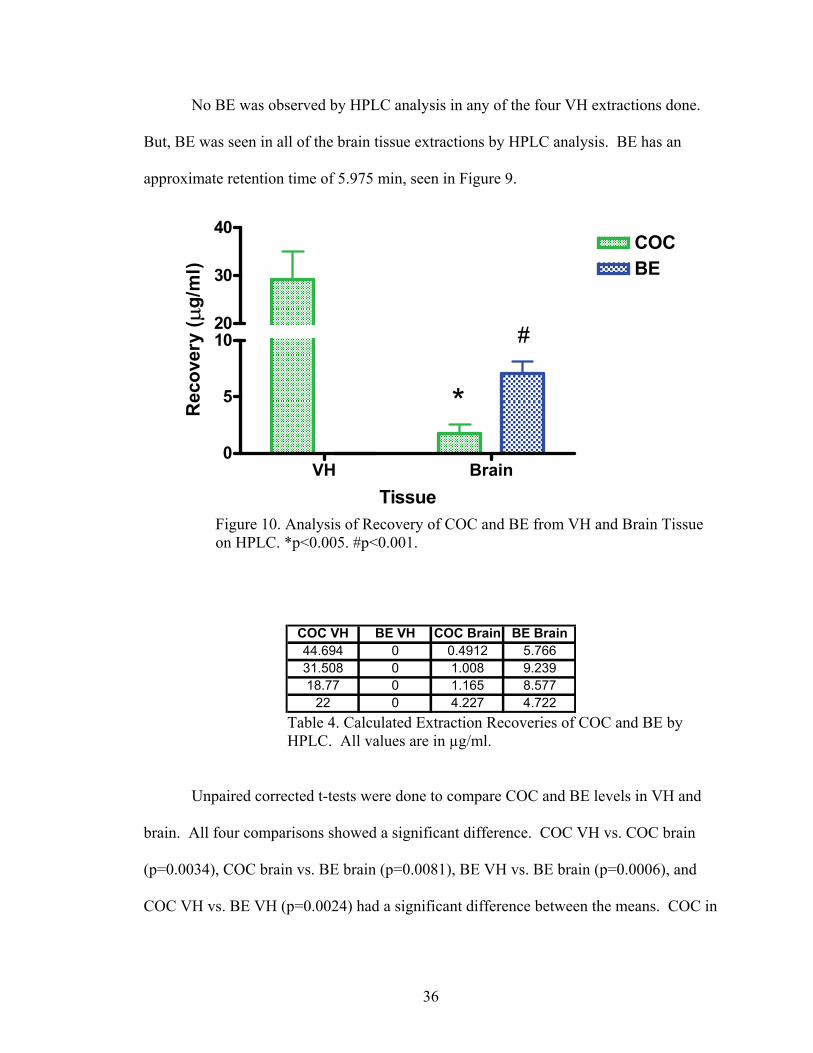
No BE was observed by HPLC analysis in any of the four VH extractions done.
But, BE was seen in all of the brain tissue extractions by HPLC analysis. BE has an
approximate retention time of 5.975 min, seen in Figure 9.
VH Brain0
5
10
COCBE
20
30
40
*
#
Tissue
Rec
over
y ( μ
g/m
l)
Figure 10. Analysis of Recovery of COC and BE from VH and Brain Tissue on HPLC. *p<0.005. #p<0.001.
COC VH BE VH COC Brain BE Brain44.694 0 0.4912 5.76631.508 0 1.008 9.23918.77 0 1.165 8.577
22 0 4.227 4.722 Table 4. Calculated Extraction Recoveries of COC and BE by HPLC. All values are in µg/ml. Unpaired corrected t-tests were done to compare COC and BE levels in VH and
brain. All four comparisons showed a significant difference. COC VH vs. COC brain
(p=0.0034), COC brain vs. BE brain (p=0.0081), BE VH vs. BE brain (p=0.0006), and
COC VH vs. BE VH (p=0.0024) had a significant difference between the means. COC in
37
the VH was significantly higher than COC in the brain. BE in the brain was significantly
higher than BE in the VH.
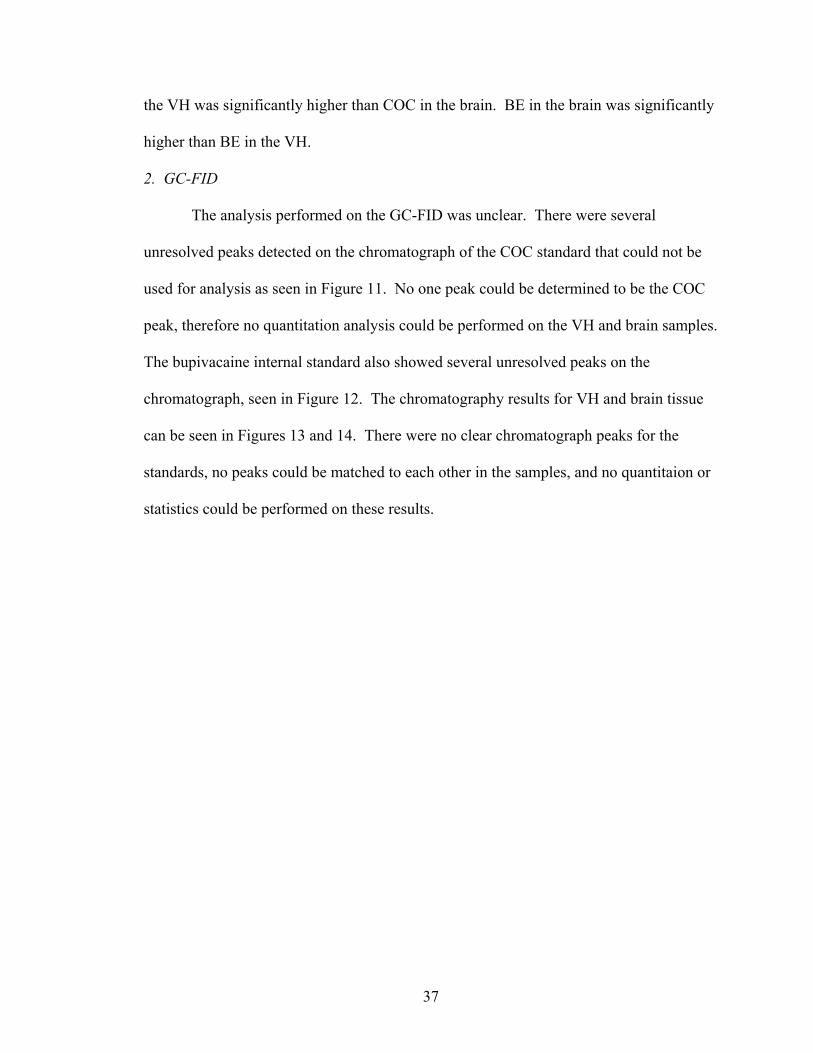
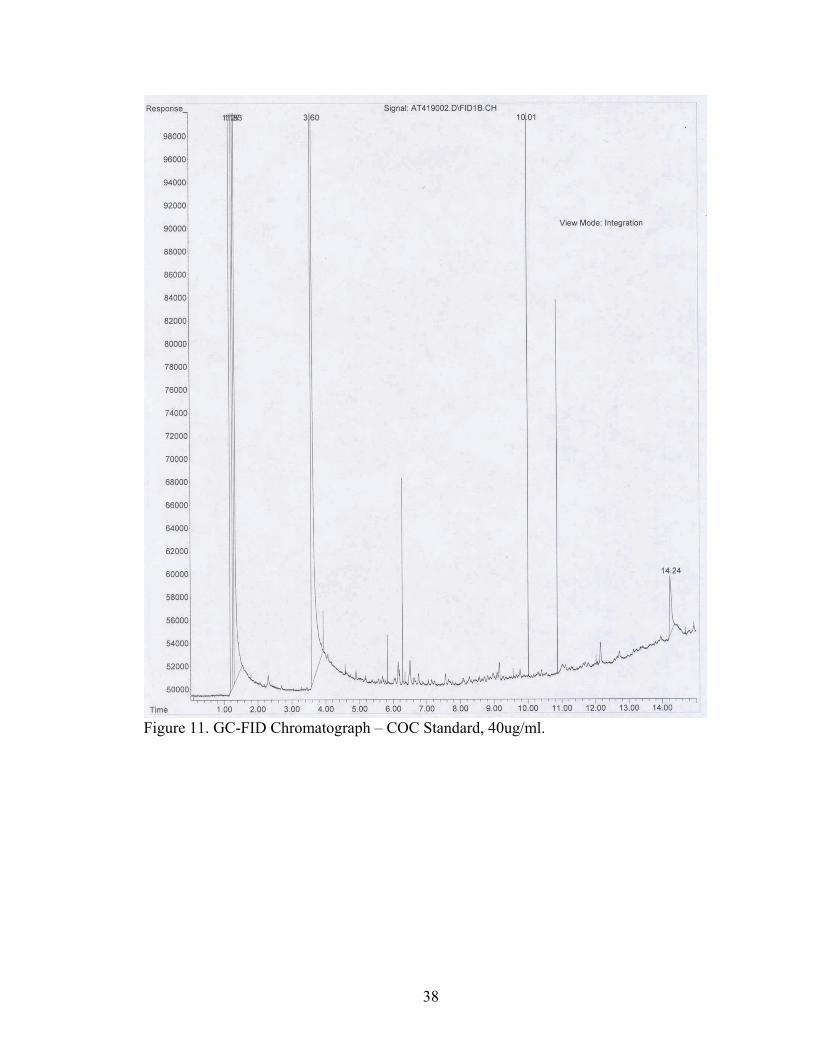
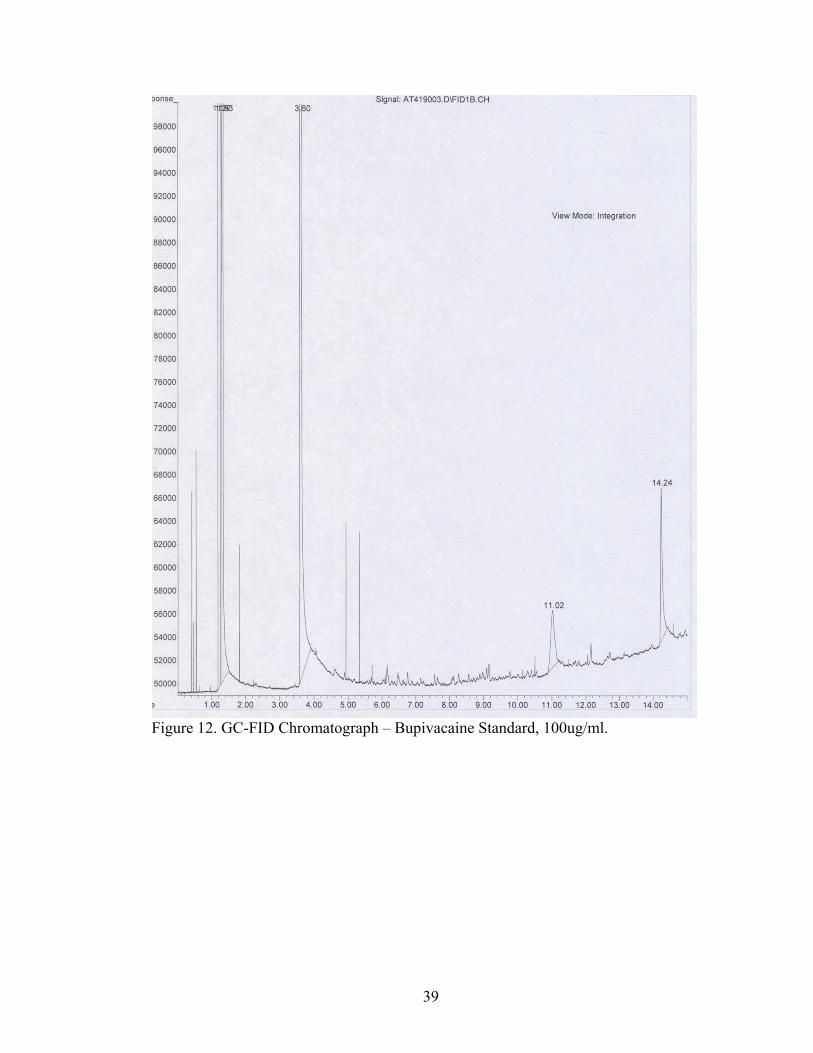
2. GC-FID
The analysis performed on the GC-FID was unclear. There were several
unresolved peaks detected on the chromatograph of the COC standard that could not be
used for analysis as seen in Figure 11. No one peak could be determined to be the COC
peak, therefore no quantitation analysis could be performed on the VH and brain samples.
The bupivacaine internal standard also showed several unresolved peaks on the
chromatograph, seen in Figure 12. The chromatography results for VH and brain tissue
can be seen in Figures 13 and 14. There were no clear chromatograph peaks for the
standards, no peaks could be matched to each other in the samples, and no quantitaion or
statistics could be performed on these results.
38
Figure 11. GC-FID Chromatograph – COC Standard, 40ug/ml.
39
Figure 12. GC-FID Chromatograph – Bupivacaine Standard, 100ug/ml.
40
Figure 13. GC-FID Chromatograph of VH Extraction.
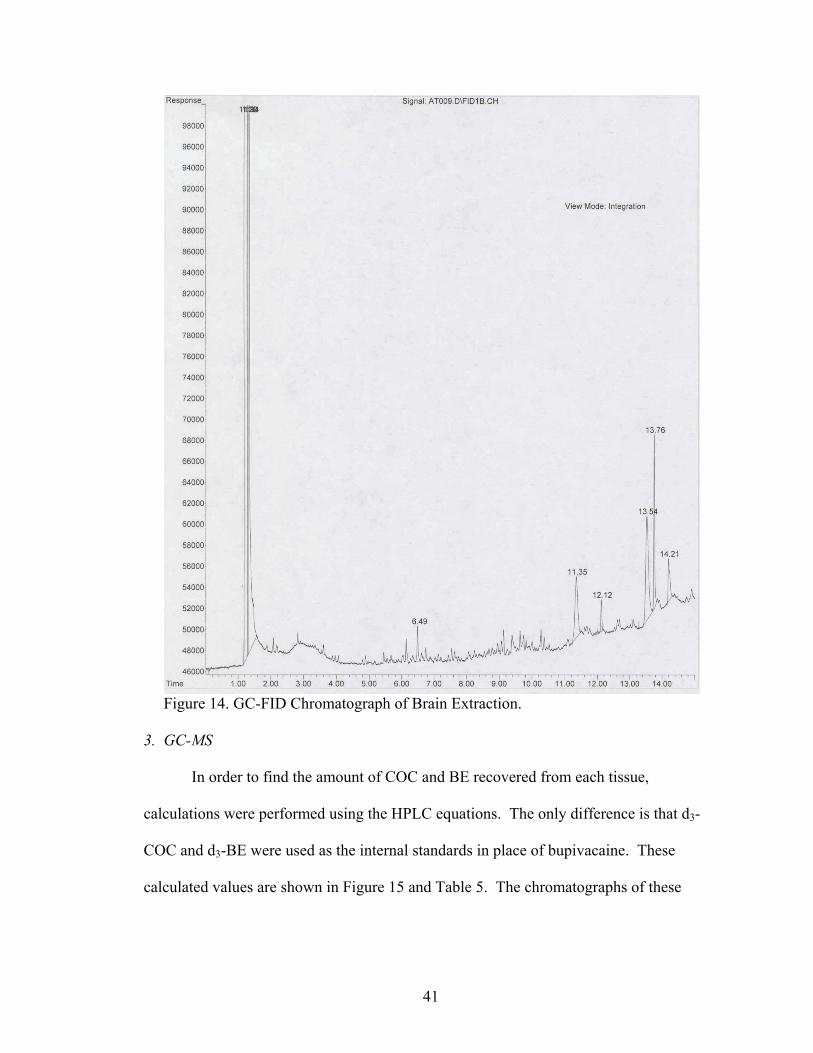
41
Figure 14. GC-FID Chromatograph of Brain Extraction. 3. GC-MS
In order to find the amount of COC and BE recovered from each tissue,
calculations were performed using the HPLC equations. The only difference is that d3-
COC and d3-BE were used as the internal standards in place of bupivacaine. These
calculated values are shown in Figure 15 and Table 5. The chromatographs of these

42
extractions are seen in Figures 16-19. The ratio of the COC standard to the BE standard
was 1.527.
VH Brain0.00.20.40.60.8
COCBE
2.55.07.5
10.0 *#
Tissue
Rec
over
y ( μ
g/m
l)
Figure 15. Analysis Recovery of COC and BE from VH and Brain Tissue on GC-MS. *p<0.05. #p<0.005.
COC VH BE VH COC Brain BE Brain10.766 1.993 0.4452 0.1635
3.5 1.986 0.1546 0.154212.614 1.967 0.3049 0.13292.47 3.803 0.1122 0.1838
Table 5. Calculated Extraction Recoveries of COC and BE by GC-MS. All values are in µg/ml.

43
Figure 16. GC-MS Chromatograph of VH Extraction – COC and COC Ions.
COC
d3-COC
44
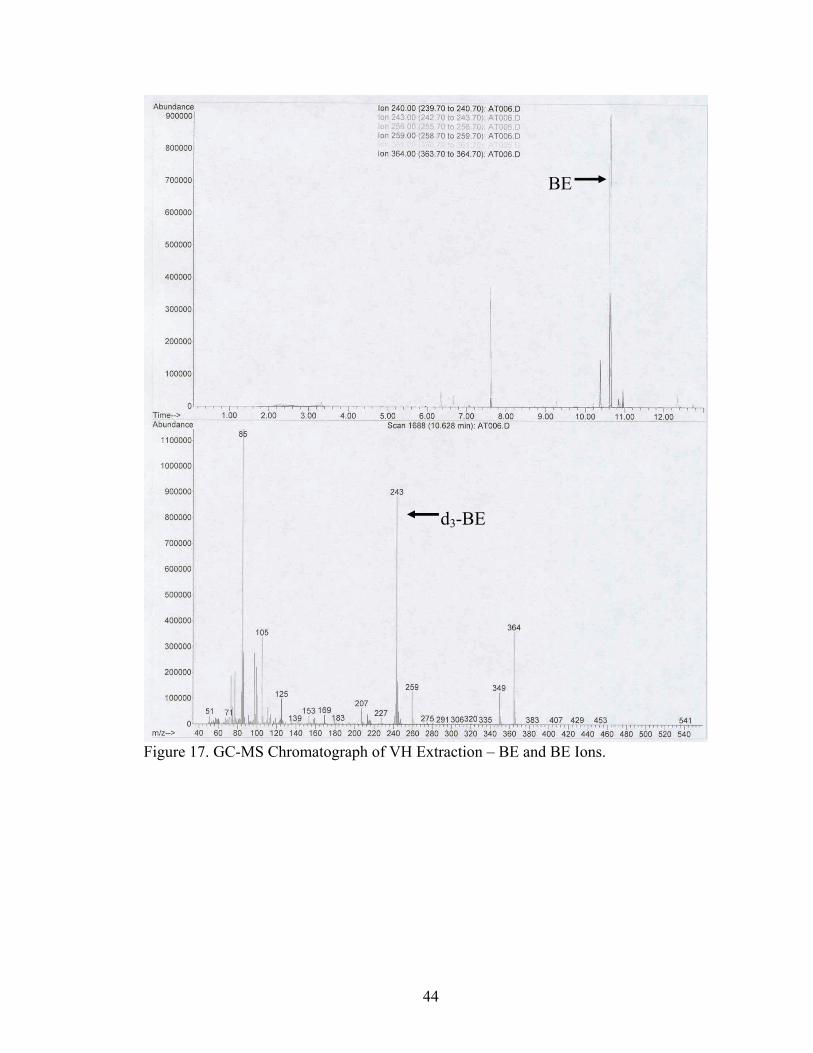
Figure 17. GC-MS Chromatograph of VH Extraction – BE and BE Ions.
BE
d3-BE
45
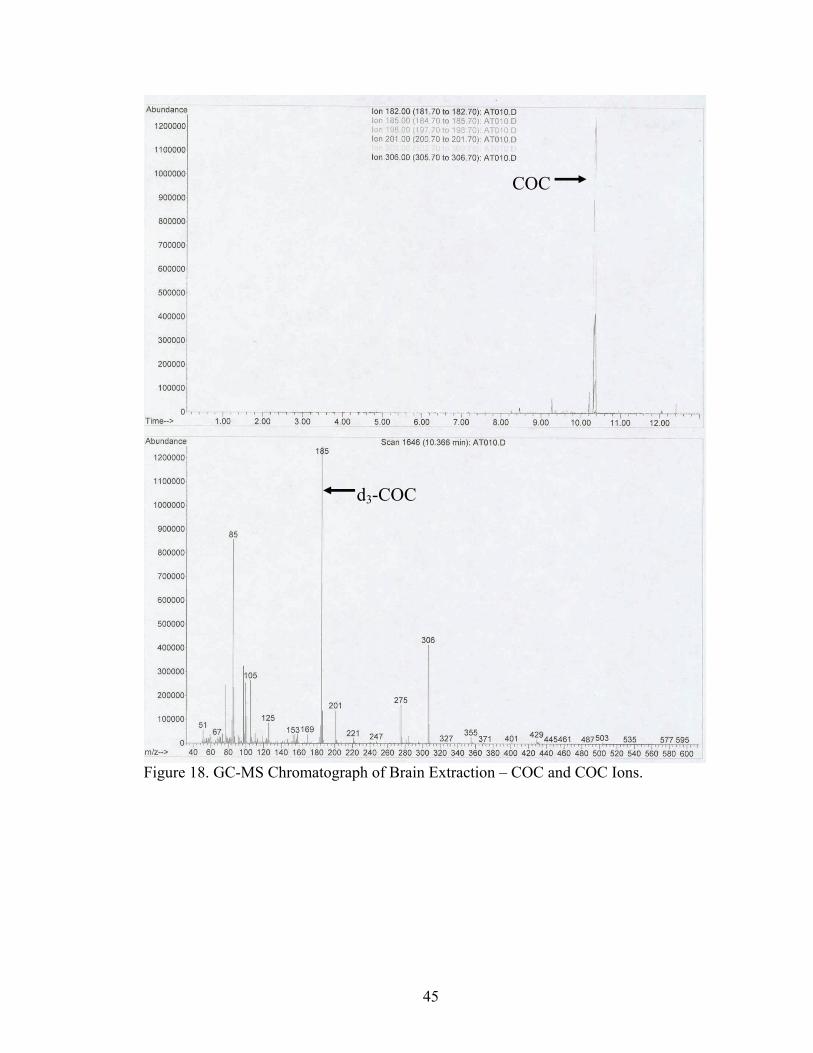
Figure 18. GC-MS Chromatograph of Brain Extraction – COC and COC Ions.
COC
d3-COC
46
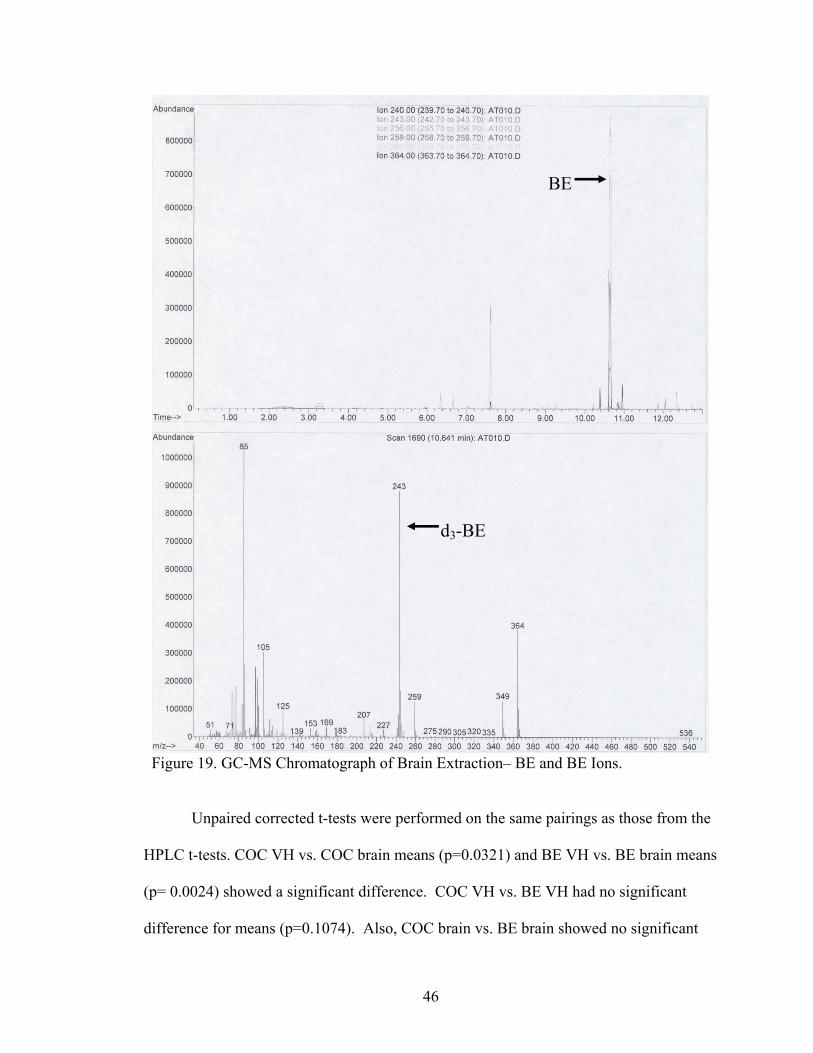
Figure 19. GC-MS Chromatograph of Brain Extraction– BE and BE Ions.
Unpaired corrected t-tests were performed on the same pairings as those from the
HPLC t-tests. COC VH vs. COC brain means (p=0.0321) and BE VH vs. BE brain means
(p= 0.0024) showed a significant difference. COC VH vs. BE VH had no significant
difference for means (p=0.1074). Also, COC brain vs. BE brain showed no significant
d3-BE
BE

47
difference between means (p=0.2586). COC and BE in the VH were significantly higher
than COC and BE values in the brain.
48
IV. Discussion
Cocaine is used widely available and used worldwide. Due to the fact that its
contribution to cause of death is a forensic issue, it was used as the model drug (Stephens
et al., 2004). Frequently, forensic toxicologists are questioned about the role of COC in
cause of death. They must assess the specimens provided to determine antemoretem
levels and the degree to which a drug played a role in the death or impairment if any
(Klingmann et al., 2001). Due to the postmortem changes such as redistribution and
hydrolysis that occur to COC, a rate at which COC metabolizes postmortem has not yet
been found. In order to aid the process of finding a rate at which COC degrades
postmortem, this study was undertaken to find the method to best analyze COC and BE
extracted from VH and brain tissue.
A. HPLC Validation
Each HPLC system as well as the column used for separation is different. The
parameters and mobile phase chosen is dependent on the system, column, and analyte
being separated. Four mobile phases were tested with the HPLC to investigate the
chromatographic separation and level of detection of COC and its metabolite BE. Each
mobile phase was altered in organic strength and pH to aid in this process. Increasing the
acidity of the mobile phase resulted in a slowing of BE elution and a reduction in COC
elution time as indicated by BE shifting to the right of COC on the chromatograph as well
as shifting COC out of the bupivacaine peak. Since COC is slightly basic, the lower pH

49
allowed COC to be retained on the very polar, negatively charged silica packed in the
HPLC column long enough for it to separate from the internal standard, bupivacaine.
The mobile phase used for this study was at pH 3.0 which proved to be the best mobile
phase for drug separation.
B. Assay Validation
Isolation of compounds from biological matrices is an important step in
toxicological testing, which must be both reproducible and reliable (Bogusz et al., 1996).
Mixed phase SPE columns were first commercially introduced in the late 1980’s and now
are proving to be a good method for the pretreatment of samples used for drug analysis.
SPE columns clean the extracts of unwanted contaminants, have reproducible results, and
exhibit high selectivity (Bogusz et al., 1996; Chen et al., 1992).
Bogusz et al, (1996) reported on four different commercial SPE cartridges
concerning extraction efficiency and extract purity. Bond Elut Certify and Narc-2
columns were a part of the study. Bogusz et al, (1996) found that extractions from the
Bond Elut Certify columns were almost free of interference peaks on the HPLC. On the
GC-MS, plasticizer peaks were smaller for the Bond Elut Certify and Narc-2 in
comparison to one of the other cartridges tested, Chromabond MN Drug columns
(Macherey and Nagel, Düren, Germany), (Bogusz et al., 1996). However, SPE does have
some drawbacks. Commercial products like Bond Elut Certify and Narc-2 have
demonstrated low reproducibility in the packing material (Bogusz et al., 1996). Also,
among the same and different lots of products, different recovery percentages and failure
of extraction has been observed (Bogusz et al., 1996). SPE columns also tend to be time
50
consuming and expensive when compared to other extraction methods incorporated in
clinical and toxicological labs.
Narc-2 columns were used for the assay validation to check for separation and
consistency of the columns with four concentrations of both COC and BE standards. The
results of this study were somewhat different than the results found in the Bogusz et al
study (1996). When using the Narc-2 and Bond Elut Certify SPE cartridges, there were
peak interferences seen on the HPLC analysis. A Narc-2 blank showed a peak that co-
eluted with the COC peak and Bond Elut Certify had two peaks, one that co-eluted with
the bupivacaine peak, and one that co-eluted with the COC peak. Even though there
were extraneous peaks observed, linearity of drug concentrations validated the ability of
Narc-2 to separate drugs from biological samples for analysis by HPLC. A blank
extraction with no drug standards was run along with all sample extractions in order to
subtract out the interference peaks seen on HPLC. No interference peaks in a blank
extraction were seen by the GC-MS.
C. Narc-2 and Bond Elut Extractions vs. Hexane Extractions
Liquid-liquid extractions (LLE) are a direct method to extract the target analyte
using only an organic solvent, providing an inexpensive and simple method for drug
isolation. LLE and SPE are frequently done by laboratories to clean up and prepare a
sample for analysis. These extractions are incorporated since they are inexpensive and
not time consuming. These types of extractions are mainly done for identification
purposes due to the usual low recovery percentages (Farina et al., 2002; Garside et al.,
1997). LLE are frequently used in toxicological analysis since blood and urine are
specimens looked at for drug determinations and these specimens can be easily

51
partitioned with an organic solvent. Solvent polarity and pH are factors are important
considerations when performing LLE. Solvents like chloroform, toluene, ethyl ether,
acetone, and hexane are frequently used for LLE. Narc-2 SPE columns were compared
to LLE using hexane, an organic solvent, to see which extraction method was best for this
study. Hexane was found to be a very simple, quick, but crude method of extraction. It
showed low recovery percentages and it was decided it can be used for simple
identification but not for quantification purposes. Both Narc-2 and Bond Elut SPE
cartridges proved to be good for separating COC from VH and brain to produce relevant
amounts. Since these cartridges showed good extraction recoveries, this study used Bond
Elut for extractions. The percent recovered for Narc-2 columns (bupivacaine, 94.07%)
outweighed the time consumption and expense since hexane extractions showed low
recovery percentages (bupivacaine, 23.65%).
D. Narc-2 Column Variability and Time Course Variability
The variability in recovery seen by Bogusz et al (1996) between columns from the
same lots prompted us to run four different extractions to test for variability. Since these
columns are disposable and can only be used once for each extraction, this was an
important step to make sure there was no effect introduced between columns. An assay
validation was run on four separate columns of the same batch to ensure that there was no
variability among the SPE cartridges used for this study. We found that these columns
can be used for analysis with confidence since no significant variability will be
introduced due to column effect. From the same four columns used for the column
variability test, a time course was performed on the eluents to ensure there was no COC
degradation post-extraction. Data analysis showed there was no effect of time post
52
elution on peak height of a COC standard. Lack of a time effect on COC peak height
indicates the sample could be analyzed up to 120 minutes after SPE with no degradation
of COC in the sample and no loss of sensitivity. Therefore, these columns could be used
for extraction purposes with no effect introduced due to column and the eluent produced
could be analyzed up to 2 hours following extraction with confidence of no loss of
sample.
E. Chromatography
The analytical tool of choice is dependent on the question being asked and the
problem being solved (Maurer, 2005a). The analytical methods used for determining
unknown drugs in alternative specimens, i.e. VH, usually employ traditional techniques
like GC-MS. But there are limitations due to small sample volume/mass seen in these
alternative specimens or target analyte may react differently compared to traditional
specimens used in toxicological analysis (Wood et al., 2005). This study compared three
analytical methods for sensitivity and specificity in each tissue.
When results must be confirmed, GC-MS is the most widely used application.
For high throughput screening, methods like thin layer chromatography, HPLC, and
electrokinetic techniques can be used. Even so, GC-MS is still widely used for that type
of screening (Maurer, 2005a). HPLC was a method of choice for comparison in the
present study because of advantages over GC-MS, that include lower costs and the lack
for a derivatization step prior to analysis (Phillips et al., 1996). Even though GC-MS is
the most widely used confirmatory toxicological test, HPLC is beginning to be more
widely used alternative because of these advantages (Fernandez et al., 2005). GC-MS
and liquid chromatography-mass spectrometry (LC-MS) are sensitive methods for the
53
analysis of COC, but HPLC is more affordable and has been shown to successfully
determine and quantitate COC and its metabolites (Jamdar et al., 2000). HPLC is also
becoming more common even though GC-MS offers more sensitivity and is less
susceptible to matrix interferences in comparison to HPLC (Phillips et al., 1996). LC-MS
is emerging as an important tool for quantification and routine analysis (Maurer, 2005a).
LC-MS has already been shown to determine COC, opiates, amphetamines, and LSD in
plasma and is a good complement to GC-MS for quantification purposes (Concheiro et
al., 2006; Maurer, 2005a). LC-MS demonstrates high specificity, short chromatography
run times, and has the potential to reduce extensive sample preparation since it does not
require derivatization. These points are making LC-MS emerge as a useful analytical
tool for high-output confirmatory tests of drugs of abuse (Wood et al., 2005). Jeanville et
al (2001) report that HPLC and HPLC-MS require extensive sample clean-up; while GC-
MS analysis also requires same clean-up and a derivatization step. Their study employed
SPE methods to minimize time spent on sample clean-up to then be used on these
traditional analytical methods (Jeanville et al., 2001). This current study also employs
the use of SPE for sample clean-up prior to analysis to aid in proper detection of COC
and BE.
1. HPLC
HPLC was used because of the aforementioned reasons, lower cost and less
sample preparation. HPLC detected COC in the VH and brain and BE in the brain. It
was not able to detect BE in the VH, due to either the amount of BE in the VH fell below
the HPLC level of detection (~100ng/ml) or low enzymatic activity in the VH caused
incomplete metabolism of COC. The latter conclusion could have important implications
54
regarding use of VH. If the COC entering the VH via the blood-retina barrier does not
undergo metabolism rapidly like it does in the brain or blood and is not subject to
postmortem redistribution, the VH could be a compartment model for establishing a rate
at which COC metabolizes. Once a rate is found, VH can then be used for indicating
antemortem levels of the drug detected. Mackey-Bojack et al, (2000) reported that VH is
useful for quantification of COC and its metabolites. Drug levels were substantial
enough and had a strong correlation with blood to report that VH is an alternative
specimen for postmortem analysis if blood is unavailable (Mackey-Bojack et al., 2000).
Benzoylecgonine detected in the brain was significantly higher than COC brain
levels suggesting brain metabolism of COC. COC is able to rapidly enter the brain via
passive diffusion through the BBB. It then is metabolized due to the abundant amount of
enzymes in the brain. BE is unable to cross the BBB, therefore, any observed in the brain
is due to the metabolism of COC that entered the brain (Kalasinsky et al., 2000).
Because COC can be completely metabolized in the brain to its metabolites, it may not be
as good as good a compartment model as VH when looking at a postmortem metabolism
rate. However, it was able to be analyzed by HPLC following SPE with adequate levels
of COC and BE present in the sample.
2. GC-FID
Gas chromatography-flame ionization detection has previously shown to analyze
COC and its metabolites in VH, bile, blood, and urine (Fernandez et al., 2004; Fernandez
et al., 2006). As opposed to using the more sensitive GC tool coupled with MS or
another common type of analytical tool, HPLC, Fernandez et al (2006) chose to develop a
55
method for GC-FID. This study followed the similar procedures and conditions with
only a few modifications (Fernandez et al., 2004, 2006).
The chromatographic conditions of the oven temperature, injector temperature,
and carrier gas of this study were the same as Fernandez et al (2006). The total run time
and internal standard used were two differences between this study and Fernandez et al
study (2006). Their total run time was almost 22 minutes compared to 15 minutes for
this study. This change in method was because the Fernandez et al study (2006) reported
that COC and BE had retention times of less than 15 minutes. This study chose
bupivacaine as the internal standard after a literature review. The internal standard used
by Fernandez et al (2006), proadifen, was not come across in the brief literature search.
Even though this study was not able to determine a COC or bupivacaine peak
based on GC-FID analysis, Fernandez et al (2006) determined that in VH, COC was seen
at higher concentrations when compared to BE and EME. These results are similar to our
findings on the HPLC and GC-MS, but no analysis or calculations could be performed on
the GC-FID because of lack of resolution of peaks. Both the Fernandez et al studies
(2004; 2006) were able to show a method for analyzing COC and its metabolites on a
GC-FID, but this study is not able to say that COC can be detected by GC-FID. It is not
clear why we were unable to properly detect COC, BE, and bupivacaine. This analytical
method should be looked at again for analysis of COC and BE from VH and brain to see
if the results are similar to what was observed with the HPLC and GC-MS.
3. GC-MS
Due to the fact that forensic analysis must be reliable with methods employed
showing high sensitivity in order to detect small amounts of substances in matrices
56
analyzed, GC-MS is the most widely used analytical method to identify compounds
(Maurer, 2005). Quantification of drugs and corresponding metabolites by analytical
methods is a major part in interpretation of the data. The level of detection is important
in interpreting the data as well. Level of detection is described as the smallest amount of
drug able to be distinguished from the noise level (Bressolle et al., 1996). The level of
detection of the GC-MS in our study was approximately 25ng/ml (Mark Boese, personal
communication), which is four times more sensitive when compared to the level of
detection of HPLC in this study. Since our GC-MS was more sensitive than the HPLC in
relation to level of detection, BE was detected in the VH. Both COC VH and BE VH
were significantly higher than COC brain and BE brain. COC concentrations in the VH
compared to the brain may be different due to the barriers for each. Even though both the
VH and brain have similar barriers that only let some molecules pass, higher COC
concentrations in the VH may be due to allowance of COC to pass more freely in
comparison to the brain. As previously mentioned, since BE cannot pass through the
BBB and the VH barrier, and any BE seen in these matrices is resulting from COC
metabolism, more BE in the VH compared to the brain may also be due to allowance of
more COC into the VH (Kalasinsky et al., 2000). Stewart and Tuor (1994) reported that
after using a vascular tracer in the rat eye and brain, the tracer amount found in the retina
compared to the brain was almost four times in comparison in the same animal.
Structurally, the retina has a high density of junctions and endothelial vesicles,
allowing for vascular permeability. The blood-retina barrier allows for more molecules
to cross, making it almost as effective as the BBB (Stewart and Tuor, 1994). The BBB
has a network of tight junctions formed by transmembrane proteins that deny free
57
diffusion across the membrane. The BBB only allows for active transport or small,
lipophilic molecules to enter the brain (Alavijeh et al., 2005). Since COC is able to enter
the VH, the amount of BE seen in VH may be due to spontaneous or chemical hydrolysis
of COC occurring that was detected by GC-MS but not by HPLC.
Even though the results of GC-MS analysis have lower absolute values of
recovered COC and BE when compared to the absolute values of HPLC, these values
cannot be compared statistically since they are two separate means of analysis. Since
GC-MS was four times more sensitive than HPLC, it allowed for a smaller concentration
to be detected compared to background noise. GC-MS drug levels may look lower in
absolute terms when comparing to HPLC, but in terms of which method is better for
analyzing COC and BE from VH and brain, GC-MS gave the best detection and relevant
amounts seen in the tissues based on greater sensitivity.
The derivatization step applied to GC analysis has not been looked at as a likely
area for error in analysis. The possibility of incomplete derivatization could be a factor
since any difficulty with this extra preparation step is also applied to the ISTD. But,
when comparing to another analytical method, this may become a factor in the different
recovery concentrations.
Since statistics cannot be applied when comparing the COC and BE values
between GC-MS and HPLC, no statistical analysis was run between the two methods.
Both the HPLC and GC-MS were able to detect COC and its major metabolite BE, and
therefore lead to the calculation of relevant amounts in the VH and brain. Phillips et al
(1996) compared HPLC and GC-MS for the analysis of COC in urine. They were able to
say that HPLC was more precise for determining COC and GC-MS was more precise for
58
determining its metabolites. This could be why we see BE in the VH with the GC-MS
and not with the HPLC. Observing BE in VH with GC-MS may be due to GC-MS being
a more sensitive analytical tool than HPLC. They also state that HPLC can be used as a
legitimate analysis method for some analytes (Phillips et al., 1996). HPLC was
successful in the analysis of COC, BE, norcocaine, and EME extracted from plasma and
urine based on a study by Jamdar et al (2000). This study cannot state that one analytical
method is better than the other statistically, but it does agree with Phillips et al (1996) in
that the HPLC method requires less pretreatment of samples before analysis since
samples run on GC-MS and GC-FID must be derivatized. This study also agrees with the
Jamdar et al study (2000) in that COC and BE could analyzed by HPLC methods. Even
though GC-MS is the benchmark for analysis and identification of unknown substances
in the forensic laboratory, this study showed that HPLC and GC-MS were able to detect
and calculate adequate levels of COC and BE. Since HPLC is lower in cost than a GC-
MS system, many forensic institutions might be able to afford HPLC and still be able to
properly detect several drugs like COC, leading to quantification of that drug (Phillips et
al., 1996).
Based on the collective results of this study, the research question was not
completely answered. HPLC and GC-MS allowed for the detection of COC and BE in
VH and brain tissue, but GC-FID showed unclear chromatographs which could not be
used for analysis of drugs detected. GC-MS was the best analytical tool in this study
based on the lower sensitivity of the instrument compared to HPLC. Both GC-MS and
HPLC detected COC and BE leading to calculations of relevant amounts observed in the
respective tissue. A rate could not be established since a postmortem time course study
59
was not done. However, this study has set the stage for future studies looking at rate by
narrowing down the compartment to be looked at, which is VH.
F. Future Directions
Since we were able to observe that both HPLC and GC-MS were able to detect
and calculate relevant amounts COC and BE in the VH and brain, the next step would be
to look at postmortem degradation of COC in VH and brain. A time course study should
be implemented by subjecting the animal model after euthanization to a set a time course
study and look at the rate of degradation at set time points. It will be interesting to see
how and if the ratios of COC to BE change over time postmortem especially in the VH,
since it is a unique compartment in the body with low enzymatic activity. A temperature
study should also be implemented. The animal model could be subjected to different
temperatures along with the time points. Since it is known that the refrigeration or
freezing process slows hydrolysis of COC, it would be interesting to look at the ratios of
COC to BE at different time points as well as at different temperatures (Cingolani et al.,
2004). All of these studies could be observed by either HPLC or GC-MS analysis.
60
Bibliography: 2003 National Survey on Drug Used and Health (NSDUH). Rockville, MD, US US Department of Health and Human Services, Substance Abuse and Mental Health Services Administration, National Institute on Drug Abuse, 2004. Alavijeh, M.S., Chishty, M., Zeeshan Qaiser, M., & Palmer, A.M. (2005). Drug metabolism and pharmacokinetics, the blood-brain barrier, and central nervous system drug discovery. Journal of American Society for Experimental Neurotherapeutics, 2, 554-571. Anderson, S.M. & Pierce, R.C. (2005). Cocaine-induced alterations in dopamine receptor signaling: Implications for reinforcement and reinstatement. Pharmacology & Therapeutics, 106, 389-403. Bannon, M.J. (2005). The dopamine transporter: role in neurotoxicity and human disease. Toxicology and Applied Pharmacology, 204, 355-360. Benowitz, N.L. (1993). Clinical pharmacology and toxicology of cocaine. Pharmacology & Toxicology, 72, 3-12. Billman, G.E. (1990). Mechanisms responsible for the cardiotoxic effects of cocaine. Federation of American Societies for Experimental Biology Journal, 4, 2469-2475. Bogusz, M.J., Maier, R.-D., Schiwy-Bochat, K.-H., & Kohls, U. (1996). Applicability of various brands of mixed-phase extraction columns for opiate extraction from blood and serum. Journal of Chromatography B, 683, 177-188. Bressolle, F., Bromet-Petit, M., & Audran, M. (1996). Validation of liquid chromato- graphic and gas chromatographic methods applications to pharmacokinetics. Journal of Chromatography B, 686, 3-10. Buttner, A., Mall, G., Penning, R., Sachs, H., & Weis, S. (2003). The neuropathology of cocaine abuse. Legal Medicine, 5, S240-S242. Carrera, M.R.A., Meijler, M.M., & Janda, K.D. (2004). Cocaine pharmacology and current pharmacotherapies for its abuse. Bioorganic & Medicinal Chemistry, 12, 5019-5030.
61
Chen, X.-H., Wijsbeek, J., Franke, J.-P., & de Zeeuw, R.A. (1992). A single-column procedure on Bond Elut Certify for systematic toxicological analysis of drugs in plasma and urine. Journal of Forensic Sciences, 37, 61-71. Cingolani, M., Cippitelli, M., Froldi, R., Gambaro, V., & Tassoni, G. (2004). Detection and quantitation analysis of cocaine and metabolites in fixed liver tissue and formalin solutions. Journal of Analytical Toxicology, 28, 16-19. Clauwaert, K.M., Van Bocxlaer, J.F., De Letter, E.A., Van Calenbergh, S., Lambert, W.E., & De Leenheer, A.P. (2000). Determination of the designer drugs 3,4- methylenedioxymethamphetamine, 3,4-methylenedioxyethylamphetamine, and 3,4- methylenedioxyamphetamine with HPLC and fluorescence detection in whole blood, serum, vitreous humor, and urine. Clinical Chemistry, 46, 1968-1977. Concheiro, M., de Castro, A., Quintela, O., Lopez-Rivadulla, M., & Cruz, A. (2006). Determination of drugs of abuse and their metabolites in human plasma by liquid chromatography-mass spectrometry an application to 156 road fatalities. Journal of Chromatography B, 832, 81-89. Cook, D.S., Braithwaite, R.A., & Hale, K.A. (2000). Estimating antemortem drug concentrations from postmortem blood samples: the influence of postmortem redistribution. Journal of Clinical Pathology, 53, 282-285. Daws, L.C., Callaghan, P.D., Moron, J.A., Kahlig, K.M., Shippenberg, T.S., Javitch, J.A., & Galli, A. (2002). Cocaine increases dopamine uptake and cell surface expression of dopamine transporters. Biochemical and Biophysical Research Communications, 290, 1545-1550. Drummer, O.H. (2004). Postmortem toxicology of drugs of abuse. Forensic Science International, 142, 101-113. Drummer, O.H. & Gerostamoulos, J. (2002). Postmortem drug analysis: analytical and toxicological aspects. Therapeutic Drug Monitoring, 24, 199-209. Farina, M., Yonamine, M., & Silva, O.A. (2002). One-step liquid-liquid extraction of cocaine from urine samples for gas chromatographic analysis. Forensic Science International, 127, 204-207. Fernandez, P., Aldonza, M., Bouzas, A., Lema, M., Bermejo, A.M., & Tabernero, M.J. (2006). GC-FID determination of cocaine and its metabolites in human bile and vitreous humor. Journal of Applied Toxicology, 26, 253-257. Fernandez, P., Bujan, L., Bermejo, A.M., & Tabernero, M.J. (2004). Gas chromatographic determination of cocaine and its metabolites in blood and urine from cocaine users in northwestern Spain. Journal of Applied Toxicology, 24, 283- 287.
62
Fernandez, P., Vazquez, C., Morales, L., & Bermejo, A.M. (2005). Analysis of opiates, cocaine and metabolites in urine by high-performance liquid chromatography with diode array detection (HPLC-DAD). Journal of Applied Toxicology, 25, 200-204. Garside, D., Goldberger, B.A., Preston, K.L., & Cone, E.J. (1997). Rapid liquid-liquid extraction of cocaine from urine for gas chromatographic-mass spectrometric analysis. Journal of Chromatography B, 692, 61-65. Harvey, J.A. (2004). Cocaine effects on the developing brain: current status. Neuroscience and Biobehavioral Reviews, 27, 751-764. Hearn, W.L., Keran, E.E., Wei, H., & Hime, G. (1991). Site-dependent postmortem changes in blood cocaine concentrations. Journal of Forensic Sciences, 36, 673- 684. Hilberg, T., Bugge, A., Beylich, K-M., Ingum, J., Bjorneboe, A., & Morland, J. (1993). An animal model of postmortem amitriptyline redistribution. Journal of Forensic Sciences, 38, 81-90. Itzhak, Y., Martin, J.L., Black, M.D., Ali, S.F. (1999). Effect of the dopaminergic neurotoxin MPTP on cocaine-induced locomotor sensitization. Pharmacology, Biochemistry, and Behavior, 63, 101-107. Jamdar, S.C., Pantuck, C.B., Diaz, J., & Mets, B. (2000). A rapid, sensitive assay for cocaine and its metabolites in biological fluids using solid-phase extraction and high- performance liquid chromatography. Journal of Analytical Toxicology, 24, 438-441. Jeanville, P.M., Estape, E.S., Torres-Negron, I., & Marti, A. (2001). Rapid confirmation/quantitation of ecgonine methyl ester, benzoylecgonine, and cocaine in urine using on-line extraction coupled with fast HPLC and tandem mass spectrometry. Journal of Analytical Toxicology, 25, 69-75. Jenkins, A.J., Levine, B., Titus, J., & Smialek, J.E. (1999). The interpretation of cocaine and benzoylecgonine concentrations in postmortem cases. Forensic Science International, 101, 17-25. Kahlig, K.M. & Galli, A. (2003). Regulation of dopamine transporter function and plasma membrane expression by dopamine, amphetamine, and cocaine. European Journal of Pharmacology, 479, 153-158. Kalasinsky, K.S., Bosy, T.Z., Schmunk, G.A., Ang, L., Adams, V., Gore, S.B., Smialek, J., Furukawa, Y., Guttman, M., & Kish, S.J. (2000). Regional distribution of cocaine in postmortem brain of chronic human cocaine users. Journal of Forensic Sciences, 45, 1041-1048.
63
Kalivas, P.W. (2004). Glutmate systems in cocaine addiction. Current Opinion in Pharmacology, 4, 23-29. Karch, S.B. (1991). Introduction to the forensic pathology of cocaine. The American Journal of Forensic Medicine and Pathology, 12, 126-131. Karch, S.B., Stephens, B., & Ho, C-H. (1998). Relating cocaine blood concentrations to toxicity – an autopsy study of 99 cases. Journal of Forensic Sciences, 43, 41-45. Klingmann, A., Skopp, G., & Aderjan, R. (2001).Analysis of cocaine, benzoylecgonine, ecgonine methyl ester, and ecgonine by high-pressure liquid chromatography-API mass spectrometry and application to a short-term degradation study of cocaine in plasma. Journal of Analytical Toxicology, 25, 425-430. Kloner, R.A., Hale, S., Alker, K., & Rezkalla, S. (1992). The effects of acute and chronic cocaine use on the heart. Circulation, 85, 407-419. Knuepfer, M.M. (2003). Cardiovascular disorders associated with cocaine use: myths and truths. Pharmacology & Therapeutics, 97, 181-222. Levine, B. (Ed.). (2003). Principles of Forensic Toxicology, 2nd Ed. (Ch. 13) Washington, DC: AACC Press. Lewis, R.J., Johnson, R.D., Angier, M.K., & Ritter, R.M. (2004). Determination of cocaine, its metabolites, pryolysis products, and ethanol adducts in postmortem fluids and tissues using Zymark® automated solid-phase extraction and gas chromatography-mass spectrometry. Journal of Chromatography B, 806, 141-150. Mackey-Bojack, S., Kloss, J., & Apple, F. (2000). Cocaine, cocaine metabolite, and ethanol concentrations in postmortem blood and vitreous humor. Journal of Analytical Toxicology, 24, 59-65. Maurer, H.H. (2005a). Advances in analytical toxicology: the current role of liquid chromatography-mass spectrometry in drug quantification in blood and oral fluid. Analytical and Bioanalytical Chemistry, 381,110-118. Maurer, H.H. (2005b). Multi-analyte procedures for screening for and quantification of Drugs in blood, plasma, or serum by liquid chromatography-single stage or tandem Mass spectrometry (LC-MS or LC-MS/MS) relevant to clinical and forensic Toxicology. Clinical Biochemistry, 38, 310-318. Mittleman, R.E., & Wetli, C.V. (1987). Cocaine and sudden “natural” death. Journal of Forensic Sciences, 32, 11-19. Moeller, M.R. & Kramer, T. (2002). Drugs of abuse monitoring in blood for control of driving under the influence of drugs. Therapeutic Drug Monitoring, 24, 210-221.
64
Moeller, M.R., Steinmeyer, S., & Kraemer, T. (1998). Determination of drugs of abuse in blood. Journal of Chromatography B, 713, 91-109. Moriya, F., & Hashimoto, Y. (1999). Redistribution of basic drugs into cardiac blood from surrounding tissues during early-stages postmortem. Journal of Forensic Sciences, 44, 10-16. Mortensen, O.V. & Amara, S.G. (2003). Dynamic regulation of the dopamine transporter. European Journal of Pharmacology, 479, 159-170. Muller, C.P. & Huston, J.P. (2006). Determining the region-specific contributions of 5- HT receptors to the psychostimulant effects of cocaine. Trends in Pharmacological Sciences, 27, 105-112. Nader, M.A. & Czoty, P.W. (2005). PET imaging of dopamine D2 receptors in monkey models of cocaine abuse: genetic predisposition versus environmental modulation. The American Journal of Psychiatry, 162, 1473-1482. Pelissier-Alicot, A.L., Gaulier, J.M., Champsaur, P., & Marquet, P. (2003). Mechanisms underlying postmortem redistribution of drugs: a review. Journal of Analytical Toxicology, 27, 533-544. Perper, J.A. & Van Thiel, D.H. (1992). Respiratory complications of cocaine abuse. Recent Developments in Alcoholism, 10, 363-377. Phillips, D.L., Tebbett, I.R., & Bertholf, R.L. (1996). Comparison of HPLC and GC-MS for measurement of cocaine and metabolites in human urine. Journal of Analytical Toxicology, 20, 305-308. Scott, K.S. & Oliver, J.S. (2001). The use of vitreous humor as an alternative specimen to whole blood for the analysis of benzodiazepines. Journal of Forensic Sciences, 46, 694-697. Siegel, G.J., Agranoff, B.W., Albers, R.W., Fisher, S.K., & Uhler, M.D. (Eds.). (1999). Basic Neurochemistry Molecular, Cellular, and Medical Aspects. (p. 252). New York: Lippincott, Williams, & Wilkins. Spiehler, V.R., & Reed, D. (1985). Brain concentrations of cocaine and benzoylecgonine in fatal cases. Journal of Forensic Sciences, 30, 1003-1011. Stephens, B.G., Jentzen, J.M., Karch, S., Mash, D.C., & Wetli, C.V. (2004). Criteria for the interpretation of cocaine levels in human biological samples and their relation to the cause of death. The American Journal of Forensic Medicine and Pathology, 25, 1-10.
65
Stewart, P.A. & Tuor, U.I. (1994). Blood-eye barriers in the rat: correlation with ultra- structure and function. Journal of Comparative Neurology, 340, 566-576. Stokes, A.H., Lewis, D.Y., Lash, L.H., Jerome, Jerome, W.G. 3rd, Grant, K.W., Aschner, M., & Vrana, K.E. (2000). Dopamine toxicity in neuroblastoma cells: role of glutathione depletion by L-BSO and apoptosis. Brain Research, 858, 1-8. Strickland, T.L., Mena, I., Villanueva-Meyer, J., Cummings, J., Mehringer, C.M., Satz, P., & Myers, H. (1993). Cerebral Perfusion and neuropsychological consequences of Chronic cocaine use. The Journal of Neuropsychiatry and Clinical Neurosciences, 5, 419-427. Tashkin, D.P. (2001). Airway effects of marijuana, cocaine, and other inhaled illicit Agents. Current Opinion in Pulmonary Medicine, 7, 43-61. Teixeira, H.M., Reis, F., Proenca, P., Ramos, P., Quintela, O., Lopez-Rivadulla, M., Marques, E., & Vieira, D.N. (2004). Vitreous humor as a complementary sample to blood for the detection/confirmation of diazepam: antemortem and postmortem studies in an animal model. Human & Experimental Toxicology, 23, 571-577. Verstraete, A.G. (2004). Detection times of drugs of abuse in blood, urine, and oral fluid. Therapeutic Drug Monitor, 26, 200-205. Wood, M., Laloup, M., Ramirez Fernandez, M. del M., Jenkins, K.M., Young, M.S., Ramaekers, J.G., De Boeck, G., & Samyn, N. (2005). Quantitative analysis of multiple illicit drugs in preserved oral fluid by solid-phase extraction and liquid chromatography-tandem mass spectrometry. Forensic Science International, 150, 227-238. Yu, R.C-T., Lee, T-C., Wang, T.C., & Li, J-H. (1999). Genetic toxicity of cocaine. Carcinogenesis, 20, 1193-1199.
VITA
Adrea R. Tiller
Candidate for the Degree of
Master of Science
Thesis: COMPARISON OF HPLC-UV, GC-FID, AND GC-MS FOR THE ANALYSIS OF COCAINE AND BENZOYLECGONINE FROM VITREOUS HUMOR AND BRAIN TISSUE Major Field: Forensic Science Biographical: Personal Data: born in Augusta, KS on November 11, 1980, the daughter of Allen and Margaret Tiller. Education: Received Bachelor of Science in Biology from Lenoir-Rhyne College, Hickory, NC in May, 2003. Completed the requirements for the Master of Science degree with a major in Forensic Science at Oklahoma State University in July 2006.
Name: Adrea Tiller Date of Degree: July, 2006 Institution: Oklahoma State University Location: Tulsa, Oklahoma Title of Study: COMPARISON OF HPLC-UV, GC-FID, AND GC-MS FOR THE ANALYSIS OF COCAINE AND BENZOYLECGONINE FROM VITREOUS HUMOR AND BRAIN TISSUE Pages of Study: 65 Candidate for the Degree of Master of Science Major Field: Forensic Science Scope and Method of Study: A rate at which cocaine metabolizes postmortem has not yet been established. Factors such as postmortem environment, metabolism, and redistribution have given rise to complications in extrapolating antemortem drug levels from postmortem findings. The purpose of this study is to look at in vivo cocaine metabolism in vitreous humor and brain tissue of male Sprague-Dawley
rats 4-6 months of age employing the use of three analytical methods. Rats were injected with 15mg/kg cocaine (IP), euthanized, and vitreous humor and the dorsal and ventral striatal areas of the brain were collected for analysis. Solid-phase extractions on Bond Elut Certify (Varian, Palo Alto, CA) were done to prepare the samples for analysis. Samples were run on HPLC-UV, GC-FID, and GC-MS and calculations were done to determine if adequate levels of cocaine and benzoylecgonine were seen in vitreous humor and brain. This allowed for direct comparison of sensitivity and quantitative analysis from three analytical methods simultaneously.
Findings and Conclusions: HPLC detected cocaine in vitreous humor and brain and benzoylecgonine in the brain. Either benzoylecgonine levels in vitreous humor fell below the level of detection (~100ng/ml) or low enzymatic activity caused
incomplete metabolism of cocaine. Incomplete metabolism of cocaine in the vitreous humor may warrant the use of vitreous humor as a compartment for establishing a rate of postmortem metabolism. Analysis on GC-FID showed several unresolved peaks and levels of cocaine and benzoylecgonine could not be determined. GC-MS detected cocaine and benzoylecgonine in the vitreous humor and brain. The level of detection for GC-MS was ~25ng/ml, four times more sensitive than HPLC. There was a significant difference, p<0.05, between the means of cocaine in vitreous humor and cocaine in brain. There was also a significant difference, p<0.05, between benzoylecgonine in vitreous humor and benzoylecgonine in brain. Since GC-MS was able to detect cocaine and benzoylecgonine in both tissues, future studies to establish a rate of cocaine metabolism postmortem should employ the use of GC-MS for analysis of cocaine metabolism in the vitreous humor.
Advisors Approval: Dr. David Wallace _