comparing ignorance: imagined immigration and the
TRANSCRIPT
Societies Without Borders Societies Without Borders
Volume 12 Issue 2 Article 9
February 2021
Comparing Ignorance: Imagined Immigration and the Exclusion of Comparing Ignorance: Imagined Immigration and the Exclusion of
Migrantsin the U.S. and Western Europe Migrantsin the U.S. and Western Europe
Daniel Herda PhD Merrimack College, [email protected]
Follow this and additional works at: https://scholarlycommons.law.case.edu/swb
Part of the Human Rights Law Commons, Social Psychology Commons, and the Sociology Commons
Recommended Citation Recommended Citation Herda, Daniel. 2018. "Comparing Ignorance: Imagined Immigration and the Exclusion of Migrantsin the U.S. and Western Europe." Societies Without Borders 12 (2). Available at: https://scholarlycommons.law.case.edu/swb/vol12/iss2/9
This Article is brought to you for free and open access by the Cross Disciplinary Publications at Case Western Reserve University School of Law Scholarly Commons. It has been accepted for inclusion in Societies Without Borders by an authorized administrator of Case Western Reserve University School of Law Scholarly Commons.

Comparing Ignorance: Imagined Immigration and the Exclusion of Migrantsin the Comparing Ignorance: Imagined Immigration and the Exclusion of Migrantsin the U.S. and Western Europe U.S. and Western Europe
Cover Page Footnote Cover Page Footnote This research was funded by a Merrimack College Faculty Development Grant. The author would like to thank Sean Condon, Ray Dorney, Zoey Sherman, and Emily Ryo for their advice on earlier versions of this study.
This article is available in Societies Without Borders: https://scholarlycommons.law.case.edu/swb/vol12/iss2/9
Comparing Ignorance: Imagined Immigration and the Exclusion of Migrants in the U.S.
and Western Europe
There exists a well-documented tendency among citizens to perceive immigrant populations as
much larger than indicated by official statistics. This misperception has been linked to desires to
halt the flow off immigration or restrict immigrants’ rights, raising concern about the
consequences of pervasive faulty information. However, ignorance extends beyond questions of
population size. There are also many qualitative misperceptions upon which individuals base
their opinions about foreigners. In particular, citizens are likely to hold incorrect perceptions
about the legal status of the typical immigrant (i.e. documented vs undocumented). The current
study takes a unique approach by simultaneously examining both quantitative and qualitative
forms of ignorance, and assessing their associations with support for a hypothetical restrictionist
migration policy. Using a sample of 2,363 from the 2011 Transatlantic Trends Immigration
Survey gathered in six countries – the U.S., Britain, France, Germany, Spain, and Italy – this
study finds high levels of both forms of ignorance. However, legal status misperceptions exhibit
greater variation across countries and are more strongly associated with restrictionist attitudes.
Contrary to the misperceptions literature, size misperceptions are only weakly associated with
the outcome. Overall, the results highlight a need for a more complete understanding of the
totality of misperceptions to elucidate the connection between ignorance and anti-immigrant
attitudes.
Keywords: immigrants; misperceptions; undocumented immigration; stereotypes; ignorance
1
Herda: Comparing Ignorance
Published by Case Western Reserve University School of Law Scholarly Commons, 2018
1
Comparing Ignorance: Imagined Immigration and the Exclusion of Migrants in the U.S.
and Western Europe
Introduction
Social researchers have consistently found that when the typical individual thinks about
immigrants, they imagine something quite different from the objective reality. Recent research
on misperceptions has focused a great deal on how people perceive their country’s immigrant
population size; a statistic that respondents usually over-estimate. (Hjerm 2007; Semyonov,
Raijman, Yom Tov and Schmidt 2004; Semyonov, Raijman and Gorodzeisky 2008; Sides and
Citrin 2007; Citrin and Sides 2008). This tendency (sometimes referred to as population
innumeracy) has generated increased scholarly attention and is now measured in multiple
national and international surveys (Ipsos 2014; Transatlantic Trends 2013; Texeira et al. 2013;
Jowell 2005). Most concerning is the finding that when inflated perceptions are common,
support for anti-immigrant policy is more prevalent (Sides and Citrin 2007; Semyonov et al.
2004). Logically, this association has led some to call for the dissemination of correct population
size information to improve intergroup relations and to aid in the integration of immigrant
populations (Alba et al. 2005; Nadeau et al. 1991; Sides and Cirtin 2007; Sigelman and Niemi
2001).
The effectiveness of such a strategy is uncertain however, in part because misperceptions
regarding immigrants are much wider in scope than inflated population numbers. Blinder’s
(2015) concept of the “imagined immigration” suggests that individuals have a more
comprehensive, albeit still inaccurate understanding of what is meant by the word “immigrant”
and whom it represents. In other words, ignorance extends beyond questions of population size
to also include qualitative mischaracterizations of the typical immigrant. Perceptions of the
2
Societies Without Borders, Vol. 12, Iss. 2 [2018], Art. 9
https://scholarlycommons.law.case.edu/swb/vol12/iss2/9
2
typical foreigner’s country of origin, their reasons for being present in the host country, their
socio-economic status, or their likelihood of criminality, among many other possible things, may
be perceived incorrectly relative to the reality. Blinder (2015) argues that immigrant-related
public opinion is formed around this imagined immigration rather than objective reality. Thus, if
in the minds of individuals, the typical immigrant is something undesirable, it may, like size
misperceptions, result in support for exclusionary immigration policies or the erosion of
immigrants’ rights.
While population size misperceptions have been studied extensively, they have yet to be
considered alongside qualitative components of the imagined immigration. It remains unknown
whether these different types of ignorance shape attitudes and policy positions similarly or if one
is more important than the other. Using data from the six countries included in the 2011
Transatlantic Trends Immigration Survey (TATIS) the current study provides a more complete
understanding of immigrant-related ignorance by considering whether all misperceptions are
created equal. Specifically, the analysis compares the over-estimation of immigrant population
sizes and mischaracterizations of the typical immigrants’ legal status. It then simultaneously
assesses the effects of these two misperceptions on a measure of support for restrictionist
immigration policies.
Legal status mischaracterizations are a potentially important qualitative component of the
imagined immigration, as the question of documentation versus no documentation is highly
contentious, especially in the U.S. (Lyons, Coursey, and Kenworthy 2013; Berg 2009; Hood and
Morris 1998; Goo 2015). It is also likely prone to faulty perceptions given an abundance of
media attention on unauthorized immigration, particularly when focusing on Latino/as (Subervi,
Torres, and Montalvo 2005; Timberlake and Williams 2012). Controversy surrounding
3
Herda: Comparing Ignorance
Published by Case Western Reserve University School of Law Scholarly Commons, 2018
3
undocumented immigrants has also increased in Europe, particularly in the wake of the 2015
Migration Crisis, as individuals from outside the E.U. have increasingly sought refuge and
opportunity within the Schengen area (Duvell 2008; Morehouse and Blomfield 2011). The
current study considers legal status mischaracterizations alongside population size
misperceptions in an effort to provide a more comprehensive understanding of ignorance
regarding immigrants.
Ignorance about Foreign-Born Populations
Population Size Misperceptions: Quantitative Ignorance
Several studies have demonstrated ordinary citizens’ uncertainty about immigrant and racial
minority population sizes (Hjerm 2007; Semyonov, et al. 2004; Semyonov, et al. 2008; Sides and
Citrin 2007; Citrin and Sides 2008; Alba et al. 2005; Wong 2007; Herda 2010; Kunovich 2016).
Generally, when asked how large these populations are, respondents provide over-estimates. This
phenomenon has generated considerable interest among social scientists because it suggests that
the reality perceived by individuals differs, often greatly, from objective data. In a recent report
from Ipsos MORI (2015), over-estimation on average was nearly ubiquitous across 32 nations. In
the U.S., where immigrants represent about 14 percent of the population, the typical respondent
perceives 33 percent of the country to be foreign born. Thus, the average American sees the
immigrant population as 19 percentage points larger than (2.36 times) the reality. Likewise, in
Italy respondents overestimated by 17 percentage points on average, in France and Germany by
14 points, in Britain by 12 points, and in Spain by 9 percentage points (Ipsos 2015).
The commonplace nature of size misperceptions has generated concern that individuals
will use inaccurate information to motivate anti-immigrant actions or formulate anti-immigrant
4
Societies Without Borders, Vol. 12, Iss. 2 [2018], Art. 9
https://scholarlycommons.law.case.edu/swb/vol12/iss2/9

4
policy positions. The theoretical logic is often couched in group threat theory (Blumer 1958;
Blalock 1967; Bobo 1983; Quillian 1995; 1996), which predicts that a greater objective number
of perceived competitors for the dominant group will raise a sense of vulnerability, or threat,
regarding control over social resources (ie: neighborhoods, schools, marriage markets, etc.). This
sense of threat generates negative prejudice and discriminatory actions. Following this logic, the
larger the immigrant population appears in one's mind, the more likely one will express feelings
of group threat, regardless of the actual population size. This heightened threat should increase
support for exclusionary immigration policy. Indeed, researchers using European samples have
found that over-estimates are associated with support for measures that would stop or limit the
flow of immigration (Sides and Citrin 2007), deport immigrants under various circumstances
(Herda 2013), and curtail immigrants’ rights (Semyonov et al. 2004).
While size misperceptions regarding immigrants have been documented in the U.S., their
connection to immigrant policy positions remains understudied. Instead, research on
misperceptions about racial minority communities is more common (Nadeau et al. 1991;
Sigelman and Niemi 2001; Kunovich 2016; Wong 2010) and some find similar links to policy
positions. In particular, Alba’s et al. (2005) analysis of the General Social Survey revealed that
inflated perceptions of African American and Latino populations predict opposition to
affirmative action and the rejection of policies designed to help immigrants respectively.
The Imagined Immigration: Qualitative Ignorance
Of course, ignorance regarding immigrants extends beyond questions of population size. There
are also many qualitative characteristics about which citizens will demonstrate confusion. In
general, the existing research suggests that the specific characteristics that individuals imagine
5
Herda: Comparing Ignorance
Published by Case Western Reserve University School of Law Scholarly Commons, 2018

5
when they think of the typical immigrant, whether accurate or inaccurate, will also inform their
attitudes and policy positions.
Blinder (2015) considered perceptions of why immigrants are present in Britain using
survey data and official government statistics. His results revealed widespread qualitative
misunderstanding about why immigrants are present in the country. At the time of the study,
“student” was the most likely status for immigrants, but “asylum seeker” was the most likely
perception among the 728 respondents. Further, according to official statistics, most immigrants
to Britain have temporary, rather than permanent status. However, respondents were more likely
to view the typical immigrant as permanent. Thus, similar to immigrant population size
estimates, native-born individuals also perceive immigrants incorrectly in qualitative ways.
Blinder (2015) went on to argue that individuals base their immigrant-related attitudes
and policy positions on the immigration that they imagine, rather than what actually exists. He
found this to be the case in his data as those perceiving the typical immigrant to be an asylum
seeker or having permanent status were more likely to endorse reductions in immigration. Thus,
for anti-immigrant attitudes and policy positions, the specific immigrant that one imagines seems
to be important.
Similarly, Herda’s (2015) analysis of the Finnish National Election Survey found that
many respondents in Finland also imagined immigration in a manner that differs from reality.
Nearly one fifth of his 806 respondents incorrectly selected Somalia as the most common origin
of immigrants in Finland. This perception is of course verifiable with official statistics, which
indicate that Russia is the correct answer. This incorrectly imagined immigration is potentially
consequential as Somalis represent a particularly maligned group in Finland (Pitkanen and Kouki
2002; Jaakkola 2005; Peutere 2010). If individuals think of Somalis when they choose to support
6
Societies Without Borders, Vol. 12, Iss. 2 [2018], Art. 9
https://scholarlycommons.law.case.edu/swb/vol12/iss2/9
6
or oppose immigration, their misperception may have implications for immigrants more
generally. This relates to Ford’s (2011) finding among British respondents of an ethnic hierarchy
of preferences regarding immigrant populations. His analysis suggested that respondents
preferred immigrants who were racially white and from cultures most proximate to that of Great
Britain. The attitudes and policy preferences of these individuals will likely be shaped by what or
whom they imagine when they think of the typical immigrant.
Of course, there are many things that individuals can imagine, correctly or incorrectly,
when they think of immigrants. Social scientists have indeed focused on various immigrant
stereotypes for decades (Lippmann 1946; Allport 1979). Individuals often rely on these
simplistic and exaggerated notions to understand unfamiliar out-groups. Previous research has
focused on the endorsement of stereotypes regarding immigrants’ levels of criminality,
occupational skills, work ethic, socioeconomic status, intelligence, and willingness to assimilate,
among others (Ceobanu and Escandell 2010; Hagan and Polloni 1999; Reid et al. 2005;
Espenshade and Hempstead 1996; Timberlake and Williams 2012). Many find that agreeing with
such stereotypes is associated with anti-immigrant attitudes and policy positions (Timberlake et
al. 2015; Figgou et al. 2011; Pantoja 2006; Wilson 2001). Others have successfully used such
stereotypes to experimentally prime subjects and alter attitudes about hypothetical immigrants
(Aalberg et al. 2012; Harell et al. 2012; Hainmueller and Hopkins 2012).
Clearly these stereotypes are influential and each is a potentially relevant piece of the
imagined immigration. Many of them are also demonstrably inaccurate (see Blinder 2015; Herda
2016), making them analogous to quantitative ignorance about population sizes. But are the
consequences about being wrong about population size the same as being wrong about
qualitative characteristics? If so, there exists a need to shift the recent population innumeracy
7
Herda: Comparing Ignorance
Published by Case Western Reserve University School of Law Scholarly Commons, 2018
7
research away from its sole focus on size perceptions to a more comprehensive analysis of the
totality of respondents’ immigrant-related ignorance. The current analysis moves in this direction
by simultaneously considering quantitative misperceptions and qualitative mischaracterizations.
Documented or Undocumented?
The typical immigrant’s legal status is a potentially important component of the imagined
immigration and likely something that respondents will mischaracterize. Particularly in the U.S.,
the category of “illegal”1 immigrants is controversial. Many hold especially negative attitudes
toward the undocumented population (Lyons, Coursey, and Kenworthy 2013; Berg 2009; Hood
and Morris 1998; Goo 2015; Espenshade and Calhoun 1993). If respondents view the typical
immigrant as occupying this maligned status, it will likely associate strongly with a desire to
restrict immigration. The current study considers this perception in the U.S. as well as Europe,
where the topic of unauthorized migration has also become increasingly controversial
(Morehouse and Blomfield 2011; Duvell 2008).
The stereotype characterizing the typical immigrant as undocumented has been observed
in the U.S., particularly when researchers focus on Latino/a immigrants (Timberlake and
Williams 2012; Espenshade and Hempstead 1996). For example, Masouka and Junn (2013)
demonstrated that a full 62 percent of whites in the Multi-City Study of Urban Inequality
endorsed the idea that Latino immigrants were “mostly illegal immigrants”. However,
researchers have not yet analyzed this misperception alongside over-estimates of the immigrant
population size. Thus, it remains unknown whether qualitative and quantitative ignorance behave
similarly or if one is more important than the other for predicting anti-immigrant preferences.
8
Societies Without Borders, Vol. 12, Iss. 2 [2018], Art. 9
https://scholarlycommons.law.case.edu/swb/vol12/iss2/9
8
Undocumented Population Sizes
Undocumented immigration involves the unauthorized entry or continued presence of foreign
nationals in a host country. When considering ignorance regarding this category of individuals, it
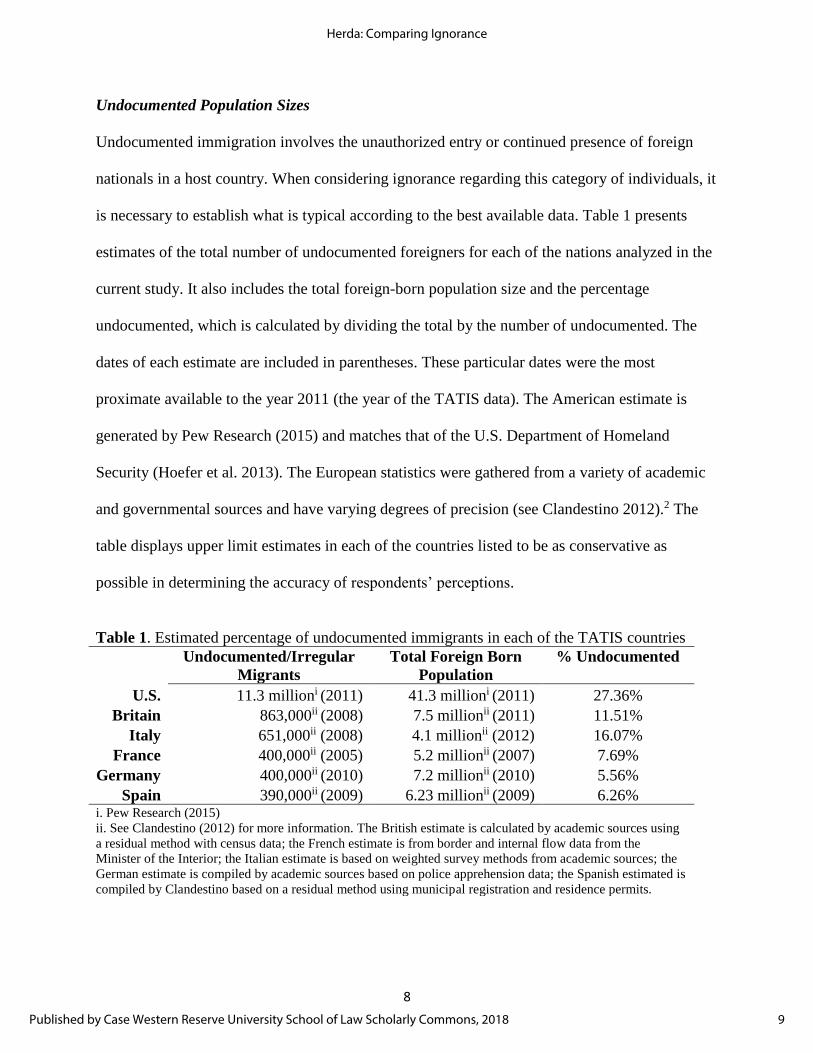
is necessary to establish what is typical according to the best available data. Table 1 presents
estimates of the total number of undocumented foreigners for each of the nations analyzed in the
current study. It also includes the total foreign-born population size and the percentage
undocumented, which is calculated by dividing the total by the number of undocumented. The
dates of each estimate are included in parentheses. These particular dates were the most
proximate available to the year 2011 (the year of the TATIS data). The American estimate is
generated by Pew Research (2015) and matches that of the U.S. Department of Homeland
Security (Hoefer et al. 2013). The European statistics were gathered from a variety of academic
and governmental sources and have varying degrees of precision (see Clandestino 2012).2 The
table displays upper limit estimates in each of the countries listed to be as conservative as
possible in determining the accuracy of respondents’ perceptions.
Table 1. Estimated percentage of undocumented immigrants in each of the TATIS countries
Undocumented/Irregular
Migrants
Total Foreign Born
Population
% Undocumented
U.S. 11.3 millioni (2011) 41.3 millioni (2011) 27.36%
Britain 863,000ii (2008) 7.5 millionii (2011) 11.51%
Italy 651,000ii (2008) 4.1 millionii (2012) 16.07%
France 400,000ii (2005) 5.2 millionii (2007) 7.69%
Germany 400,000ii (2010) 7.2 millionii (2010) 5.56%
Spain 390,000ii (2009) 6.23 millionii (2009) 6.26% i. Pew Research (2015)
ii. See Clandestino (2012) for more information. The British estimate is calculated by academic sources using
a residual method with census data; the French estimate is from border and internal flow data from the
Minister of the Interior; the Italian estimate is based on weighted survey methods from academic sources; the
German estimate is compiled by academic sources based on police apprehension data; the Spanish estimated is
compiled by Clandestino based on a residual method using municipal registration and residence permits.
9
Herda: Comparing Ignorance
Published by Case Western Reserve University School of Law Scholarly Commons, 2018
9
The undocumented population around 2011 was the largest by a wide margin in the U.S.
in both absolute and relative terms, with 27.36 percent of foreigners having “illegal” status. The
numbers of this population increased sharply beginning in the 1990s reaching over 12 million
individuals in 2005. It has remained relatively steady ever since, at about 11 million individuals
(Krogstad and Passel 2015). Immigrants from Mexico generally receive the most attention in this
regard, but they represent less than half of the undocumented population in the U.S. There are
also significant undocumented immigration flows from other parts of Central America, Asia,
South America, and the Caribbean (Henderson 2014).
Based on estimates from The Clandestino Project, Italy has the next largest relative
proportion of foreign born residents with undocumented status, at 16.07 percent. This is likely
due to geography and its status as point of entry to the E.U. for migrants arriving from North
Africa. This Central Mediterranean route was the most commonly used path into the Schengen
Area prior to the recent migration crisis (Adams 2014). However, only Italy and Britain (11.51
percent) have foreign born populations with greater than 10 percent classified as undocumented.
Thus, even with Britain, France, and Germany acting as popular destinations for economic
migrants, their undocumented populations are small compared to the U.S.
Regardless, if one compares the estimated undocumented population to the total number
of foreigners, the former represents a minority in every context. Even in U.S. where the absolute
undocumented population size is quite large, nearly three-quarters of foreigners have
documentation. Thus, to view the typical immigrant as present “illegally” would be a
mischaracterization in all six contexts. The following sections consider how respondents in these
countries perceive these realities.
10
Societies Without Borders, Vol. 12, Iss. 2 [2018], Art. 9
https://scholarlycommons.law.case.edu/swb/vol12/iss2/9
10
Data, Variables, and Methods
Data
The current analysis examines data from the 2011 TATIS, which is an international survey
designed to “identify attitudes and policy preferences of the general public related to
immigration in Europe and the United States” (Kennedy 2011). As with previous misperceptions
research, the cross-sectional design of the TATIS precludes assessment of temporality. However,
the data uniquely permit the simultaneous analysis of both qualitative and quantitative
immigrant-related misperceptions, which the existing literature has not considered. The sampling
universe consists of individuals aged 18 and over, who have access to a landline telephone, with
20 percent of the sample being contacted via mobile numbers. Respondents were selected via
multi-stage probability sampling. Interviews were conducted over the phone and in person
between August and September of 2011. For the multivariate analysis, immigrants and those
who did not respond to the size perception question are omitted. Further, the analysis only
includes those who were selected to respond to the perceived size in one’s country question.3
Variables
Quantitative Ignorance: Population Size Perceptions
The measure of the respondents’ perceived immigrant population size is taken from a question
asking: “In your opinion, what percentage of the total [country] population were born in another
country?” Participants were directed to fill in a number between 0 and 100. A detailed
description of this variable across the six sampled countries is provided in the analysis section.
Qualitative Ignorance: Legal Status Mischaracterizations
11
Herda: Comparing Ignorance
Published by Case Western Reserve University School of Law Scholarly Commons, 2018
11
The measure of perceived legal status of the typical immigrant comes from a question asking:
“In your opinion, do you think that most of the immigrants in the [country] are here legally or are
most of them here illegally?” The three possible responses include: 1) “most immigrants are in
the [country] legally”; 2) “most immigrants are in the [country] illegally”; and 3) “equal numbers
of legal and illegal immigrants”. A detailed description of this variable across the six countries is
presented in the analysis section below. Due to the small percentage choosing the third option,
these individuals were combined with those selecting the second option in the multivariate
portion, as both are mischaracterizations.4
Dependent Variable: Restrictionist Attitudes
Ultimately, the analysis will consider the association between these two misperception measures
and a scale of willingness to admit immigrants (henceforth referred to as restrictionist attitudes).
The variable combines responses from four questions, each containing four categories ranging
from “strongly support” to “strongly oppose”. The items measure the circumstances under which
respondents would allow foreigners into the country. These include: 1) “to avoid poverty”; 2) “to
avoid political, ethnic, or religious persecution”; 3) “to avoid physical harm from armed
conflict”; and 4) “to avoid the aftermath of a natural disaster”. These items are particularly
timely as many describe the motivations of the refugees who fled the Middle East and Africa for
the E.U. during the 2015 Migration Crisis. While the data were collected before the crisis began,
they provide valuable insight into the state of ignorance and restrictionist feelings in the West
just prior to the influx of migrants. Using a factor analysis of polychoric correlations, the four
component items load highly onto a single factor (ɑ = .79) with an eigenvalue above two (χ2 =
4623.71; p = .000). The final scale was generated using factor scores where higher values
12
Societies Without Borders, Vol. 12, Iss. 2 [2018], Art. 9
https://scholarlycommons.law.case.edu/swb/vol12/iss2/9
12
indicate more restrictionist attitudes. Sample means for this and all other variables are included
in Table 2. On average, restrictionist attitudes are highest in Britain and the lowest in Spain. The
values in both countries are significantly (p<.05) larger and smaller respectively compared to
each of the other countries in the sample.
Controls
As controls, the multivariate analysis includes two measures of inter-group contact, which are
thought to influence size misperceptions in particular. As individuals encounter immigrants in
their everyday lives, their experiences are believed to act as “evidence” that can be used to
formulate a perception (see Tversky and Kahnaman’s (1973) cognitive availability heuristic).
Thus, one’s level of contact with immigrants is assumed to inform their perceptions. The first
such variable in the current analysis measures the amount of immigrant friends in one’s social
network. The three-category variable includes responses of “No, none” (reference category),
“Yes, a few”, and “Yes, many”. The second variable measures the amount of immigrants in
one’s immediate family through parents’ birthplace. The variable has three categories: 1) Your
mother and father were born in [country] (reference category); 2) One of you parents was born
outside of [country]; 3) Both of your parents were born outside of [country].
13
Herda: Comparing Ignorance
Published by Case Western Reserve University School of Law Scholarly Commons, 2018

13
Table 2: Means (Standard Deviations in Parentheses) and Percentages for Variables
Considered across TATIS Countries U.S. Britain France Germany Spain Italy
Restrictionist Attitudes
2.20
(.89)
2.41
(.88)
2.23
(.67)
2.17
(.65)
1.95
(.71)
2.18
(.79)
Female 51.52% 60.55% 51.54% 51.29% 47.55% 51.63%
Age
51.90
(17.29)
50.77
(17.16)
51.04
(16.60)
48.80
(16.67)
45.73
(14.93)
49.31
(16.73)
Education Level
Less than High School 8.82% 14.41% 41.84% 42.76% 35.61% 35.96%
High School Graduate 34.81% 35.16% 20.81% 21.46% 27.24% 40.94%
College Graduate 41.07% 42.29% 25.29% 6.75% 33.11% 20.60%
Post-Graduate 15.30% 8.13% 12.07% 29.03% 4.04% 2.5%
Political Conservatism
4.40
(1.57)
4.16
(1.42)
3.85
(1.43)
3.67
(1.13)
3.91
(1.65)
3.81
(1.59)
Locality
City 16.15% 14.60% 14.06% 22.09% 27.84% 23.64%
Suburbs 29.13% 22.73% 15.27% 19.88% 11.32% 12.95%
Small town 35.18% 41.32% 33.47% 34.97% 30.57% 50.63%
Country Village 7.21% 18.47% 32.20% 19.63% 29.43% 11.39%
Rural 12.33% 2.89% 5.00% 3.44% .82% 1.40%
Immigrant Family
Two Parents Native-Born 88.47% 90.38% 88.11% 88.55% 97.76% 99.17%
One Parent Foreign-Born 7.47% 5.58% 8.33% 6.16% 2.21% .83%
Two Parents Foreign-Born 4.06% 4.05% 3.56% 5.29% ----- -----
Immigrant Friends
None 28.27% 36.72% 21.85% 28.22% 25.65% 43.65%
A few 55.84% 52.16% 66.03% 59.75% 63.87% 47.65%
Many 15.89% 11.12% 12.11% 12.02% 10.49% 8.70%
Observations 406 398 421 407 363 368
The multivariate models also include several demographic controls. Sex is measured
dichotomously with female acting as the reference. Age is measured in years. Education is
measured with four categories: less than high school, high school graduate (reference category),
college graduate, and advanced degree. Political conservatism is an ordinal variable with seven
categories ranging from “extremely liberal” to “extremely conservative”. Residence type has five
categories: big city (reference category), suburbs, small city, small town, country village, and
14
Societies Without Borders, Vol. 12, Iss. 2 [2018], Art. 9
https://scholarlycommons.law.case.edu/swb/vol12/iss2/9
14
farm/countryside. Finally, all models include a set of country-specific region fixed effects to
account for possible with-country geographic variation. These are omitted from presentation.
Methods
The analysis begins by documenting and comparing the extent of population size misperceptions
and legal status mischaracterizations across the six countries. Next, the consequences of these
misperceptions are assessed through country-specific multivariate regression models predicting
restrictionist attitudes. Finally, predicted values are presented to compare the effect sizes of
quantitative and qualitative ignorance. All analyses apply sample weights to ensure within-
country representativeness and replace missing values through multiple imputation using 20
datasets.5
Analysis
The Extent of Ignorance across Countries
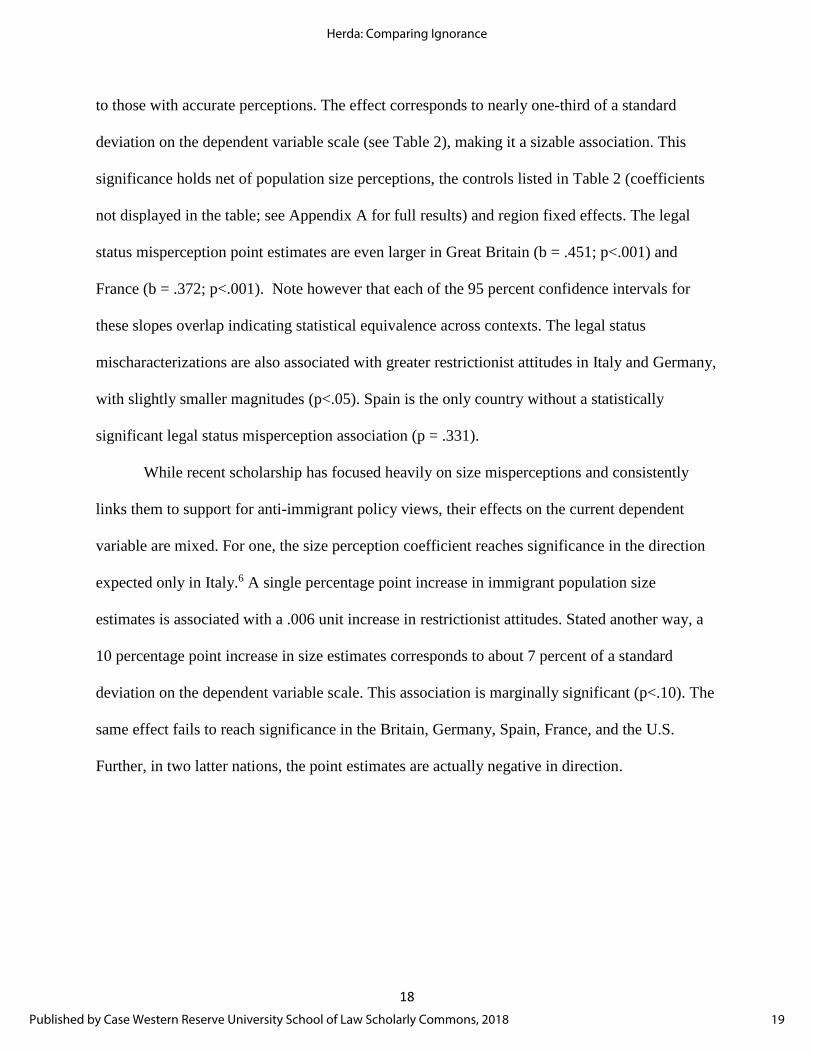
The horizontal bar chart in Figure 1 displays respondents’ perceptions of the legal status of the
typical immigrant within each country. Non-trivial percentages mischaracterize in each context.
However, there is clearly a high degree of variability in accuracy with more than 80 percent of
Germans correctly perceiving the typical immigrant as present legally, while only 21.35 percent
of Italians do the same. The latter, along with the U.S. are the only two countries in which a
majority of respondents perceive the typical immigrant as having undocumented status. While
less than a majority does so in Spain, there are more Spaniards mischaracterizing than accurately
perceiving the reality. Conversely, ignorance is lower in Britain and France where only one-third
and one-quarter hold faulty perceptions respectively.
15
Herda: Comparing Ignorance
Published by Case Western Reserve University School of Law Scholarly Commons, 2018

15
21.35
30.19
36.3
53.78
64.89
80.21
67.44
57.22
48
33.92
24.25
13.41
5.58
10.97
10.55
7.06
4.48
4.61
0% 10% 20% 30% 40% 50% 60% 70% 80% 90% 100%
Italy
USA
Spain
UK
France
Germany
Legal Illegal Equal D/K
Britain
Spain
USA
Germany
France
Italy
Figure 1. Perceived legal status of the typical immigrant in each of the 2011 TATIS countries
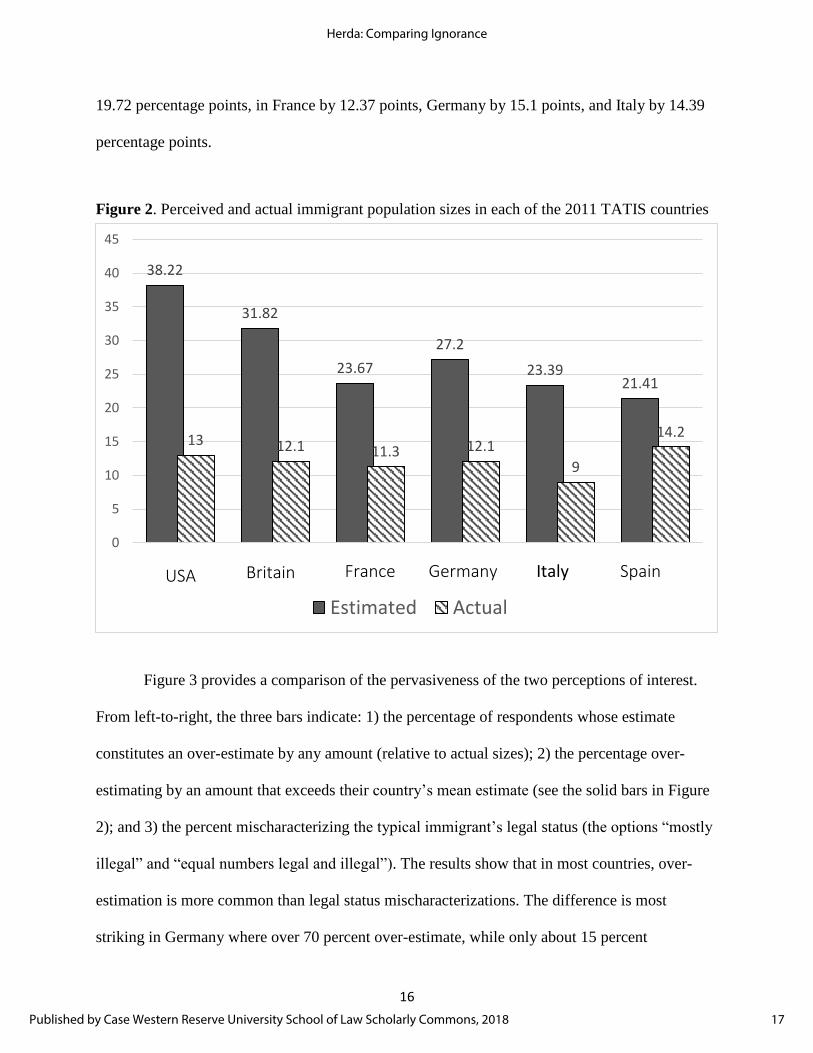
The extent of quantitative misperceptions is presented in Figure 2. The bar graph
displays the mean estimated size within each country from the TATIS and the actual sizes
gathered from Eurostat (2013) and Pew Research (2015). In all of the countries considered mean
estimates of the immigrant population size exceed the actual sizes. Over-estimation is most
extreme in the U.S. where respondents perceive the immigrant population size to be nearly three
times larger than the reality. The typical American overestimates by 25.22 percentage points.
Estimates are most accurate in Spain where the actual size is overestimated by about 50 percent
on average, which corresponds to 7.21 percentage points. Respondents in Britain overestimate by
16
Societies Without Borders, Vol. 12, Iss. 2 [2018], Art. 9
https://scholarlycommons.law.case.edu/swb/vol12/iss2/9
16
38.22
31.82
23.67
27.2
23.3921.41
13 12.1 11.3 12.1
9
14.2
0
5
10
15
20
25
30
35
40
45
USA UK France Germany Italy Spain
Estimated Actual
BritainUSA France Germany Italy Spain
19.72 percentage points, in France by 12.37 points, Germany by 15.1 points, and Italy by 14.39
percentage points.
Figure 2. Perceived and actual immigrant population sizes in each of the 2011 TATIS countries
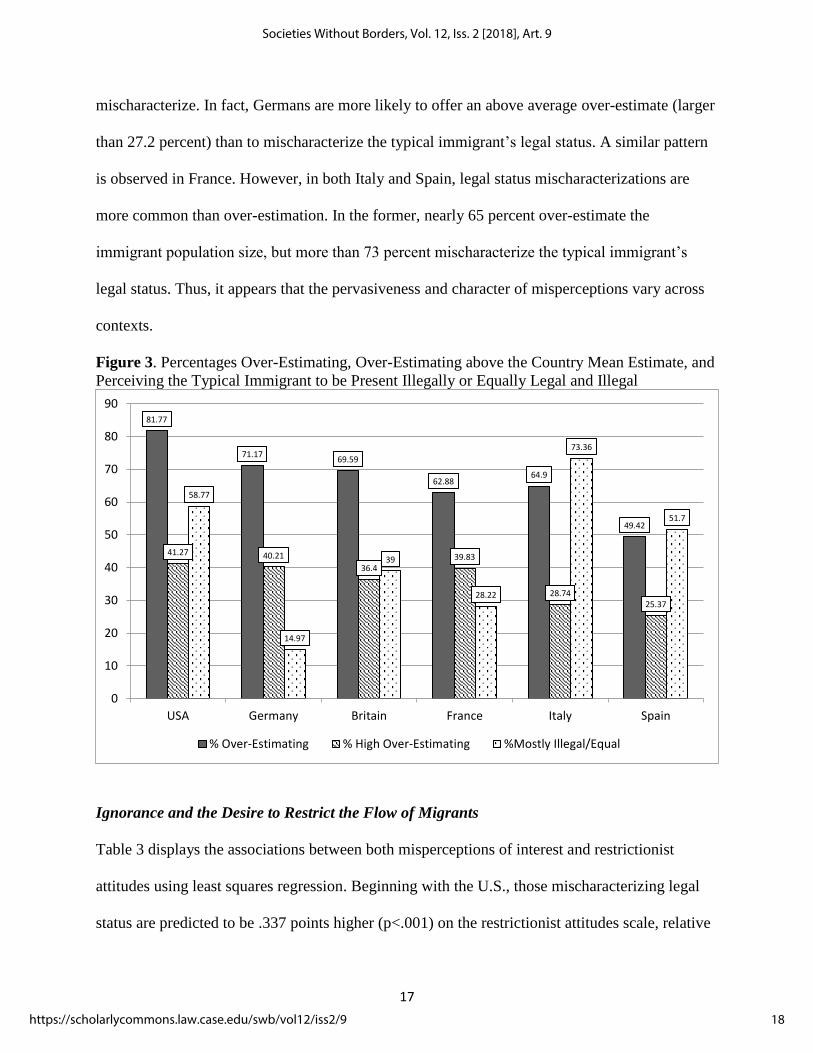
Figure 3 provides a comparison of the pervasiveness of the two perceptions of interest.
From left-to-right, the three bars indicate: 1) the percentage of respondents whose estimate
constitutes an over-estimate by any amount (relative to actual sizes); 2) the percentage over-
estimating by an amount that exceeds their country’s mean estimate (see the solid bars in Figure
2); and 3) the percent mischaracterizing the typical immigrant’s legal status (the options “mostly
illegal” and “equal numbers legal and illegal”). The results show that in most countries, over-
estimation is more common than legal status mischaracterizations. The difference is most
striking in Germany where over 70 percent over-estimate, while only about 15 percent
17
Herda: Comparing Ignorance
Published by Case Western Reserve University School of Law Scholarly Commons, 2018
17
mischaracterize. In fact, Germans are more likely to offer an above average over-estimate (larger
than 27.2 percent) than to mischaracterize the typical immigrant’s legal status. A similar pattern
is observed in France. However, in both Italy and Spain, legal status mischaracterizations are
more common than over-estimation. In the former, nearly 65 percent over-estimate the
immigrant population size, but more than 73 percent mischaracterize the typical immigrant’s
legal status. Thus, it appears that the pervasiveness and character of misperceptions vary across
contexts.
Figure 3. Percentages Over-Estimating, Over-Estimating above the Country Mean Estimate, and
Perceiving the Typical Immigrant to be Present Illegally or Equally Legal and Illegal
Ignorance and the Desire to Restrict the Flow of Migrants
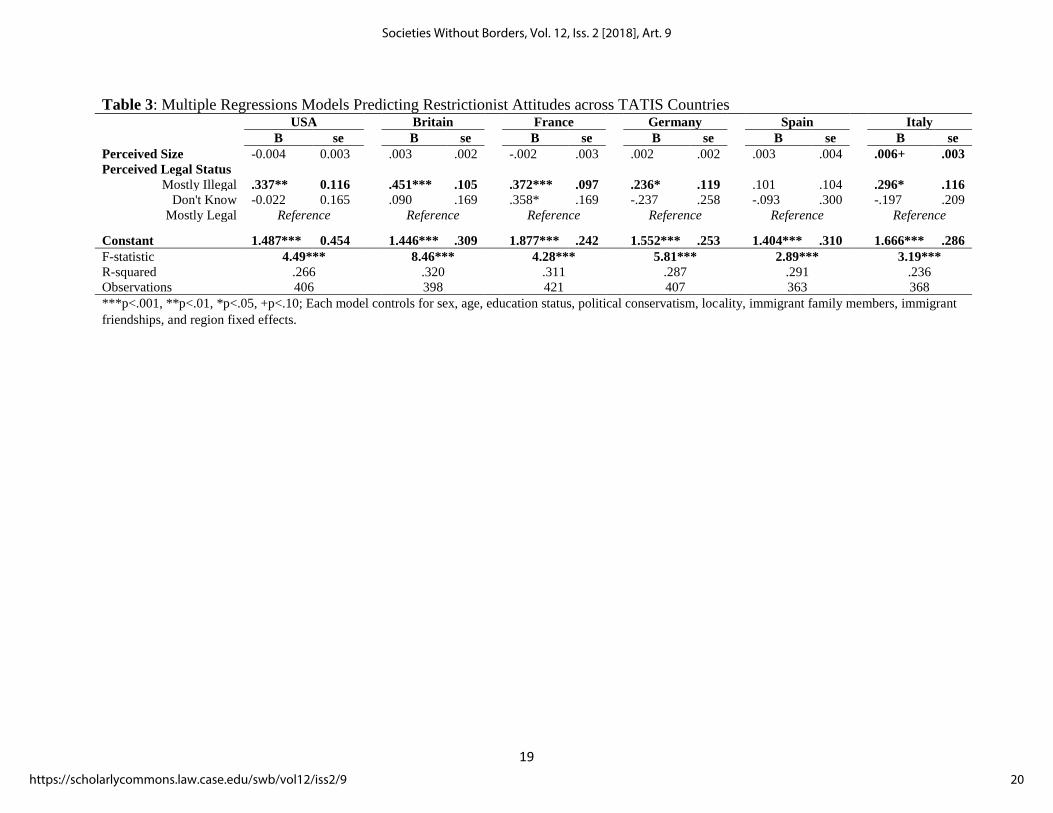
Table 3 displays the associations between both misperceptions of interest and restrictionist
attitudes using least squares regression. Beginning with the U.S., those mischaracterizing legal
status are predicted to be .337 points higher (p<.001) on the restrictionist attitudes scale, relative
81.77
71.1769.59
62.8864.9
49.42
41.27 40.21
36.439.83
28.7425.37
58.77
14.97
39
28.22
73.36
51.7
0
10
20
30
40
50
60
70
80
90
USA Germany Britain France Italy Spain
% Over-Estimating % High Over-Estimating %Mostly Illegal/Equal
18
Societies Without Borders, Vol. 12, Iss. 2 [2018], Art. 9
https://scholarlycommons.law.case.edu/swb/vol12/iss2/9
18
to those with accurate perceptions. The effect corresponds to nearly one-third of a standard
deviation on the dependent variable scale (see Table 2), making it a sizable association. This
significance holds net of population size perceptions, the controls listed in Table 2 (coefficients
not displayed in the table; see Appendix A for full results) and region fixed effects. The legal
status misperception point estimates are even larger in Great Britain (b = .451; p<.001) and
France (b = .372; p<.001). Note however that each of the 95 percent confidence intervals for
these slopes overlap indicating statistical equivalence across contexts. The legal status
mischaracterizations are also associated with greater restrictionist attitudes in Italy and Germany,
with slightly smaller magnitudes (p<.05). Spain is the only country without a statistically
significant legal status misperception association (p = .331).
While recent scholarship has focused heavily on size misperceptions and consistently
links them to support for anti-immigrant policy views, their effects on the current dependent
variable are mixed. For one, the size perception coefficient reaches significance in the direction
expected only in Italy.6 A single percentage point increase in immigrant population size
estimates is associated with a .006 unit increase in restrictionist attitudes. Stated another way, a
10 percentage point increase in size estimates corresponds to about 7 percent of a standard
deviation on the dependent variable scale. This association is marginally significant (p<.10). The
same effect fails to reach significance in the Britain, Germany, Spain, France, and the U.S.
Further, in two latter nations, the point estimates are actually negative in direction.
19
Herda: Comparing Ignorance
Published by Case Western Reserve University School of Law Scholarly Commons, 2018
19
Table 3: Multiple Regressions Models Predicting Restrictionist Attitudes across TATIS Countries
USA Britain France Germany Spain Italy
B se
B se
B se
B se
B se
B se
Perceived Size -0.004 0.003
.003 .002
-.002 .003
.002 .002
.003 .004
.006+ .003
Perceived Legal Status
Mostly Illegal .337** 0.116
.451*** .105
.372*** .097
.236* .119
.101 .104
.296* .116
Don't Know -0.022 0.165
.090 .169
.358* .169
-.237 .258
-.093 .300
-.197 .209
Mostly Legal Reference Reference Reference Reference Reference Reference
Constant 1.487*** 0.454 1.446*** .309 1.877*** .242 1.552*** .253 1.404*** .310 1.666*** .286
F-statistic 4.49***
8.46***
4.28***
5.81***
2.89***
3.19***
R-squared .266
.320
.311
.287
.291
.236
Observations 406 398 421 407 363 368
***p<.001, **p<.01, *p<.05, +p<.10; Each model controls for sex, age, education status, political conservatism, locality, immigrant family members, immigrant
friendships, and region fixed effects.
20
Societies Without Borders, Vol. 12, Iss. 2 [2018], Art. 9
https://scholarlycommons.law.case.edu/swb/vol12/iss2/9
20
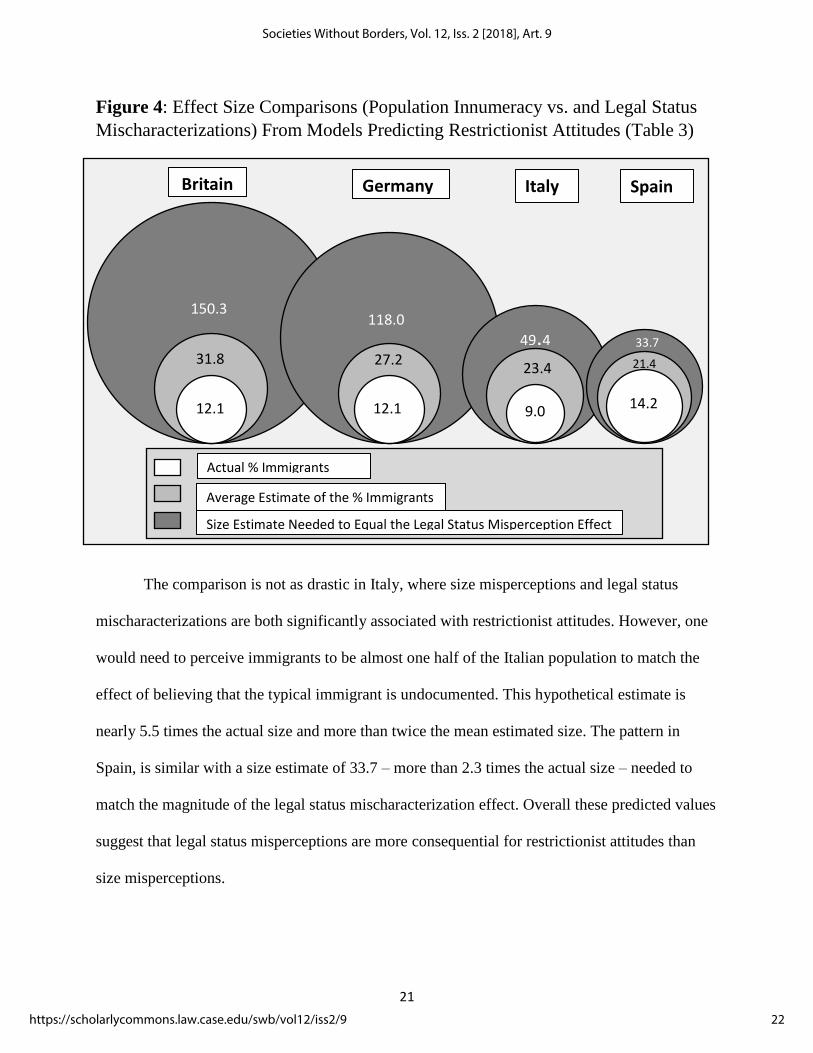
Comparing Ignorance
The ultimate question in the current analysis is whether all misperceptions are equal in terms of
their consequences for restrictionist attitudes. In Table 3, the magnitudes of the legal status
misperceptions are generally larger and more often statistically significant, but how much larger?
The different scaling of the two perception variables (dichotomous vs. continuous) means that
the coefficients are not directly comparable. One way to draw a comparison is to calculate how
large a respondent’s size estimate must be to equal the effect of believing the typical immigrant
is undocumented. These hypothetical estimates are calculated using the regression equations
from Table 3, and are demonstrated in the darkest circles in the comparative bubble chart in
Figure 4. The chart also includes the actual immigrant population sizes and the sample mean
estimated sizes for reference (see Figure 2). Only Great Britain, Germany, Italy, and Spain are
included because their size estimate coefficients are in the direction expected (in the U.S. and
France the coefficients are negative in direction).
In Britain the average respondent would need to perceive the immigrant population to be
over 150 percent of the country to match the level of restrictionist attitudes of someone
perceiving the typical immigrant as undocumented. Of course, this hypothetical estimate is
mathematically impossible in reality. However, it demonstrates a greater importance of legal
status mischaracterizations in terms of consequences for restrictionist attitudes. The required size
estimate of 150.3 is nearly 12.5 times the actual population size (12.1 percent) and more than 3
times the mean estimated size (31.8 percent). The pattern in the German sample is similar, but
with reduced magnitude. A German respondent would need to estimate immigrants to be 118
percent of the country to match the effect of perceiving the typical immigrant as present illegally.
21
Herda: Comparing Ignorance
Published by Case Western Reserve University School of Law Scholarly Commons, 2018
21
Figure 4: Effect Size Comparisons (Population Innumeracy vs. and Legal Status
Mischaracterizations) From Models Predicting Restrictionist Attitudes (Table 3)
The comparison is not as drastic in Italy, where size misperceptions and legal status
mischaracterizations are both significantly associated with restrictionist attitudes. However, one
would need to perceive immigrants to be almost one half of the Italian population to match the
effect of believing that the typical immigrant is undocumented. This hypothetical estimate is
nearly 5.5 times the actual size and more than twice the mean estimated size. The pattern in
Spain, is similar with a size estimate of 33.7 – more than 2.3 times the actual size – needed to
match the magnitude of the legal status mischaracterization effect. Overall these predicted values
suggest that legal status misperceptions are more consequential for restrictionist attitudes than
size misperceptions.
Britain Germany Italy Spain
Actual % Immigrants
Average Estimate of the % Immigrants
Size Estimate Needed to Equal the Legal Status Misperception Effect
150.3
31.8
12.1
118.0
27.2
12.1
49.4
23.4
9.0 14.2
21.4
33.7
22
Societies Without Borders, Vol. 12, Iss. 2 [2018], Art. 9
https://scholarlycommons.law.case.edu/swb/vol12/iss2/9
22
Discussion
Recent headlines point to the dawn of the “post-truth” era in the U.S. and Western Europe
(Matthew 2016; Economist 2016). In fact, “post-truth” was named the 2016 Word of the Year by
the Oxford Dictionary, who define it as circumstances under which “objective facts are less
influential in shaping public opinion than appeals to emotion and personal belief” (Oxford 2016).
Researchers interested in perceptions about immigrant populations have been documenting such
“alternative facts” in people’s heads for decades. The tendency for individuals to base their
views on the immigration they imagine, rather than what actually exists is troubling and raises
many questions about the consequences of factual ignorance. The current analysis considered the
extent of two types of faulty information about immigrants across six Western nations and
whether both forms were equal in terms of their consequences for restrictionist attitudes. The
main findings and implications for future research are as follows:
Ignorance is Pervasive, but Variable across Nations
Quantitative ignorance exists in nearly every place that researchers have looked and the current
study finds similarly. Over-estimation is the norm in all of the countries considered. However,
ignorance regarding immigrants extends beyond questions about population size. Qualitative
misperceptions regarding the legal status of the typical immigrant exist at non-trivial levels in
each context. However, there is considerable variation, ranging from over 80 percent correct in
Germany to only 21 percent correct in Italy. Further, there is also variation across contexts in
terms of which misperception is more pervasive. Size misperceptions are more dominant in the
U.S., Germany, France, and Britain, while legal status misperceptions are more common in
Spain and Italy.
23
Herda: Comparing Ignorance
Published by Case Western Reserve University School of Law Scholarly Commons, 2018

23
Some of this variation may be a result of actual population sizes. The U.S. and Italy,
which exhibited the largest proportions of individuals mischaracterizing the typical legal status,
also have the largest portions of unauthorized immigrants relative to their total immigrant
populations. Conversely, a large majority of Germans accurately characterize the typical
immigrant as having documentation. While Germany has a large immigrant population, its
relative proportion of undocumented migrants is the smallest in the current sample. This suggests
that misperceptions may have some grounding in reality, despite being exaggerated. However,
with only six sampled nations, one can only speculate in this regard.
Another possibility that could drive misperceptions is a country’s status a point of entry
for migrants and proximity to source countries. The U.S.-Mexico border acting as the point of
entry for a large portion of undocumented migrants has made the issue widely publicized and
particularly contentious, which may contribute to widespread overgeneralization. Italy and
Spain, the countries with the highest and third-highest levels of legal status mischaracterization
in the sample, similarly have become focal points in Europe for undocumented immigration
given their proximity to Africa. As a result, it is likely that unauthorized migration receives
greater media attention in these countries, which can contribute to the cognitive availability of
the typical citizen. Unfortunately, measures of media exposure are not available in the TATIS,
precluding further exploration of this possibility.
Regardless, legal status misperceptions are an important component of the imagined
immigration for researchers to continue examining because it is both verifiable and prone to
misunderstanding. However, there are potentially many others that should be considered as well.
Whether the typical immigrant depends on government assistance, is employed, possesses host
country language abilities, or is involved in crime or terrorism, are also verifiable and could be
24
Societies Without Borders, Vol. 12, Iss. 2 [2018], Art. 9
https://scholarlycommons.law.case.edu/swb/vol12/iss2/9
24
valuable points of ignorance for researchers to understand. Particularly in studies that analyze
size perceptions, it is necessary to consider the totality of ignorance by also including measures
of qualitative mischaracterizations. This is true especially because the latter seem to be more
strongly associated with consequences for restrictionist attitudes than the former.
Legal Status Mischaracterizations are Associated with more Restrictionist Views
The current study considered how desires for a more restrictionist migration policy might be
influenced by misperceptions. Such an outcome is timely as many nations have recently
struggled to incorporate an influx of migrants. Particularly in the wake of the European
Migration Crisis, it is essential to understand why individuals might support or oppose
restrictionist policies.
Legal status mischaracterizations seem to be consequential as they are associated with
support for greater restrictions in five of the six countries considered. Undocumented immigrants
represent a population about which people hold particularly negative attitudes (Lyons, Coursey,
and Kenworthy 2013; Berg 2009; Hood and Morris 1998; Goo 2015). Thus, if individuals
imagine this maligned category when they think of immigrants it is logical that they will desire
more exclusionary policies, as the current results suggest.
This pattern raises further questions about what other consequences might arise from
such distorted worldviews. For one, determining the degree to which an incorrectly imagined
immigration contributes to the rise of anti-immigrant politicians like Donald Trump in the U.S.,
or the success of “Brexit” in the U.K., could be a useful task for future research. When claims-
makers repeat accusations of immigrants harming society or not respecting host country laws and
culture it will likely find eager adopters among those who already believe in a reality where the
typical immigrant is present “illegally” or possesses other undesirable characteristics.
25
Herda: Comparing Ignorance
Published by Case Western Reserve University School of Law Scholarly Commons, 2018
25
It is important to note however, that the cross-sectional design of the TATIS data
represents a weakness of the current study. This author assumes that perceptions of legal status
and population size exist prior to restrictionist views, but this cannot be confirmed here.
Determining the correct sequence between misperceptions and policy perceptions remains an
important task for future research. Regardless, the associations found in the current study provide
a justification for the continued consideration of qualitative mischaracterizations alongside
quantitative misperceptions.
Not All Misperceptions are Created Equal
Interestingly the current study finds that population size misperceptions did not exhibit a strong
or consistent effect on restrictionist attitudes. In fact, they reached significance in only one of
this six countries considered. This counters much of the existing literature, which consistently
finds that size misperceptions predict support for anti-immigrant policy positions (Sides and
Citrin 2007; Herda 2013; Semyonov et al. 2004). Rather, the current study suggests that
qualitative misperceptions are more consequential for such positions.
Only Italy yielded a significant size perceptions association, but this was small relative to
the corresponding legal status mischaracterization effect. An Italian would need to perceive the
immigrant population to be nearly five times larger than the actual size to match the impact of
mischaracterizing the typical immigrants’ legal status. The remaining countries all demonstrate
non-significant, near zero effects for size misperceptions.
This pattern may differ from the existing literature because it is common for other
analyses to combine data from multiple countries, producing larger sample sizes. For example,
the widely-used 2002 European Social Survey contains 22 nations, each with over 1000
observations. The resulting regression models contain roughly 10 times more observations than
26
Societies Without Borders, Vol. 12, Iss. 2 [2018], Art. 9
https://scholarlycommons.law.case.edu/swb/vol12/iss2/9
26
the combined total across the current models, yielding greater estimation power and more
significant coefficients. For this reason, the effects of size misperceptions may be overstated in
the existing literature.
Research on population size misperceptions often understands their consequences
through group threat theory (Blalock 1967; Quillian 1995; 1996). It is logical to assume that if
larger out-groups are more threatening, those who perceive out-groups to be larger will express
more feelings of threat. However, the current findings suggest that the misperceptions-threat
connection may be more complicated. How individuals perceive population size does not seem
to be as important as how they imagine certain, qualitative characteristics of the population. In
other words a large population may not be as threatening as a “mostly illegal” one. This opens
the possibility that a small out-group population can be a source of threat if it is viewed as having
undesirable traits. Perhaps a large out-group may be viewed as unthreatening if it is associated
with desirable traits. It would be useful for future research to examine the link between ignorance
and threat perceptions with these possibilities in mind.
It is clear that in order to understand immigrant-related ignorance and its consequences,
researchers must now consider multiple bases of ignorance simultaneously. It seems that in
certain contexts, some forms of ignorance are consequential, while they may have little or no
effect elsewhere (i.e. legal status misperceptions in Britain vs. Spain). This may depend on the
particular climate surrounding immigrants in a given country and the issues that are most salient
and contentious (i.e. typical legal status in the U.S. or perhaps the religion of the typical
immigrant in Germany or France). A useful task for future researchers would be to explore
country-specific areas of ignorance to determine which types are most consequential and where.
27
Herda: Comparing Ignorance
Published by Case Western Reserve University School of Law Scholarly Commons, 2018
27
Conclusion
Ordinary citizens express ignorance when it comes to immigrant and minority populations. They
are unsure of how many there are, why they are present, where they are coming from, and their
legal status, among many other possible things. This study confirms that legal status
misperceptions exist in multiple countries and appear to be consequential for restrictionist
attitudes in many. It also highlights that immigrant population size misperceptions may not be
the most important form of ignorance, contrary to the focus of recent literature. Ideally the
current findings will generate an increased focus on respondents’ totality of ignorance and how it
can motivate individuals to support anti-immigrant policies. Unfortunately, there are potential
dangers if the immigration that citizens imagine can motivate actions and policy preferences.
Perhaps through a more comprehensive consideration this ignorance, we will determine ways to
generate a more well-informed and tolerant public.
Endnotes
1. While this adjective is controversial, the current study uses it occasionally to reflect the
question wording from the TATIS survey.
2. By definition, undocumented populations are clandestine and difficult to count accurately.
These data are presented as rough estimates with the goal of establishing broadly that if one
imagines the typical immigrant as undocumented, they are misperceiving the reality.
3. Half of the TATIS sample were asked about their perceptions in their country as a whole and
half about their local community. Respondents were randomly assigned to each group as part of
an experiment conducted by the survey administrators. As a check, the current author considered
the degree to which respondents in both groups differed on all other variables to ensure that
28
Societies Without Borders, Vol. 12, Iss. 2 [2018], Art. 9
https://scholarlycommons.law.case.edu/swb/vol12/iss2/9
28
dropping the latter group did not introduce selection into the data. The results indicated no
significant differences between the two groups in terms of the demographic, cognitive, or the
policy position variables.
4. Alternative models in which the category “equal” is included separately (not shown) largely
mirror those presented. The “equal” coefficient reaches significance only in France (p<.05), but
the magnitude is nearly identical to the “mostly illegal” coefficient.
5. In the full sample, 81.46 percent of cases contain no missing observations. Among individuals
with missing responses, over 80 percent are missing on only a single variable. The largest
percentage missing is on the political conservatism variable (10.09 percent) followed by
education (4.43 percent). All regression models were also estimated using list-wise deletion (not
shown). The magnitudes and significance patterns are similar to those presented.
6. These models present the size perception effects controlling for legal status
mischaracterizations. Additional models were estimated that omit the latter (not shown), which
yield magnitudes and significance patterns that mirror those presented. The unique exception is
in Britain where the size misperception association is statistically significant (b = .007; p = .001)
without controlling for legal status misperceptions. Models that omit size perceptions all yield
legal status perception effects that mirror the results presented.
References
Aalberg, Toril, Shanto Iyengar, and Solomon Messing, 2011. “Who is a ‘Deserving’ Immigrant?:
An Experimental Study of Norwegian Attitudes.” Scandinavian Political Studies. 35 (2): 97-
116.
Adams, Paul. 2014. “Migration Surge Hits EU as Thousands Flock to Italy.” BBC News.
Accessed 28 June 2016. http://www.bbc.com/news/world-europe-27628416
29
Herda: Comparing Ignorance
Published by Case Western Reserve University School of Law Scholarly Commons, 2018
29
Adelman, Robert, Lesley Williams Reid, Gail Markle, Saskia Weiss, and Charles Jaret. 2017.
“Urban Crime Rates and the Changing Face of Immigration: Evidence across Four Decades.”
Journal of Ethnicity and Criminal Justice. 15 (1): 52-77.
Agerholm, Harriet. 2016. “Brexit: Wave of Hate Crime and Racial Abuse Reported Following
EU Referendum.” Independent. Accessed 15 March 2017.
http://www.independent.co.uk/news/uk/home-news/brexit-eu-referendum-racial-racism-
abuse-hate-crime-reported-latest-leave-immigration-a7104191.html
Alba, Richard, Ruben G. Rumbaut, and Karen Marotz. 2005. “A Distorted Nation:
Perceptions of Racial/Ethnic Group Sizes and Attitudes Toward Immigrants and Other
Minorities.” Social Forces. 84 (2): 901–19.
Allport, Gordon W. 1979. The Nature of Prejudice. Reading, MA: Addison-Wesley, 1988.
Berg, Justin Allen. 2009. “White Public Opinion toward Undocumented Immigrants: Threat and
Interpersonal Environment.” Sociological Perspectives. 52 (1):39-58.
Blalock, Hubert M Jr. 1967. Toward a Theory of Minority-Group Relations. New York:
Wiley.
Blinder, Scott. 2015. “Imagined Immigration: The Impact of Different Meanings of ‘Immigrants’
in Public Opinion and Policy Debates in Britain.” Political Studies. doi: 10.1111/1467-
9248.12053
Blumer, Herbert. 1958. “Race Prejudice as a Sense of Group Position.” Pacific Sociological
Review. 1 (1): 3–7.
Bobo, Lawrence. 1983. “Whites’ Opposition to Busing: Symbolic Racism or Realistic Group
Conflict?” Journal of Personality and Social Psychology. 45:1196–210.
Ceobanu, Alin M., and Xavier Escandell. 2010. “Comparative Analyses of Public Attitudes
Toward Immigrants and Immigration Using Multinational Survey Data: A Review of
Theories and Research.” Annual Review of Sociology. 36: 309-314.
Citrin, Jack and John Sides. 2008. “Immigration and the Imagined Community in Europe and the
United States.” Political Studies. 56 (1): 33–56.
Clandestino. 2012. “Database on Irregular Migration.” Accessed 5 Jan 2016. http://irregular-
migration.net//
Duvell, Franck. 2008. “Clandestine Migration in Europe.” Social Science Information. 47 (4):
479-497.
The Economist. 2016. “Post-Truth Politics: The Art of the Lie.” Accessed 28 Feb 2017.
http://www.6.com/news/leaders/21706525-politicians-have-always-lied-does-it-matter-if-
they-leave-truth-behind-entirely-art?fsrc=scn/tw/te/pe/ed/artofthelie
30
Societies Without Borders, Vol. 12, Iss. 2 [2018], Art. 9
https://scholarlycommons.law.case.edu/swb/vol12/iss2/9

30
Espenshade, Thomas J., and Charles A. Calhoun. 1993. “An Analysis of Public Opinion toward
Undocumented Immigration.” Population Research and Policy Review. 12: 189-224.
Espenshade, Thomas J., and Katherine Hempstead. 1996. “Contemporary American Attitudes
toward U.S. Immigration.” International Migration Review. 30 (2): 535-570.
Eurostat European Commission. 201. “European Social Statistics: 2013 Edition.” European
Union. Accessed 28 June 2016. http://ec.europa.eu/eurostat/documents/3930297
/5968986/KS-FP-13-001-EN.PDF/6952d836-7125-4ff5-a153-6ab1778bd4da
Figgou, Lia, Antonis Sapountzis, Nikos Bozatzis, Antonis Gardikiotis, and Pavlos Pantazis.
2011. “Constructing the Stereotype of Immigrants’ Criminality: Accounts of Fear and Risk in
Talk about Immigration in Greece.” Journal of Community and Applied Social Psychology.
21: 164-177.
Ford, Robert. 2011. “Acceptable and Unacceptable Immigrants: How Opposition to Immigration
in Britain is Affected by Migrants’ Region of Origin.” Journal of Ethnic and Migration
Studies. 37 (7): 1017-1037.
Goo, Sara Kehaulani. 2015. “What Americans Want to Do about Illegal Immigration.” Pew
Research Center. Accessed 15 Sept. 2015. http://www.pewresearch.org/fact-
tank/2015/08/24/ what-americans-want-to-do-about-illegal-immigration/
Hagan, John, and Alberto Palloni. 1999. “Sociological Criminology and the Mythology of
Hispanic Immigration and Crime. Social Problems. 46: 617-632.
Hainmueller, Jens, and Daniel J. Hopkins. 2015. “The Hidden American Immigration
Consensus: A Conjoint Analysis of Attitudes Toward Immigrants.” American Journal of
Political Science. 59 (3): 529-548.
Harell, Allison, Stuart Soroka, Shanto Iyengar, and Nicholas Valentino. 2012. “The Impact of
Economic and Cultural Cues on Support for Immigration in Canada and the United States.”
Canadian Journal of Political Science. 45 (3): 499-530.
Henderson, Nia-Malika. 2014. “7 Charts that Explain the Undocumented Immigration Problem.”
The Washington Post. Accessed 3 August 2016. https://www.washingtonpost.com/news/the-
fix/wp/2014/11/21/7-charts-that-explain-the-undocumented-immigrant-population/
Herda, Daniel. 2010. “‘How Many Immigrants?’ Foreign Born Population Innumeracy in
Europe.” Public Opinion Quarterly. 74 (4): 674-695.
Herda, Daniel. 2013. “Too Many Immigrants?: Examining Alternative Forms of Immigrant
Population Innumeracy.” Sociological Perspectives. 56 (2): 213-240.
31
Herda: Comparing Ignorance
Published by Case Western Reserve University School of Law Scholarly Commons, 2018
31
Herda, Daniel. 2015. “Beyond Innumeracy: Heuristic Decision-Making and Qualitative
Misperceptions about Immigrants in Finland.” Ethnic and Racial Studies. 38 (9): 1627-1645.
Hoefer, Michael, Nancy Rytina, and Bryan Baker. 2012. “Estimates of the Unauthorized
Immigrant Population Residing in the United States: January 2011.” U.S. Department of
Homeland Security: Office of Immigration Statistics. Accessed 17 October 2015 http://
www.dhs.gov/sites/default/ files/publications/ois_ill_pe_2011.pdf
Hood, M.V. III, and Irwin L. Morris. 1998. “‘Give Us Your Tired, Your Poor,…But Make Sure
They Have a Green Card’: The Effects of Documented and Undocumented Migrant Context
toward Immigration.” Political Behavior. 20 (1):1-15.
Hjerm, Mikael. 2007. “Do Numbers Really Count? Group Threat Theory Revisited.” Journal of
Ethnic and Migration Studies. 33 (8):1253–75.
Ipsos MORI. 2015. “Perceptions Are Not Reality: What the World Gets Wrong”. Perils of
Perception. Accessed 5 Jan. 2016. https://www.ipsos-mori.com/researchpublications/
researcharchive/3664/Perils-of-Perception-2015.aspx
Jaakkola Magdalena. 2005. Suomalaisten Suhtautuminen Maahanmuuttajiin Vuosina 1987–
2003. Tyӧpoliittinen tutkimus 286 [The attitudes of Finns Towards Foreigners. Labour
Political Research 286]. Helsinki, Finland: Ministry of Labour.
Jowell, Roger and the Central Coordinating Team 2005. European Social Survey 2002/2003.
Technical Report. London: Centre for Comparative Social Surveys, City University. French
Specific Data. Norwegian Social Sciences Data Services [distributor]. Available at
http://ess.nsd.uib.no/.
Kennedy, Craig, Zsolt Nyiri, Pierangelo Isernia, Philip Everts, and Richard Eichenberg.
Transatlantic Trends Survey, 2011. ICPSR34422-v1. Ann Arbor, MI: Inter-university
Consortium for Political and Social Research [distributor], 2012-12-10. http://doi.org/
10.3886/ ICPSR34422.v1
Krogstad, Jens Manuel and Jeffrey S. Passel. 2015. “5 Fact about Illegal Immigration in the
U.S.” Pew Research Center. Accessed 28 June 2016. http://www.pewresearch.org/fact-
tank/2015/11/19/5-facts-about-illegal-immigration-in-the-u-s/
Kunovich, Robert M. 2016. “Perceptions of Racial Groups Size in a Minority-majority Area.”
Sociological Perspectives. 1-18. Online First:
http://journals.sagepub.com/doi/abs/10.1177/0731121416675869
Lippmann W. 1946 [1922]. Public Opinion. Transaction Publishers.
Lyons, Patricia A., Lauren E. Coursey, and Jared B. Kenworthy. 2013. “National Identity and
Group Narcissism as Predictors of Intergroup Attitudes Toward Undocumented Latino
32
Societies Without Borders, Vol. 12, Iss. 2 [2018], Art. 9
https://scholarlycommons.law.case.edu/swb/vol12/iss2/9
32
Immigrants in the United States.” Hispanic Journal of Behavioral Sciences. 35 (3): 323-
335.
Masuoka, Natalie and Jane Junn. 2013. The Politics of Belonging: Race, Public Opinion, and
Immigration. Chicago: University of Chicago Press.
Morehouse, Christal, and Michael Blomfield. 2011. "Irregular Migration in Europe." Migration
Policy Institute, Washington, DC.
Nadeau, Robert, Richard G. Niemi and Jeffrey Levine. 1993. “Innumeracy About Minority
Populations.” The Public Opinion Quarterly. 57 (3): 332–47. Oxford. 2016. “Oxford Dictionaries Word of the Year is…” Oxford Dictionaries. Accessed 28
Feb. 2017. https://www.oxforddictionaries.com/press/news/2016/12/11/WOTY-16
Pantoja, Adrian. 2006. “Against the Tide? Core American Values and Attitudes Toward U.S.
Immigration Policy in the Mid-1990s.” Journal of Ethnic and Migration Studies. 32 (3):
515–31.
Peutere, Laura. 2010. “Hates Crimes Reported to the Police of Finland, 2008.” Reports of the
Police College of Finland. Tempere: 1-109.
Pew Research Center. 2015. “Immigrants.” Pew Research Center Data Trend. Accessed: 27
August 2015. http://www.pewresearch.org/data-trend/society-and-
demographics/immigrants/
Pitkanen, Pirkko and Satu Kouki. 2002. “Meeting Foreign Cultures: A Survey of the Attitudes of
Finnish Authorities Towards Immigrants and Immigration.” Journal of Ethnic and
Migrations Studies. 28 (1): 103-118.
Quillian, Lincoln. 1995. “Prejudice as a Response to Perceived Group Threat: Population
Composition and Anti-Immigrant and Racial Prejudice.” American Sociological Review. 60
(4): 586-611
Quillian, Lincoln. 1996. “Group Threat and Regional Change in Attitudes Toward African-
Americans.” American Journal of Sociology. 102 (3): 816-860.
Reid, Lesley Williams, Harald E. Weiss, Robert M. Alderman, and Charles Jaret. 2005. “The
Immigration – Crime Relationship: Evidence across US Metropolitan Areas.” Social Science
Research. 34 (4): 757-780.
Semyonov, Moshe, Rebeca Raijman R, Anat Yom Tov and Peter Schmidt. 2004. “Population
Size, Perceived Threat and Exclusion: A Multiple-Indicators Analysis of Attitudes Toward
Foreigners in Germany.” Social Science Research. 33 (4): 681–701. Semyonov, Moshe, Rebeca Raijman, and Anastasia Gorodzeisky. 2008. “Foreigners’ Impact on
European Societies: Public Views and Perceptions in a Cross-National Comparative
Perspective.” International Journal of Comparative Sociology. 49 (3): 5–29.
33
Herda: Comparing Ignorance
Published by Case Western Reserve University School of Law Scholarly Commons, 2018
33
Sides, John and Jack Citrin. 2007. “European Opinion about Immigration: The Role of
Identities Interests and Information.” British Journal of Political Science. 37 (3): 477–504.
Sigelman, Lee and Richard G. Niemi. 2001. “Innumeracy About Minority Populations: African
Americans and Whites Compared.” The Public Opinion Quarterly. 65 (1): 86–94.
Timberlake, Jeffrey M. and Rhys H. Williams. 2012. “Stereotypes of U.S. Immigrants from Four
Global Regions.” Social Science Quarterly. 94 (4): 867-890.
Timberlake, Jeffrey M., Junia Howell, Amy Baumann Grau, and Rhys H. Williams. 2015. “Who
‘They’ Are Matters: Immigrant Stereotypes and Assessments of the Impact of Immigration.”
The Sociological Quarterly. 56 (2): 267-299.
Tversky, Amos and Daniel Kahneman. 1973. “Availability: A Heuristic for Judging Frequency
and Probability.” Cognitive Psychology. 5: 207–32.
Wong, Cara J. 2007. "“Little” and “Big” Pictures in Our Heads Race, Local Context, and
Innumeracy About Racial Groups in the United States." Public Opinion Quarterly. 71
(3): 392-412.
Wilson, Thomas C. 2001. “Americans’ Views on Immigration Policy: Testing the Role of
Threatened Groups Interests. Sociological Perspectives. 44 (4): 485-501.
34
Societies Without Borders, Vol. 12, Iss. 2 [2018], Art. 9
https://scholarlycommons.law.case.edu/swb/vol12/iss2/9
34
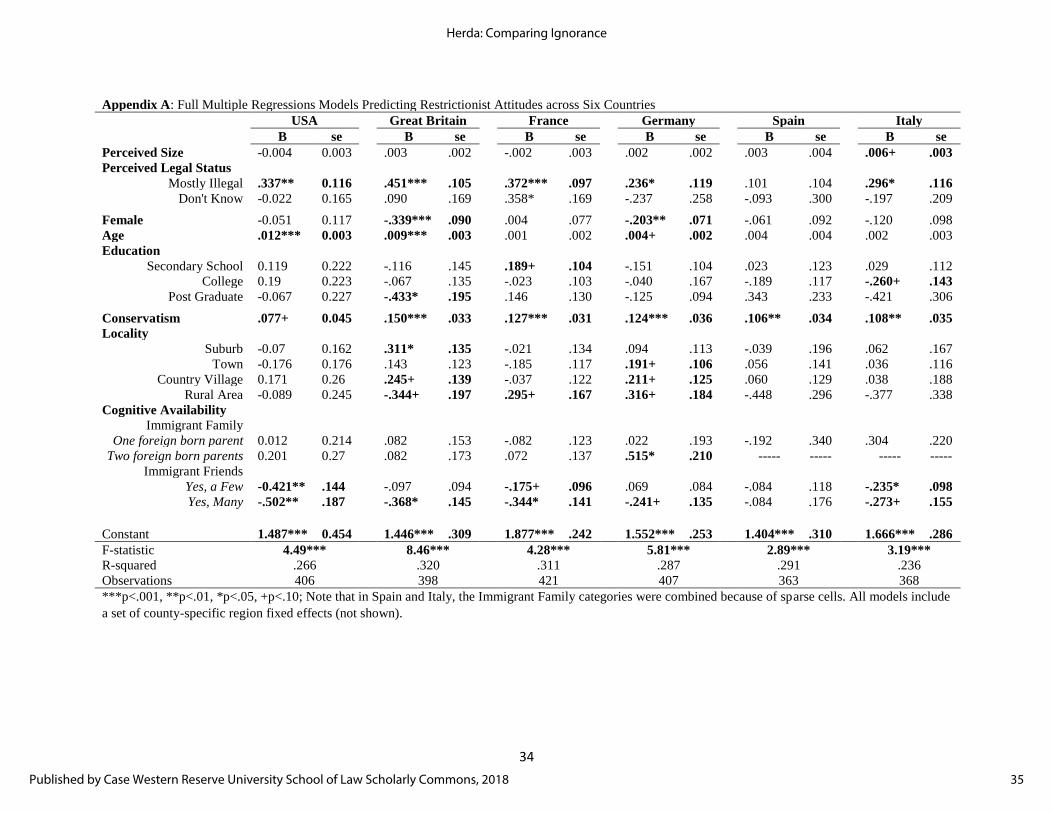
Appendix A: Full Multiple Regressions Models Predicting Restrictionist Attitudes across Six Countries
USA Great Britain France Germany Spain Italy
B se
B se
B se
B se
B se
B se
Perceived Size -0.004 0.003
.003 .002
-.002 .003
.002 .002
.003 .004
.006+ .003
Perceived Legal Status
Mostly Illegal .337** 0.116
.451*** .105
.372*** .097
.236* .119
.101 .104
.296* .116
Don't Know -0.022 0.165
.090 .169
.358* .169
-.237 .258
-.093 .300
-.197 .209
Female -0.051 0.117
-.339*** .090
.004 .077
-.203** .071
-.061 .092
-.120 .098
Age .012*** 0.003
.009*** .003
.001 .002
.004+ .002
.004 .004
.002 .003
Education
Secondary School 0.119 0.222
-.116 .145
.189+ .104
-.151 .104
.023 .123
.029 .112
College 0.19 0.223
-.067 .135
-.023 .103
-.040 .167
-.189 .117
-.260+ .143
Post Graduate -0.067 0.227
-.433* .195
.146 .130
-.125 .094
.343 .233
-.421 .306
Conservatism .077+ 0.045
.150*** .033
.127*** .031
.124*** .036
.106** .034
.108** .035
Locality
Suburb -0.07 0.162
.311* .135
-.021 .134
.094 .113
-.039 .196
.062 .167
Town -0.176 0.176
.143 .123
-.185 .117
.191+ .106
.056 .141
.036 .116
Country Village 0.171 0.26
.245+ .139
-.037 .122
.211+ .125
.060 .129
.038 .188
Rural Area -0.089 0.245
-.344+ .197
.295+ .167
.316+ .184
-.448 .296
-.377 .338
Cognitive Availability
Immigrant Family
One foreign born parent 0.012 0.214
.082 .153
-.082 .123
.022 .193
-.192 .340
.304 .220
Two foreign born parents 0.201 0.27
.082 .173
.072 .137
.515* .210
----- -----
----- -----
Immigrant Friends
Yes, a Few -0.421** .144
-.097 .094
-.175+ .096
.069 .084
-.084 .118
-.235* .098
Yes, Many -.502** .187
-.368* .145
-.344* .141
-.241+ .135
-.084 .176
-.273+ .155
Constant 1.487*** 0.454 1.446*** .309 1.877*** .242 1.552*** .253 1.404*** .310 1.666*** .286
F-statistic 4.49***
8.46***
4.28***
5.81***
2.89***
3.19***
R-squared .266
.320
.311
.287
.291
.236
Observations 406 398 421 407 363 368
***p<.001, **p<.01, *p<.05, +p<.10; Note that in Spain and Italy, the Immigrant Family categories were combined because of sparse cells. All models include
a set of county-specific region fixed effects (not shown).
35
Herda: Comparing Ignorance
Published by Case Western Reserve University School of Law Scholarly Commons, 2018

35
36
Societies Without Borders, Vol. 12, Iss. 2 [2018], Art. 9
https://scholarlycommons.law.case.edu/swb/vol12/iss2/9