comparing colleges' graduation rates - urban institute€¦ · differences in six-year...
TRANSCRIPT
RE S E AR C H RE P O R T
Comparing Colleges’
Graduation Rates The Importance of Adjusting for Student Characteristics
Erica Blom Macy Rainer Matthew Chingos
January 2020
C E N T E R O N E D U C A T I O N D A T A A N D P O L I C Y
AB O U T T H E U R BA N I N S T I T U TE
The nonprofit Urban Institute is a leading research organization dedicated to developing evidence-based insights
that improve people’s lives and strengthen communities. For 50 years, Urban has been the trusted source for
rigorous analysis of complex social and economic issues; strategic advice to policymakers, philanthropists, and
practitioners; and new, promising ideas that expand opportunities for all. Our work inspires effective decisions that
advance fairness and enhance the well-being of people and places.
Copyright © January 2020. Urban Institute. Permission is granted for reproduction of this file, with attribution to the
Urban Institute. Cover image by Tim Meko.
Contents Acknowledgments iv
Executive Summary v
Adjusted Graduation Rates 1
Appendix A. What Are the Gains from Individual-Level Data? 22
Appendix B. Graduation Rate Tables 25
Notes 28
References 29
About the Authors 30
Statement of Independence 31

I V A C K N O W L E D G M E N T S
Acknowledgments This report was supported by Arnold Ventures. We are grateful to them and to all our funders, who
make it possible for Urban to advance its mission.
The views expressed are those of the authors and should not be attributed to the Urban Institute,
its trustees, or its funders. Funders do not determine research findings or the insights and
recommendations of Urban experts. Further information on the Urban Institute’s funding principles is
available at urban.org/fundingprinciples.
The authors wish to thank Kelia Washington for excellent research assistance and David Hinson for
copyediting. Douglas Wissoker and Tomas Monarrez provided valuable and thoughtful feedback on
earlier versions of this report. In addition, the authors wish to thank the participants at convenings held
in Hartford, Connecticut, and Richmond, Virginia, in 2018 and 2019, particularly Jan Kiehne and Tod
Massa.
E X E C U T I V E S U M M A R Y V
Executive Summary Policymakers are increasingly using data to understand how well their colleges and universities serve
students by examining such outcomes as graduation rates and earnings in the labor market. States and
the federal government have relied on advances in administrative data systems to publish institution-
and program-level data on student outcomes, but these measures reflect both the characteristics of
students as well as the quality of the institutions they attend.
In this report, we harness longitudinal data systems in Connecticut and Virginia to demonstrate
how student-level data can be used to measure graduation rates that compare each institution’s
students with demographically similar students around the state.
We find that student demographics and academic preparation explain a considerable amount of the
differences in six-year graduation rates between institutions. At four-year colleges, the adjustments
substantially reduce the distribution of graduation rates by as much as 20 percentage points and alter
how institutions rank. Differences in academic preparation, rather than demographics, account for most
of these adjustments.
At two-year colleges, we find that the overall adjustments are smaller and that race or ethnicity and
family income play a larger role than academic preparation. This likely reflects the fact that community
colleges primarily enroll students from the surrounding area, whereas four-year colleges vary in their
selectivity as they admit students from around the state.
These results mean state policymakers should look beyond commonly used unadjusted metrics
when they want to assess institutional quality. This is especially true when outcomes vary significantly
across subgroups or when student characteristics vary significantly across colleges.
Finally, we show that these adjustments cannot be approximated by using only publicly available
institution-level data. State policymakers should consider developing and maintaining student-level
data systems so these more robust measures can be calculated, allowing them to assess which
institutions are best serving their students rather than simply enrolling students who are likely to
graduate from any institution.

Adjusted Graduation Rates Data availability on student outcomes in higher education has significantly increased in recent years. At
the national level, the US Department of Education now reports graduation rates for part-time and
transfer students after decades of only tracking completion for first-time, full-time students. But
graduation rates can conflate institutional quality with student characteristics. For example, selective
colleges that admit only students with strong academic preparation are likely to have better outcomes
than open-access colleges, regardless of the quality of instruction they provide. As a result, a focus on
such seemingly straightforward measures as graduation rates is likely to give misleading impressions to
policymakers and others concerned with improving higher education outcomes.
An alternative to raw performance measures is to develop “value-added” or “adjusted” measures
that provide a more nuanced view of an institution’s performance by taking into account student
characteristics (e.g., demographics and academic preparation). These adjusted measures can be useful
to state policymakers as they attempt to determine the relative efficacy of their state’s higher education
institutions. If adjusted measures alter the rankings, relative to raw measures, that could affect
conclusions about how certain institutions or programs are performing or how to allocate resources
across institutions.
Researchers have long recognized value-added measures as a way to compare institutional
performance in a way that takes student characteristics into account (Bowen, Chingos, and McPherson
2009; Totty 2019). But these measures are most useful if they are based on student-level data that
track individual students. Such databases have become available in a growing number of states over the
past decade,1 increasing the possibility that such measures can be more widely used.
But for value-added measures to be useful, state policymakers must be able to understand how
they work (their advantages and disadvantages). Using detailed individual-level data from Virginia and
Connecticut on graduation rates, this brief demonstrates how adjusted graduation rates can be
calculated and whether and how much they matter. Below, we show how graduation rates and time-to-
degree measures are affected by adjustments for both four-year institutions and two-year institutions.
In appendix A, we explain why these adjusted measures cannot be calculated with the same degree of
accuracy using institution-level data.

2 C O M P A R I N G C O L L E G E S ’ G R A D U A T I O N R A T E S
Developing Adjusted Measures
In discussions with policymakers regarding institutional performance metrics, a common refrain is that
“we have the students we have.” In other words, comparing a highly selective institution such as the
University of Virginia with a less selective one such as Virginia State University is misleading at best and
unfair at worst. As such, we have developed measures that attempt to show how well Institution X is
performing, given the students it has. Our adjustment corrects for observed differences in student
characteristics between institutions caused by sorting (on the part of students) or selection (on the part
of institutions). We cannot fully account for all sorting and selection, as much of this is caused by
unmeasured factors (e.g., motivation) and factors that are observable to admissions officers but
generally not captured in data available to researchers (e.g., teacher recommendations and admissions
essays).2
Value-added measures of college quality are not new. Hoxby (2015) uses quasi randomization by
admissions staff and students to address selection based on academic background and geography or
family background. At community colleges, Horn, Horner, and Lee (2019) argue that value-added
measures are important to consider alongside raw performance metrics, providing a more nuanced
interpretation of what might otherwise appear to be lackluster performance. Value-added measures
may also predict student outcomes more accurately than conventional rankings or provide a point of
comparison for community colleges or nonselective institutions that have been omitted from previous
rankings altogether (Rothwell and Kulkarni 2015).
Although not a focus of our work here, value-added measures are also relevant in understanding
what institutional characteristics, rather than student characteristics, are conducive to student success.
Using earnings data from the College Scorecard to rank colleges, Rothwell (2019) finds that graduates
of colleges with certain qualities—including curricula oriented around well-paid fields, higher
completion rates, and higher faculty salaries—enjoy higher earnings. Other research suggests
institutions with cultures of equity and mentorship are particularly effective.3 Smith and Stange (2015)
use value-added models to demonstrate the role of high-performing peers and low transfer barriers in
community college student achievement.
Model
Our value-added models are based on individual-level data. As we argue in appendix A, this is a superior
approach to one using institution-level data. We use separate models for each state (Connecticut and
C O M P A R I N G C O L L E G E S ’ G R A D U A T I O N R A T E S 3
Virginia) and level of institution (two-year versus four-year), but they all take the following generic
form:
Yij = aj + XijB + eij
where Yij represents graduation for individual i at institution j. We estimate this model using ordinary
least squares.
Xij represents (some subset of) the following student characteristics: academic preparedness (e.g.,
high school GPA, SAT scores, standardized test scores), demographics (e.g., race or ethnicity, gender,
age, Pell grant receipt, income variables), and intensity of study (e.g., full time versus part time)
measured at entry,4 with the exact set of covariates depending on the state and the level of institution
(described below). Students missing any of these data (with the exception of income) are excluded from
the model. B is a vector of coefficients.
The aj are the institution “value-add” measures, which tell us the difference in the probability of
graduating from any two given schools. We convert these into “adjusted” outcome measures by adding
back in XijB calculated for a “typical” student in the state. Thus, the adjusted outcome reflects the
expected graduation rate for a student with average characteristics among all students in the model. By
construction, the adjusted measures have the same mean as the raw measures. Below are the precise
variables included in each model.
Four-year model, Virginia. The model we use includes indicators for gender, race or ethnicity,
Pell grant receipt, measures of income (log of family income, an indicator for missing income, a
quadratic in family size, out-of-state status, and dependency status), whether the student
graduated from high school in the past 12 months, a quadratic in SAT scores, and a quadratic in
high school GPA (these last four are “academic factors”). We omit full-time versus part-time
status, as most students are full time at the four-year colleges in our sample. We also omit
variables that are available only in high school records, such as standardized test scores or high
school attendance rates, because several four-year colleges in Virginia admit substantial
numbers of out-of-state students who do not have high school records in our data.
Four-year model, Connecticut. We use the same model as Virginia but omit income variables,
whether the student graduated from high school in the past 12 months, and high school GPA, as
these variables are unavailable in the Connecticut data.
Two-year model, Virginia. We include gender, race or ethnicity, Pell grant receipt, family
income, full-time versus part-time status, dependency status, high school attendance, and
4 C O M P A R I N G C O L L E G E S ’ G R A D U A T I O N R A T E S
quadratics in reading, writing, and geometry high school standardized test scores. The models
are limited to students who attended high school in Virginia and include only associate’s
degrees or higher.
Two-year model, Connecticut. We use the same model as Virginia but omit the income
measures (as these variables are unavailable) and instead include free and reduced-price lunch
status. The models are limited to students who attended high school in Connecticut.
Data
We use data from state longitudinal data systems that track students from the K–12 system, through
college, and into the labor force. These data allow us to understand student pathways and success and
help us develop nuanced institutional metrics. In particular, they allow us to link individual student
outcomes with demographic characteristics and high school preparation.
In Virginia, we have data for all public and private nonprofit four-year colleges and for all public
two-year colleges. In Connecticut, we have data for all public two- and four-year colleges and two
private nonprofit four-year colleges. In our analyses, we use cohorts entering college in fall 2010, 2011,
and 2012 for Connecticut two-year colleges; fall 2009, 2010, 2011, and 2012 for Connecticut four-year
colleges; and fall 2009, 2010, 2011, and 2012 for Virginia two- and four-year colleges.
Four-Year Colleges
We begin our exploration of adjusted outcome measures using four-year college graduation rates in
Virginia. Virginia has 39 public and private nonprofit colleges and universities with raw graduation rates
ranging from just over 20 percent to nearly 100 percent. Using the model described above to adjust for
gender, race or ethnicity, Pell grant receipt, income, and academic factors, we see this raw difference of
over 70 percentage points shrink to about 50 percentage points.
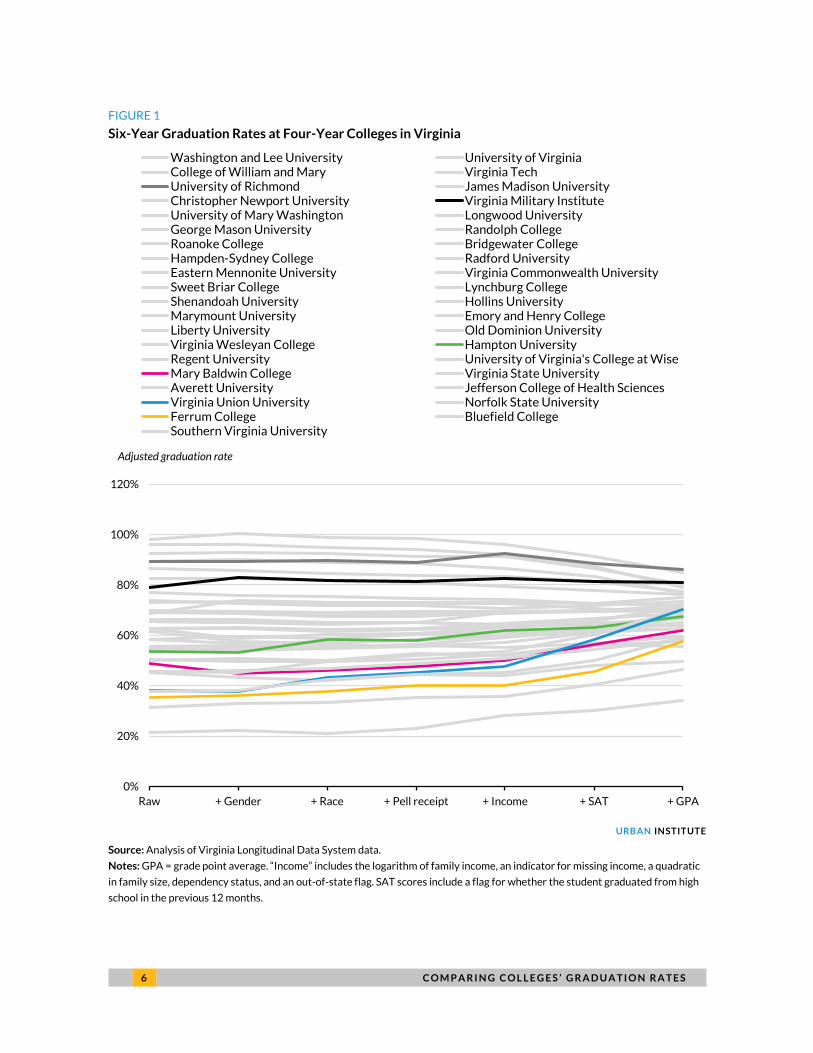
These adjustments not only substantially compress the distribution of graduation rates, but, for
several institutions, the rankings change considerably. Although the rankings of many schools at the top
and bottom remain unchanged, nearly all the others change. The University of Richmond (the dark gray
line in figure 1) rises from fifth to first, while Ferrum College (gold) rises from third lowest to sixth
lowest. Some of the swings are more dramatic: Virginia State University rises from 32nd to 16th with a
24 percentage-point increase in its graduation rate, and Virginia Union University (blue) moves from
35th to 17th with a 32 percentage-point increase.

C O M P A R I N G C O L L E G E S ’ G R A D U A T I O N R A T E S 5
What drives these results? Figure 1 shows the cumulative impact of each factor as it enters the
model, with the final adjusted graduation rates on the right. We first include only gender in the model,
and then we add other characteristics until we arrive at our final adjusted measure, which includes all
factors. Although graduation rate differences between institutions tend to shrink, not all factors adjust
graduation rates in the same direction. Below, we discuss how and why these factors have the effects
they do.
6 C O M P A R I N G C O L L E G E S ’ G R A D U A T I O N R A T E S
FIGURE 1
Six-Year Graduation Rates at Four-Year Colleges in Virginia
URBAN INSTITUTE
Source: Analysis of Virginia Longitudinal Data System data.
Notes: GPA = grade point average. “Income” includes the logarithm of family income, an indicator for missing income, a quadratic
in family size, dependency status, and an out-of-state flag. SAT scores include a flag for whether the student graduated from high
school in the previous 12 months.
0%
20%
40%
60%
80%
100%
120%
Raw + Gender + Race + Pell receipt + Income + SAT + GPA
Washington and Lee University University of VirginiaCollege of William and Mary Virginia TechUniversity of Richmond James Madison UniversityChristopher Newport University Virginia Military InstituteUniversity of Mary Washington Longwood UniversityGeorge Mason University Randolph CollegeRoanoke College Bridgewater CollegeHampden-Sydney College Radford UniversityEastern Mennonite University Virginia Commonwealth UniversitySweet Briar College Lynchburg CollegeShenandoah University Hollins UniversityMarymount University Emory and Henry CollegeLiberty University Old Dominion UniversityVirginia Wesleyan College Hampton UniversityRegent University University of Virginia's College at WiseMary Baldwin College Virginia State UniversityAverett University Jefferson College of Health SciencesVirginia Union University Norfolk State UniversityFerrum College Bluefield CollegeSouthern Virginia University
Adjusted graduation rate

C O M P A R I N G C O L L E G E S ’ G R A D U A T I O N R A T E S 7
First, note that a graduation rate can be rewritten as a weighted average of graduation rates across
different subgroups. For example, a college’s graduation rate can be calculated as the female graduation
rate times the share of students who are female, plus the male graduation rate times the share of
students who are male. The adjusted graduation rate essentially reweights the graduation rates for each
group by the average weights across the state to reflect the expected graduation rate for a “typical”
student. If an institution has a large subgroup whose statewide average graduation rate is lower than for
other subgroups, the adjusted graduation rate will tend to move upward (and vice versa). In other
words, two things matter: the size of each subgroup at each institution and the statewide graduation
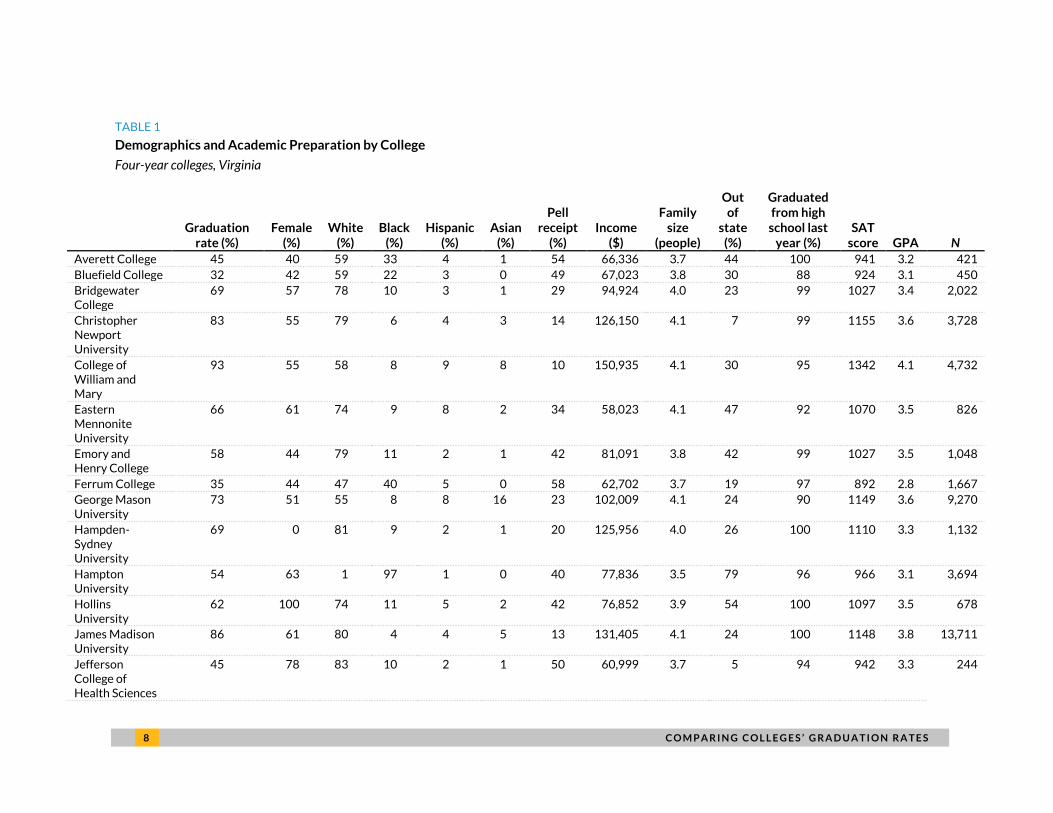
rates for those subgroups. Table 1 describes the average characteristics of each college’s students.
The role of race, ethnicity, and gender in the model is most obvious at colleges with demographics
dramatically different from the average. For example, the black line in figure 1 above is the Virginia
Military Institute, which is 90 percent male. Moreover, the statewide male graduation rate (66 percent)
is substantially lower than the female rate (74 percent) (appendix table B.1). As a result, the Virginia
Military Institute graduation rate is adjusted upward. We see a similar adjustment at Hampden-Sydney
College, a men’s college. Conversely, Mary Baldwin College (magenta) and Hollins University, both
women’s colleges, are adjusted downward.
This plays out similarly in colleges and universities that tend to serve mainly one racial or ethnic
group. For example, Hampton University (green) and Virginia Union University, both historically black
colleges or universities (HBCUs), are adjusted upward when race or ethnicity is included (appendix table
B.2). To see why, observe that the statewide white graduation rate (75 percent) is higher than the
statewide black graduation rate (53 percent). Hampton University is 97 percent black. The high share of
black students combined with a statewide black college graduation rate that is lower than the white
graduation rate results in an upward adjustment to Hampton University’s graduation rate.
Pell grant receipt and the income variables do not dramatically adjust graduation rates, but this is
partly because they are correlated with race. Nevertheless, this adjustment does affect some
institutions. Hampton University is adjusted upward when income is included, as the average family
income ($77,836) is below the state average of $99,680, and students from less wealthy families tend to
graduate at lower rates than students from wealthier families.5
8 C O M P A R I N G C O L L E G E S ’ G R A D U A T I O N R A T E S
TABLE 1
Demographics and Academic Preparation by College
Four-year colleges, Virginia
Graduation
rate (%) Female
(%) White
(%) Black
(%) Hispanic
(%) Asian
(%)
Pell receipt
(%) Income
($)
Family size
(people)
Out of
state (%)
Graduated from high
school last year (%)
SAT score GPA N
Averett College 45 40 59 33 4 1 54 66,336 3.7 44 100 941 3.2 421
Bluefield College 32 42 59 22 3 0 49 67,023 3.8 30 88 924 3.1 450
Bridgewater College
69 57 78 10 3 1 29 94,924 4.0 23 99 1027 3.4 2,022
Christopher Newport University
83 55 79 6 4 3 14 126,150 4.1 7 99 1155 3.6 3,728
College of William and Mary
93 55 58 8 9 8 10 150,935 4.1 30 95 1342 4.1 4,732
Eastern Mennonite University
66 61 74 9 8 2 34 58,023 4.1 47 92 1070 3.5 826
Emory and Henry College
58 44 79 11 2 1 42 81,091 3.8 42 99 1027 3.5 1,048
Ferrum College 35 44 47 40 5 0 58 62,702 3.7 19 97 892 2.8 1,667
George Mason University
73 51 55 8 8 16 23 102,009 4.1 24 90 1149 3.6 9,270
Hampden-Sydney University
69 0 81 9 2 1 20 125,956 4.0 26 100 1110 3.3 1,132
Hampton University
54 63 1 97 1 0 40 77,836 3.5 79 96 966 3.1 3,694
Hollins University
62 100 74 11 5 2 42 76,852 3.9 54 100 1097 3.5 678
James Madison University
86 61 80 4 4 5 13 131,405 4.1 24 100 1148 3.8 13,711
Jefferson College of Health Sciences
45 78 83 10 2 1 50 60,999 3.7 5 94 942 3.3 244

C O M P A R I N G C O L L E G E S ’ G R A D U A T I O N R A T E S 9
Graduation
rate (%) Female
(%) White
(%) Black
(%) Hispanic
(%) Asian
(%)
Pell receipt
(%) Income
($)
Family size
(people)
Out of
state (%)
Graduated from high
school last year (%)
SAT score GPA N
Liberty University
56 53 64 8 4 2 31 104,235 4.3 65 87 1018 3.3 9,245
Longwood University
74 67 77 6 4 1 21 89,732 4.0 0 99 1030 3.4 3,745
Lynchburg College
63 58 79 10 4 1 30 94,871 4.0 38 100 1012 3.2 2,184
Mary Baldwin College
49 99 45 34 7 7 55 62,661 2.6 29 46 845 3.1 823
Marymount University
58 72 41 20 16 9 31 90,833 4.1 50 93 994 3.1 1,517
Norfolk State University
38 55 2 77 2 1 65 49,438 3.5 24 93 877 2.8 3,507
Old Dominion University
55 51 52 29 5 5 32 82,309 3.8 11 65 1025 3.3 10,059
Radford University
66 57 82 7 4 2 24 100,686 3.9 7 97 1003 3.2 7,058
Randolph College
70 55 74 13 4 3 28 107,999 3.7 31 98 1071 3.5 1,686
Regent University
50 59 65 15 8 1 36 72,484 4.2 41 0 1040 3.5 282
Roanoke College 69 60 86 4 4 1 24 115,159 4.0 54 100 1078 3.4 1,536
Shenandoah University
63 53 72 13 4 3 26 108,652 1.8 41 97 1012 3.3 1,570
Southern Virginia University
22 48 85 4 3 2 44 83,088 5.2 86 95 1048 3.3 754
Sweet Briar College
63 100 24 2 1 1 32 99,289 2.6 53 86 1052 3.4 642
University of Mary Washington
77 66 63 6 5 5 15 111,875 4.1 16 99 1143 3.6 358
University of Richmond
89 57 45 7 5 6 16 119,319 4.1 77 100 1275 3.8 2,188
1 0 C O M P A R I N G C O L L E G E S ’ G R A D U A T I O N R A T E S
Graduation
rate (%) Female
(%) White
(%) Black
(%) Hispanic
(%) Asian
(%)
Pell receipt
(%) Income
($)
Family size
(people)
Out of
state (%)
Graduated from high
school last year (%)
SAT score GPA N
University of Virginia
96 56 61 7 5 17 12 123,514 4.1 0 98 1330 4.2 8,428
University of Virginia College at Wise
50 48 77 14 2 1 54 59,418 3.8 6 100 943 3.3 1,458
Virginia Commonwealth University
65 58 50 19 6 15 30 90,879 3.9 10 93 1082 3.5 13,096
Virginia Military Institute
79 10 84 6 4 5 15 121,015 4.2 44 100 1143 3.5 1,737
Virginia State University
46 63 1 68 2 0 69 45,204 3.5 38 45 857 2.8 4,828
Virginia Tech 89 47 73 4 5 11 16 116,699 4.1 0 98 1216 3.9 13,955
Virginia Union University
38 57 0 98 1 0 67 47,850 3.4 53 37 768 2.6 880
Virginia Wesleyan College
55 60 57 24 5 2 38 87,528 1.2 29 0 994 3.1 1,284
Washington and Lee University
98 35 94 4 0 2 12 178,165 4.5 0 100 1364 4.0 49
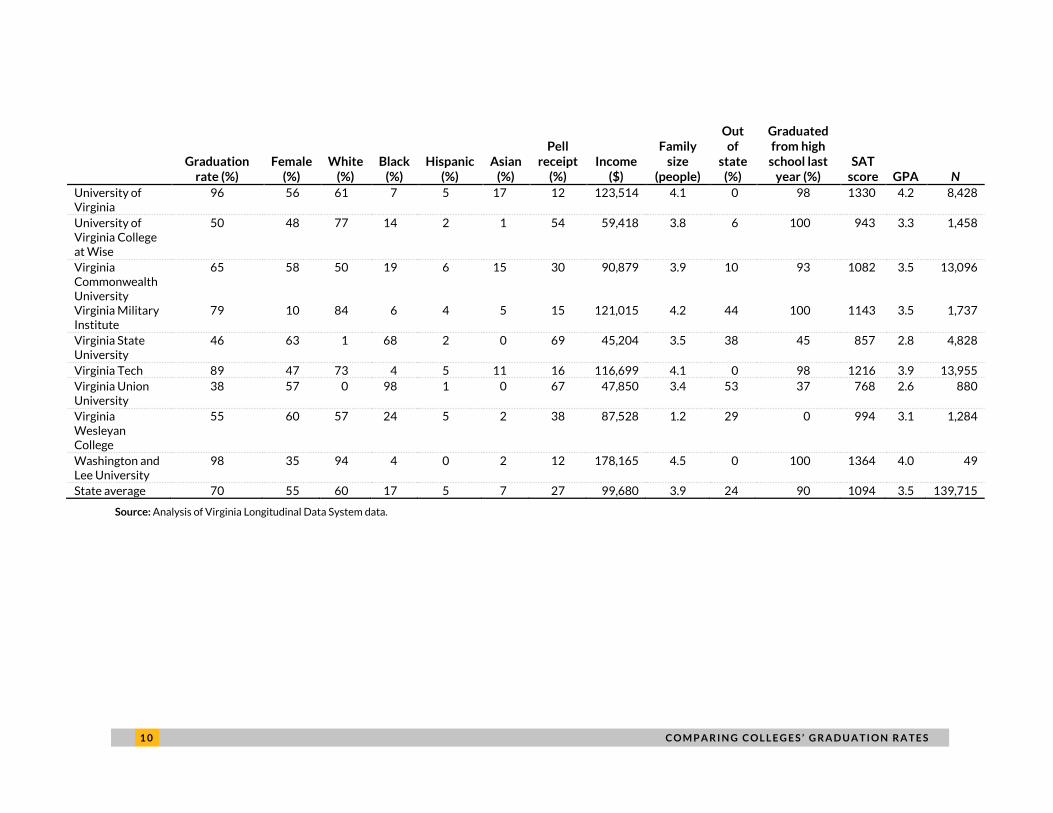
State average 70 55 60 17 5 7 27 99,680 3.9 24 90 1094 3.5 139,715
Source: Analysis of Virginia Longitudinal Data System data.
C O M P A R I N G C O L L E G E S ’ G R A D U A T I O N R A T E S 1 1
The largest factor by far, however, is academic preparation. This is consistent with a vast literature
(Chingos 2018). In general, colleges with high raw graduation rates are adjusted downward by our
academic preparation measures, while colleges with low raw graduation rates tend to be adjusted
upward. This is because colleges vary in selectivity. The College of William and Mary, for example, tends
to admit students from the top of the distribution of academic preparedness. These are students who
are likely to graduate from any college, so the value-add is less than raw graduation rates might initially
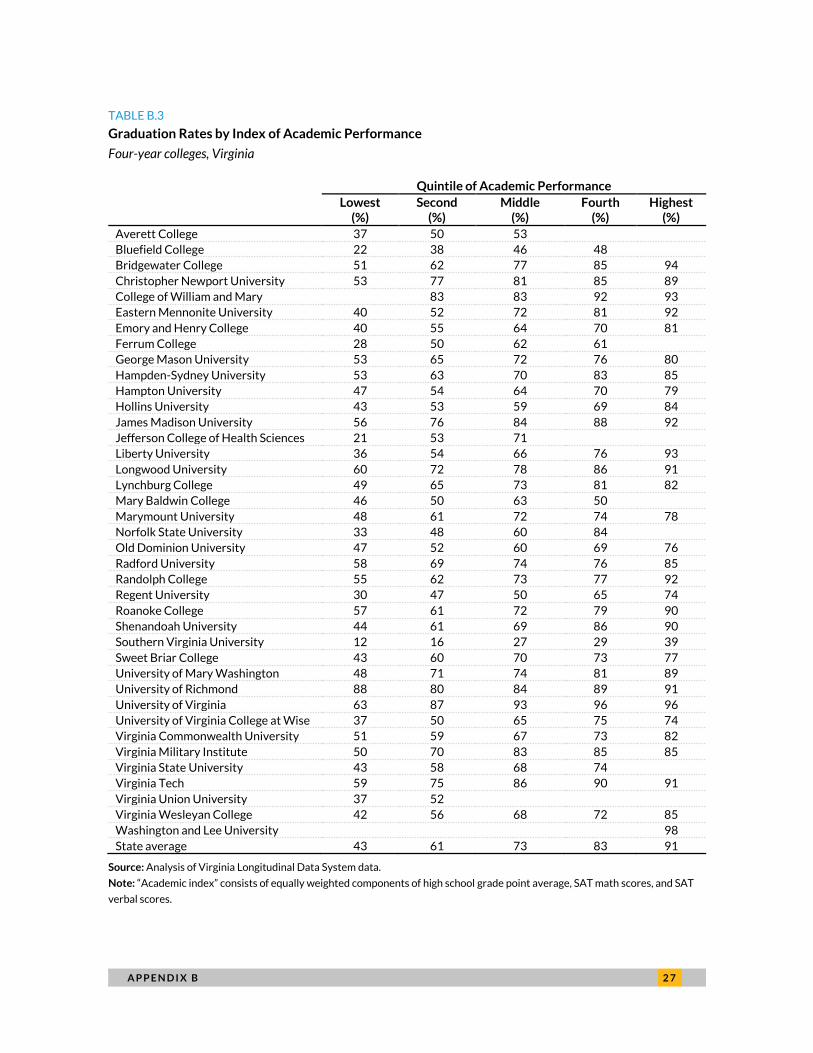
make it appear. At the same time, students in the middle quintile at William and Mary tend to graduate
at a rate that is about 10 percentage points higher than the state average (appendix table B.3),
suggesting either that these students have unmeasured characteristics that give them a high likelihood
of graduating or that William and Mary truly is adding value for these students. Conversely, the lowest-
performing college, Southern Virginia University, is adjusted upward (these students do better than we
might expect, given their academic preparation).
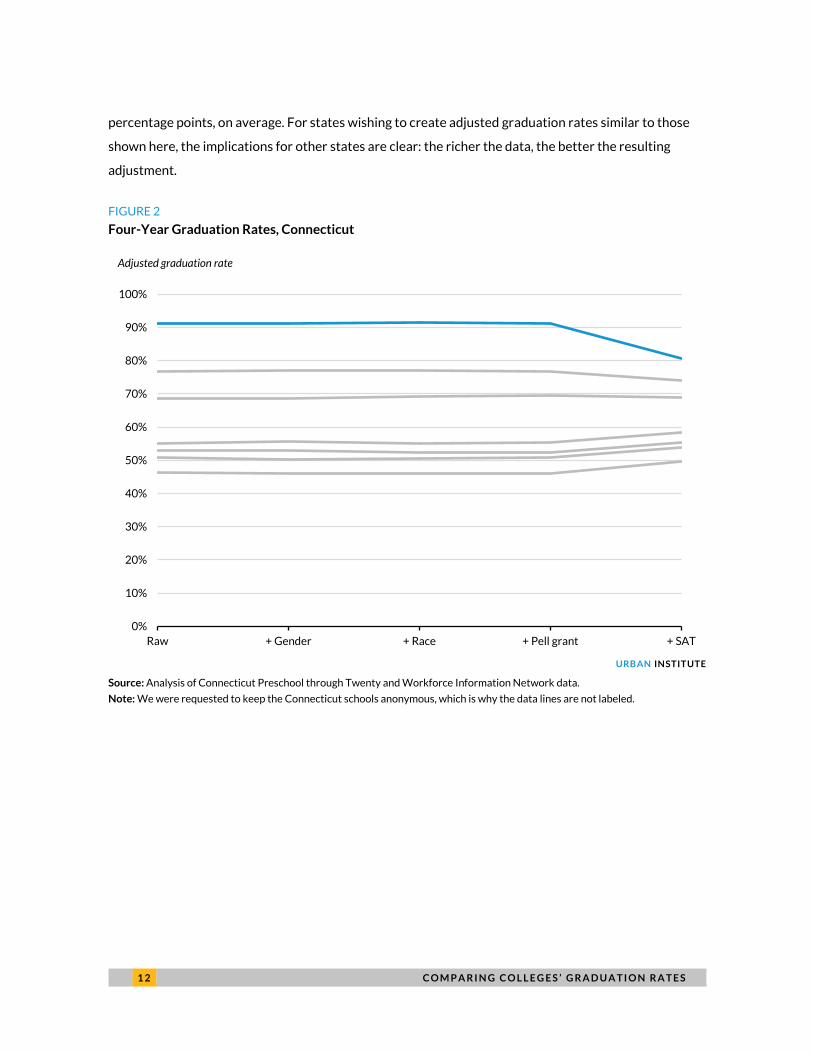
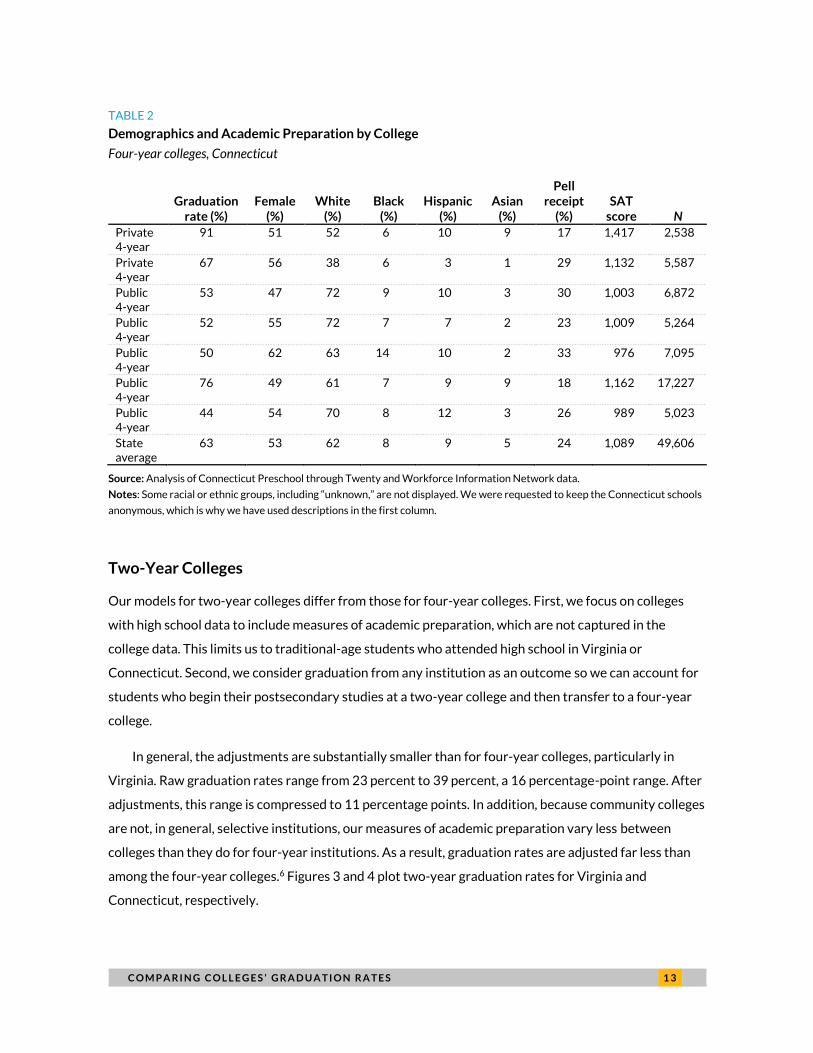
In Connecticut (figure 2), we see a similar pattern, and we also see that academic factors are the
greatest contributors to the adjustment. At the same time, the adjustments are more muted than in
Virginia, and colleges’ rankings do not change. Several factors are responsible.
We argued above that two factors matter for the adjustments: the sizes of those subgroups at each
institution and the statewide graduation rates for those subgroups. Given this, we would expect either
that student characteristics are more similar across colleges in Connecticut than in Virginia or that
graduation rates vary less between subgroups. Here, both play a role. Student characteristics vary less
across colleges than in Virginia (e.g., there are no HBCUs in our Connecticut data). The share of black
students across the seven colleges in our sample varies only between 6 and 14 percentage points (table
2). Similarly, the range of SAT scores is, with the exception of one of the private colleges, relatively
narrow. The second factor, statewide graduation rates by group, also plays a role. For example, as we
show in a companion brief, the graduation rate gaps by race or ethnicity are smaller in Connecticut than
in Virginia. Combining these two elements results in less adjustment in Connecticut than in Virginia.
In addition, the adjustment is affected by the omission of two sets of variables we included in the
Virginia analysis: family income and high school GPA. In Virginia, we saw that adding GPA led to greater
adjustments than SAT scores alone. There is no reason to believe we would not see a similar pattern in
Connecticut, given similar data. To determine how much this matters, we adjusted the Virginia data
using the same covariates as are available in Connecticut (e.g., gender, race or ethnicity, Pell grant
receipt, and SAT scores). Graduation rates were adjusted substantially less than they were using the full
model. In particular, our full model for Virginia results in an average adjustment of 9 percentage points,
in absolute-value terms. Our Connecticut-equivalent model adjusted graduation rates by only 4
1 2 C O M P A R I N G C O L L E G E S ’ G R A D U A T I O N R A T E S
percentage points, on average. For states wishing to create adjusted graduation rates similar to those
shown here, the implications for other states are clear: the richer the data, the better the resulting
adjustment.
FIGURE 2
Four-Year Graduation Rates, Connecticut
URBAN INSTITUTE
Source: Analysis of Connecticut Preschool through Twenty and Workforce Information Network data.
Note: We were requested to keep the Connecticut schools anonymous, which is why the data lines are not labeled.
0%
10%
20%
30%
40%
50%
60%
70%
80%
90%
100%
Raw + Gender + Race + Pell grant + SAT
Adjusted graduation rate
C O M P A R I N G C O L L E G E S ’ G R A D U A T I O N R A T E S 1 3
TABLE 2
Demographics and Academic Preparation by College
Four-year colleges, Connecticut
Graduation
rate (%) Female
(%) White
(%) Black
(%) Hispanic
(%) Asian
(%)
Pell receipt
(%) SAT
score N
Private 4-year
91 51 52 6 10 9 17 1,417 2,538
Private 4-year
67 56 38 6 3 1 29 1,132 5,587
Public 4-year
53 47 72 9 10 3 30 1,003 6,872
Public 4-year
52 55 72 7 7 2 23 1,009 5,264
Public 4-year
50 62 63 14 10 2 33 976 7,095
Public 4-year
76 49 61 7 9 9 18 1,162 17,227
Public 4-year
44 54 70 8 12 3 26 989 5,023
State average
63 53 62 8 9 5 24 1,089 49,606
Source: Analysis of Connecticut Preschool through Twenty and Workforce Information Network data.
Notes: Some racial or ethnic groups, including “unknown,” are not displayed. We were requested to keep the Connecticut schools
anonymous, which is why we have used descriptions in the first column.
Two-Year Colleges
Our models for two-year colleges differ from those for four-year colleges. First, we focus on colleges
with high school data to include measures of academic preparation, which are not captured in the
college data. This limits us to traditional-age students who attended high school in Virginia or
Connecticut. Second, we consider graduation from any institution as an outcome so we can account for
students who begin their postsecondary studies at a two-year college and then transfer to a four-year
college.
In general, the adjustments are substantially smaller than for four-year colleges, particularly in
Virginia. Raw graduation rates range from 23 percent to 39 percent, a 16 percentage-point range. After
adjustments, this range is compressed to 11 percentage points. In addition, because community colleges
are not, in general, selective institutions, our measures of academic preparation vary less between
colleges than they do for four-year institutions. As a result, graduation rates are adjusted far less than
among the four-year colleges.6 Figures 3 and 4 plot two-year graduation rates for Virginia and
Connecticut, respectively.
1 4 C O M P A R I N G C O L L E G E S ’ G R A D U A T I O N R A T E S
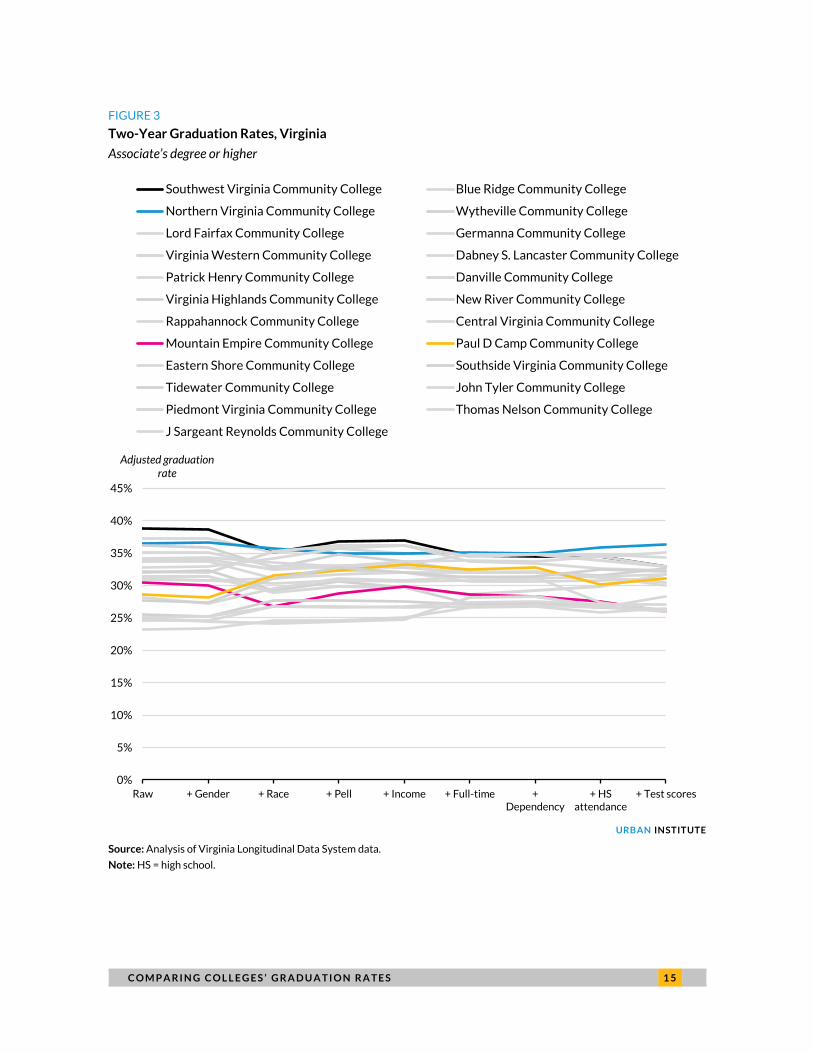
In general, the two-year model is noisier than the four-year model. In the four-year model, each
additional input tends to shift the adjustment in the same direction (although not always). This is not the
case for two-year institutions. Nonetheless, notable patterns emerge.
Unlike in four-year colleges, race or ethnicity is far more important than academic measures. (We
do not include SAT scores, as most community college students do not take the SAT. Instead, we
measure academic preparation using state standardized test scores collected roughly in 10th grade.7)
For example, Mountain Empire Community College (magenta), an overwhelmingly white institute, has
its graduation rate adjusted downward when race is included, whereas Paul D. Camp (gold), which is 42
percent black, is adjusted upward.
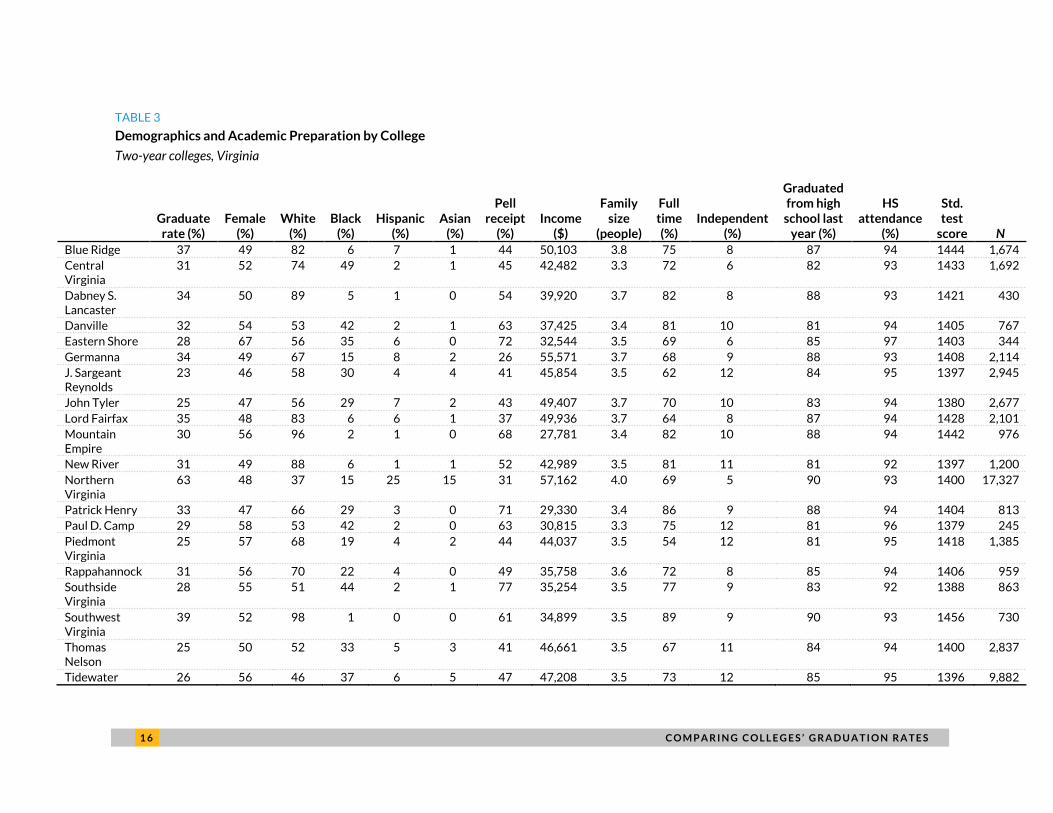
We also find that Pell grant receipt and family income play important roles, in contrast with four-
year colleges. The black line in figure 3 represents Southwest Virginia Community College (SWCC). Its
graduation rate is adjusted up when Pell grant receipt is included and is adjusted up slightly more when
income is included. Accounting for the fact that SWCC serves less-wealthy students (table 3), who are
less likely to graduate on average, adjusts the graduation rate upward. Conversely, Northern Virginia
Community College’s (NVCC’s) graduation rate (blue) is adjusted slightly downward with Pell grant
receipt and income, as their students’ family incomes are slightly above the state average. In fact, NVCC
is the only community college whose graduation rate is adjusted downward more than half a percentage
point by Pell receipt and family income. In the four-year model, we did not include full-time status, as
most four-year students in our sample were enrolled full time (defined as enrolled in 12 or more credits
in the fall semester of their freshman year). But many community colleges students attend part time.
Students who study full time are more likely to graduate that those who do not.8 This is borne out in our
adjustments. For example, SWCC’s graduation rate is adjusted downward because the share of full-time
students at SWCC in our sample is high, and we would expect these students to have a higher likelihood
of graduating from any college.
C O M P A R I N G C O L L E G E S ’ G R A D U A T I O N R A T E S 1 5
FIGURE 3
Two-Year Graduation Rates, Virginia
Associate’s degree or higher
URBAN INSTITUTE
Source: Analysis of Virginia Longitudinal Data System data.
Note: HS = high school.
0%
5%
10%
15%
20%
25%
30%
35%
40%
45%
Raw + Gender + Race + Pell + Income + Full-time +Dependency
+ HSattendance
+ Test scores
Adjusted graduation rate
Southwest Virginia Community College Blue Ridge Community College
Northern Virginia Community College Wytheville Community College
Lord Fairfax Community College Germanna Community College
Virginia Western Community College Dabney S. Lancaster Community College
Patrick Henry Community College Danville Community College
Virginia Highlands Community College New River Community College
Rappahannock Community College Central Virginia Community College
Mountain Empire Community College Paul D Camp Community College
Eastern Shore Community College Southside Virginia Community College
Tidewater Community College John Tyler Community College
Piedmont Virginia Community College Thomas Nelson Community College
J Sargeant Reynolds Community College
1 6 C O M P A R I N G C O L L E G E S ’ G R A D U A T I O N R A T E S
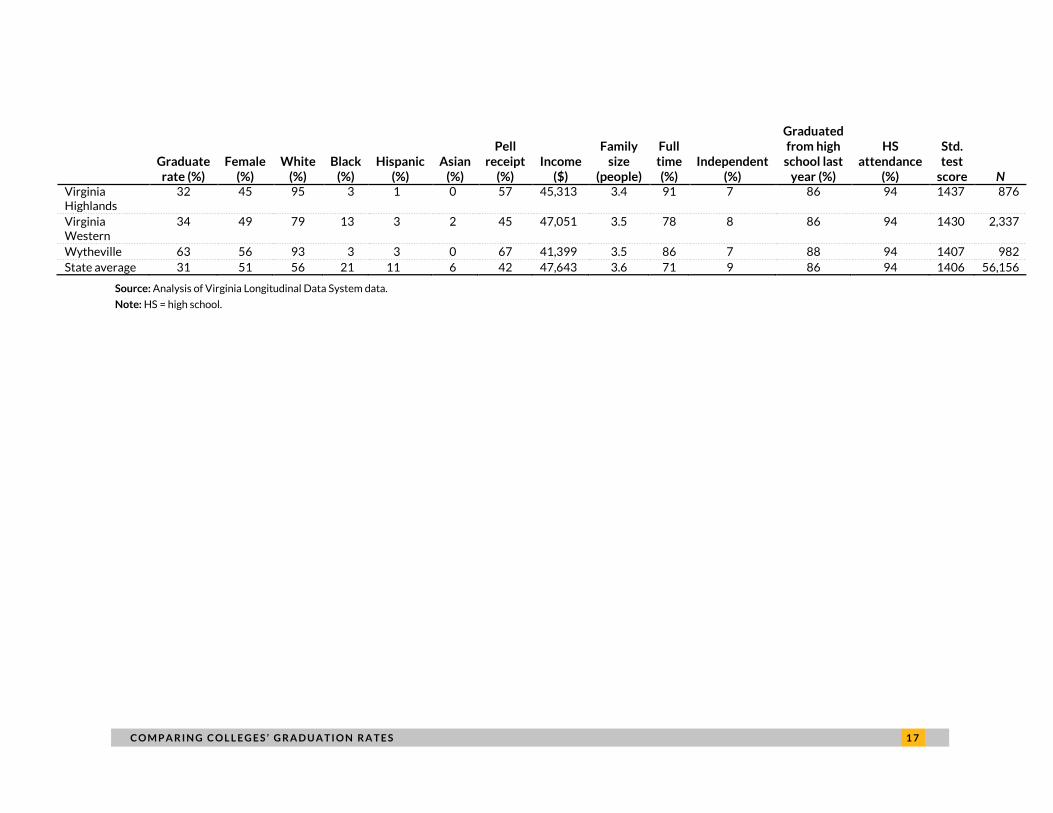
TABLE 3
Demographics and Academic Preparation by College
Two-year colleges, Virginia
Graduate
rate (%) Female
(%) White
(%) Black
(%) Hispanic
(%) Asian
(%)
Pell receipt
(%) Income
($)
Family size
(people)
Full time (%)
Independent (%)
Graduated from high
school last year (%)
HS attendance
(%)
Std. test
score N
Blue Ridge 37 49 82 6 7 1 44 50,103 3.8 75 8 87 94 1444 1,674
Central Virginia
31 52 74 49 2 1 45 42,482 3.3 72 6 82 93 1433 1,692
Dabney S. Lancaster
34 50 89 5 1 0 54 39,920 3.7 82 8 88 93 1421 430
Danville 32 54 53 42 2 1 63 37,425 3.4 81 10 81 94 1405 767
Eastern Shore 28 67 56 35 6 0 72 32,544 3.5 69 6 85 97 1403 344
Germanna 34 49 67 15 8 2 26 55,571 3.7 68 9 88 93 1408 2,114
J. Sargeant Reynolds
23 46 58 30 4 4 41 45,854 3.5 62 12 84 95 1397 2,945
John Tyler 25 47 56 29 7 2 43 49,407 3.7 70 10 83 94 1380 2,677
Lord Fairfax 35 48 83 6 6 1 37 49,936 3.7 64 8 87 94 1428 2,101
Mountain Empire
30 56 96 2 1 0 68 27,781 3.4 82 10 88 94 1442 976
New River 31 49 88 6 1 1 52 42,989 3.5 81 11 81 92 1397 1,200
Northern Virginia
63 48 37 15 25 15 31 57,162 4.0 69 5 90 93 1400 17,327
Patrick Henry 33 47 66 29 3 0 71 29,330 3.4 86 9 88 94 1404 813
Paul D. Camp 29 58 53 42 2 0 63 30,815 3.3 75 12 81 96 1379 245
Piedmont Virginia
25 57 68 19 4 2 44 44,037 3.5 54 12 81 95 1418 1,385
Rappahannock 31 56 70 22 4 0 49 35,758 3.6 72 8 85 94 1406 959
Southside Virginia
28 55 51 44 2 1 77 35,254 3.5 77 9 83 92 1388 863
Southwest Virginia
39 52 98 1 0 0 61 34,899 3.5 89 9 90 93 1456 730
Thomas Nelson
25 50 52 33 5 3 41 46,661 3.5 67 11 84 94 1400 2,837
Tidewater 26 56 46 37 6 5 47 47,208 3.5 73 12 85 95 1396 9,882
C O M P A R I N G C O L L E G E S ’ G R A D U A T I O N R A T E S 1 7
Graduate
rate (%) Female
(%) White
(%) Black
(%) Hispanic
(%) Asian
(%)
Pell receipt
(%) Income
($)
Family size
(people)
Full time (%)
Independent (%)
Graduated from high
school last year (%)
HS attendance
(%)
Std. test
score N Virginia Highlands
32 45 95 3 1 0 57 45,313 3.4 91 7 86 94 1437 876
Virginia Western
34 49 79 13 3 2 45 47,051 3.5 78 8 86 94 1430 2,337
Wytheville 63 56 93 3 3 0 67 41,399 3.5 86 7 88 94 1407 982
State average 31 51 56 21 11 6 42 47,643 3.6 71 9 86 94 1406 56,156
Source: Analysis of Virginia Longitudinal Data System data.
Note: HS = high school.
1 8 C O M P A R I N G C O L L E G E S ’ G R A D U A T I O N R A T E S
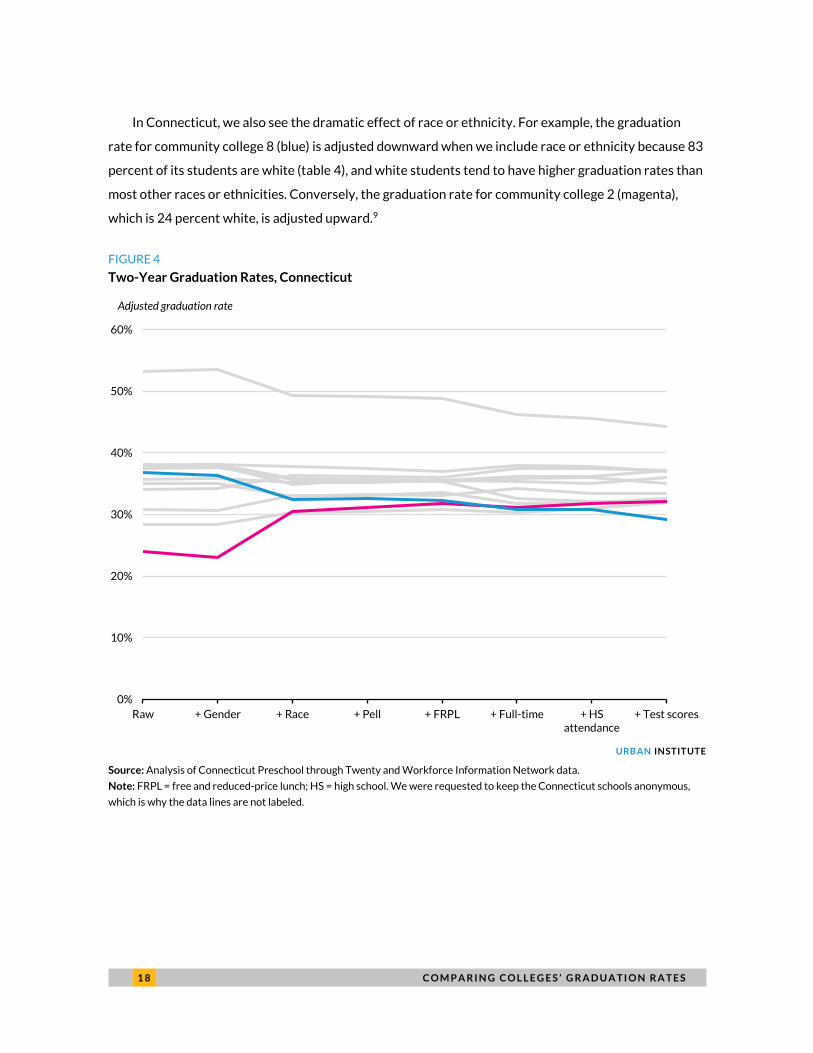
In Connecticut, we also see the dramatic effect of race or ethnicity. For example, the graduation
rate for community college 8 (blue) is adjusted downward when we include race or ethnicity because 83
percent of its students are white (table 4), and white students tend to have higher graduation rates than
most other races or ethnicities. Conversely, the graduation rate for community college 2 (magenta),
which is 24 percent white, is adjusted upward.9
FIGURE 4
Two-Year Graduation Rates, Connecticut
URBAN INSTITUTE
Source: Analysis of Connecticut Preschool through Twenty and Workforce Information Network data.
Note: FRPL = free and reduced-price lunch; HS = high school. We were requested to keep the Connecticut schools anonymous,
which is why the data lines are not labeled.
0%
10%
20%
30%
40%
50%
60%
Raw + Gender + Race + Pell + FRPL + Full-time + HSattendance
+ Test scores
Adjusted graduation rate
C O M P A R I N G C O L L E G E S ’ G R A D U A T I O N R A T E S 1 9
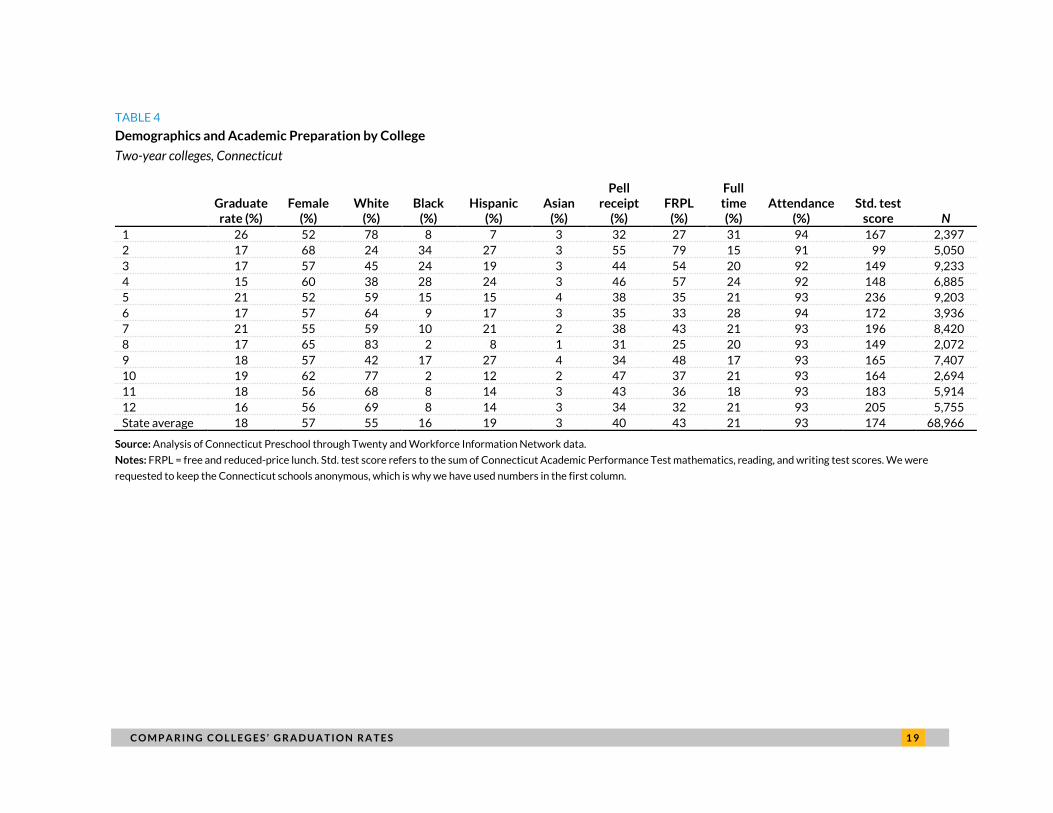
TABLE 4
Demographics and Academic Preparation by College
Two-year colleges, Connecticut
Graduate
rate (%) Female
(%) White
(%) Black
(%) Hispanic
(%) Asian
(%)
Pell receipt
(%) FRPL
(%)
Full time (%)
Attendance (%)
Std. test score N
1 26 52 78 8 7 3 32 27 31 94 167 2,397
2 17 68 24 34 27 3 55 79 15 91 99 5,050
3 17 57 45 24 19 3 44 54 20 92 149 9,233
4 15 60 38 28 24 3 46 57 24 92 148 6,885
5 21 52 59 15 15 4 38 35 21 93 236 9,203
6 17 57 64 9 17 3 35 33 28 94 172 3,936
7 21 55 59 10 21 2 38 43 21 93 196 8,420
8 17 65 83 2 8 1 31 25 20 93 149 2,072
9 18 57 42 17 27 4 34 48 17 93 165 7,407
10 19 62 77 2 12 2 47 37 21 93 164 2,694
11 18 56 68 8 14 3 43 36 18 93 183 5,914
12 16 56 69 8 14 3 34 32 21 93 205 5,755
State average 18 57 55 16 19 3 40 43 21 93 174 68,966
Source: Analysis of Connecticut Preschool through Twenty and Workforce Information Network data.
Notes: FRPL = free and reduced-price lunch. Std. test score refers to the sum of Connecticut Academic Performance Test mathematics, reading, and writing test scores. We were
requested to keep the Connecticut schools anonymous, which is why we have used numbers in the first column.
2 0 C O M P A R I N G C O L L E G E S ’ G R A D U A T I O N R A T E S
These analyses relied on individual-level state longitudinal data. Similar analyses could be done—
and have been done—using institution-level data. But institution-level analyses conflate institutional
quality with student characteristics, a problem that individual-level analyses can somewhat mitigate.
For example, in an institution-level model, the coefficient on, for example, black students, captures both
systemic biases against black students and the fact that black students tend to attend worse colleges.
An individual-level model can separate these out.
In appendix A, we illustrate how analyses based on the same underlying data, but using different
models, can diverge in significant ways. We provide some insight about these differences using Virginia
four-year colleges as a case study. In particular, we show that the questions policymakers are interested
in—the value that colleges add, conditional on the students they serve—are best answered using the
approach we use here.
Conclusion
Individual-level data can add nuance to typical college and university performance metrics. As state
longitudinal data systems mature and become a commonplace resource for state higher education
decisionmakers, we urge policymakers to incorporate value-added analyses into conversations around
institutional quality. No model is perfect—the choice (and availability) of conditioning variables matters,
as others have pointed out (Cunha and Miller 2014)—but including variables that capture student
preparation and family background can change our perceptions of college rankings. The differences in
adjustments between Connecticut and Virginia, which had richer conditioning variables and more
institutions included in their system, further show the value of such variables as high school GPA and
family income.
At the same time, the analyses we undertook here are preliminary. Sensitivity to which variables
are included, for example, leads us to echo others’ recommendations (Melguizo et al. 2017) that
adjusted measures not be used in isolation but as part of a broader set of performance metrics.
Furthermore, policymakers will have to settle trade-offs that are necessary when not all data are
available. For example, some colleges did not report high school GPAs for all students, so we excluded
these students.10 Similarly, for analyses where we linked high school data, we excluded out-of-state and
older students. As time goes on, this latter problem will become less of an issue. Furthermore, as efforts
to link data across states take shape, the former problem may also disappear.

C O M P A R I N G C O L L E G E S ’ G R A D U A T I O N R A T E S 2 1
Similar analyses could also be performed for other outcome measures—earnings, in particular.
Institution- and program-level earnings data are increasingly available but face the same problem as
graduation rates: to what extent do these data reflect student characteristics rather than institutional
value-add? We hope to address this question in future work.

2 2 A P P E N D I X A
Appendix A. What Are the Gains
from Individual-Level Data? College value-added measures, including our own in previous work, often rely on institution-level
data.11 While often this is the best that can be done with available data, it can lead to different results,
even when the aggregate data reflect the same underlying individual-level data. In this appendix, we
compare value-added estimates based on individual-level data, as done here, with value-added
estimates based on aggregate data and argue that the former has several benefits.
The two models can be generally described by the following two equations:
(1) Yij = aj + XijB + eij
(2) Yj = XjD + uj
where model 1 is an individual-level model and model 2 is an institution-level model. In model 1, Yij is
the outcome (graduation) for individual i at institution j, aj is the institution fixed effect, Xij are the
individual characteristics, and eij are individual residuals. In model 2, Yj is the average outcome
(graduation rate) at institution j, Xj are the average demographics and student characteristics at
institution j, and uj are institution residuals.
Model 1 mimics what we used in the Developing Adjusted Measures section above. The institution
fixed effects are the value-add. This kind of model is also used, for example, in calculating teacher value-
add and is known in that context as a one-step model (Totty 2017). Model 2, a typical institution-level
model, treats the residuals—the unexplained variation in outcomes—as the value-add. We use the data
for six-year graduation rates at four-year colleges in Virginia as a test case. The implied value-added
measures from each model are plotted in figure A.1. (Rather than presenting adjusted graduation rates,
we present value-added measures, which differ from the adjusted graduation rates only by a constant,
with the lowest value-add normalized to 0 in the individual-level model. The numbers shown here are
therefore not directly comparable with those in figure 1. The value-added measures for the institution-
level model are centered on 0.)
A P P E N D I X A 2 3
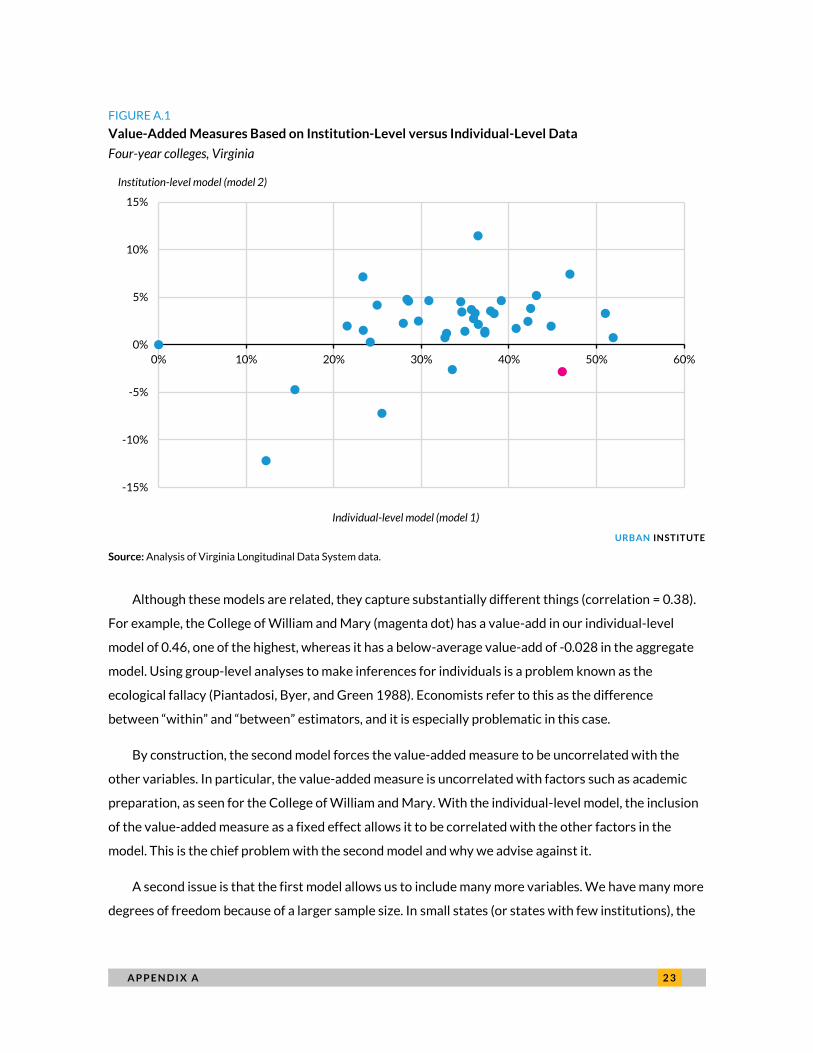
FIGURE A.1
Value-Added Measures Based on Institution-Level versus Individual-Level Data
Four-year colleges, Virginia
URBAN INSTITUTE
Source: Analysis of Virginia Longitudinal Data System data.
Although these models are related, they capture substantially different things (correlation = 0.38).
For example, the College of William and Mary (magenta dot) has a value-add in our individual-level
model of 0.46, one of the highest, whereas it has a below-average value-add of -0.028 in the aggregate
model. Using group-level analyses to make inferences for individuals is a problem known as the
ecological fallacy (Piantadosi, Byer, and Green 1988). Economists refer to this as the difference
between “within” and “between” estimators, and it is especially problematic in this case.
By construction, the second model forces the value-added measure to be uncorrelated with the
other variables. In particular, the value-added measure is uncorrelated with factors such as academic
preparation, as seen for the College of William and Mary. With the individual-level model, the inclusion
of the value-added measure as a fixed effect allows it to be correlated with the other factors in the
model. This is the chief problem with the second model and why we advise against it.
A second issue is that the first model allows us to include many more variables. We have many more
degrees of freedom because of a larger sample size. In small states (or states with few institutions), the
-15%
-10%
-5%
0%
5%
10%
15%
0% 10% 20% 30% 40% 50% 60%
Individual-level model (model 1)
Institution-level model (model 2)
2 4 A P P E N D I X A
number of institutions would limit the number of variables that can be included. For example, the
second model could not even be run for the seven four-year colleges in our Connecticut data (and would
be ill-advised for the two-year colleges).
Finally, the individual-level model also implicitly weights institutions correctly, since larger
institutions will have more observations. Unless the second model is weighted, the coefficients on the
independent variables will be biased, thus affecting the residuals (the value-added estimates).
As such, we urge state policymakers to make use of the rich data many of them already collect,
enabling richer analyses of not only graduation rates but other outcomes as well.
A P P E N D I X B 2 5
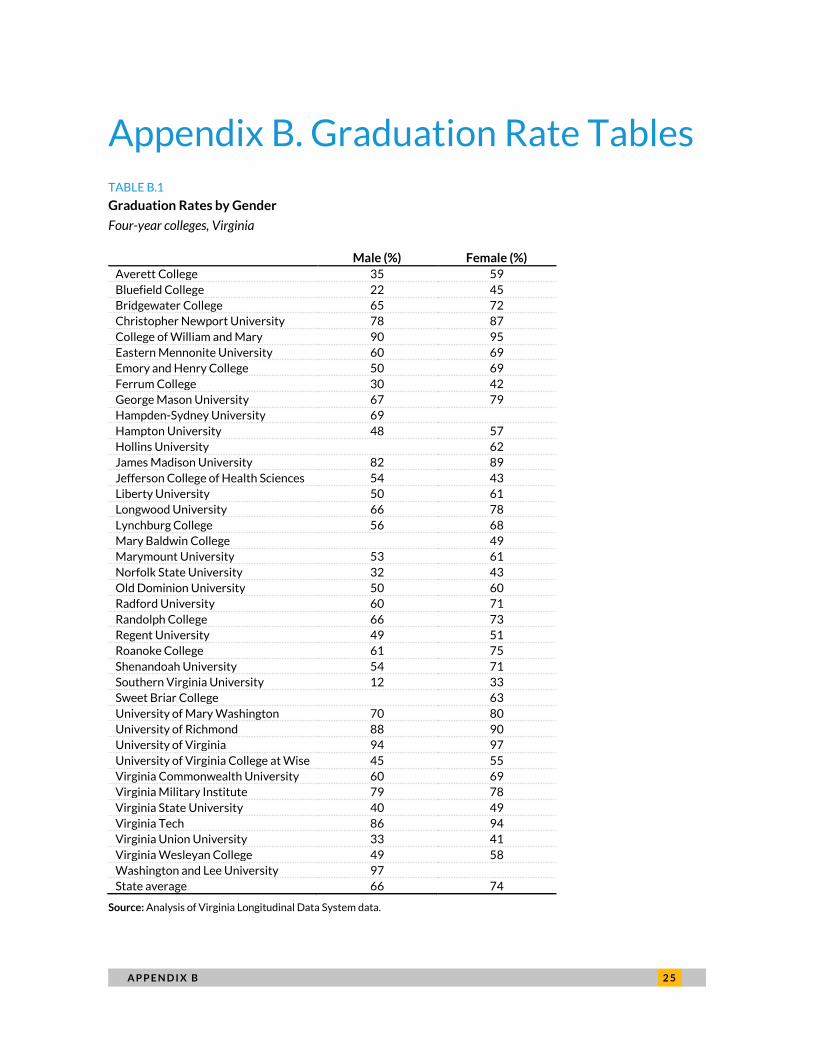
Appendix B. Graduation Rate Tables TABLE B.1
Graduation Rates by Gender
Four-year colleges, Virginia
Male (%) Female (%)
Averett College 35 59
Bluefield College 22 45
Bridgewater College 65 72
Christopher Newport University 78 87
College of William and Mary 90 95
Eastern Mennonite University 60 69
Emory and Henry College 50 69
Ferrum College 30 42
George Mason University 67 79
Hampden-Sydney University 69
Hampton University 48 57
Hollins University 62
James Madison University 82 89
Jefferson College of Health Sciences 54 43
Liberty University 50 61
Longwood University 66 78
Lynchburg College 56 68
Mary Baldwin College 49
Marymount University 53 61
Norfolk State University 32 43
Old Dominion University 50 60
Radford University 60 71
Randolph College 66 73
Regent University 49 51
Roanoke College 61 75
Shenandoah University 54 71
Southern Virginia University 12 33
Sweet Briar College 63
University of Mary Washington 70 80
University of Richmond 88 90
University of Virginia 94 97
University of Virginia College at Wise 45 55
Virginia Commonwealth University 60 69
Virginia Military Institute 79 78
Virginia State University 40 49
Virginia Tech 86 94
Virginia Union University 33 41
Virginia Wesleyan College 49 58
Washington and Lee University 97
State average 66 74
Source: Analysis of Virginia Longitudinal Data System data.
2 6 A P P E N D I X B
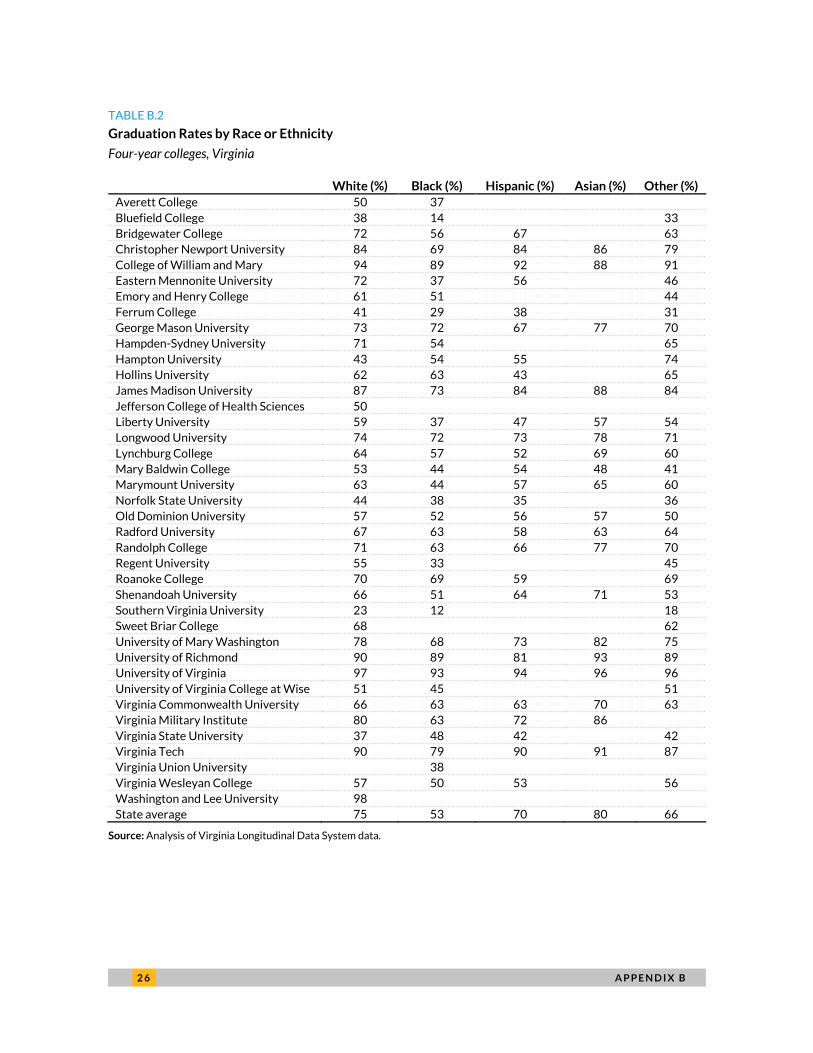
TABLE B.2
Graduation Rates by Race or Ethnicity
Four-year colleges, Virginia
White (%) Black (%) Hispanic (%) Asian (%) Other (%)
Averett College 50 37
Bluefield College 38 14 33
Bridgewater College 72 56 67 63
Christopher Newport University 84 69 84 86 79
College of William and Mary 94 89 92 88 91
Eastern Mennonite University 72 37 56 46
Emory and Henry College 61 51 44
Ferrum College 41 29 38 31
George Mason University 73 72 67 77 70
Hampden-Sydney University 71 54 65
Hampton University 43 54 55 74
Hollins University 62 63 43 65
James Madison University 87 73 84 88 84
Jefferson College of Health Sciences 50
Liberty University 59 37 47 57 54
Longwood University 74 72 73 78 71
Lynchburg College 64 57 52 69 60
Mary Baldwin College 53 44 54 48 41
Marymount University 63 44 57 65 60
Norfolk State University 44 38 35 36
Old Dominion University 57 52 56 57 50
Radford University 67 63 58 63 64
Randolph College 71 63 66 77 70
Regent University 55 33 45
Roanoke College 70 69 59 69
Shenandoah University 66 51 64 71 53
Southern Virginia University 23 12 18
Sweet Briar College 68 62
University of Mary Washington 78 68 73 82 75
University of Richmond 90 89 81 93 89
University of Virginia 97 93 94 96 96
University of Virginia College at Wise 51 45 51
Virginia Commonwealth University 66 63 63 70 63
Virginia Military Institute 80 63 72 86
Virginia State University 37 48 42 42
Virginia Tech 90 79 90 91 87
Virginia Union University 38
Virginia Wesleyan College 57 50 53 56
Washington and Lee University 98
State average 75 53 70 80 66
Source: Analysis of Virginia Longitudinal Data System data.
A P P E N D I X B 2 7
TABLE B.3
Graduation Rates by Index of Academic Performance
Four-year colleges, Virginia
Quintile of Academic Performance
Lowest (%)
Second (%)
Middle (%)
Fourth (%)
Highest (%)
Averett College 37 50 53
Bluefield College 22 38 46 48
Bridgewater College 51 62 77 85 94
Christopher Newport University 53 77 81 85 89
College of William and Mary 83 83 92 93
Eastern Mennonite University 40 52 72 81 92
Emory and Henry College 40 55 64 70 81
Ferrum College 28 50 62 61
George Mason University 53 65 72 76 80
Hampden-Sydney University 53 63 70 83 85
Hampton University 47 54 64 70 79
Hollins University 43 53 59 69 84
James Madison University 56 76 84 88 92
Jefferson College of Health Sciences 21 53 71
Liberty University 36 54 66 76 93
Longwood University 60 72 78 86 91
Lynchburg College 49 65 73 81 82
Mary Baldwin College 46 50 63 50
Marymount University 48 61 72 74 78
Norfolk State University 33 48 60 84
Old Dominion University 47 52 60 69 76
Radford University 58 69 74 76 85
Randolph College 55 62 73 77 92
Regent University 30 47 50 65 74
Roanoke College 57 61 72 79 90
Shenandoah University 44 61 69 86 90
Southern Virginia University 12 16 27 29 39
Sweet Briar College 43 60 70 73 77
University of Mary Washington 48 71 74 81 89
University of Richmond 88 80 84 89 91
University of Virginia 63 87 93 96 96
University of Virginia College at Wise 37 50 65 75 74
Virginia Commonwealth University 51 59 67 73 82
Virginia Military Institute 50 70 83 85 85
Virginia State University 43 58 68 74
Virginia Tech 59 75 86 90 91
Virginia Union University 37 52
Virginia Wesleyan College 42 56 68 72 85
Washington and Lee University 98
State average 43 61 73 83 91
Source: Analysis of Virginia Longitudinal Data System data.
Note: “Academic index” consists of equally weighted components of high school grade point average, SAT math scores, and SAT
verbal scores.
2 8 N O T E S
Notes1 The Data Quality Campaign tracks progress in each state. See the campaign’s website at
https://dataqualitycampaign.org/.
2 Dale and Krueger (2002) are among the first to attempt to control for not only observed differences in student
characteristics but unobserved characteristics.
3 Gabriel W. Mast, “Institutional Effects on Community College Completion Rates: An Analysis of Washington
State’s Community and Technical College System” (PhD diss., University of Washington, 2017).
4 Full time is defined as enrolled in 12 or more credits in the fall semester of freshman year.
5 These income averages may seem high, but consider that these are not averages across all households in the
state but among households with students attending four-year colleges. These households tend to earn above-
average incomes.
6 Most community college students attend college close to home. See, for example, Blagg and Chingos (2016).
7 In Connecticut, this is the Connecticut Academic Performance Test. We include measures of reading, writing,
and math. In Virginia, these are end-of-course Standards of Learning assessments in reading, writing, and
geometry.
8 See, for example, Colleen Campbell and Marcella Bombardieri, “New Data Highlight How Higher Education Is
Failing Part-Time Students,” Center for American Progress, October 18, 2017,
https://www.americanprogress.org/issues/education-postsecondary/news/2017/10/18/440997/new-data-
highlight-higher-education-failing-part-time-students/.
9 At the request of institutional leaders, we have suppressed institution names in Connecticut.
10 In principle, high school GPA could be calculated from detailed high school transcript data. But this was beyond
the scope of this project and furthermore would not address out-of-state or older students.
11 David Leonhardt and Sahil Chinoy, “The College Dropout Crisis,” New York Times, May 23, 2019,
https://www.nytimes.com/interactive/2019/05/23/opinion/sunday/college-graduation-rates-ranking.html.
R E F E R E N C E S 2 9
References Blagg, Kristin, and Matthew Chingos. 2016. Choice Deserts: How Geography Limits the Potential Impact of Earnings
Data on Higher Education. Washington, DC: Urban Institute.
Bowen, William G., Matthew M. Chingos, and Michael S. McPherson. 2009. Crossing the Finish Line: Completing
College at America’s Public Universities. Princeton, NJ: Princeton University Press.
Chingos, Matthew M. 2018. “What Matters Most for College Completion? Academic Preparation Is a Key of
Success.” Washington, DC: Third Way.
Cunha, Jesse M., and Trey Miller. 2014. “Measuring Value-Added in Higher Education: Possibilities and Limitations
in the Use of Administrative Data.” Economics of Education Review 42 (October): 64–77.
Dale, Stacy Berg, and Alan B. Krueger. 2002. “Estimating the Payoff to Attending a More Selective College: An
Application of Selection on Observables and Unobservables.” Quarterly Journal of Economics 117 (4): 1491–527.
Horn, Aaron S., Olena G. Horner, and Giljae Lee. 2019. “Measuring the Effectiveness of Two-Year Colleges: A
Comparison of Raw and Value-Added Performance Indicators.” Studies in Higher Education 44 (1): 151–69.
Hoxby, Caroline M. 2015. Computing the Value-Added of American Postsecondary Institutions. Working paper.
Washington, DC: Internal Revenue Service.
Melguizo, Tatiana, Gema Zamarro, Tatiana Velasco, and Fabio J. Sanchez. 2017. “The Methodological Challenges of
Measuring Student Learning, Degree Attainment, and Early Labor Market Outcomes in Higher Education.”
Journal of Research on Educational Effectiveness 10 (2): 424–48.
Piantadosi, Steven, David P. Byar, and Sylvan B. Green. 1988. “The Ecological Fallacy.” American Journal of
Epidemiology 127 (5): 893–904.
Rothwell, Jonathan. 2019. “Assessing the Validity of Consumer Ratings for Higher Education: Evidence from a New
Survey.” Journal of Consumer Affairs 53 (1): 167–200.
Rothwell, Jonathan, and Siddharth Kulkarni. 2015. Beyond College Rankings: A Value-Added Approach to Assessing
Two- and Four-Year Schools. Washington, DC: Brookings Institution.
Smith, Jonathan, and Kevin Strange. 2015. A New Measure of College Quality to Study the Effects of College Sector and
Peers on Degree Attainment. Working Paper 21605. Cambridge, MA: National Bureau of Economic Research.
Totty, Evan. 2019. “High School Value-Added and College Outcomes.” Education Economics.
3 0 A B O U T T H E A U T H O R S
About the Authors
Erica Blom is a research associate in the Center on Education Data and Policy at the Urban Institute,
where she studies higher education policy. Blom received a bachelor’s degree in mathematics and
political science from Queen's University and a master’s degree in economics from Western University.
She also earned a doctoral degree in economics from Yale University, where her research focused on
students’ choices in college major.
Macy Rainer is a research assistant in the Center on Education Data and Policy, where she focuses on
topics in K–12 and higher education. She works on projects related to measures of student poverty,
school quality, and college completion rates.
Matthew Chingos directs the Center on Education Data and Policy. He leads a team of scholars who
undertake policy-relevant research on issues from prekindergarten through postsecondary education
and create tools such as Urban’s Education Data Portal. He received a BA in government and economics
and a PhD in government from Harvard University.

ST A T E M E N T O F I N D E P E N D E N C E
The Urban Institute strives to meet the highest standards of integrity and quality in its research and analyses and in
the evidence-based policy recommendations offered by its researchers and experts. We believe that operating
consistent with the values of independence, rigor, and transparency is essential to maintaining those standards. As
an organization, the Urban Institute does not take positions on issues, but it does empower and support its experts
in sharing their own evidence-based views and policy recommendations that have been shaped by scholarship.
Funders do not determine our research findings or the insights and recommendations of our experts. Urban
scholars and experts are expected to be objective and follow the evidence wherever it may lead.

500 L’Enfant Plaza SW
Washington, DC 20024
www.urban.org