committed to improving the state green investing 2011
TRANSCRIPT

COMMITTED TO
IMPROVING THE STATE
OF THE WORLD
Green Investing 2011Reducing the Cost of Financing
World Economic Forum April 2011

The Green Investing 2011: Reducing the Cost of Financing is published by the World Economic Forum. It is the result of collaboration with Bloomberg New Energy Finance. The Report is the work of the authors and does not represent the views of the World Economic Forum.
World Economic Forum World Economic Forum USA Inc. 91-93 route de la Capite 3 East 54th Street CH-1223 Cologny/Geneva 18th Floor Switzerland New York, NY 10022 Tel.: +41 (0)22 869 1212 Tel.: +1 212 703 2300 Fax: +41 (0)22 786 2744 Fax: +1 212 703 2399 E-mail: [email protected]@[email protected]@weforum.org E-mail: [email protected]@[email protected]@weforum.org www.weforum.orgwww.weforum.orgwww.weforum.orgwww.weforum.org www.weforum.org/usawww.weforum.org/usawww.weforum.org/usawww.weforum.org/usa
© 2011 World Economic Forum USA Inc. All rights reserved. No part of this publication may be reproduced or transmitted in any form or by any means, including photocopying and recording, or by any information storage and retrieval system without explicit written permission from the World Economic Forum USA and the respective authors. REF: REF: REF: REF: 200311200311200311200311

Contents
Green Investing 2011 2
Introduction 4
Executive Summary 6
Update on Investment Volume 11
Policy Update 25
The Cost of Capital and Implications for Clean Energy Deployment 29
Contributors 37

3 Green Investing 2011

Introduction
Green Investing 2011 4
Anuradha Gurung Associate Director, Investors Industries
Max von Bismarck Director and Head of Investors Industries
The World Economic Forum is proud to release Green Investing 2011: Reducing the Cost of Financing as part of its Green Investing project. The Green Investing project, which was mandated by the Forum’s Investors community at the World Economic Forum Annual Meeting 2008 in Davos-Klosters, Switzerland, aims to explore ways in which the world’s leading investors can most effectively engage in the global effort to address climate change. Given recent geopolitical events, discussions about alternative sources of energy have gained additional traction. Investment in clean energy is no longer only a means to addressing the issue of climate change, but in a time of increasing price volatility of traditional sources of energy and heightened concerns related to nuclear energy, clean energy sources are becoming a vital component to sustained economic growth.
1
For the past three years, the World Economic Forum, in collaboration with Bloomberg New Energy Finance, has created a series of reports as part of the Green Investing project. The first report, Green Investing 2009: Towards a Clean Energy Infrastructure, described what a low-carbon energy system could look like, and estimated that it would require investment in clean energy to grow to US$ 500 billion per year by 2020 for global warming to be limited to 2°C without compromising economic growth. In our second report, Green Investing 2010: Policy Mechanisms to Bridge the Financing Gap, we reviewed various potential public and private sector financing mechanisms at the national, state and local levels that could unleash the required US$ 500 billion investment per annum in clean energy. This year’s report finds that, despite the challenging economic environment, the clean energy sector has made significant progress and investments have increased to approximately US$ 250 billion per annum. However, a US$ 250 billion per annum financing gap persists. Given the long-term importance of growing the clean energy sector to both help address climate change and provide alternatives to traditional sources of energy, policy-makers will need to find ways to make clean energy available at the lowest possible cost. To facilitate a better understanding of the underlying cost of generating clean energy, we use the Levelized Cost of Energy (LCOE), which examines the costs – excluding the effects of any subsidies or support mechanisms – associated with generating clean energy from various technologies. Since, the LCOE seeks to take into account all project costs and financial assumptions over the lifetime of a project, it allows us to examine which policies have proven more or less effective in reducing generation costs. We hope that this report provides decision-makers (i.e. business leaders, government representatives and sector experts) with valuable input as they determine policies to ensure appropriate allocation of resources to the clean energy sector. Through the LCOE and other analyses, the Green Investing project helps inform the World Economic Forum’s broader Climate Change Initiative. The Climate Change Initiative enables companies pioneering business models in the low-carbon space to work closely with policy-makers, the domestic private sector and multinationals in select emerging economies to develop green investment-enhancing project and policy recommendations. On behalf of the World Economic Forum, we would like to thank our collaborators at Bloomberg New Energy Finance, in particular Michael Liebreich, Ethan Zindler, Tyler Tingras, Nicky Aspinall and Vicky Cuming. Last but not least, we are especially grateful to the numerous experts who, since the launch of the Green Investing project, have provided input to the reports and participated in workshops and interviews.
1 While Nuclear power may be a major part of the future energy system, it is beyond the remit of this report.

5 Green Investing 2011

Executive Summary
Green Investing 2011 6
The clean energy space, like the rest of the world, has seen significant change since the release of the first Green Investing report more than two years ago. In Green Investing 2009: Towards a Clean Energy Infrastructure
2, the World Economic Forum
and Bloomberg New Energy Finance described what a low-carbon energy system would look like and estimated that it would require investment in clean energy to grow to US$ 500 billion per year by 2020 for global warming to be limited to 2°C without compromising economic growth. Last year’s report Green Investing 2010: Policy Mechanisms to Bridge the Financing Gap
3 focused on the range of policy tools
that might help spur these large-scale flows of finance. This year, the third report in the series shows that, despite the very difficult economic environment, the clean energy industry has made significant progress, reaching the half-way mark towards the US$ 500 billion per annum investment target. Over the last two years, governments have pledged no less than US$ 194 billion in stimulus to support the development and deployment of clean energy. But with deficits expanding and national debt rising in many countries, these programmes and other clean energy subsidies are coming under harsh scrutiny. In some cases, these new examinations are merited as governments have, in effect, paid above-market rates for clean energy generation. Elsewhere, the concerns have been overblown. This report hones in on the question of how to craft clean energy policies that are both effective in spurring development and efficient in ensuring taxpayers and consumers get best value. It examines the fundamental costs associated with generating a clean megawatt-hour of electricity and the role that financing costs play. It then overlays existing policy prescriptions from around the world and examines those that have proven successful in reducing developers’ costs. Finally, it compares these new adjusted local costs of generation with the size of local subsidies to determine whether a “policy premium” of over-payment exists. Ultimately, there is no one-size-fits-all clean energy policy prescription sure to succeed in every part of the globe. But in this new era of fiscal austerity, policy-makers need to ensure that the supports they put in place drive sustained long-term growth. This could be aided by ensuring that the bulk of the value they provide flows to ratepayers and taxpayers. In the future, clean energy technologies will likely be competitive with dirtier forms of generation on a completely unsubsidized basis. Until then, however, the onus is squarely on policy-makers to devise programmes that are both effective and efficient. Progress in 2010Progress in 2010Progress in 2010Progress in 2010 Global clean energy investment surged 30% in 2010 to a new record of US$ 243 billion (See Figure 1). This represents a major milestone for a sector that enjoyed an average compound annual growth rate of 37% between 2004 and 2008, but then saw growth stall in 2009 in the face of the worst recession in half a century.
2 World Economic Forum in collaboration with Bloomberg New Energy Finance, Green Investing: Towards a Clean Energy Infrastructure, 2009,
http://www3.weforum.org/docs/WEF_IV_GreenInvesting_Report_2009.pdf 3 World Economic Forum in collaboration with Bloomberg New Energy Finance, Green Investing 2010: Policy Mechanisms to Bridge the Financing Gap, 2010,
http://www3.weforum.org/docs/WEF_IV_GreenInvesting_Report_2010.pdf

7 Green Investing 2011
FigureFigureFigureFigure 1111: : : : GlobGlobGlobGlobal al al al Total New Investment in Clean EnergyTotal New Investment in Clean EnergyTotal New Investment in Clean EnergyTotal New Investment in Clean Energy, US, US, US, US$ $ $ $ billionsbillionsbillionsbillions
Note: Figures may differ slightly from those previously published due to a revised methodology that takes better account of balance of plant costs for
distributed generation capacity. Figures include investment in renewable energy, biofuels, energy efficiency, smart grid and other energy technologies,
carbon capture and storage and infrastructure investments targeted purely at integrating clean energy. Investment in solar hot water, combined heat and
power, renewable heat and nuclear are excluded, as are the proceeds of mergers and acquisitions (which does not contribute to new investment).
Source: Bloomberg New Energy Finance
The largest investment asset class in 2010 was the asset financing of utility-scale projects such as wind farms, solar parks and biofuel plants. This rose 19% to US$ 127.8 billion last year. Venture capital and private equity investment had a strong year, up 28% from a relatively depressed 2009 total to reach US$ 8.8 billion, although failing to match 2008’s record figure of US$ 11.8 billion. Public market investment bounced back from its recession-driven lows in 2008 and 2009, up 18% to US$ 17.4 billion in 2010. This fell short of the US$ 24.6 billion of clean energy stocks in 2007, but the fact that public market investment bounced back – despite the WilderHill New Energy Global Innovation Index (the NEX) of clean energy stocks dropping 14.6% and underperforming the S&P 500 by more than 20% – signifies the resilience of the sector (Figure 2).
FigureFigureFigureFigure 2222: : : : Performance of the WilderHill New Energy Global Innovation Index 2010Performance of the WilderHill New Energy Global Innovation Index 2010Performance of the WilderHill New Energy Global Innovation Index 2010Performance of the WilderHill New Energy Global Innovation Index 2010
Source: Bloomberg New Energy Finance
$52bn
$76bn
$113bn
$151bn
$180bn $186bn
$243bn
48%
48%
34%
19%
4%
30%
2004 2005 2006 2007 2008 2009 2010
0
50
100
150
200
250
300
350
400
450
500
Jan-03 Jan-04 Jan-05 Jan-06 Jan-07 Jan-08 Jan-09 Jan-10 Jan-11
S&P 500
NASDAQ
NYSE Arca Oil
NEX

Green Investing 2011 8
In 2009, Asia and Oceania overtook the Americas and, in 2010, drew level with Europe, the Middle East and Africa as the leading region in the world for clean energy investment, largely as a result of activity in China, where investment was up 30% to US$ 54.5 billion (inclusive of reinvested equity)
4, by far the largest figure for any single country (Figure 3).
China now produces well over half of the photovoltaic modules used globally and is home to several of the biggest brands in the sector. It installed approximately 17gW of new wind capacity – about half of the global total – with most of the equipment supplied by domestic manufacturers. No other country came close in terms of new power generating capacity added, manufacturing expanded or funds attracted.
Figure Figure Figure Figure 3333: : : : Total Total Total Total New Investment in Clean Energy by RegionNew Investment in Clean Energy by RegionNew Investment in Clean Energy by RegionNew Investment in Clean Energy by Region, US, US, US, US$ $ $ $ billionsbillionsbillionsbillions
Note: Includes corporate and government R&D, and small distributed capacity. Adjusted for reinvested equity. Does not include proceeds from acquisition
transactions.
Source: Bloomberg New Energy Finance
But it was investment in small-scale, distributed generation projects that really stole the spotlight in 2010, surging by 91% to US$ 59.6 billion, and now accounting for approximately one in four dollars invested in clean energy. Germany alone saw 7.5gW of new photovoltaic capacity added in 2010, an all-time record, mostly in the form of small-scale residential or commercial rooftop systems. Other countries with feed-in tariff systems, including the Czech Republic, Italy and the United Kingdom also saw rapid growth, as did certain US states. The mass scale-up of small-scale solar was driven by an extraordinary decline in the cost of photovoltaic modules. For several years, progress along the so-called “learning curve” was suspended by a global shortage of solar-grade processed silicon. That bottleneck broke in 2008, allowing prices to fall very quickly thereafter. ChallengesChallengesChallengesChallenges Not all news has been good in the clean energy world. Debt markets have remained fragile and Europe, in particular, continues to suffer from the aftermath of the financial crisis. Confronted with significant national budget deficits, key countries that had been supporters of clean energy have been cutting back support – and the Czech Republic and Spain have made retrospective changes to their tariff regimes. Reductions in rates are likely to occur in most feed-in tariff markets in 2011, starting in Germany. In the United States, clean energy continues to suffer from the lack of a federal climate or energy bill, as well as competition from low-priced natural gas. In China, increasing inflation could lower the unprecedented levels of debt and hence decrease investment in one of the national economic priority sectors. But none of these factors have been sufficient to derail the sector’s progress. Helping to counter these obstacles, the clean energy industry in 2010 enjoyed an unusual level of support from governments around the world in the form of stimulus funding. As discussed in the second Green Investing report last year, no less than US$
4 This figure includes all third party private investment, plus funds reinvested by Chinese companies into local projects.
61.9
47.741.2
70.2
59.450.5
75.5
48.6
62.4
94.4
65.8
82.8
EMEA AMER ASOC
2007
2008
2009
2010

9 Green Investing 2011
194 billion5 in stimulus has been pledged to clean energy since the start of 2009. Those funds have played a key role in
supporting the sector through what could have been difficult times. It took some time for these funds to start to flow, but estimates indicate that 2010 saw US$ 75 billion investment from this source. However, less than half the stimulus has actually “hit the street” to date. The positive news for the industry is that plenty remains to be spent in the next two years but, with government deficits rising, the possibility of the funds being rescinded is also increasing.
FigureFigureFigureFigure 4444: : : : Global Global Global Global Stimulus Spending on Clean EnergyStimulus Spending on Clean EnergyStimulus Spending on Clean EnergyStimulus Spending on Clean Energy, US, US, US, US$ $ $ $ billionsbillionsbillionsbillions
Note: Last year’s report estimated a total of US$ 177 billion was allocated to renewable energy. The US$ 194 billion figure is updated to reflect exchange rate effects and additional allocations made between the launch of the second report and year-end 2010.
Source: Bloomberg New Energy Finance
Stimulus funding is only one reason for the resilience of the sector over the past few years. Of even greater importance is the extraordinary progress made by all clean energy technologies in driving down their “levelized costs” (the cost per unit of energy before taking into account any support mechanisms or subsidies). Today, biomass, geothermal and wind projects can compete with their fossil-based rivals in increasingly significant energy markets. Brazilian sugar-based ethanol has been competitive with gasoline on an unsubsidized basis for some time. Photovoltaics have already reached parity with retail electricity prices in certain parts of the world – such as Italy, Hawaii and parts of other US states – and will undoubtedly do so elsewhere soon. The clean energy sector appears to be poised for further strong growth. To date, government supports have played a decisive role in dictating financing flows; where supportive policies have been put in place, private dollars have followed. In recent years, the decline in the cost of clean energy has been due almost entirely to lower equipment costs resulting from growing scale in the supply chain. But there are two other ways in which costs are set to be driven down. The first is R&D; research and development spending on clean energy technologies by companies and governments grew to a record level in 2010, up 24% to US$ 35.5 billion from US$ 28.6 billion in 2009 and US$ 20.5 billion in 2005. The fruits of this growing research pipeline will filter into the market over the coming years. The other important driver of the cost of renewable energy is the cost of financing. Clean energy projects are particularly sensitive to interest rates as they have large upfront and minimal marginal costs. As the capital markets continue the long process of recovery from the crisis of 2008 – punctuated no doubt by further negative developments – the effective interest rates paid for all infrastructure projects are likely to come down, and this should differentially advantage clean energy. Every few basis points of reduction in debt costs impact the fate of hundreds of clean energy projects, representing gigawatts of new capacity.
5 Last year’s report estimated that a total of US$ 177 billion was allocated to renewable energy. The US$ 194 billion figure is updated to reflect exchange rate
effects and additional allocations made between the launch of the second report and November 2010.
194.3
20.310%
74.538%
68.035%
21.411% 9.7
5%
Total 2009 2010 2011e 2012e 2013e

Green Investing 2011 10
InnovationInnovationInnovationInnovation Clean energy developers and backers are further innovating – not just in the technologies they employ but also in their financing mechanisms. Examples in 2010 included wind leases in Turkey and the United States; listed equity funds purchasing assets and development portfolios in France and Germany; a project bond financing for solar in Italy; and a pension fund directly owning a stake in a Danish offshore wind farm. Another factor pointing to strong demand for clean energy in coming years is the likelihood of a return to higher energy prices. Amid turmoil in the Middle East in February and March, oil prices rose above US$ 100 per barrel; in the United States, the combination of high oil and commodity prices with low natural gas prices is unlikely to persist in the longer term. Overall, there are promising signs that the industry’s strong momentum can be maintained. Investment in the sector has surprised everyone with its resilience in the face of crisis. It now remains to be seen whether it can continue its progress towards the magic figure of US$ 500 billion per annum by 2020. The Levelized The Levelized The Levelized The Levelized Costs of Energy for RenewablesCosts of Energy for RenewablesCosts of Energy for RenewablesCosts of Energy for Renewables The report scrutinizes the actual underlying cost of generating clean energy. Because of the fundamentally different ways in which clean energy and fossil fuel power projects are financed, comparing the economics of the two is a bit like comparing apples and oranges. Still, in most markets, power projects deliver a single undifferentiated commodity – a kWh of electricity – purchased by consumers. There are a number of ways to measure the relevant costs affiliated with generating that kWh, but one most commonly used method involves measuring the “levelized cost of energy” (LCOE). The LCOE seeks to take into account all project costs and financial assumptions over the lifetime of a project. Reducing LCOE should be the long-term goal for policy-makers looking to spur deployment of renewables projects quickly. The last portion of this report examines which policies have proven more or less successful in reducing generation costs. It then looks at which subsidy regimes appear to make the most efficient use of public funds when the LCOE of clean energy is considered. Some policies intended to spur clean energy growth have already had the unintended consequence of raising the cost of capital for wind, solar and other renewables projects. Hence, the cost of the power generated from such projects has risen. Given the long-term importance of growing this sector to help address climate change, policy-makers must seek ways to make clean energy available at the lowest possible cost. Furthermore, to help build long-range consensus on clean energy, they must ensure that the benefit of low-cost clean energy is passed on to the consumer or taxpayer rather than accrued to the clean energy sector.

Update on Investment Volume
11 Green Investing 2011
OverviewOverviewOverviewOverview The impact of the global economic crisis that began in 2008 continued to be felt throughout 2010, although the fallout was dramatically different in the developed and developing worlds. While the United States and some European economies posted anaemic GDP growth rates and continued a painful process of deleveraging, the economies of Brazil, China, and India still surged ahead. For its part, the clean energy sector mostly shrugged off the lingering effects of the downturn as overall clean energy investment surged in 2010 to US$ 243 billion worldwide, up from a revised US$ 186 billion in 2009. That marked a 30% jump and made 2010 easily the best year on record in terms of new funds invested. It was an impressive performance, given the continuing volatility of the sector, and marked a strong recovery after investment growth flattened between 2008 and 2009 as the economic downturn first took hold.
Figure Figure Figure Figure 5555: : : : Global Total New Investment in Clean Energy, 2004 to 2010Global Total New Investment in Clean Energy, 2004 to 2010Global Total New Investment in Clean Energy, 2004 to 2010Global Total New Investment in Clean Energy, 2004 to 2010, US, US, US, US$ $ $ $ billionsbillionsbillionsbillions
Note: Figures may differ slightly from those previously published due to a revised methodology that takes better account of balance of plant costs for distributed
generation capacity. Figures include investment in renewable energy, biofuels, energy efficiency, smart grid and other energy technologies, carbon capture and
storage and infrastructure investments targeted purely at integrating clean energy. Investment in solar hot water, combined heat and power, renewable heat and
nuclear are excluded, as are the proceeds of mergers and acquisitions (which does not contribute to new investment).
Source: Bloomberg New Energy Finance
Beneath the headline figures, the way in which funds were deployed into the clean energy sector changed dramatically in 2010. Thanks to the over US$ 194 billion committed by governments around the world to clean energy in stimulus spending, public sector investment played an unprecedented role in supporting the industry. For the first time, solar photovoltaics came close to wind as the clean energy technology that attracted the most investment. Perhaps most importantly of all, the industry’s centre of gravity continued to move eastward. Investment in China rose 30% to US$ 54.5 billion (inclusive of reinvested equity)
6 in 2010, by far the largest figure for any country.
6 This figure includes all third party private investment, plus funds reinvested by Chinese companies into local projects.
$52bn
$76bn
$113bn
$151bn
$180bn $186bn
$243bn
48%
48%
34%
19% 4%
30%
2004 2005 2006 2007 2008 2009 2010

Green Investing 2011 12
In 2009, Asia and Oceania overtook the Americas and, in 2010, narrowed the gap further on Europe, the Middle East and Africa, the leading region in the world for clean energy investment.
Figure Figure Figure Figure 6666: : : : Total New Investment in Clean Energy by Region, 2007 to 2010, USTotal New Investment in Clean Energy by Region, 2007 to 2010, USTotal New Investment in Clean Energy by Region, 2007 to 2010, USTotal New Investment in Clean Energy by Region, 2007 to 2010, US$ $ $ $ billionsbillionsbillionsbillions
Note: Includes corporate and government R&D, and small distributed capacity. Adjusted for reinvested equity. Does not include proceeds from acquisition transactions.
Source: Bloomberg New Energy Finance
Asset FinanceAsset FinanceAsset FinanceAsset Finance The financing of large-scale clean energy assets – defined by Bloomberg New Energy Finance as facilities that generate either renewable electricity or biofuels – has historically accounted for approximately 60% of overall funds deployed into clean energy in a given year. Typically, fund flows have included non-recourse debt, private equity or balance sheet capital provided to large-scale wind farms, solar parks or ethanol plants. Investment in such projects was hurt badly by the demise of Lehman Brothers and the near collapse of the financial system in late 2008. As shown in Figure 7, asset finance fell by more than 33% as Western banks sought to recover from the collateralized debt securities debacle. Thankfully for the sector, the worst of the crisis was felt in that quarter as investment bounced back through the rest of the year.
FigureFigureFigureFigure 7777: : : : Global Asset Financing for New Build Clean Energy Assets, 2004 to 2010, USGlobal Asset Financing for New Build Clean Energy Assets, 2004 to 2010, USGlobal Asset Financing for New Build Clean Energy Assets, 2004 to 2010, USGlobal Asset Financing for New Build Clean Energy Assets, 2004 to 2010, US$ $ $ $ billionsbillionsbillionsbillions
Source: Bloomberg New Energy Finance
5.33.1 4.4 5.4
8.1 9.3 8.711.2 11.3 12.7 15.1
22.9
16.618.8
25.629.1
22.3
31.4 30.9 30.1
18.8
31.3 29.4 28.0 29.5 28.932.8
36.6
Q1 04
Q2 04
Q3 04
Q4 04
Q1 05
Q2 05
Q3 05
Q4 05
Q1 06
Q2 06
Q3 06
Q4 06
Q1 07
Q2 07
Q3 07
Q4 07
Q1 08
Q2 08
Q3 08
Q4 08
Q1 09
Q2 09
Q3 09
Q4 09
Q1 10
Q2 10
Q3 10
Q4 10
Four quarter running average
61.9
47.7 41.2
70.2 59.4
50.5
75.5
48.6
62.4
94.4
65.8
82.8
EMEA AMER ASOC
2007
2008
2009
2010

13 Green Investing 2011
After the largest bailout in history, the banks were very much back on their feet by the start of 2010. Partly as a result, asset financing hit an all-time high in Q4 2010 at US$ 36.6 billion. Still, it would be wrong to credit only the traditional banks for the recovery of asset finance in 2010. The funding for large-scale renewable power generation and biofuel production became more diversified in 2010, both in terms of geography and the kinds of financial institutions that provided the capital. China China China China Powers AheadPowers AheadPowers AheadPowers Ahead The Asia and Oceania (ASOC) region finished second in attracting all forms of new financing but was the clear leader in terms of new funds for large-scale power generating projects. The funds were deployed in a number of countries in the region, including Australia (US$ 2.2 billion), Thailand (US$ 749 million) and Vietnam (US$ 377 million); but China dominated with US$ 47.3 billion invested in 2010. In 2009, no less than 14gW of new wind capacity was added in China, shattering the annual record for any country (the United States set its all-time record that year as well, with 10gW added). Figure 8 illustrates that, in 2010, the gap between China and all other countries widened considerably. The country deployed approximately 17gW of new wind compared with approximately 5gW by the United States, which was the country to deploy the second highest amount of wind energy.
FigureFigureFigureFigure 8888: : : : Asset Finance for New Build Clean Energy Assets by Country 2010, USAsset Finance for New Build Clean Energy Assets by Country 2010, USAsset Finance for New Build Clean Energy Assets by Country 2010, USAsset Finance for New Build Clean Energy Assets by Country 2010, US$ $ $ $ billionsbillionsbillionsbillions
Source: Bloomberg New Energy Finance
The source of funds for Chinese projects varied, but rarely came from Western financial institutions. Quite often, state-owned or partially state-owned companies put up the capital. A typical example was a 201mW wind project financed with US$ 295.3 million in November by China Guangdong Nuclear Wind Power Co., a subsidiary of state-owned China Guangdong Nuclear Power. The China Development Bank also emerged as a major player in 2010, making no less than US$ 36.6 billion in credit facilities available to five solar firms and one wind company. While those funds were largely intended to spur manufacturing build-outs, the bank was also active in financing wind projects. Europe Europe Europe Europe Suffers Suffers Suffers Suffers a a a a Series Series Series Series of of of of CrisesCrisesCrisesCrises By contrast, conditions for financing new clean power projects remained relatively weak in Europe as the continent swung from one sovereign debt crisis (Greece) to another (Ireland), and worries of more (Italy, Portugal and Spain) loomed. A Bloomberg
China $47.3 bn 37%
US$20.7 bn 16%
Brazil
$6.9 bn 5%
Germany $6.2 bn 5%
Italy$4.8 bn 4%
Spain$4.6 bn 4%
Rest of world $37.3 bn 29%

Green Investing 2011 14
New Energy Finance markets survey in late 20107 suggested that banks were showing an appetite for renewable energy project
debt well above that of 2009. But the processes and pricing involved were quite different from those before the credit crunch. One example is Landesbank Baden-Württemberg (LBBW), one of the banks active in renewable energy lending in 2007-2008. The institution went through hard times after the financial crisis and had to cut back on some activities. However, it has kept its eye on the renewable energy business. “LBBW has been going through a period of restructuring and streamlining, but renewable energy will remain a very important sector,” Matthias Neugebauer, LBBW’s Head of Renewable Energy, told Bloomberg New Energy Finance. “We want to be at least as engaged in it in the future as we have been in the past. We are looking to lend to projects in France, Canada and the Czech Republic, as well as Germany.” However, intention is one thing and actual lending is another. For example, in 2010, onshore and offshore wind projects in the United Kingdom took much longer than expected to reach close. The US$ 442 million debt deal for Masdar’s share of the 1gW London Array offshore wind project sign-off was expected in the summer, then the autumn, but the New Year passed without a conclusion.
FigureFigureFigureFigure 9999: : : : Total Cost of Debt for Euro Area Onshore Wind ProjectTotal Cost of Debt for Euro Area Onshore Wind ProjectTotal Cost of Debt for Euro Area Onshore Wind ProjectTotal Cost of Debt for Euro Area Onshore Wind Project,,,, 2005 to 20112005 to 20112005 to 20112005 to 2011
Note: Data as of 15 January 2011; Term swap: eight year euro swap rate
Source: Bloomberg New Energy Finance estimates.
As far as the other terms of project finance loans are concerned, tenors have generally returned to the 15- to 20-year area, after a period during the credit squeeze when such long-term finance was difficult to find. Structures have also improved. Whereas a wind project developer might have been happy to obtain 75% debt in 2009, debt-equity ratios of 80:20 are becoming available more often now – and the occasional one is even higher. In photovoltaics, debt-equity ratios are generally higher than those in onshore wind because sunshine is a more predictable and less volatile resource than wind. Debt-equity ratios of 80:20 or 85:15 are now back as the norm in Europe. One of the bigger Italian deals of 2010 was a US$ 304 million loan from eight lenders for Falck Renewables’ 138mW wind project at Buddoso in Sardinia. Debt made up 77% of the total investment with the margin on the loans ranging from 260 to 290 basis points.
7 Bloomberg New Energy Finance, Wind, Solar – Research Note, 22 November 2010
0%
1%
2%
3%
4%
5%
6%
7%
2005 2006 2007 2008 2009 2010 2011
Project Spread
Credit Insurance
Term Swap
6M Euribor
ECB Rate

15 Green Investing 2011
At the other end of the scale, late-2010 spreads were below the European average in France, Germany, the Nordic countries and the United Kingdom. In the United Kingdom, deals benefited from the European Investment Bank’s US$ 948 million onshore wind lending umbrella for Royal Bank of Scotland, Lloyds Banking Group and BNP Paribas Fortis. A Muted Year for the A Muted Year for the A Muted Year for the A Muted Year for the United StatesUnited StatesUnited StatesUnited States While economic recovery in the EU in 2010 was characterized by new, high-profile financial crises, in the United States the process continued in a more low-key, incremental manner. The US economy remained relatively flat as consumers focused more on rebuilding personal balance sheets than pumping new capital into the economy. Businesses remained equally cautious; despite stockpiling record amounts of cash on their balance sheets, capital investment and hiring remained weak. Having received the largest bail-out in history, US banks regained their footing and began to make more project finance available to clean energy projects when possible. Conditions were also helped by a federal stimulus programme approved by Congress in February 2009 that allowed developers of projects to receive cash grants equal to 30% of their project’s overall CAPEX. Financing in the United States for large-scale projects remained relatively anaemic in 2010, primarily for market-related reasons. Overall demand for electricity essentially stayed flat. Natural gas prices remained low, at approximately US$ 4 per million BTU, making it difficult for higher priced wind- and solar-generated power to complete. Finally, mandated demand for renewables in the United States is not what it was several years ago. No less than 30 states have renewable portfolio standards (RPS) on their books requiring certain levels of clean energy generation or consumption. But in most of those states, utilities are already well ahead of or close to meeting their clean energy quotas. Although the state with the most aggressive RPS, California, is not in that group, the overall effect has been to lessen near-term demand for utility-scale projects. Lack of long-term federal policy support for renewables also gave investors pause. With the election of Barack Obama as president in 2008, expectations grew that the United States would in 2010 establish a national cap-and-trade scheme to cut carbon emissions and set a federal RPS mandating certain levels of clean energy consumption, similar to policies in place in a majority of US states. Efforts to pass a comprehensive climate/energy bill ultimately failed in Congress, however, undermining investor confidence. In November, Republicans won back control of the House of Representatives, all but assuring no significant action on cap-and-trade for at least two years in Congress. In all, new build asset financing activity totalled approximately US$ 128 billion in 2010, marking a 19% rise over 2009. Given the overall 30% rise in new capital into the sector, the increase in project finance suggests an unimpressive year for new clean energy generation capacity added worldwide. However, these utility- or larger commercial-scale investment figures tell only half the story of 2010 clean energy investment. Small Small Small Small Solar Makes Solar Makes Solar Makes Solar Makes an an an an Enormous ImpactEnormous ImpactEnormous ImpactEnormous Impact The major force behind the big jump in new investment into the sector in 2010 was the extraordinary amount of new capital that went into small-scale commercial and residential photovoltaic systems. This investment proved particularly important as the PV sector saw unprecedented global growth in 2010. In all, no less than 18.4gW of new PV was installed worldwide, up from 7.6gW in 2009 (Figure 10).

Green Investing 2011 16
Figure Figure Figure Figure 10101010: : : : Global PV Supply and DemandGlobal PV Supply and DemandGlobal PV Supply and DemandGlobal PV Supply and Demand,,,, 2006 to 2012, 2006 to 2012, 2006 to 2012, 2006 to 2012, gWgWgWgW
Source: Bloomberg New Energy Finance
The torrid pace of new PV installations was spurred by a combination of rapidly declining equipment costs and rapidly expiring subsidies in certain nations around the world, particularly Germany. The latter alone accounted for at least 7.5gW in 2010. Other nations, including the Czech Republic and Italy, contributed as well. Public MarketsPublic MarketsPublic MarketsPublic Markets Just as China proved a dominant force in attracting new capital for clean power projects, it also served as a magnet for new public market financing. As US and EU companies struggled to stage IPOs or secondary offerings on the NASDAQ, the NYSE or the London Stock Exchange, funds flowed to Chinese firms often listed on exchanges in Shanghai and Hong Kong. Overall, financing for clean energy firms on the exchanges rose in 2010 to US$ 17.4 billion from US$ 14.7 billion in the year prior (Figure 11). Still, the 2010 total was a far cry from the all-time high for public market investment of US$ 24.6 billion raised on the exchanges in 2007 at the height of the US ethanol boom.
Figure Figure Figure Figure 11111111: : : : Public Market New Investment in Clean Energy, 2004 to 2010, USPublic Market New Investment in Clean Energy, 2004 to 2010, USPublic Market New Investment in Clean Energy, 2004 to 2010, USPublic Market New Investment in Clean Energy, 2004 to 2010, US$ $ $ $ billionsbillionsbillionsbillions
Note: Figures reflect the location of the exchanges, not the listing companies.
Source: Bloomberg New Energy Finance
0.2 0.2 0.1 0.4 0.8 1.1 0.9
2.82.0
6.0
1.5
3.8 4.5 4.63.2
12.4
3.4
6.4
3.01.3
0.2
3.45.0
6.2
2.2 2.63.9
8.8
Q1 04
Q2 04
Q3 04
Q4 04
Q1 05
Q2 05
Q3 05
Q4 05
Q1 06
Q2 06
Q3 06
Q4 06
Q1 07
Q2 07
Q3 07
Q4 07
Q1 08
Q2 08
Q3 08
Q4 08
Q1 09
Q2 09
Q3 09
Q4 09
Q1 10
Q2 10
Q3 10
Q4 10
ASOC
AMER
EMEA
0
5
10
15
20
25
30
35
2006 2007 2008 2009 2010 2011 2012
Supply - base scenario Supply - high scenarioDemand - conservative Demand - optimistic
Historical/ near term Future

17 Green Investing 2011
Approximately half of the new funds raised came from 36 successful IPOs. Bloomberg New Energy Finance recorded 19 of the IPOs in the year were by China-based entities. The United States was a distant second, with three successful IPOs. There were seven IPOs recorded in Europe, two each in India and Taiwan and one apiece in Brazil, South Korea and Thailand. The year also saw 18 IPOs withdrawn or cancelled: China had five, while the United States and Spain recorded three apiece. Brazil had two offerings called off, and Canada, Hungary, the Netherlands, Sweden and the United Kingdom each had one withdrawal or cancellation. For Western clean technology firms, returning to the public markets was a more protracted process than in previous years – and the pressure to discount was strong. Italy’s Enel SpA had hoped to raise some US$ 4.5 billion from its sale of 32% of Enel Green Power, but settled for US$ 1 billion less. The Rome-based company trimmed its offer price from an initial range of US$ 2.39-2.78 per share to US$ 2.12, reportedly to attract sufficient demand from institutional investors, who wanted the issue priced at a discount to the valuations of peers Iberdrola Renovables and EDP Renováveis. Enel Green Power’s shares traded between US$ 1.98 and US$ 2.14 through the first half of December.
FigureFigureFigureFigure 12121212: : : : Public Market New Investment in Clean Energy by CountryPublic Market New Investment in Clean Energy by CountryPublic Market New Investment in Clean Energy by CountryPublic Market New Investment in Clean Energy by Country,,,, 2010, US2010, US2010, US2010, US$ $ $ $ billionsbillionsbillionsbillions
Note: Figures reflect location of stock exchanges, not listed companies.
Source: Bloomberg New Energy Finance
By contrast, one of the most successful IPOs in 2010 came from California-based electric vehicle maker Tesla Motors, which made its splashy debut at the end of June, raising just over US$ 200 million. The company used the funds to draw down on a US government-offered low-interest loan, allowing it to expand manufacturing capacity. The stock debuted at US$ 15 per share and then rose through much of the year to trade above US$ 30. However, as of December, doubts were growing about the company’s valuation and the stock had the highest level of short interest of any component of the WilderHill New Energy Global Innovation Index. By mid-March 2011, Tesla’s shares were trading at US$ 22 apiece. For US-based project developer First Wind Holdings, even a late reduction in the offering price was not enough to save its IPO. It first cut the price offering price to US$ 18-20 per share in October 2010, from an initial price of as high as US$ 26. First Wind had planned to use the proceeds from the IPO to pay down debt and fund project development and construction. But, in November, First Wind withdrew the offering due to unfavourable market conditions.
China
$5.9 bn 34%
Italy$3.6 bn
20%
US
$2.9 bn 17%
Norway $0.8 bn, 5%
Canada
$0.7 bn, 4%
Germany$0.7 bn, 4%
Rest of World $2.9 bn,
16%

Green Investing 2011 18
In 2009, listed clean energy companies raised over US$ 5 billion via 57 separate secondary offerings. Most of those funds flowed to PV companies looking to expand manufacturing capacity. In 2010, however, secondary fund raising dropped to just US$ 1.7 billion from 36 transactions. Overall, in 2010, public market investor sentiment remained relatively bearish towards listed clean energy companies. The WilderHill Global Innovation Index, or NEX, which currently tracks the performance of 100 clean energy stocks on exchanges worldwide, declined 14.6% over the course of the year, badly underperforming the broader markets. By comparison, the US S&P 500 rose 12.8% in 2010 and the NASDAQ Composite posted a 16.9% gain.
Figure Figure Figure Figure 13131313: NEX Performance: NEX Performance: NEX Performance: NEX Performance, 2010, 2010, 2010, 2010
Source: Bloomberg New Energy Finance
Shares of wind turbine manufacturers decreased the most, with wind components in the NEX falling 37% as global demand softened everywhere but China, where domestic players largely maintain a lock on the market. In November, the largest turbine maker, Vestas, said sales and profitability would remain essentially unchanged in 2011. The announcement was very different from the company’s earlier bold plans, when it said it aimed to achieve a “triple 15” – 15% EBIT margins on 15 billion euros in 2015 revenue. Hitting those targets now looks highly unlikely, given the 6.8 billion euros (US$ 9.3 billion) in sales expected this year. Vestas shares fell 47% on the year. Similarly, Spanish wind turbine maker Gamesa saw its shares fall by 54%. India’s Suzlon Energy dropped 39%.
60
70
80
90
100
110
120
130
140
150
Dec Jan Feb Mar Apr May Jun Jul Aug Sep Oct Nov Dec
S&P 500
NASDAQ
NEX

19 Green Investing 2011
Table Table Table Table 1111: : : : Top Public Market Fund Raises, 2010Top Public Market Fund Raises, 2010Top Public Market Fund Raises, 2010Top Public Market Fund Raises, 2010
OrganiOrganiOrganiOrganizationzationzationzation NameNameNameName CountryCountryCountryCountry SectorSectorSectorSector
New EquNew EquNew EquNew Equity ity ity ity
Raised Raised Raised Raised
((((USUSUSUS$ $ $ $
mmmmillionsillionsillionsillions))))
Transaction TypeTransaction TypeTransaction TypeTransaction Type StockStockStockStock MMMMarketsarketsarketsarkets
Xinjiang Goldwind Science & Technology Co. Ltd China Wind 1,054 IPO Hong Kong Stock Exchange (HKEX)
China Datang Corp Renewable Power Co. Ltd Hong
Kong
SAR
Wind 682 IPO Hong Kong Stock Exchange (HKEX)
Renewable Energy Corp ASA Norway Solar 675 Exercise of Warrants/Rights/
Options Oslo Stock Exchange (Oslo Bors)
Sanan Optoelectronics Co. Ltd China Solar 456 Private Investment in Public
Equity (PIPE)
Shanghai Stock Exchange
China Suntien Green Energy Corp. Ltd China Wind 425 IPO Hong Kong Stock Exchange (HKEX)
Shanghai Chaori Solar Energy Science &
Technology Co. Ltd
China Solar 358 IPO Shenzhen Stock Exchange
China Ming Yang Wind Power Group Ltd China Wind 350 IPO New York Stock Exchange (NYSE)
Cosan SA Industria e Comercio Brazil Biofuels 302 Exercise of Warrants/Rights/
Options
São Paulo (BOVESPA)
China High Speed Transmission Equipment
Group Co. Ltd
Hong
Kong
SAR
Wind 291 Private Investment in Public
Equity (PIPE)
Hong Kong Stock Exchange (HKEX)
Risen Energy Co. Ltd China Solar 280 IPO Shenzhen Stock Exchange
Source: Bloomberg New Energy Finance
Venture Capital/Private Equity Difficult conditions in the public markets had a direct effect on venture capital and private equity fund-raising and investing. With fewer exits via IPO available, VCs struggled to raise new clean energy-focused funds. With less cash at their disposal, investment totals in 2010 were unspectacular compared to the sector’s high watermark in 2008, when US$ 11.8 billion in VC/PE funding went into the sector. That was the year that oil climbed to over US$ 150/barrel, while through much of 2010, it traded in the US$ 80-90/barrel range. Still, 2010 represented a marked improvement from 2009, when investment slumped to US$ 6.8 billion. In all, 2010 saw US$ 8.8 billion in new investment from VC/PE deals (Figure 14).
Figure Figure Figure Figure 14141414: Venture Capital/Private Equity New Investment in Clean Energy, 2004 to 2010, US: Venture Capital/Private Equity New Investment in Clean Energy, 2004 to 2010, US: Venture Capital/Private Equity New Investment in Clean Energy, 2004 to 2010, US: Venture Capital/Private Equity New Investment in Clean Energy, 2004 to 2010, US$ $ $ $ billionsbillionsbillionsbillions
Source: Bloomberg New Energy Finance
Among the biggest private equity fundings of the year was Pattern Energy’s US$ 400 million raised from Riverstone Holdings. Pattern used the funds to expand its project development efforts in Latin America and elsewhere. Meanwhile, in Argentina the project development arm of wind turbine maker IMPSA secured US$ 219 million from a fund controlled by Caixa Federal Economico to develop projects in the Brazil states of Ceara and Catarina.
0.2 0.7 0.3 0.3 0.4 0.7 0.5 0.9 1.2 1.6 1.8 1.3 1.8 1.5 1.72.6 2.4
3.04.0
2.4
1.51.7 2.0 1.7
2.9 2.71.4 1.7
Q1 04
Q2 04
Q3 04
Q4 04
Q1 05
Q2 05
Q3 05
Q4 05
Q1 06
Q2 06
Q3 06
Q4 06
Q1 07
Q2 07
Q3 07
Q4 07
Q1 08
Q2 08
Q3 08
Q4 08
Q1 09
Q2 09
Q3 09
Q4 09
Q1 10
Q2 10
Q3 10
Q4 10
Four quarter running average

Green Investing 2011 20
One of the biggest technology-oriented venture investments of 2010 involved California-based Better Place, which secured US$ 350 million from HSBC, Lazard Asset Management, Maniv Energy Capital, Morgan Stanley, Ofer Hi-Tech Holdings and VantagePoint Venture Partners. Better Place seeks to build complete electric vehicle infrastructure in Denmark, Hawaii and Israel. Fisker Automotive, another company focused on electric vehicles, raised US$ 115 million in January 2010 from venture firm Kleiner Perkins Caufield & Byers and advanced battery maker A123 Systems. Fisker and Better Place together accounted for roughly one-sixth of all pure venture capital deployed. Renewed Interest in EarlyRenewed Interest in EarlyRenewed Interest in EarlyRenewed Interest in Early----sssstage Financingtage Financingtage Financingtage Financing Difficulties with the public markets have vexed the clean energy venture community since the credit crisis of 2008-2009. But 2010 saw a decent rebound in funding for the newest clean energy start-ups as Series A investments jumped to 129 from 104 in 2009. This was a hopeful sign that new, fresh-from-the-lab ideas were increasingly able to secure funding. Meanwhile, the average size of a late-round VC investment in a clean energy firm grew from US$ 18 million in 2007 to US$ 28 million in 2010. The increased participation of VCs in early-stage companies might also represent the impact that the US Department of Energy Advanced Research Projects Agency - Energy (ARPA-E) has had on the market. Established by the American Recovery and Reinvestment Act (the “stimulus bill”), ARPA-E has made over US$ 400 million available to the earliest stage start-up firms in the United States that, in turn, have used the capital to leverage investment from the private sector. As in prior years, the US was dominant in terms of total VC funds deployed – as shown in Figures 15 and 16. This is a reflection of the strong venture-oriented culture in the tech hubs of northern California, Massachusetts and elsewhere. However, those figures should not be construed as evidence that all of the most important energy innovation is taking place in the United States. China, in particular, has stepped up its support of energy technology R&D in recent years through the development of major state-owned research centres.
Figure Figure Figure Figure 15151515:::: Venture Capital and Private Equity Financings 2010, USVenture Capital and Private Equity Financings 2010, USVenture Capital and Private Equity Financings 2010, USVenture Capital and Private Equity Financings 2010, US$ $ $ $ billionsbillionsbillionsbillions
Source: Bloomberg New Energy Finance
US$6.0 bn
68%
UK$0.4 bn, 4%
China, $0.3 bn, 3%
Brazil, $0.3 bn, 3%
Argentina, $0.2 bn, 3%
Chile, $0.2 bn, 3%
Rest of World$1.4 bn
16%

21 Green Investing 2011
FigureFigureFigureFigure 16161616: Venture Capital New Investment in Clean Energy by Country, 2010, US: Venture Capital New Investment in Clean Energy by Country, 2010, US: Venture Capital New Investment in Clean Energy by Country, 2010, US: Venture Capital New Investment in Clean Energy by Country, 2010, US$ $ $ $ millionsmillionsmillionsmillions
Source: Bloomberg New Energy Finance
Carbon Market UpdateCarbon Market UpdateCarbon Market UpdateCarbon Market Update The global carbon markets began 2010 against a backdrop of significant uncertainty in the wake of the inconclusive Copenhagen talks in December 2009. Despite some progress achieved at the Cancún negotiations in December 2010, it is still uncertain what trading scheme, if any, will succeed the international Clean Development Mechanism of the Kyoto Protocol. As shown in Figure 17, the overall value of carbon emission rights traded throughout the world in 2010 increased 5%, reaching 93 billion euros (US$ 120 billion). The reason for the increase in market value was the higher level of carbon prices seen in 2010. The weighted average price of carbon transactions throughout the world increased by 17%, from 11.6 euros/tCO
2 to
13.6 euros /tCO2. In the European Union’s Emissions Trading Scheme, which accounts for 80% of global transacted volume,
weighted average carbon prices rose by 6.6%, from 13.6 euros/tCO2 in 2009 to 14.5 euros/tCO
2 in 2010.
In contrast to the movement in prices, traded volumes across the world fell by 10%, decreasing from 7.7 billion tCO
2 in 2009 to
6.9 billion tCO2 in 2010. The main source of this decline was the collapse of trading in the Regional Greenhouse Gas Initiative
(RGGI) in the United States. In 2009 the RGGI scheme accounted for 9% of global carbon market transactions but, in 2010, this fell to less than 1% due to the evaporation of prospects for a federal-level cap-and-trade scheme in the United States. The volume of carbon credits traded under the Clean Development Mechanism of the Kyoto Protocol increased by 1%. The main market of the EU Emissions Trading Scheme saw virtually no change in volume traded, stable at 5.5 billion tCO
2.
Through much of 2010, the US Congress struggled to pass a comprehensive cap-and-trade bill. Those efforts eventually collapsed.
$419m $108m
47
US$ 4,078m
EMEA ASOC AMER
US $4,031m
Canada $47m

Green Investing 2011 22
FigureFigureFigureFigure 17171717: : : : Carbon Markets by QuarterCarbon Markets by QuarterCarbon Markets by QuarterCarbon Markets by Quarter,,,, 2009 to 2010, 2009 to 2010, 2009 to 2010, 2009 to 2010, USUSUSUS$ $ $ $ billionsbillionsbillionsbillions
Volume Value
Note: EUA, European Union allowance; pCER, primary Certified Emission Reduction; sCER, secondary Certified Emission Reduction; RGGI, allowance from the US Regional Greenhouse Gas Initiative; AAU, Assigned Amount Unit.
Source: Bloomberg New Energy Finance
It should be noted that cap-and-trade, while potentially critical to cutting global CO
2 emissions, has not proven to be a
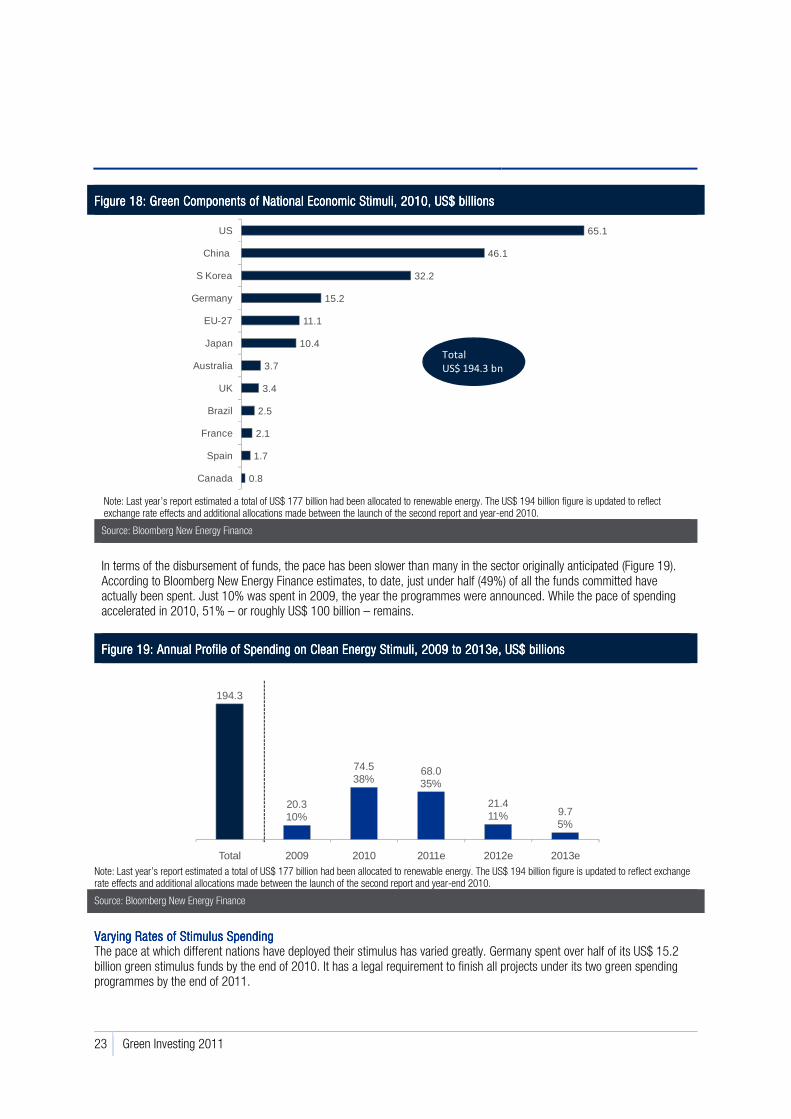
substantial driver of investment in new clean energy companies and projects. In October 2010, Bloomberg New Energy Finance surveyed 13 major European utilities responsible for just over half of all power sector emissions in the EU. The study found that the European scheme had primarily motivated these utilities to switch from coal to natural gas generation. It did little to spur them to add clean energy generation capacity. Significant clean energy capacity additions have taken place across Europe, but these have been primarily spurred by feed-in tariffs in countries such as Germany, Italy and the Czech Republic. Public SectorPublic SectorPublic SectorPublic Sector FundingFundingFundingFunding In 2009, governments around the world pledged to invest unprecedented sums in clean energy, primarily to stimulate their economies. Figure 18 shows that, according to Bloomberg New Energy Finance’s latest count, no less than US$ 194 billion was put on the table. The United States was the global leader, offering US$ 65 billion. China was a distant second with US$ 46 billion although, as discussed above, public sector support for renewables in the country comes in various forms besides direct government spending. Meanwhile, South Korea was the top nation in supporting clean energy via stimulus on a per capita basis. The country has pledged US$ 32 billion to date. On a per capita basis, that figure represents US$ 659 per person in South Korea. By comparison, the US pledged US $ 212 per capita.
1,947
2,210
1,7721,634 1,588
2,194
1,448 1,520
0
500
1,000
1,500
2,000
2,500
Q1 Q2 Q3 Q4 Q1 Q2 Q3 Q4
2009 2010EUAs sCERs pCERs RGGI AAUs
0
5
10
15
20
25
30
35
40
45
Q1 Q2 Q3 Q4 Q1 Q2 Q3 Q4
2009 2010
EUAs sCERs pCERs RGGI AAUs
23 Green Investing 2011
FigureFigureFigureFigure 18181818: Green Components of National Economic Stimuli: Green Components of National Economic Stimuli: Green Components of National Economic Stimuli: Green Components of National Economic Stimuli,,,, 2010, US2010, US2010, US2010, US$ $ $ $ billionsbillionsbillionsbillions
Note: Last year’s report estimated a total of US$ 177 billion had been allocated to renewable energy. The US$ 194 billion figure is updated to reflect exchange rate effects and additional allocations made between the launch of the second report and year-end 2010.
Source: Bloomberg New Energy Finance
In terms of the disbursement of funds, the pace has been slower than many in the sector originally anticipated (Figure 19). According to Bloomberg New Energy Finance estimates, to date, just under half (49%) of all the funds committed have actually been spent. Just 10% was spent in 2009, the year the programmes were announced. While the pace of spending accelerated in 2010, 51% – or roughly US$ 100 billion – remains.
FigureFigureFigureFigure 19191919: Annual Profile of Spending on Clean Energy Stimuli: Annual Profile of Spending on Clean Energy Stimuli: Annual Profile of Spending on Clean Energy Stimuli: Annual Profile of Spending on Clean Energy Stimuli,,,, 2009 to 2013e, US2009 to 2013e, US2009 to 2013e, US2009 to 2013e, US$ $ $ $ billionsbillionsbillionsbillions
Note: Last year’s report estimated a total of US$ 177 billion had been allocated to renewable energy. The US$ 194 billion figure is updated to reflect exchange rate effects and additional allocations made between the launch of the second report and year-end 2010.
Source: Bloomberg New Energy Finance
Varying Varying Varying Varying Rates Rates Rates Rates of of of of Stimulus SpendingStimulus SpendingStimulus SpendingStimulus Spending The pace at which different nations have deployed their stimulus has varied greatly. Germany spent over half of its US$ 15.2 billion green stimulus funds by the end of 2010. It has a legal requirement to finish all projects under its two green spending programmes by the end of 2011.
0.8
1.7
2.1
2.5
3.4
3.7
10.4
11.1
15.2
32.2
46.1
65.1
Canada
Spain
France
Brazil
UK
Australia
Japan
EU-27
Germany
S Korea
China
US
Total
US$ 194.3 bn
194.3
20.310%
74.538%
68.035%
21.411% 9.7
5%
Total 2009 2010 2011e 2012e 2013e
Green Investing 2011 24
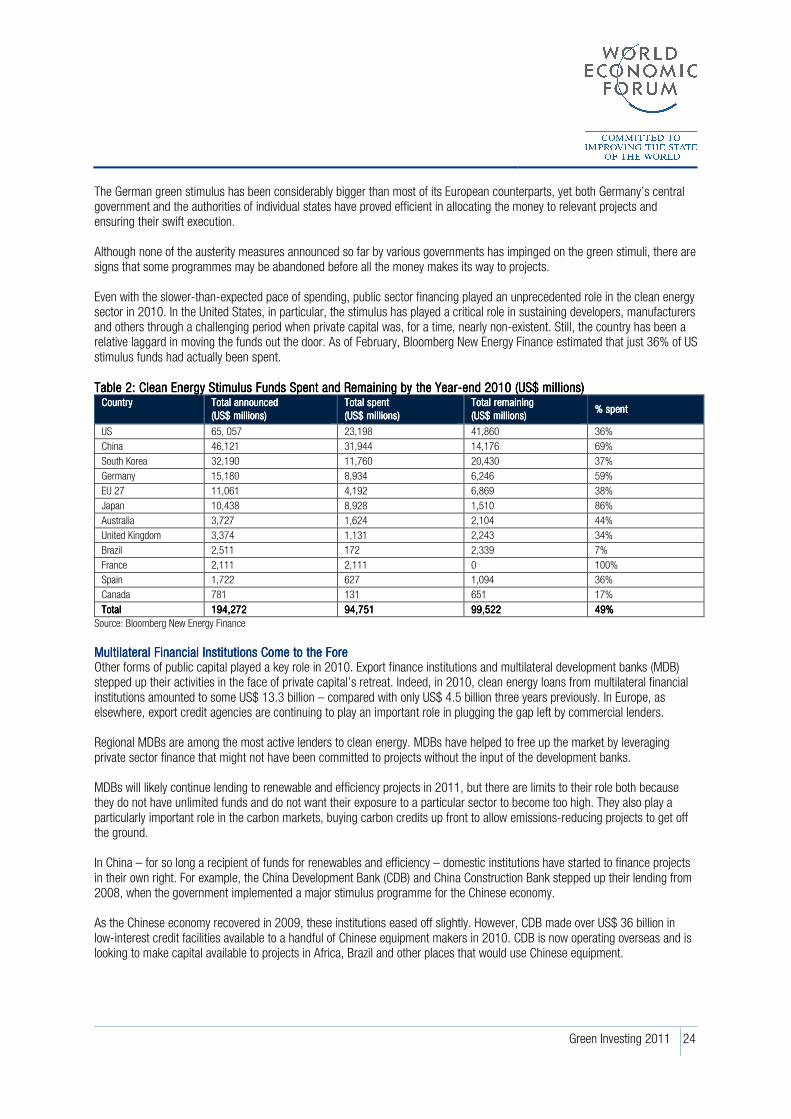
The German green stimulus has been considerably bigger than most of its European counterparts, yet both Germany’s central government and the authorities of individual states have proved efficient in allocating the money to relevant projects and ensuring their swift execution. Although none of the austerity measures announced so far by various governments has impinged on the green stimuli, there are signs that some programmes may be abandoned before all the money makes its way to projects. Even with the slower-than-expected pace of spending, public sector financing played an unprecedented role in the clean energy sector in 2010. In the United States, in particular, the stimulus has played a critical role in sustaining developers, manufacturers and others through a challenging period when private capital was, for a time, nearly non-existent. Still, the country has been a relative laggard in moving the funds out the door. As of February, Bloomberg New Energy Finance estimated that just 36% of US stimulus funds had actually been spent. Table Table Table Table 2222: : : : Clean Energy Stimulus Clean Energy Stimulus Clean Energy Stimulus Clean Energy Stimulus Funds Funds Funds Funds SSSSpent and pent and pent and pent and RRRRemaining by the emaining by the emaining by the emaining by the YearYearYearYear----eeeend 2010 (nd 2010 (nd 2010 (nd 2010 (USUSUSUS$$$$ mmmmillionsillionsillionsillions))))
CountryCountryCountryCountry Total announcedTotal announcedTotal announcedTotal announced
(US$(US$(US$(US$ millions)millions)millions)millions)
Total spentTotal spentTotal spentTotal spent
(US$ millions)(US$ millions)(US$ millions)(US$ millions)
Total remainingTotal remainingTotal remainingTotal remaining
(US$ millions)(US$ millions)(US$ millions)(US$ millions) % spent% spent% spent% spent
US 65, 057 23,198 41,860 36%
China 46,121 31,944 14,176 69%
South Korea 32,190 11,760 20,430 37%
Germany 15,180 8,934 6,246 59%
EU 27 11,061 4,192 6,869 38%
Japan 10,438 8,928 1,510 86%
Australia 3,727 1,624 2,104 44%
United Kingdom 3,374 1,131 2,243 34%
Brazil 2,511 172 2,339 7%
France 2,111 2,111 0 100%
Spain 1,722 627 1,094 36%
Canada 781 131 651 17%
TotalTotalTotalTotal 194,272194,272194,272194,272 94,75194,75194,75194,751 99,52299,52299,52299,522 49%49%49%49%
Source: Bloomberg New Energy Finance
Multilateral Multilateral Multilateral Multilateral Financial Institutions Come Financial Institutions Come Financial Institutions Come Financial Institutions Come to the to the to the to the FFFForeoreoreore Other forms of public capital played a key role in 2010. Export finance institutions and multilateral development banks (MDB) stepped up their activities in the face of private capital’s retreat. Indeed, in 2010, clean energy loans from multilateral financial institutions amounted to some US$ 13.3 billion – compared with only US$ 4.5 billion three years previously. In Europe, as elsewhere, export credit agencies are continuing to play an important role in plugging the gap left by commercial lenders. Regional MDBs are among the most active lenders to clean energy. MDBs have helped to free up the market by leveraging private sector finance that might not have been committed to projects without the input of the development banks. MDBs will likely continue lending to renewable and efficiency projects in 2011, but there are limits to their role both because they do not have unlimited funds and do not want their exposure to a particular sector to become too high. They also play a particularly important role in the carbon markets, buying carbon credits up front to allow emissions-reducing projects to get off the ground. In China – for so long a recipient of funds for renewables and efficiency – domestic institutions have started to finance projects in their own right. For example, the China Development Bank (CDB) and China Construction Bank stepped up their lending from 2008, when the government implemented a major stimulus programme for the Chinese economy. As the Chinese economy recovered in 2009, these institutions eased off slightly. However, CDB made over US$ 36 billion in low-interest credit facilities available to a handful of Chinese equipment makers in 2010. CDB is now operating overseas and is looking to make capital available to projects in Africa, Brazil and other places that would use Chinese equipment.

Policy Update
25 Green Investing 2011
The rocky path to economic recovery in Western nations had major implications for clean energy policy-making and enforcement in 2010. Meanwhile, developing nations less encumbered by the slowdown – Brazil, China and India – expanded efforts to support domestic renewables with an eye on the global economic opportunity they might someday represent. In the United States, legislation that would have cut domestic emissions economy-wide while mandating certain levels of clean energy consumption was not approved. The year came to a close in with Congress passing a last-minute extension of a key economic stimulus programme that allows developers to receive cash grants equal to 30% of their project’s CAPEX. Low Low Low Low Expectations Exceeded Expectations Exceeded Expectations Exceeded Expectations Exceeded at Cancat Cancat Cancat Cancúúúúnnnn During the first week of the negotiations at the international climate negotiations in Cancún, it appeared the entire process might be derailed after Japan said it had no intention of signing an extension of the Kyoto Protocol past its expiration in 2012 without US participation. However, during the waning hours of the talks, the 193 gathered nations made important progress, agreeing generally on the following key points:
• The confirmation of the target to limit global temperature increase to 2°C above pre-industrial levels; this included a formal recognition of countries’ mitigation efforts put forward at Copenhagen; those previously had not been ratified
• The endorsement of a new Green Fund to be administered in part by the World Bank: the fund would support emissions mitigation and climate change adaptation efforts in developing nations with capital from developed countries; this marked a follow-through from Copenhagen where developed countries committed to provide US$ 100 billion in financing per year starting in 2020
• The establishment of a mechanism under which developing countries receive international financial support for forest protection if they determine national strategies to halt deforestation and specify monitoring plans
Most importantly for the carbon markets, the countries gathered in Cancún committed to continue discussions on a potential successor to the Clean Development Mechanism (CDM) after the expiration of the Kyoto Protocol. The goal of such talks is to avoid a gap between when Kyoto expires at end of 2012 and when a new trading scheme might come into force. Cancún widened the scope for international offsets by including carbon capture and storage as an eligible technology type under the CDM and establishing a mechanism to reduce emissions from deforestation and forest degradation and enhance forest carbon stocks (REDD+). What becomes more apparent with each major round of global negotiations is that a single, worldwide pact inclusive of every nation on earth may be neither possible nor logical. A more feasible model appears to be emerging in which countries unilaterally set national targets to cut emissions and/or increase clean energy capacity. In the run-up to Cancún, Brazil, China, India and others seemed to engage in a virtuous competition to set national targets and demonstrate commitment to the cause. Clean Clean Clean Clean EnergyEnergyEnergyEnergy: : : : Opportunity Opportunity Opportunity Opportunity or or or or Potential ConflictPotential ConflictPotential ConflictPotential Conflict???? The creation of such policies has been motivated by far more than concern over climate change. Most nations seek greater energy security and boosting domestic power generation can help address that goal. In addition, policy-makers from Brazil to China, Ontario and Scotland have high hopes of fostering local manufacturing, expanding exports and creating “green jobs”. The idea that clean energy represents one of the greatest economic opportunities of the 21st century has now clearly taken root in many parts of the globe. This can generally be considered good news for the industry as it means subsidies are likely to be dispersed across more nations in coming years. However, as countries aspire to global leadership in this area, conflicts are bound to arise. 2010 saw no shortage of debates between nations over subsidies, tariffs and local-content rules and quotas. Three disputes remained very much in play as of the start of 2011:
• Japan has filed a complaint at the World Trade Organization (WTO) over Ontario’s requirement that solar developers use local content to be eligible for participation in the province’s feed-in tariff programme. A provision of the programme requires projects to use Ontario goods and labour for 25-40% of supply costs, depending on the type of renewable-energy source. The requirements are set to rise in 2011.
• The Brazilian Sugarcane Industry Association (UNICA) does not support the US move to extend subsidies for domestic ethanol producers and to extend a US$ 0.54/gallon tariff on imported bioethanol – of which Brazil is the world’s second largest producer. UNICA has vowed to pursue early cancellation of the tariff at the WTO. The US actions were included in the massive tax and spending bill signed into law on 17 December by President Obama.

Green Investing 2011 26
• The US Trade Representative (USTR) has asked the WTO for consultations about whether China’s Special Fund for Wind Power Manufacturing constitutes an illegal subsidy. The USTR’s action resulted from an investigation by his office in response to a petition filed in October by the United Steelworkers Union, which said that US jobs are threatened by a Chinese policy that state-owned projects show preference to generation equipment produced using domestically sourced parts and labour.
Asia Asia Asia Asia Moves Moves Moves Moves fffforward orward orward orward on itson itson itson its Clean Energy AmbitionsClean Energy AmbitionsClean Energy AmbitionsClean Energy Ambitions China, the world’s second largest economy, is now very much a clean energy powerhouse. The country is home to more wind and solar manufacturing than any other nation because the central and provincial governments continue to seize the initiative to support the sector, using both formal policies and less-formal directives to state-backed companies and banks. On 14 March this year, China’s National People’s Congress approved a draft for the 12th Five-Year Plan for national economic and social development covering 2011-2015. In the Plan, China commits to pursue a slower but more balanced and greener economic growth strategy with an emphasis on upgrading grids, boosting investment in renewable power and efficiency improvement, and increasing the share of renewables in overall generation. It also gives a clearer direction for efforts to push further on reducing carbon emissions and for the development of a low-carbon economy. Table 3 shows the provisions included in China’s 12th Five-Year Plan relating to clean energy. Japan, the world’s third largest economy, is home to one of the world-leading solar equipment makers (Sharp) and Japanese multinationals such as Mitsubishi are taking a growing interest in the international wind market. But the country’s 10 vertically integrated utilities have been relatively slow to take steps to add clean-energy capacity. In 2009, the national government restarted photovoltaic-installation subsidies for households and implemented a “PV buy-back” programme. In addition, the Ministry of Economy, Trade and Industry is developing a feed-in tariff programme to replace existing renewable portfolio standards and broaden the scope of the PV buy-backs. In the wake of the recent earthquake and tsunami disaster, Japan's long-term energy plans, which had included substantial amounts of new nuclear build, are likely to be reconsidered. Table Table Table Table 3333: : : : Provisions Provisions Provisions Provisions IIIIncluded in Chinancluded in Chinancluded in Chinancluded in China’’’’s s s s 12121212thththth FFFFiveiveiveive----YYYYear ear ear ear PPPPlanlanlanlan
Sector Goals
Carbon intensity Carbon emissions per unit of GDP to reduce by 17% by 2015 from 2010 levels
Carbon trading Establish a carbon trading scheme gradually, set up and improve a reporting and verification system for GHG emissions, and promote
low-carbon pilot schemes
Energy efficiency Further electricity pricing reforms in favour of efficiency, provide financial support to ESCOs, develop an energy-use cap in energy-
intensive industries and allow pilot energy saving trading
Energy intensity Energy consumption per unit of GDP to reduce by 16% by 2015 from 2010 levels
Forests Increase the area of forest coverage by 12.5 million hectares and forest stock volume by 600 million cubic metres
Grid Build cross-region UHV transmission lines to support long-distance power transmission and grid connection for renewable power with
200,000 kilometres of power lines with capacity of 330kV and above by 2015, roll out smart substations, promote the use of smart
meters, and build electric car charging facilities
Hydro Start construction of 120gW
Non-fossil fuel use share 11.4% in primary energy consumption by 2015
Nuclear Start construction of 40gW
Solar Installed capacity by 2015: 5gW
Transport Construct 35,000 kilometres of high-speed rail to connect every city with a population greater than 500,000
Wind Install at least 70gW of new capacity
Source: Bloomberg New Energy Finance
India has continued to roll out new policies intended to spur more domestic clean energy generation and manufacturing capacity. Unveiled in 2009, the country’s Solar Mission plan seeks to add 20gW of new capacity locally by 2020, with much of the equipment required to be made in the country. After several delays, guidelines on how projects can receive the benefit of the Mission were eventually revealed in July with a feed-in tariff set at US$ 0.39/kWh for the first 54mW of PV capacity. Questions remain about whether a sufficient number of projects can apply for and receive the benefit, however. In the meantime, the domestic PV sector is scrambling to grow big enough to supply the modules that will be needed under the Mission’s long-term goals.

27 Green Investing 2011
Europe Europe Europe Europe Considers Considers Considers Considers WWWWhether to hether to hether to hether to Renege Renege Renege Renege on on on on Previous CommitmentsPrevious CommitmentsPrevious CommitmentsPrevious Commitments ………… As China and other nations charged forward ambitiously in 2010, Spain spent much of the year looking back at commitments previously made to domestic clean energy projects under the country’s feed-in-tariff scheme. With its national debt ballooning along with its unemployment rate, policy-makers contemplated cutting consumer electricity costs by retroactively reducing the tariff or disqualifying some projects from receiving its benefit. Ultimately, in November, the government cut the above-market price to be earned by new ground-based photovoltaic systems by 45% in a Royal Decree but backed off retroactive cuts in the face of outcry from the local renewable energy sector. The move marked a victory for clean energy advocates but left investors shaken. The tariffs offered by the government are intended to last 25 years and have proven critical to raising financing. The Spanish experience raised concerns that governments elsewhere facing fiscal pinches might also seek to cut tariffs after the fact. Such worries had little spill-over into Germany, however. With its generous feed-in tariffs due to expire at the end of 2010, developers and home-owners alike scrambled to take advantage of the deal. In 2010, the country added at least 7.5gW of new PV capacity – an unprecedented figure. In a sense, there was logic behind the scramble given the generosity of the German scheme and scheduled sharp drop-off. Roof-mounted systems in 2010 received up to 330.3 euros/mWh, but today the peak rate tops out at 287.4 euros/mWh. One of the great questions for this year is how much additional capacity will be added in Germany now that the tariff has dropped. In addition, the country could soon face problems related to over-saturation. Like Spain, the United Kingdom embarked on a new era of fiscal austerity in 2010 in the wake of elections that brought a new Conservative-Liberal Democrat coalition to power. In February 2011, however, the government said that it would be scaling back its feed-in tariff for large-scale projects. In addition, in early 2011, the United Kingdom government determined the role a proposed Green Investment Bank should have in growing its clean energy sector. The bank’s mission is to raise and place capital to counter conventional financings that fail. One high-visibility example was the Severn Barrage tidal power plan, which at US$ 47.4 billion to deploy appeared to be too big and risky for even the biggest financiers to take on. ………… While While While While a a a a Seemingly Promising Year Seemingly Promising Year Seemingly Promising Year Seemingly Promising Year for Brazilian for Brazilian for Brazilian for Brazilian Wind Wind Wind Wind is is is is Called Called Called Called into into into into DoubtDoubtDoubtDoubt In the Americas, Brazil sought to jump-start its domestic wind turbine manufacturing sector through a new series of reverse auctions for 2.1gW of new wind power contracts. A key requirement to participate is that contract winners would have to source a significant portion of their wind equipment from domestic manufacturers. The contracts were successfully auctioned off, but bid winners pledged to develop their projects at what appear to be unrealistically low rates, raising significant doubts about the entire process. Update on Update on Update on Update on Alternative Financing MechanismsAlternative Financing MechanismsAlternative Financing MechanismsAlternative Financing Mechanisms With financial markets still recovering from the Great Recession, commercial and public finance institutions are attempting to backfill a void in the availability of debt to renewable energy projects. A year ago, the World Economic Forum and Bloomberg New Energy Finance identified a range of public policy financing mechanisms intended to spur clean energy research, development and deployment
8. Here we provide an update on how some of these were put to work in 2010.
8 World Economic Forum in collaboration with Bloomberg New Energy Finance, Green Investing 2010: Policy Mechanisms to Bridge the Financing Gap, 2010, http://www3.weforum.org/docs/WEF_IV_GreenInvesting_Report_2010.pdf

Green Investing 2011 28
Table Table Table Table 4444:::: Public Public Public Public Policy Financing Mechanism UpdatePolicy Financing Mechanism UpdatePolicy Financing Mechanism UpdatePolicy Financing Mechanism Update
MechanismMechanismMechanismMechanism DescriptionDescriptionDescriptionDescription StageStageStageStage 2010 Example(s)2010 Example(s)2010 Example(s)2010 Example(s)
Debt fundsDebt fundsDebt fundsDebt funds Credit lines for senior or
mezzanine/subordinated lending
Demonstration &
Scale-up;
Commercial Roll-out
Germany’s KfW IPEX-Bank, which specializes in project and
corporate finance, expected to have a commitment to renewable
lending of US$ 920 million in 2010.
Loan guaranteesLoan guaranteesLoan guaranteesLoan guarantees
Pledge by a government or government-
supported entity to protect the lender
from technology, business-model or
other “proof of concept” risks
Demonstration &
Scale-up;
Commercial Roll-out
The US has eliminated a requirement that the borrower pay the
credit subsidy cost of a loan guarantee, defined as the net present
value to the US government of the cost of the loan guarantee, at
closing. Since that change, guarantees have been made on a US$
1.45 billion loan to Abengoa and a US$ 1.37 billion loan to
BrightSource, among others.
Green bondsGreen bondsGreen bondsGreen bonds Typically issued by a government agency
or multinational institution, these are
most suitable for smaller developers or in
markets with high capital costs
Commercial Roll-out The International Finance Corporation, part of the World Bank
Group, issued its first green bond. The US$ 200 million, four-year,
2.25% fixed rate instrument can only be used to invest in
renewable energy and energy-efficiency projects as part of IFC’s
broader mandate to halt the effects of climate change.
Export trade Export trade Export trade Export trade
creditcreditcreditcredit
A lending line intended to promote the
growth of domestic clean-energy
manufacturers and finance the foreign
purchase of domestically made
equipment
Diffusion & Maturity This credit forms the basis of the US Renewable Energy and
Energy Efficiency (RE&EE) Export initiative, announced in
December 2010, to promote exports of US-made clean energy
products and services. The Department of Energy and seven other
agencies began the initiative with a pledge of more than US$ 300
million in financing from the Overseas Private Investment Corp.
Risk insuranceRisk insuranceRisk insuranceRisk insurance Indemnity coverage for investors,
contractors, exporters and financial
institutions intended to spur private
investment in clean energy in the
developing world
Diffusion & Maturity The German Ministry for the Environment, development bank KfW
and reinsurer Munich Re launched a US$ 75.9 million credit
initiative to address the risk of geothermal projects based on high
drilling costs and the likelihood of finding insufficient volumes of
water at the required temperatures.
EEEEnergy nergy nergy nergy service service service service
ccccompany ompany ompany ompany fundsfundsfundsfunds
Finances initiatives to drive energy
efficiency
Diffusion & Maturity The European Bank for Reconstruction and Development approved
a US$ 9.2 million loan to Bulgaria’s Energetics and Energy Savings
Fund to finance the purchase of receivables under energy-saving
contracts in schools, hospitals and municipal buildings.
Source: Bloomberg New Energy Finance

The Cost of Capital and Implications
for Clean Energy Deployment
29 Green Investing 2011
The economics of clean energy projects differ fundamentally from those of fossil fuel burning plants. For a typical geothermal, solar or wind project, nearly all the costs are fixed and come during the development and construction phases. Marginal costs incurred later during power production are nearly non-existent as the “fuel” needed to run such plants – below-ground heat, sun or wind – is effectively free. By contrast, coal, natural gas or oil burning plants have lower upfront fixed costs, but incur higher marginal costs over their useful lives. While fossil fuel plants are subject to fuel price volatility, renewable energy plants are sensitive to shifts in interest rates. For this reason, the decision about whether to build a new clean energy plant is particularly predicated on the cost of available capital. Over the past several years, the progress that has been made in cutting clean energy equipment costs, particularly in the area of solar photovoltaics, has attracted considerable attention. As investors and lenders grow more comfortable with the risk profile of clean energy projects, they are more likely to offer capital at lower cost. In addition, financiers are finding new and creative ways to bring down the overall cost of capital by reducing/spreading risk. Despite recent progress, there is still room for reductions in the costs of capital for clean energy, hence in the cost of the resulting power. However, policy choices focusing solely on cutting clean energy costs of capital can have significant unintended consequences. Policy-makers worldwide have devised various mechanisms to spur clean energy deployment. These mechanisms include, among others, national targets, tax credits and feed-in tariffs that offer fixed prices for cleanly generated electricity.
9 Each of these potential solutions can impact the underlying cost of clean energy by reducing the cost of capital.
In this section, we use Bloomberg New Energy Finance’s Levelized Cost of Energy (LCOE) models to first examine the current costs – excluding the effects of any subsidies or support mechanisms – associated with generating clean energy from various technologies. We then turn to the sensitivity of LCOEs to various drivers, such as equipment costs and cost of finance, which could make clean energy technologies cost-competitive with fossil sources of generation. Finally, we examine various policies being put to work around the world and assess which ones have been most effective at reducing the cost of clean energy generation while making efficient use of public funds. LevelLevelLevelLevelizeizeizeized d d d Costs Costs Costs Costs of of of of EnergyEnergyEnergyEnergy The LCOE takes into account all costs – equipment and financing – amortized over the lifetime of the project. LCOE is by no means a perfect metric, but it does offer a useful means for comparing the underlying economics of power projects that use different technologies. The LCOE model tracks construction, equipment, operations and maintenance costs, sector-specific interest rates and financial structures of a typical project. The LCOE model calculates a fixed-price, inflation-linked US$/mWh figure for the price of the power required to provide an investor with a predetermined equity hurdle rate (for the base case, we assume that the equity hurdle rate is 10%). Figure 20 represents the estimate of the current LCOE for various energy technologies. Today, onshore wind, geothermal and bioenergy projects using landfill gas and municipal solid waste are most likely to be directly competitive with thermal generation on an unsubsidized basis. Many of these technologies still have a wide range of possible costs depending on geography, renewable resource quality and feedstock prices, while the present cost of thermal energy is dependent on highly uncertain future fuel costs.
9 World Economic Forum in collaboration with Bloomberg New Energy Finance, Green Investing 2010: Policy Mechanisms to Bridge the Financing Gap, 2010, http://www3.weforum.org/docs/WEF_IV_GreenInvesting_Report_2010.pdf

Green Investing 2011 30
Figure Figure Figure Figure 22220000 Levelized Cost of EnergyLevelized Cost of EnergyLevelized Cost of EnergyLevelized Cost of Energy,,,, QQQQ4444 2010, US2010, US2010, US2010, US$$$$////mWmWmWmWhhhh
Note: Assumes base case of a required 10% “hurdle rate” for investors. “PV c-Si” represents projects using photovoltaic equipment with crystalline silicon. “PV c Si Tracking” represents such projects using that technology with trackers that lock the solar modules on the trajectory of the sun. “STEG” stands for “solar thermal electricity generation”
Source: Based on the Bloomberg New Energy Finance LCOE model
These levelized costs are by no means static. For instance, since 2008, the LCOE for photovoltaics (PV) has declined dramatically. Previously, production from solar thermal electricity generation (STEG) projects was regarded as cheaper than from PV. Today, however, most solar-based technologies are roughly in the same cost range. Looking beyond 2011, PV projects are likely to be able to produce consistently cheaper energy than STEG projects on an LCOE basis. However, it should be noted that STEG technology may offer specific characteristics that make it appealing to developers and utilities. These include the use of thermal storage or hybridization with natural gas to improve the utilization of the generating equipment and smooth output. Offshore wind remains definitively more expensive than conventional power-generating technologies, but more cost-competitive than any current solar technologies. Offshore projects must be built at large scale; because they are located at sea, they enjoy better wind resources, but require more complex construction and maintenance than onshore projects. Marine technologies are still less developed than the other types of clean energy technologies; hence, they sit at the far end of the cost curve. Developers of marine technologies expect major developments in coming years that will result in lower equipment costs and lower risk. However, given the amount of engineering required for these installations to survive the marine environment, it is not yet clear they will be able to deliver. VariatVariatVariatVariationionionions in LCOEs in LCOEs in LCOEs in LCOE The LCOE for each clean energy sector can vary widely by region or project as LCOE is determined by various factors – such as capital cost, shipping, labour, availability of renewable resources, leverage and interest rates. These variations can cause LCOE analyses to sometimes produce surprising results. For instance, a PV project operating in a highly insolated (i.e. very sunny) desert environment could actually have a higher cost of generation than a similarly sized project in a relatively cloudy part of the world if the sunnier project has been financed with much higher-cost debt. Conversely, a wind project operating in low-wind conditions could have a lower LCOE than a similarly sized project in a high-wind environment if the low-wind project is using particularly inexpensive wind turbines.
0 50 100 150 200 250 300 350 400
Coal Fired
Natural Gas CCGT
Geothermal - Flash Plant
Geothermal - Binary Plant
Municipal Solid Waste
Landfill Gas
Wind - Onshore
Biomass - Incineration
Biomass -Gasification
Biomass - Anaerobic Digestion
Wind - Offshore
STEG - Parabolic Trough
STEG - Parabolic Trough + Storage
PV - c-Si Tracking
PV - Thin Film
PV - c-Si
Marine - Tidal
Marine - Wave
LCOE Carbon: BNEF EU-ETS Central Scenario

31 Green Investing 2011
Bloomberg New Energy Finance has identified six critical factors that impact the LCOE overall: 1. CapacityCapacityCapacityCapacity factorfactorfactorfactor – Capacity factor is the proportion of maximum theoretical output produced by the project. No renewable
project generates power at maximum capacity 24 hours per day, 365 days a year. Wind projects, for instance, tend to have capacity factors of around 30%. Solar PV project tend to average 17%.
2. Debt costDebt costDebt costDebt cost – The cost of debt capital provided to finance a project, specifically the interest rate and tenor. Debt costs vary widely around the world and are contingent on the availability and strength of local financial institutions, perceived sovereign risk, availability of soft finance and other factors.
3. Leverage Leverage Leverage Leverage – Leverage is the amount of debt a project can take on compared to its equity. Projects that can “lever up” must have the lowest overall weighted cost of capital. This, in turn, can bring down LCOE.
4. InflationInflationInflationInflation – Clean energy projects involve nearly 100% fixed costs and almost no marginal costs, so the long-term LCOE of a project can be impacted indirectly by inflation rates. Thus, the most relevant debt cost of any project is actually the “real interest rate” – the nominal interest rate minus the local inflation rate.
5. CAPEXCAPEXCAPEXCAPEX – Capital expenditures (CAPEX) is the cost of equipment and construction. Higher priced geothermal turbines, solar modules or other devices are harder for developers to pay off. This in turn impacts LCOE as developers must charge more for their power to cover their amortized equipment costs.
6. Cost of equityCost of equityCost of equityCost of equity – To date, a variety of investors with a range of risk/return profiles have provided capital to clean energy projects. For the base case LCOE scenario, we assume investors want a 10% equity return (perhaps appropriate for a utility) but expectations can be higher (for instance in the case of private equity) or lower, and can create higher or lower hurdles for project developers to clear.
Figure 21 displays the impact these six drivers could have had on the LCOE of a typical utility-scale PV project built in Q4 2010. The base-case global average LCOE for this project is US$ 240/mWh. Each of the charts in Figure 21 portrays how changes in a single driver would have impacted the LCOE. The thick lighter blue vertical lines indicate the central base-case assumption. For instance, in Chart A, if the capacity factor of a solar project improves from the base case of 17% to 20%, the LCOE declines by US$ 30 to US$ 210/mWh. In the case of debt costs (Chart B), if the interest rate rises from the central assumption of just over 6% to 10%, the LCOE increases by approximately US$ 35 to US$ 275/mWh.

Green Investing 2011 32
Figure Figure Figure Figure 21212121:::: LCOE forLCOE forLCOE forLCOE for UUUUtilitytilitytilitytility----scale PV scale PV scale PV scale PV PPPProject: roject: roject: roject: SSSSensitivity to ensitivity to ensitivity to ensitivity to CCCCost ost ost ost DDDDriversriversriversrivers,,,, USUSUSUS$$$$////mWmWmWmWhhhh
Vertical bVertical bVertical bVertical blue lines lue lines lue lines lue lines represent represent represent represent base casebase casebase casebase case LCOE of USLCOE of USLCOE of USLCOE of US$ $ $ $ 240/240/240/240/mWmWmWmWhhhh
Chart A: LCOE Sensitivity to Capacity Factor (%) Chart B: LCOE Sensitivity to Debt Cost
(% nominal interest rate)
Chart C: LCOE Sensitivity to Leverage (%) Chart D: LCOE Sensitivity to Inflation (% debt)
Chart E: LCOE Sensitivity to CAPEX ($/W) Chart F: LCOE Sensitivity to Cost of Equity (%)
Note: The levelized cost of energy (LCOE) takes into account all cost items affecting the final cost of a project, excluding the impact of subsidies and support mechanism. The base case global average LCOE for a late-2010 PV project is US$ 240/mWh. Each of the six charts shows the sensitivity of the LCOE to a change in a single key cost driver. The y-axis shows how much the final LCOE would change relative to the US$ 240 base case. This simple tool also allows a rough estimate to be made of the LCOE when multiple variables are changed at once. For example: to find the estimate for a 2012 PV project built in Spain by an infrastructure fund, one would start with US $ 240, go to Chart E and adjust the CAPEX to our global 2012 CAPEX projection of US$ 2.30/W, reducing the LCOE by US$ 60 to US$ 180/mWh. Then, because capacity factors in Spain are slightly less than our base case (Chart A), the LCOE rises by approximately US$ 25, to US$ 205/mWh. Finally, assuming it is an infrastructure fund expecting approximately a 15% return building the project, LCOE would rise US$ 55 to US$ 260/mWh (Chart F).
Source: Bloomberg New Energy Finance.
Germany
Spain
Italy
California
-$80
-$30
$20
$70
$120
$170
9% 11% 13% 15% 17% 19% 21% 23% 25%
German project finance
US guarantee debt
US tax equity
BNDES
-$20-$15-$10
-$5$0$5
$10$15$20$25
50% 55% 60% 65% 70% 75% 80% 85% 90%
China
US
Germany
Brazil
-$100
-$80
-$60
-$40
-$20
$0
$20
$40
0% 1% 2% 3% 4% 5% 6% 7% 8%
Italy 2010
US 2010
global 2012
global 2014-$80
-$60
-$40
-$20
$0
$20
$40
$60
$2.00 $2.25 $2.50 $2.75 $3.00 $3.25 $3.50 $3.75 $4.00
state-owned utility
regulated utility
Infrastructure fund
venture-backed
developer
-$40
-$20
$0
$20
$40
$60
$80
$100
$120
6% 8% 10% 12% 14% 16% 18% 20%
US guarantee debt
German project finance
US tax equity
BNDES
-$20-$10
$0 $10 $20 $30 $40 $50 $60 $70 $80
4% 5% 6% 7% 8% 9% 10% 11% 12% 13% 14%

33 Green Investing 2011
The analysis moves from theoretical to real world when actual country scenarios are examined. For instance, Chart C illustrates the base assumption that a US PV project with a US loan guarantee would have 70:30 debt-to-equity ratio and thus the base case LCOE of US$ 240/mWh. However, in Germany, projects have been able to lever up to 80%, which has helped to cut the LCOE by US$ 10, or down to US$ 230/mWh. Similarly, the base case assumption about the CAPEX for a commercial-scale PV project is US$ 3.25/W (Chart E). In Italy, however, projects were built on average for US$ 3.75/W in 2010, adding approximately US$ 20 per mWh and bringing the LCOE to US$ 260/mWh in that country. Chart E also shows how Bloomberg New Energy Finance’s projected declines in PV equipment prices in 2012 and 2014 could, on their own, substantially drive down LCOE to well under US$ 200/mWh. As discussed above, the central assumption in the LCOE model is that the equity investor in a clean energy project seeks a 10% return on investment. But the clean energy market features a variety of investing players, each with slightly different hurdle rates. State-owned entities and regulated utilities might seek a slightly lower return, pushing LCOE down US$ 20-40/mWh (Chart F), while private equity-backed independent power producers may look for equity returns of 20% and higher, increasing the cost of the project by upwards of US$ 100/mWh. For this reason, smaller developers are more likely to seek niche opportunities in small markets with very high power prices or feed-in tariffs. Not all variables have equal impact on overall LCOE. The most important variables tend to be capital costs; the quality of the local natural resource and actual performance of the project (capacity factor); the rate of return required by the asset owner (cost of equity); and the actual cost of borrowing (cost of debt net the impact of inflation). The LCOE of PV in Germany is substantially higher than in Southern California, primarily due to the difference in outdoor conditions. German developers must charge more for each unit of power to cover a similar level of investment to give the desired return, resulting in a higher LCOE. The impact of equity costs is less widely recognized, but also highly important. Recent years have seen an influx of new equity investors in the clean energy realm, most notably some large private equity players. These funds typically seek risk-adjusted returns well above those expected by state-owned or publicly traded utilities. The expectation of a 15-20% return on the part of some funds can drive up LCOE by as much as US$ 50-120. Finally, because renewable energy projects tend to require nearly all their capital up front, the real cost of debt has a major impact on the final LCOE. The charts in Figure 21 can be used to show the approximate net effect of changes in debt costs to LCOE. Take, for instance, the same PV project backed by bank financing in Germany or subsidized loans from BNDES in Brazil. To make the comparison, one would first adjust for the nominal interest rate. In the case of Germany, the market rate of around 6.5% is quite close to the base case (Chart B). This must then be adjusted for inflation to get the real interest rate (Chart D), which is just over 1% against the base case of 2% and reduces LCOE by US$ 15 to US$ 225/mWh. Finally, the security of a long-term feed-in tariff generally allows projects to have a much higher debt-to-equity ratio in Germany, reducing the equity contribution and the LCOE by around US$ 10 to US$ 215/mWh. The same process for Brazil yields +US$ 25 for nominal interest rates of nearly 9%, -US$ 45 for 5% inflation and +US$ 5 for generally high-coverage ratios required by BNDES for a net effect -US$ 15 or US$ 225/mWh, about US$ 10 above Germany. The above scenarios all point to one simple fact: LCOEs are by no means set in stone. They can vary dramatically in response not just to equipment and operating costs, but also to financing costs – and hence to local policy choices, which can have significant implications for the availability and cost of equity and debt. LCOE and the LCOE and the LCOE and the LCOE and the ““““Policy PremiumPolicy PremiumPolicy PremiumPolicy Premium”””” To date, the European experience has proven nearly beyond doubt that generous feed-in tariffs are the most effective policies for spurring large amounts of renewable energy development very quickly. Offer developers nearly guaranteed relatively high returns and investors will almost surely respond. However, such policies can lead to overpayment for clean megawatt-hours and ultimately to backlash from either the public and/or policy-makers.

Green Investing 2011 34
In 2008, Spain offered among the most generous feed-in tariffs in Europe and saw a massive spike in new installations. But as budget concerns mounted in 2009 and into 2010, the country cut back its support and saw development come to a near complete halt. In this section, we introduce the concept of a “Policy Premium”: the amount governments overpay for new renewable energy generation above the rates required for the investors to earn a standard rate of return. The specific examples used in these calculations of premiums are for illustrative purposes only and should not be viewed as an indictment of any specific policy or country. Figure 22 illustrates four scenarios for a standard wind project located in different parts of the world and financed under different policy regimes. We start with a neutral base case LCOE financing scenario, assuming local wind resources and cost of wind turbines but using a global average cost of debt and equity. This base LCOE is then modified, depending on local financing conditions. The equity risk premium represents the impact on LCOE of higher or lower returns demanded by investors as a result of the local policy regime. In countries that offer good long-term policy certainty and stability, investors regard lower risk and thus demand lower returns. Similarly, policies may also impact how project financings actually get structured, affecting their term and debt-to-equity ratios. This financial structure premium can either add or subtract from the LCOE. Volatile revenue streams, wavering government support or unusable tax benefits may force developers to drive up the LCOE, while the provision of state-backed credit through development banks, loan guarantees or export credit agencies drives it down. The final LCOE on these charts represents the actual cost of generating power for each of these hypothetical projects. The right half of these charts then compares this with what governments or electricity consumers actually pay to buy the resulting clean energy. The tariff represents the actual amount that the project operating in that country could expect to receive for its power on a per-megawatt basis. This amount can be determined by a fixed feed-in tariff, an auction price or, in the case of the United States, a market price of electricity plus the value of federal tax credits, depreciation allowances and so on. The tariff premium indicates how much a government or electricity user has overpaid or underpaid for clean energy via its policy regime through tariffs alone. The total policy premium takes into account not just the impact of tariffs, but also the impact of other revenue streams.

35 Green Investing 2011
FigureFigureFigureFigure 22222222: : : : Hypothetical Hypothetical Hypothetical Hypothetical LCOE LCOE LCOE LCOE andandandand PPPPolicy olicy olicy olicy PPPPremium for remium for remium for remium for UUUUtilitytilitytilitytility----scale scale scale scale WWWWind ind ind ind PPPProject by roject by roject by roject by CCCCountryountryountryountry,,,, USUSUSUS$$$$////mWmWmWmWhhhh
Chart A: German feedChart A: German feedChart A: German feedChart A: German feed----in tariffin tariffin tariffin tariff (FiT)(FiT)(FiT)(FiT)
Comment: Long-term policies and state-backed revenues boost
investor confidence, reduce LCOE; feed-in tariff reacts too
slowly to recapture benefits and overpays.
Chart B: US production Chart B: US production Chart B: US production Chart B: US production tax credittax credittax credittax credit (PTC)(PTC)(PTC)(PTC)
Comment: No long-term policy and very costly financial
structures increase LCOE; competitive power purchase
agreements minimize excess returns.
Chart C: Chart C: Chart C: Chart C: ChinaChinaChinaChina FiT/FiT/FiT/FiT/subsidized loanssubsidized loanssubsidized loanssubsidized loans
Comment: Long-term policies and state-backed capital reduce
LCOE; aggressively low tariffs recapture some benefits and
reduce overpaying
Chart D: Chart D: Chart D: Chart D: Brazil 2010 tenderBrazil 2010 tenderBrazil 2010 tenderBrazil 2010 tenders s s s ++++ subsidized loanssubsidized loanssubsidized loanssubsidized loans
Comment: Risky tender process offset by state-backed credit
reduces LCOE; competitive tenders drive tariff possibly too low –
very low risk of overpaying
Note: Examples are for illustrative purposes only.
Source: Bloomberg New Energy Finance. Chart A: German Chart A: German Chart A: German Chart A: German FeedFeedFeedFeed----iiiin Tariffn Tariffn Tariffn Tariff Germany’s feed-in tariff enjoys long-term strong government support linked to overarching 2020 clean energy goals. The policy provides for projects a single predictable revenue stream that de-risks cash flows, reducing the equity risk premium required by project developers. The feed-in tariff also allows developers to take on high levels of debt and secure loans with longer tenors, bringing down the financial structure premium – and hence the final LCOE. However, it is notable that the feed-in tariff generally fails to recapture the savings it creates through lowering these costs of capital. Instead, electricity users pay a significant tariff premium. This suggests that the country’s feed-in tariff could continue to have the same positive impact on LCOE but result in less overpayment if the German government were to more aggressively scale back the generosity of the tariff in line with cost reductions in the market.
95
6 11
78
98
20 20
Base LCOE
Equity Risk
Premium
Financial Structure Premium
Final LCOE
Tariff Tariff Premium
Total Policy
Premium
65
723
95
030
66 (Power Sales)
29 (Tax Benefits)
Base LCOE Equity Risk Premium
Financial Structure Premium
Final LCOE Tariff Tariff Premium
Total Policy
Premium
79
56
6878
10 10
Base LCOE
Equity Risk
Premium
Financial Structure Premium
Final LCOE
Tariff Tariff Premium
Total Policy
Premium
77
7 4
8076
0
-4
Base LCOE
Equity Risk
Premium
Financial Structure Premium
Final LCOE
Tariff Tariff Premium
Total Policy
Premium

Green Investing 2011 36
Chart B: US Chart B: US Chart B: US Chart B: US Production Tax CreditProduction Tax CreditProduction Tax CreditProduction Tax Credit Although the United States has relatively recently enacted several new policies with the 2009 passage of the American Recovery and Reinvestment Act, the production tax credit was for some time the key driver of investment in wind in the country. It is a particularly instructive example of how policies can drive up the LCOE. The fact that the credit has typically been extended in one- or two-year increments and sometimes been allowed to lapse for months has added needless policy uncertainty in the United States. This, in turn, has driven up the equity risk premium. Next, the production tax credit provides a subsidy in the form of reducing the tax bill for an industry that, because of its capital-intensive nature, is already very tax-efficient. This forces developers to erect arcane financial “third-party tax equity” structures accessible only to a relatively small pool of investors. This contributes heavily to the country’s financial structure premium. The actual tariff paid to developers comes in two pieces. The first is from utilities via negotiated power purchase agreements – the actual sale of the power generated. The second comes in the form of the US$ 21/mWh production tax credit itself plus additional tax benefits via accelerated depreciation. Ultimately, the tariff paid roughly matches the LCOE as power purchase agreements are typically offered by very competitive tendering processes. However, the US system hardly makes efficient use of public funds. The production tax credit in some cases overpays for clean power by approximately US$ 30/mWh against a base case US LCOE of US$ 65/mWh. Most of this premium does not go to project developers to build new clean energy projects, but to a small group of third-party tax equity investors. Chart C: ChinaChart C: ChinaChart C: ChinaChart C: China’’’’s s s s FeedFeedFeedFeed----in Tariff/Subsidized Loansin Tariff/Subsidized Loansin Tariff/Subsidized Loansin Tariff/Subsidized Loans China has set wind energy as a cornerstone of its industrial policy and in 2010 a record-shattering 17gW of new wind capacity was installed in the country. General consensus among developers in the region is that the risk of China abandoning support for clean energy even for a short period of time is unlikely. Long-term support for the sector along with generous debt rates from state-owned banks bring down the final LCOE projects. Through a mix of very large project auctions and aggressively low feed-in tariffs, China has consistently set difficult price targets for developers to reach, forcing the value chain to drive down costs and squeeze margins. The LCOE covers 20+ years, however, and with most of China’s fleet less than five years old, the full quality ramifications of aggressive cost cutting remain to be seen. In terms of rolling out large amounts of capacity while holding down the policy premium paid by electricity users or taxpayers, China scores well. Chart D: Brazil 2010 Chart D: Brazil 2010 Chart D: Brazil 2010 Chart D: Brazil 2010 Tenders/Subsidized LoansTenders/Subsidized LoansTenders/Subsidized LoansTenders/Subsidized Loans Brazil has employed a series of auctions or tenders for local power contracts. These tenders set a fixed amount of available potential capacity and then invite project developers to “bid” in. Those projects offering the lowest priced energy are designated to sign agreements. By its very nature, the process is intended to use the forces of competition to discover the lowest prices at which contracts can be signed. But tenders do not in and of themselves drive down the actual fundamental cost of generation. In fact, the inconsistency of the tenders system and the pressure they place on developers to bid low actually raises the equity risk premium, in our view (by approximately US$ 7/mWh above the central scenario). But a separate factor helps to reduce the financial structure premium – discounted loans from development bank BNDES. These two factors nearly net out one another and result in a final LCOE of approximately US$ 80/mWh. The question then is whether Brazil’s centrally organized grid then overpays for the actual power compared with the cost of generating. In fact, under the tender system, Brazil may actually underpay compared to the LCOE, based on the results of the most recent tenders. This is because developers were so eager to sign contracts that, on average, they bid in below their actual LCOE. Many of the best projects will still be built and at a very attractive cost for ratepayers. The percentage completion of the projects in the first major tender should be very instructive for policy-makers.

Contributors
37 Green Investing 2011
AuthorsAuthorsAuthorsAuthors From Bloomberg New Energy Finance Michael LiebreichMichael LiebreichMichael LiebreichMichael Liebreich Chairman and Chief Executive Ethan ZindlerEthan ZindlerEthan ZindlerEthan Zindler Head of Policy Analysis Tyler TringasTyler TringasTyler TringasTyler Tringas Clean Energy Economics From the World Economic Forum Anuradha GurungAnuradha GurungAnuradha GurungAnuradha Gurung Associate Director, Investors Industries Max von BismarckMax von BismarckMax von BismarckMax von Bismarck Director and Head of Investors Industries We would like to thank Stephen Munro, Nicole Aspinall and Victoria Cumming at Bloomberg New Energy Finance and Kai
Bucher, Tik Keung, Kamal Kimaoui and Janet Hill at the World Economic Forum for their support in the preparation of this report.


The World Economic Forum is an independent
international organization committed to improving the
state of the world by engaging business, political,
academic and other leaders of society to shape global,
regional and industry agendas.
Incorporated as a not-for-profit foundation in 1971, and
headquartered in Geneva, Switzerland, the Forum is tied
to no political, partisan or national interests.
(www.weforum.org)