commission of silicon valley clean water joint …
TRANSCRIPT

COMMISSION OF SILICON VALLEY CLEAN WATER JOINT POWERS AUTHORITY
REGULAR MEETING – Monday, December 16, 2019 8:00 a.m.
Pelican Conference Room Silicon Valley Clean Water 1400 Radio Road, 2nd Floor Redwood City, California
COMMISSIONERS COUNCIL MEMBER ALICIA AGUIRRE, REDWOOD CITY – CHAIR BOARD MEMBER GEORGE OTTE, P.E., WEST BAY SANITARY DISTRICT – VICE CHAIR MAYOR MARK OLBERT, SAN CARLOS – SECRETARY COUNCIL MEMBER WARREN LIEBERMAN, PhD., BELMONT – MEMBER MANAGER: TERESA A. HERRERA ATTORNEY FOR THE AUTHORITY: CHRISTINE C. FITZGERALD CONTROLLER: KIMBRA MCCARTHY TREASURER: MATTHEW ANDERSON AMERICANS WITH DISABILITIES ACT In compliance with the Americans with Disabilities Act, if you need special assistance to participate in this meeting, please contact SVCW (650) 591-7121. Notification in advance of the meeting will enable the Authority to make reasonable arrangements to ensure accessibility to this meeting. AGENDA
1. CALL TO ORDER
2. ROLL CALL
3. PLEDGE OF ALLEGIANCE
4. PUBLIC COMMENT Any member of the public may address and ask questions of the Chair under this item relating to any matter within the Commission’s jurisdiction that does not appear as a separate item on the Agenda. An opportunity will be provided for members of the public to address the Chair and ask questions about any item that is listed on the agenda at the time the Commission considers the item and before action is taken. If you address the Commission on a non-agenda item, please be aware that the Ralph M. Brown Act (Gov. C. § 54950 et seq.)
Agenda Packet Page 1

prohibits the Commission from acting on or discussing such matters at this meeting. Any such item may be referred to staff for a decision with regard to placing it on a future agenda for discussion, action or a report.
5. SAFETY MOMENT and REPORTS A. Safety Moment B. Manager’s Report C. Financial Reports
1. Investment Report D. Engineering Projects Status Update E. Commission Requested Staff-Level Action Items F. RESCU Program Design-Build Project Status Update
6. MATTERS OF COMMISSION MEMBER’S INTEREST
A. Set 2020 Commission Meeting Calendar 7. CONSIDERATION OF MOTION APPROVING CONSENT CALENDAR
8. BUSINESS ITEMS
A. PRESENTATION ON RESCU PROGRAM STATUS INCLUDING POTENTIAL PROJECT
CHANGES Proposed Action: Receive PRESENTATION ON RESCU PROGRAM STATUS INCLUDING POTENTIAL PROJECT CHANGES
B. CONSIDERATION OF RESOLUTION APPROVING CONTRACT CHANGE ORDER TO THE
RESCU PROGRAM FRONT OF PLANT PROJECT (CIP #9502)
Proposed Action: Move adoption of RESOLUTION AUTHORIZING THE SILICON VALLEY CLEAN WATER MANAGER TO APPROVE CONTRACT CHANGE ORDERS FOR THE FRONT OF PLANT PROJECT IN AN AMOUNT NOT TO EXCEED $5,375,000.
9. CLOSED SESSION
A. CONFERENCE WITH REAL PROPERTY NEGOTIATORS Pursuant to Government Code Section 54956.8 Property Description: County of San Mateo (APN(s):095-220-140, 046-082-010, 046-
081-790, 046-081-580, 095-030-230) SVCW Negotiators: SVCW Manager, Teresa A. Herrera; SVCW Authority Engineer, Kim
Hackett
Agenda Packet Page 2
Negotiating Parties: County of San Mateo Under Negotiation: Price and terms
10. RECONVENE IN OPEN SESSION – Announce action taken in Closed Session, if any.
11. ADJOURN
Agenda Packet Page 3

CONSENT CALENDAR NOTICE TO PUBLIC
All matters listed under CONSENT CALENDAR are considered to be routine. There may be discussion on items on the CONSENT CALENDAR. All items will be enacted by one motion with a roll call vote unless members of the Commission, staff, or public request specific items be removed from the CONSENT CALENDAR for separate action. 7. A. APPROVAL OF MINUTES – November 18, 2019
B. CONSIDERATION OF MOTION APPROVING CLAIMS AND CHECKS DATED NOVEMBER 15,
2019, NOVEMBER 17, 2019, AND DECEMBER 2, 2019 AND NECESSARY PAYMENTS THROUGH DECEMBER 2, 2019
C. CONSIDERATION OF RESOLUTION APPROVING SILICON VALLEY CLEAN WATER STANDARD
CONTRACT DOCUMENTS, VERSIONS DECEMBER 2019. Proposed Action: Move adoption of RESOLUTION APPROVING SVCW’S STANDARD LONG-FORM STANDARD CONTRACT SPECIFICATIONS, SHORT-FORM STANDARD CONTRACT SPECIFICATIONS AND STANDARD PROCUREMENT CONTRACT DOCUMENTS - VERSIONS DECEMBER 2019
D. CONSIDERATION OF MOTION APPROVING CONTRACT CHANGE ORDER FOR SITE WASTE PUMP STATION UPGRADES
Proposed Action: Move approval of CONTRACT CHANGE ORDER FOR THICKENING IMPROVEMENTS PHASE 1 IN THE AMOUNT OF $150,000 AND AUTHORIZE MANAGER TO APPROVE UP TO TEN PERCENT CONTINGENCY FOR ADDITIONAL WORK ON AN AS-NEEDED BASIS – C. OVERAA CO.
E. CONSIDERATION OF MOTION APPROVING RECEIPT OF SILICON VALLEY CLEAN WATER BASIC FINANCIAL STATEMENTS AND AUDITOR’S REPORTS FOR FISCAL YEAR 2018-19 Proposed Action: Move approval of RECEIPT AND ACCEPTANCE OF BASIC FINANCIAL STATEMENTS AND INDEPENDENT AUDITORS' REPORT FOR YEAR ENDED JUNE 30, 2019
F. CONSIDERATION OF RESOLUTION APPROVING SALE OF REAL PROPERTY OWNED BY SILICON VALLEY CLEAN WATER
Agenda Packet Page 4

Proposed Action: Move adoption of RESOLUTION APPROVING SALE OF CERTAIN HEREIN DESCRIBED REAL PROPERTY AND AUTHORIZING EXECUTION OF ALL DOCUMENTS NECESSARY AND APPROPRIATE FOR SAID TRANSACTION (APN 057-133-010, -020, -030, -040, -050, -080)
Agenda Packet Page 5

This page intentionally left blank
Agenda Packet Page 6
Silicon Valley Clean Water DECEMBER 16, 2019
AGENDA ITEM 5A
Agenda Packet Page 7

This page intentionally left blank
Agenda Packet Page 8

Silicon Valley Clean Water AGENDA ITEM 5A DECEMBER 16, 2019
5A-1
SAFETY MOMENT
Tips to Protect Your Home from Theft During the Holidays Holiday Theft Theft overall tends to rise in the months of November and December. The best thing to do is to make sure you secure everything that you can. Lock up cars, trucks, and homes. Leave the Lights On Thieves usually don’t approach homes that appear to be occupied. Leave on outside lights at night (or set them with a timer) and when you leave the house during the day leave on some of the lights inside the home to give an appearance that someone is home. Package Delivery More and more people are purchasing gifts online and having them shipped to their home. With this trend, more people are having packages stolen right off their front porch. If you’re expecting packages, request signature confirmation or have a trusted neighbor hold on to it for you. Creative Disposal Creatively dispose of boxes and packaging in which your presents arrive. Try and break down boxes and other packages as to not let potential thieves know what wonderful gifts you and your family received. Social Media In today’s interconnected age, it’s important to be very careful about what you share on social media. Be careful about what you post and if you decide to share what gifts you received on social media, please make sure you don’t have your location tagged to the post. Travel If you’re traveling to visit family or going on a holiday vacation, wait until after your trip to post about it. Have a good friend or neighbor check on your house every couple of days to give you an update. Decorating and Lighting Make sure not to run extension cords through windows or garage doors. Just the littlest crack can expose a home to thieves.
Agenda Packet Page 9

This page intentionally left blank
Agenda Packet Page 10

Silicon Valley Clean Water DECEMBER 16, 2019
AGENDA ITEM 5B
Agenda Packet Page 11

This page intentionally left blank
Agenda Packet Page 12

Silicon Valley Clean Water AGENDA ITEM 5B DECEMBER 16, 2019
Recurring and Upcoming 2020 Commission Actions Updated for December 2019 Meeting
January
• Long Range Financial Plan• CIP Update (annual or biennial)• Local Limits Adoption
February
• Review Debt Policy• Review Investment Policy
March
Budget Workshop
April
Budget Adoption
May • Initiate Manager Performance
Evaluation
June
• Approve Resolution 77-6“Personnel Resolution”
• Perform Manager Evaluation
July
Commission Chair, Vice Chair, and Secretary Appointment
August
Conflict of Interest Update (Biennial; even-numbered years)
September
Review Reserve Funds Policy
October November December
• Commission Meetingschedule for following year
• Audited Financial Statements
- Recurring Commission Actions
- Upcoming Commission Actions
Agenda Packet Page 13

This page intentionally left blank
Agenda Packet Page 14

Silicon Valley Clean Water DECEMBER 16, 2019
AGENDA ITEM 5C
Agenda Packet Page 15

This page intentionally left blank
Agenda Packet Page 16

Silicon Valley Clean Water Authority
Cash & Investments Summary Report
November 30, 2019
Description Market Value
% of Total
Holdings Yield
Reserve Accounts
Operating Reserve* ‐ Securities 3,528,360$ 1.4% 1.82%
Operating Reserve ‐ Money Market Fund Balance 142,612 0.1% 1.54%
CIP Reserve* ‐ Securities 18,433,086 7.4% 1.99%
CIP Reserve ‐ Money Market Fund Balance 861,975 0.3% 1.54%
Stage 2 Capacity Reserve* ‐ Securities 12,509,117 5.0% 1.98%
Stage 2 Capacity Reserve ‐ Money Market Fund Balance 479,890 0.2% 1.54%
Total Market Value: Operating and Reserve Accounts 35,955,040$ 14.4% 1.95%
Total Accrued Interest: Operating and Reserve Accounts 169,603
GRAND TOTAL, OPERATING AND RESERVE ACCOUNTS 36,124,643$
Bond and Notes Accounts
Zions Bank (Trustee)
2018 Project Fund Account ‐ CAMP 20,628,838$ 8.2% 1.88%
2018 Revenue Account ‐ Cash 4,048 0.0% 1.27%
2018 Acquisition Account ‐ Euro for TBM Purchase 1,115,843 0.4%
2019A Project Fund Account* ‐ Securities 126,356,455 50.5% 1.71%
2019A Project Fund Account ‐ Money Market Fund 20,209,291 8.1% 1.32%
2019A Cap‐I Account* ‐ Securities 27,270,862 10.9% 1.67%
2019A Cap‐I Account ‐ Money Market Fund 258,745 0.1% 1.32%
Bank of New York (Trustee)
2009 Reserve Account ‐ Securities 44 0.0% 0.50%
2009 Revenue FD Account ‐ Money Market Fund 1 11 0.0% 0.46%
2014 Revenue Account 448 0.0% 1.72%
2014 Interest Account ‐ Money Market Fund 13 0.0% 1.80%
2014 Principal Account ‐ Money Market Fund 7 0.0% 1.81%
2014 COI Account ‐ Cash 2 0.0%
2015 Project Account ‐ Cash 2 0.0%
2015 Revenue Account 172 0.0% 1.65%
Total Market Value: Bond Proceeds Accounts 195,844,781$ 78.3% 1.67%
Accrued Interest: Bond Proceeds Accounts 797,516
Uninvested Operating Cash (including outstanding checks) 3,645,687 1.5%
Local Agency Investment Funds (LAIF) Balance 14,685,036 5.9% 2.10%
Total Cash & Investments 251,097,663$ 100.0% 1.71%
Matt Anderson, CPA
Chief Financial Officer / Assistant General Manager
* Monthly report of security transactions and interest available upon request
AGENDA ITEM 5C DECEMBER 16, 2019
Agenda Packet Page 17

6. The yields shown for securities portions of the operating and reserve accounts and the 2019A bond proceeds accounts are the yields
to maturity at cost.
7. The yield for LAIF is the average monthly effective yield. Source: https://www.treasurer.ca.gov/pmia‐laif/historical/avg_mn_ylds.asp
8. The yields shown for the PFM‐managed money market funds are the Yield to Maturity at Cost, and the Yield to Maturity at Market
sourced from the respective fund providers' statements. Yields for BNY‐managed funds are Market Yields sourced from the respective
fund providers' statements.
9. The yield shown for CAMP is the monthly distribution yield.
1. All operating fund accounts are in compliance with SVCW's Investment Policy, and all bond proceeds accounts are in compliance
with the relevant bond documents.
2. SVCW has adequate funding levels for more than six months of operations and claim payments, as referenced in CA Code Section
53646.
3. Market valuations for the Operating and Reserve accounts along with the 2018 and 2019A bond proceeds accounts are provided by
PFM Asset Management LLC (PFM). Generally, PFM’s market prices are derived from closing bid prices as of the last business day of the
month as supplied by ICE Data Services or Bloomberg. Where prices are not available from generally recognized sources the securities
are priced using a yield‐based matrix system to arrive at an estimated market value. Prices that fall between data points are
interpolated. Non‐negotiable FDIC‐insured bank certificates of deposit are priced at par. Although PFM believes the prices to be
reliable, the values of the securities do not always represent the prices at which the securities could have been bought or sold.
4. Market valuations for the 2009, 2014, and 2015 bond proceeds accounts are provided by Bank of New York Mellon.
5. In accordance with Generally Accepted Accounting Principles (GAAP), month‐end holdings and information are reported on a trade
date basis.
Agenda Packet Page 18

Silicon Valley Clean Water
Operating and Reserve Funds ‐ Sector Allocation & Compliance November 30, 2019
Security Type
Operating
Reserve
CIP
Reserve
Capacity
Reserve
Total Market
Value
% of Total
Portfollio
% Allowed
by Policy
In
Compliance
% Change vs.
Prior Month
U.S. Treasury 1,517,320$ 4,597,567$ 3,272,352$ 9,387,239$ 26.0% 100% (2.1%)
Federal Agency/GSE 1,633,599 6,357,996 4,182,756 12,174,351 33.7% 100% (9.9%)
Federal Agency CMO ‐ 1,685,560 1,034,248 2,719,808 7.5% 100% 1.7%
Federal Agency MBS 3,360 1,528,775 1,130,984 2,663,118 7.4% 100% 5.9%
Municipal ‐ 99,730 99,730 199,460 0.6% 100% (0.0%)
Corporate Notes 374,081 4,163,458 2,789,047 7,326,586 20.3% 30% 2.2%
Securities Sub‐Total 3,528,360 18,433,086 12,509,117 34,470,563 95.4%
Accrued Interest 12,852 97,334 59,417 169,603 0.5%
Securities Total 3,541,212 18,530,420 12,568,533 34,640,166 95.9%
Money Market Fund 142,612 861,975 479,890 1,484,477 4.1% 20% 2.1%
Total Investments 3,683,824$ 19,392,396$ 13,048,423$ 36,124,643$ 100% 0.0%
As % of 6/30/20 Target: 101.57% 99.52% 100.00% 99.90%
Agenda Packet Page 19

This page intentionally left blank
Agenda Packet Page 20

Silicon Valley Clean Water DECEMBER 16, 2019
AGENDA ITEM 5D
Agenda Packet Page 21

This page intentionally left blank
Agenda Packet Page 22

Silicon Valley Clean Water AGENDA ITEM 5D DECEMBER 16, 2019
Report By: __K.H._ 5D-1
ENGINEERING REPORT: NOVEMBER 2019 CAPITAL IMPROVEMENT PROGRAM
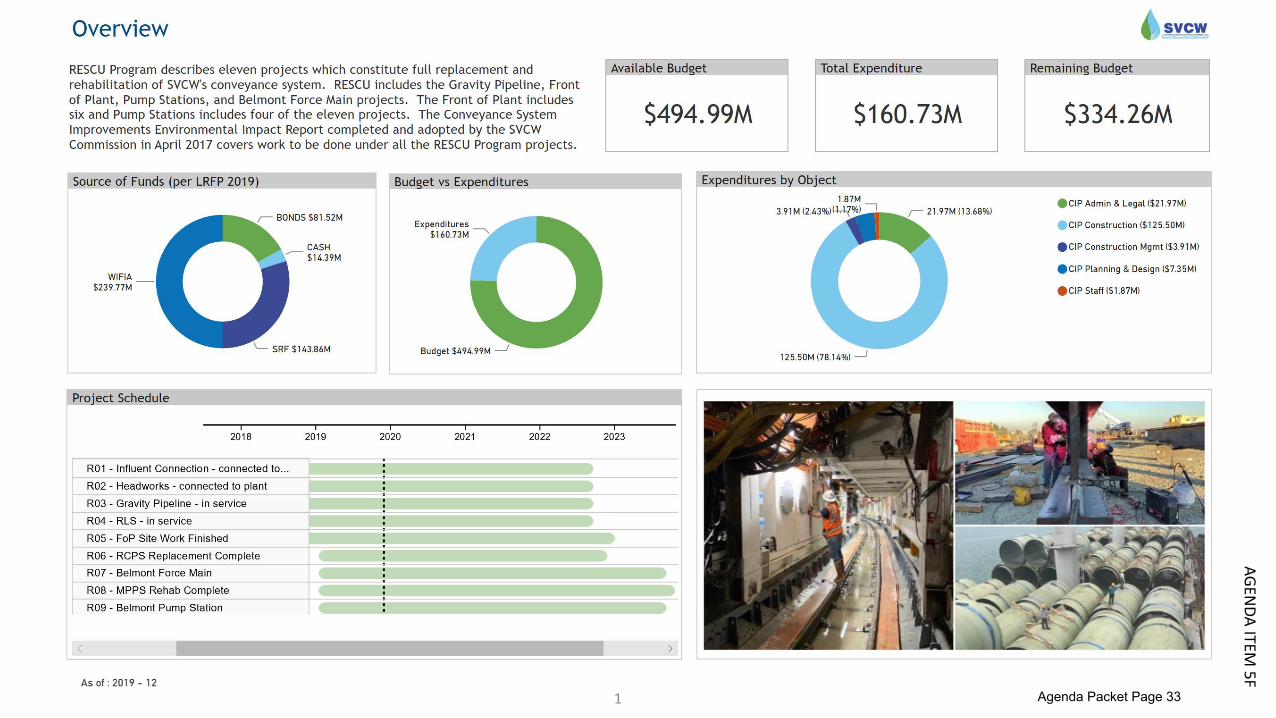
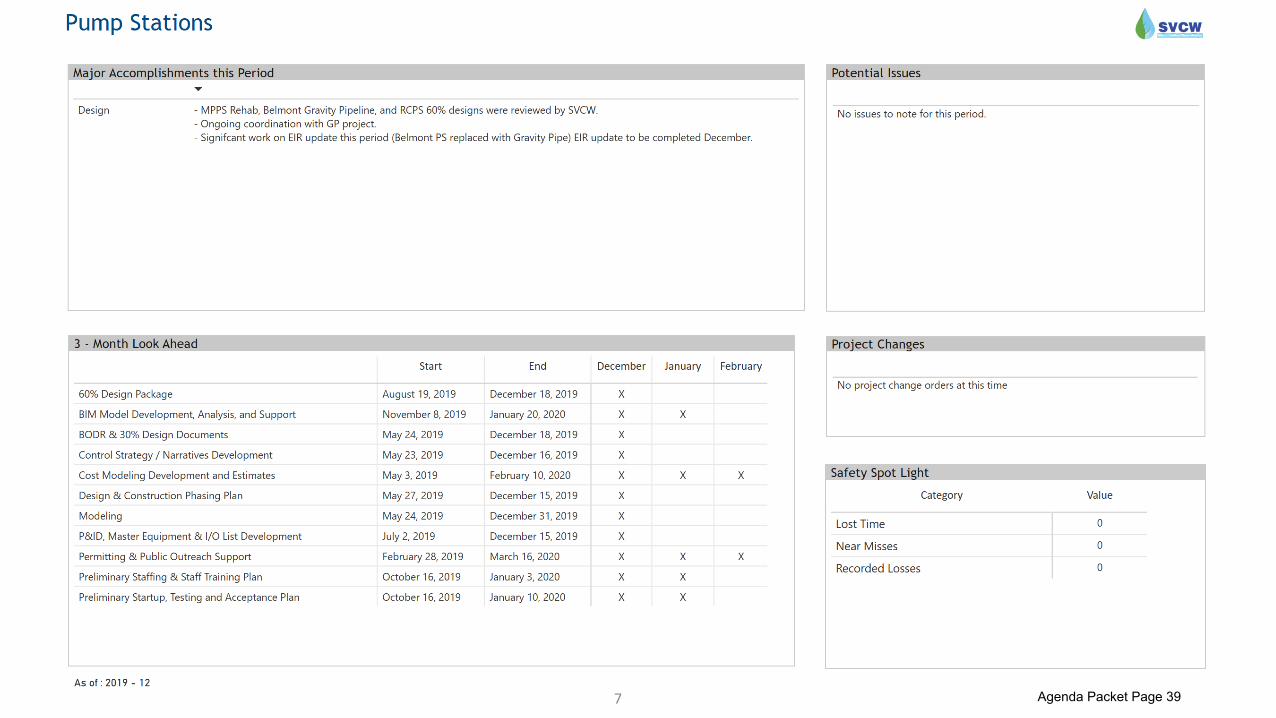
RESCU Program (6008, 9501, 9502): Design and construct conveyance system improvements.
SVCW has awarded progressive design build contracts to Barnard Bessac Joint Venture for the Gravity Pipeline (GP) Project and Shea Parsons Joint Venture for the Front of Plant (FoP) and Pump Stations Improvements (PSI) Projects. These projects are in varying states of design and construction. SVCW staff is tracking potential changes to the work to assure that they are completed within budget.
As reported at the May 2019 Commission meeting, the Bay Area Air Quality Management District’s permit requirements required a change in odor control technology that will result in higher project costs. The impact of this change has been determined. A change order will include these and other project changes and brought to the Commission in December.
Additionally, the Gravity Pipeline Project has experienced increased costs due to tariffs that have been announced or increased since the construction amendment was executed. An amendment will be forthcoming to account for those costs.
Planned Commission Actions: Receive Report on RESCU Program Status – December 2019
Approve Contract Change Order to FoP for Odor Control System – December 2019
Approve Contract Change Order for New Tariffs –
January 2019
Capital Improvement Program Update: Annual Update to the CIP
The CIP is a living document and is updated approximately every year. The last update was adopted by the Commission in November 2018. An update to the CIP is being prepared and will be presented to the Commission in conjunction with the annual Long-Range Financial Plan which is presented to the Commission and available for member agencies uses in January of each year.
Planned Commission Actions: Adopt 2020 CIP Update – January 2020
Thickening Improvements – Phase 1 (9168): Procure and install two rotary drum thickeners to thicken primary sludge.
At the March 2017 meeting, the Commission authorized purchase of two rotary drum thickeners to replace the Gravity Thickeners which are well beyond their useful lives.
Agenda Packet Page 23

5D-2
The rotary drum thickeners will thicken primary sludge before it enters the digesters and will be used for future recuperative thickening of the digester contents to improve digester volatile solids destruction resulting in increased digester gas production. In September 2017 Overaa Construction was awarded the construction contract to install the thickeners.
During the commissioning of the project, it has become clear that the facility’s site waste pumps are unable to handle the additional flow of material from the new rotary drum thickeners, requiring replacement of the pumps.
Planned Commission Actions: Approve Contract Change Order for Site Waste Pumps Installation – December 2019
Agenda Packet Page 24
Agenda Packet Page 25

This page intentionally left blank
Agenda Packet Page 26

Silicon Valley Clean Water DECEMBER 16, 2019
AGENDA ITEM 5E
Agenda Packet Page 27

This page intentionally left blank
Agenda Packet Page 28

Silicon Valley Clean Water DECEMBER 16, 2019Commissioners' Requested Action Items AGENDA ITEM 5EUpdated: 12/10/2019
Status
Ongoing In Progress Complete
11/18/2019 1 Data reporting solutions associated with ERP N/A ✓ Consider use of Tableau software as opposed to the proposed Power BI
2 Investment Policy 1/13/2020 ✓ Item tabled pending further discussion between SVCW and member agency staff. Will bring to January 2020 meeting.
3 Investment Report 12/16/2019 ✓ 12/10/2019Operating and Reserve Funds Sector Allocations table: Add total % change vs prior month to summary
4 County Easement 12/16/2019 ✓ 12/10/2019 Add item for discussion under Closed Session
5 Reserve Policy 12/16/2019 ✓ 12/10/2019Add escalator to reserves annual contributions; will use ENR Construction Cost Index for S.F. Bay Area December of each year
10/21/2019 1 Research video recording meetings N/A ✓ Reach out to Menlo Park FD and Town of Atherton regarding video recording meetings.
2 Change information on financial reports and RESCU updates N/A ✓ 11/18/2019On financial reserves report, add comparison of reserves collected to policy targets. On RESCU report, add information on change orders issued on projects.
9/16/2019 1 Research viability of videoing meetings 10/21/2019 ✓ 10/21/2019An agenda item was added to the agenda and discussion ensued. Further research was requested.
2 Review necessity for roll call vote on agenda items 10/21/2019 ✓ 9/18/2019 Roll call votes are not necessary.
8/19/2019 1 Nepotism and Fraternization Policy 9/16/2019 ✓ 9/5/2019Review member agencies' policies and compare with proposed. Item was brought back to Commission in September.
2 Recycled Water Facilities N/A ✓ 8/23/2019Review payment for facilities repair with RWC. Per the agreement, repairs are RWC's responsibility.
7/15/2019 1 No new items at this meeting
6/17/2019 1 No new items at this meetingDirection provided to Counsel and staff re: closed session items only
5/20/2019 1 Send Updated Agenda Item 5E ✓ 5/20/2019The incorrect version was included in the agenda packet. A corrected version was emailed to Commissioners on 5/20/19.
2 Days Since Last Incident Sign - Pelican Board Room ✓ 7/15/2019 The sign is on display in Pelican Room
Commission Meeting Date
Action ItemRequested or
Estimated Date for Completion
Date of Completion Notes
Agenda Packet Page 29

Silicon Valley Clean Water DECEMBER 16, 2019Commissioners' Requested Action Items AGENDA ITEM 5EUpdated: 12/10/2019
Status
Ongoing In Progress Complete
Commission Meeting Date
Action ItemRequested or
Estimated Date for Completion
Date of Completion Notes
4/15/2019 1 Maple Street Development N/A ✓ SVCW and RWC staff coordinating efforts and messages to developer to protect mutual and exclusive interests.
3/18/2019 1 Emergency Declaration 4/15/2019 ✓ 4/10/2019 Ratified emergency declaration at April meeting
2/25/2019 No new items at this meetingDirection provided to Counsel and staff re: closed session items only
1/28/2019 No new items at this meeting
12/6/2018 1Private property easements: keep Commission apprised if/when impasse during easement negotiations
2/25/2019 ✓ 6/28/2019Easements for the two private property owners have been obtained without need for eminent domain.
> One Year 1 8E - JPA Amendment; re-initiate "clean up" to JPA N/A ✓Make required and requested changes to the JPA a priority. Comments received; Manager to begin working on consolidation.
2When SVCW can begin exporting power to grid, make public for positive public relations standpoint
N/A ✓
While the 12kV switchgear is ready to export power, the contract with P.G.&E. and documentation with CA Energy Commission will not be complete until April 2020. Public notice will be prepared and distributed when appropriate.
3 Project delay costs N/A ✓ OngoingInform Commission of any potential delays that could add time and costs to projects they have authorized.
4 Connection Fees NA ✓Additional plant capacity evaluation is underway to ensure proper flow numbers are used in the calculations. Will be incorporated into upcoming JPA changes.
Agenda Packet Page 30

Silicon Valley Clean Water DECEMBER 16, 2019
AGENDA ITEM 5F
Agenda Packet Page 31

This page intentionally left blank
Agenda Packet Page 32
1
AG
END
A ITEM
5F
Agenda Packet Page 33

2 Agenda Packet Page 34

3 Agenda Packet Page 35

4 Agenda Packet Page 36

5 Agenda Packet Page 37

6 Agenda Packet Page 38
7 Agenda Packet Page 39

This page intentionally left blank
Agenda Packet Page 40

Silicon Valley Clean Water DECEMBER 16, 2019
AGENDA ITEM 6A
Agenda Packet Page 41

This page intentionally left blank
Agenda Packet Page 42

Silicon Valley Clean Water AGENDA ITEM 6A DECEMBER 16, 2019
6A-1
Memorandum Commission Meeting Dates for Calendar Year 2020
The following are the scheduled Commission Meeting dates for calendar year 2020. Regular Commission Meetings are held on the third Monday of each month at 8:00 a.m. Please review the dates below and be prepared to discuss any needed changes at the Commission meeting of December 16, 2019.
January 13 (proposed)
February 10 (proposed) or February 24
March 16, 2020
April 20, 2020
May 18, 2020
June 15, 2020
July 20, 2020
August 17, 2020
September 21, 2020
October 19, 2020
November 16, 2020
December 21, 2020
Agenda Packet Page 43

This page intentionally left blank
Agenda Packet Page 44

Silicon Valley Clean Water DECEMBER 16, 2019
AGENDA ITEM 7A
Agenda Packet Page 45

This page intentionally left blank
Agenda Packet Page 46

Silicon Valley Clean Water AGENDA ITEM 7A DECEMBER 16, 2019
MINUTES OF SILICON VALLEY CLEAN WATER
REGULAR MEETING – November 18, 2019 8:00 a.m.
ITEM 1 CALL TO ORDER The meeting was called to order at 8:00 a.m. ITEM 2 ROLL CALL - Commissioners Duly Appointed by Each Agency
Council Member Alicia Aguirre, Redwood City - Chair Board Member George Otte, P.E., West Bay Sanitary District – Vice Chair Mayor Mark Olbert, San Carlos – Secretary Council Member Warren Lieberman, PhD., Belmont
Staff, Consultants and Visitors Present
Teresa A. Herrera, SVCW Manager Christine C. Fitzgerald, SVCW Legal Counsel Matt Anderson, SVCW Chief Financial Officer/Assistant Manager Kim Hackett, SVCW Authority Engineer Arvind Akela, SVCW Engineering Director Jessica Mangual, SVCW Secretary Pro Tem Eric Hansen, SVCW EJ Shalaby, DNS Bill Tanner, Tanner Pacific Mark Minkowski, Kennedy/Jenks Derek Rampone, City of Redwood City Leslie Murphy, PFM Asset Management Jim Lewis, member of the public
ITEM 3 PLEDGE OF ALLEGIANCE The Pledge of Allegiance was recited by those in attendance. ITEM 4 PUBLIC COMMENT Mr. Jim Lewis, a member of the public, thanked the Commissioners and SVCW staff members for all their work over the last five years.
Agenda Packet Page 47

7A-2
ITEM 5A THROUGH 5F SAFETY MOMENT AND REPORTS This month’s Safety Moment provided tips for storing, buying, and cooking turkeys as well as storing leftovers. The Manager’s Report included a reminder about the SVCW Holiday Potluck Luncheon on Wednesday, December 11th. A description of bioassays was provided to the Commissioners; bioassays are a permit requirement, are performed once a month and last for a week. Fish are placed into tanks with plant effluent and a control and 100% survival rate is required. A bioassay just completed with 100% survival rate. The Financial Reports were then given by Mr. Anderson after which he along with Ms. Herrera responded to Commissioners’ questions. For the Engineering Projects Status Update and Commission Requested Staff Level Action Items, there were no verbal reports. For the RESCU Program Update, information related to contract change orders was added. ITEM 6 MATTERS OF COMMISSION MEMBER’S INTEREST There were no comments. ITEM 7 CONSIDERATION OF MOTION APPROVING CONSENT CALENDAR ITEMS Items 7C and 7D were pulled for questions and clarifications. A. APPROVAL OF MINUTES – October 21, 2019
B. CONSIDERATION OF MOTION APPROVING CLAIMS AND CHECKS DATED
OCTOBER 18. 2019 AND NOVEMBER 1, 2019, AND NECESSARY PAYMENTS THROUGH NOVEMBER 1, 2019
Motion/Second: Mr. Olbert / Mr. Otte on Items 7A and 7B The Motion carried by Unanimous Vote
C. CONSIDERATION OF MOTION APPROVING TASK ORDER SCOPE AND
BUDGET FOR NEXINITE DATA DEVELOPMENT AND REPORTING FOR SVCW’S ENTERPRISE RESOURCE PLANNING (ERP) SOFTWARE (CIP #9105)
Agenda Packet Page 48
7A-3
Proposed Action: Move approval of TASK ORDER SCOPE OF WORK AND BUDGET FOR DATA AND REPORTING SOLUTIONS ASSOCIATED WITH THE ENTERPRISE RESOURCE PLANNING (ERP) SOFTWARE PROJECT (CIP #9105) IN THE AMOUNT NOT TO EXCEED $173,350 AND AUTHORIZE MANAGER TO APPROVE UP TO TEN PERCENT (10%) CONTINGENCY FOR ADDITIONAL WORK ON AN AS-NEEDED BASIS – NEXINITE LLC The Commission asked if other software solutions besides Power BI were evaluated. The proposed action was modified to authorize staff to review other software solutions, specifically, Tableau, within the same budgetary authorization.
Motion/Second: Mr. Olbert / Mr. Lieberman The amended Motion carried by Unanimous Vote D. CONSIDERATION OF RESOLUTION APPROVING CONTRACTS FOR
CONSTRUCTION OF SAF-MBR RESEARCH FACILITY INFRASTRUCTURE (CIP #9236) Proposed Action: Move adoption of RESOLUTION APPROVING CONTRACTS FOR CONSTRUCTION OF INFRASTRUCTURE IMPROVEMENTS FOR THE SAF-MBR PILOT RESEARCH PROJECT WITHOUT COMPETITIVE BIDDING FINDING THAT COMPETITIVE BIDDING WOULD BE UNAVAILING, WOULD NOT PRODUCE AN ADVANTAGE AND WOULD NOT BE IN THE PUBLIC INTEREST AND AUTHORIZING SVCW MANAGER TO APPROVE CONSTRUCTION CONTRACT CHANGE ORDERS UP TO TEN PERCENT (10%) OF THE CONTRACT PRICE – SHEA PARSONS JOINT VENTURE ($140,000) AND MORROW MEADOWS ($140,000) The Commission requested clarification on the policy under which staff makes a determination of the need to publicly bid a project. The Manager and Legal Counsel responded to the Commissioner’s question.
Motion/Second: Mr. Otte / Mr. Lieberman The Motion carried with 3 ayes and 1 nay; Commissioner Olbert opposing. ITEM 8A CONSIDERATION OF RESOLUTION APPROVING UPDATE TO SILICON VALLEY CLEAN WATER INVESTMENT POLICY AND GUIDELINES Proposed Action: Move adoption of RESOLUTION APPROVING AND ADOPTING REVISION “S” TO ADMINISTRATIVE POLICY 1992-01 ESTABLISHING SILICON VALLEY CLEAN WATER’S INVESTMENT POLICY AND GUIDELINES
Agenda Packet Page 49

7A-4
After discussion, Agenda Item 8A was tabled until the December Meeting. ITEM 8B CONSIDERATION OF RESOLUTION APPROVING UPDATE TO SILICON VALLEY CLEAN WATER RESERVE FUND POLICY AND PROCEDURES Proposed Action: Move adoption of RESOLUTION APPROVING AND ADOPTING REVISION “D” TO ADMINISTRATIVE POLICY 2013-03, “SVCW RESERVE FUND POLICY AND PROCEDURES” The Commission asked several questions related to where the reserve funds should reside and inclusion of an annual escalator to the reserve amounts. After discussion, a motion was made with a revision to the proposed action including an annual escalator to the recommended reserve amounts. Motion/Second: Ms. Aguirre / Mr. Otte The Motion carried with 3 ayes and 1 nay; Commissioner Olbert opposing. ITEM 8C CONSIDERATION OF RESOLUTION DECLARING EXISTENCE OF AN EMERGENCY CONDITION AND APPROVING REPAIR OF ESSENTIAL FACILITIES (DMF FEED PIPE) Proposed Action: Move adoption of RESOLUTION DECLARING EXISTENCE OF EMERGENCY CONDITION REQUIRING IMMEDIATE EXPENDITURE OF FUNDS IN FURTHERANCE OF PUBLIC HEALTH, WELFARE AND SAFETY AND APPROVING AND RATIFYING EXECUTION OF CONTRACTS FOR REPAIR OF ESSENTIAL PUBLIC FACILITIES RELATING THERETO (DMF FEED PIPE) (4/5th weighted vote required) Motion/Second: Mr. Olbert / Mr. Lieberman The Motion carried by Unanimous Vote ITEM 9A THROUGH 9D CLOSED SESSION Closed Session was called to order at 9:43 a.m. ITEM 10 RECONVENE FROM CLOSED SESSION Open Session reconvened at 10:11 a.m.
Agenda Packet Page 50

7A-5
Ms. Fitzgerald reported as to Agenda Items 9A through 9D no reportable action was taken and direction was given to staff. ITEM 11 ADJOURN There being no further business, the meeting adjourned at 10:12 a.m. Minutes prepared by Teresa A. Herrera Reviewed by General Counsel _______________________________ Mark Olbert, Secretary
Agenda Packet Page 51

This page intentionally left blank
Agenda Packet Page 52

Silicon Valley Clean Water DECEMBER 16, 2019
AGENDA ITEM 7B
Agenda Packet Page 53

This page intentionally left blank
Agenda Packet Page 54

Silicon Valley Clean Water AGENDA ITEM 7B DECEMBER 16, 2019
7B-1
SVCW WARRANT REGISTER
SVCW Warrant Register dated November 5, 2019 – November 18, 2019 and November 19, 2019 – December 2, 2019, were scanned and a copy was emailed to Commissioners and Legal Counsel on December 9, 2019.
Agenda Packet Page 55

This page intentionally left blank
Agenda Packet Page 56

Silicon Valley Clean Water DECEMBER 16, 2019
AGENDA ITEM 7C
Agenda Packet Page 57

This page intentionally left blank
Agenda Packet Page 58

Silicon Valley Clean Water AGENDA ITEM 7C DECEMBER 16, 2019
Report By: __K.H.__ 7C-1
APPROVE UPDATED SVCW STANDARD CONTRACT DOCUMENTS ISSUE Approve Silicon Valley Clean Water Standard Contract Documents, Versions December 2019 BACKGROUND Construction projects are carried out by completing a set of specifications and plans (collectively, “Contract Documents”) that spell out, via words and drawings, what is involved in the construction project and what work the construction contractor agrees to perform. There is an industry-standard for the method in which Contract Documents are organized. They are comprised of three main sections: Standard Contract Specifications, Technical Specifications, and Drawings. Standard Contract Specifications are designated as Divisions 0 and 1. Technical Specifications are designated as Divisions 2 through 16 with each Division pertinent to different areas of construction (for example, Division 3 covers concrete while Division 16 covers electrical work). The Standard Contract Specifications primarily contain standard contractual requirements with the majority of the language constant from project to project. Technical Specifications and Drawings are unique to each project and vary accordingly. Typically, a public agency owns and prepares the Standard Contract Specifications, while the Technical Specifications and Drawings are prepared by the project’s Engineer-of-Record. It is industry standard for the contracting agency to “own” the Standard Contract Specifications and SVCW has owned its Standard Contract Specifications since the inception of the Capital Improvement Program in 2008. They are updated approximately annually by a consultant for SVCW who keeps apprised of pertinent changes in law, regulations, and insurance industry recommendations. Changes are reviewed by SVCW’s insurance provider and Legal Counsel, as necessary. The last update to SVCW’s standard contract specifications was made in November 2018. In August 2008 and approximately once per year since, the Commission has approved the Standard Contract Specifications allowing SVCW construction projects to be let out to bid and subsequent action by the Commission approving the specific Contract Documents when the project construction contract is awarded. There are two forms of contract specifications used by SVCW for construction: “Long-Form” and “Short-Form". Long-form Standard Contract Specifications are used for projects that are publicly advertised for bidding and over $100,000 in anticipated contract value. Short-Form Standard Contract Specifications are used for projects having an anticipated construction value under $100,000. For construction projects under $100,000 SVCW generally solicits quotes from three contractors rather than publicly bidding the work. The projects are then awarded at the lowest quoted price. This process is allowed under the Public Contracts Code and SVCW’s Purchasing Guidelines, and preferred, as the process to produce drawings and specifications for publicly bid projects can be prohibitive for projects of this small size.
Agenda Packet Page 59

7C-2
In addition to construction contracts, SVCW uses standard form specifications for procurement of equipment (Procurement Contract). Procurement covers items such as direct purchase of pumps, valves, and other equipment and involves no construction or installation. This occurs when construction or installation would be done by SVCW staff or via a separate construction contract with a general contractor. Updates to all of SVCW’s Standard Specifications have just been completed and are ready for Commission approval. DISCUSSION Updates to the Long-Form and Short-Form Standard Contract Specifications and Procurement Contract have been prepared and staff recommends the Commission approve the revised versions effective December 2019. Changes to each are depicted in the table below:
Standard Contract
Specifications
Affected Section
Change
Long Form Section 00010 – Notice Inviting Bids
Clarify that bids are subject to disclosure under the California Public Records Act
Section 00430 – Designation of Subcontractors
Clarify requirements for listing subcontractors
Section 01010 – Summary of Work
Clarify interaction with O&M for system outage request procedures during construction
Short Form Same as above All changes proposed in Long Form Throughout Change “bid” to “quotation” Procurement Section 00300 –
Proposal Update sales tax amount
Staff recommends that the Commission approve the revised Standard Long-Form, Short-Form, and Procurement Contract Documents effective December 2019. FINANCIAL IMPACTS There are no direct financial impacts from this action. RECOMMENDATION Move adoption of RESOLUTION APPROVING SVCW’S STANDARD LONG-FORM STANDARD CONTRACT SPECIFICATIONS, SHORT-FORM STANDARD CONTRACT SPECIFICATIONS AND STANDARD PROCUREMENT CONTRACT DOCUMENTS - VERSIONS DECEMBER 2019
Agenda Packet Page 60

Silicon Valley Clean Water DECEMBER 16, 2019
AGENDA ITEM 7D
Agenda Packet Page 61

This page intentionally left blank
Agenda Packet Page 62

Silicon Valley Clean Water AGENDA ITEM 7D DECEMBER 16, 2019
Report By: __K.H.__ 7D-1
THICKENING IMPROVEMENTS – PHASE 1 PROJECT
APPROVE CHANGE ORDER FOR SITE WASTE PUMP STATION UPGRADES ISSUE Approval of Contract Change Order for Site Waste Pump Station Upgrades BACKGROUND Silicon Valley Clean Water’s wastewater treatment processes can be categorized as solids treatment and liquids treatment. Most of the solids treatment processes are located inside the Solids Handling Building (SHB), a three-story building on the east side of the treatment plant. Solids processing includes pre- and post-digested sludge mixing and pumping, solids dewatering, and grit removal from primary sludge. The Thickening Improvements – Phase 1 Project was awarded to C. Overaa & Co. (Overaa) in September 2017. The main element of the project included installing rotary drum thickeners (RDTs) in the basement of the SHB. These RDTs replaced the Gravity Thickeners, which were at risk of failing. The entire SHB is outfitted with floor and process drains which collect all liquids; this includes washdown water and liquids from all the solids processes. All drains lead to a concrete pit in the SHB basement called the Site Waste Pump Station. From here, all liquid is pumped back to the plant influent where it enters the liquid treatment process. The Thickening Improvements – Phase 1 Construction Contract included improvements to the Site Waste Pump Station. DISCUSSION Addition of the RDTs has put strain on the existing Site Waste Pump Station due to increased loads and the nature of the discharged liquid. To thicken solids, a polymer is added to the sludge as it goes through a mechanical process to remove water. The process reduces the water in primary sludge by approximately 7% (going into the RDT, solids are approximately 1% and after thickening are approximately 7-8%). Water removed from the sludge is a high concentration liquid waste that includes some of the added polymer. The Site Waste Pump Station has three 10 horsepower pumps. With increased loads and additional polymer in the system due to the recently installed RDT, the site waste pumps have been unable to pump the flow. The new characteristics of the site waste liquids requires a different style of pumps that can handle additional flow and floatables created by RDT filtrate. SVCW staff worked with more than half-a-dozen pump manufacturers and found three pumps that will perform the necessary pumping. Staff obtained competitive quotes from the three shortlisted manufacturers and purchased the lowest price pumps that met the performance requirements. SVCW engineering staff, with assistance from Kennedy/Jenks consulting engineers, then developed the necessary mechanical and electrical changes required to install the new
Agenda Packet Page 63

7D-2
pumps. Overaa was asked to provide a quote for the work, and two other contractors were also asked to provide quotes in order to verify that SVCW was receiving good pricing. A summary of quotes for the work is provided below:
SPJV did not provide quote C. Overaa Construction $150,000.00 D.W. Nicholson $197,600.00
SVCW recommends approval of a Contract Change Order to the Thickening Improvements – Phase 1 project in the amount of $150,000 for replacement of the Site Waste Pumps. FINANCIAL IMPACT Funding for this effort is included in SVCW’s annual Capital Budget, Project #300. The allocated capital budget for project #300 is $300,000 of which $66,000 was expended for the pre-purchased pumps. RECOMMENDATION Move approval of CONTRACT CHANGE ORDER FOR THICKENING IMPROVEMENTS PHASE 1 IN THE AMOUNT OF $150,000 AND AUTHORIZE MANAGER TO APPROVE UP TO TEN PERCENT CONTINGENCY FOR ADDITIONAL WORK ON AN AS-NEEDED BASIS – C. OVERAA CO.
Agenda Packet Page 64

Silicon Valley Clean Water DECEMBER 16, 2019
AGENDA ITEM 7E
Agenda Packet Page 65

This page intentionally left blank
Agenda Packet Page 66

Silicon Valley Clean Water AGENDA ITEM 7E DECEMBER 16, 2019
Report By: M.A. _ 7E-1
ANNUAL AUDITED FINANCIAL REPORT AS OF JUNE 30, 2019 ISSUE Receipt of Silicon Valley Clean Water (SVCW) Basic Financial Statements and Auditor’s Reports for Fiscal Year 2018-19 BACKGROUND Each year, in compliance with Government Accounting Standards Board requirements, SVCW issues basic financial statements and an auditor’s report. The auditor’s report (Attachment A, including a memo on internal controls and other required communications) is complete and ready for the Commission’s receipt. It provides detailed financial information for the Commission, ratepayers, and SVCW investors. This fiscal year SVCW retained a new accounting firm, Maze & Associates, LLP. Maze & Associates concluded its audit of SVCW’s financial statement with an unqualified (“clean”) opinion. DISCUSSION A summary of SVCW’s Statement of Net Position is below, showing a $25.1 million increase in SVCW’s net position during the fiscal year. Significant changes included:
• Current Assets decreased by $76.3 million (48.8%) as cash was spent on construction during the year. This decline in current assets was net of receiving $17 million from members for capital projects.
• Restricted assets marginally increased $130.2 thousand (1.7%) from the prior year-end balance of $7.7 million as SVCW set aside additional reserves for State Revolving Fund loans.
• Capital assets, net of depreciation, increased by $108.3 million (38.2%) as significant construction activity on the Regional Environmental Sewer Upgrade (RESCU) program continued.
• Total SVCW liabilities increased by $6.3 million (1.7%) as SVCW withheld $6.1 million for construction retention. Other activity associated with liabilities included a reduction in long-term debt liabilities after payments, offset by increased accounts payable for construction.
• Deferred Outflows and Deferred Inflows represent changes in the components of the Authority’s pension liability. The most significant change in deferred inflows and outflows was the impact of CalPERS’ changed assumptions and earnings.
Agenda Packet Page 67

7E-2
The Statement of Activities and Changes in Net Position (Table below) addresses the nature and source of changes during the fiscal year. Total 2018-19 revenues increased from the prior year by $27.8 million (60.7%), of which Operating Revenues increased by $23.7 million (52.6%) and reflects increased contributions for debt service. Non-operating Revenues increased $4.1 million as interest income was earned on a higher balance of bond proceeds. Fiscal year 2018-19 total expenses increased by $4.6 million (10.5%) over the prior year, which included:
• Depreciation expense increased $150.3 thousand (1.7%) after new capital projects were placed into service during the year.
• Operating expenses were $2 million (8.5%) more than the prior year, primarily related to filling personnel vacancies and settlement of a claim.
• Non-operating expenses increased by $2.4 million, reflecting increased interest expense for additional long-term debt.
Fiscal Year Fiscal Year $ Higher / % Higher / 2019 2018 (Lower) (Lower)
Current and other assets 80,094,833$ 156,442,864$ (76,348,031)$ (48.8%) Restricted assets 7,823,426 7,693,222 130,204 1.7% Capital assets 391,416,119 283,126,844 108,289,275 38.2%
Total Assets 479,334,378 447,262,930 32,071,448 7.2%
Deferred Outflows 5,611,134 6,236,059 (624,925) (10.0%)
Total Liabilities 378,937,205 372,589,353 6,347,852 1.7%
Deferred Inflows 1,246,858 1,243,778 3,080 0.2%
Net investment in capital assets 87,049,556 61,254,055 25,795,501 42.1% Restricted 7,823,426 7,693,222 130,204 1.7% Unrestricted 9,888,467 10,718,581 (830,114) (7.7%) Total Net Position 104,761,449$ 79,665,858$ 25,095,591$ 31.5%
Condensed Statement of Net Position
Agenda Packet Page 68

7E-3
FINANCIAL IMPACT There is no financial impact associated with this report RECOMMENDATION Move approval of RECEIPT AND ACCEPTANCE OF BASIC FINANCIAL STATEMENTS AND INDEPENDENT AUDITORS' REPORT FOR YEAR ENDED JUNE 30, 2019
Fiscal Year Fiscal Year $ Higher / % Higher /2019 2018 (Lower) (Lower)
Operating revenues 68,827,874$ 45,091,922$ 23,735,952$ 52.6% Non-operating revenues 4,797,281 730,108 4,067,173 557.1% Capital Contributions - - - -
Total Revenues 73,625,155 45,822,030 27,803,125 60.7%
Depreciation expense 8,986,961 8,836,703 150,258 1.7% Operating expense 26,215,903 24,169,268 2,046,635 8.5% Non-operating expense 13,579,021 11,142,216 2,436,805 21.9%
Total Expenses 48,781,885 44,148,187 4,633,698 10.5%
Changes in Net Position 24,843,270 1,673,843 23,169,427 1,384.2%
Prior period adjustment 252,321 (3,686,613) 3,938,934 100.0% Beginning net position 79,665,858 81,678,628 (2,012,770) (2.5%) Beginning net position - adjusted 79,918,179 77,992,015 1,926,164 2.5%
Ending Net Position 104,761,449$ 79,665,858$ 25,095,591$ 31.5%
Condensed Statements of Activities and Changes in Net Position
Agenda Packet Page 69

This page intentionally left blank
Agenda Packet Page 70

Attachment A
Agenda Packet Page 71

This Page Left Intentionally Blank
Agenda Packet Page 72

SILICON VALLEY CLEAN WATER
FINANCIAL STATEMENTS AND INDEPENDENT AUDITOR’S REPORT
JUNE 30, 2019
* * *
Agenda Packet Page 73

This Page Left Intentionally Blank
Agenda Packet Page 74

Silicon Valley Clean Water
Table of Contents June 30, 2019
Independent Auditor’s Report ...................................................................................... 1 - 3 Management’s Discussion and Analysis ....................................................................... 7 - 20 Basic Financial Statements: Statement of Net Position .............................................................................................. 22 Statement of Activities and Changes in Net Position .................................................... 23 Statement of Cash Flows ............................................................................................... 24 Notes to Financial Statements ........................................................................................ 25 - 49
Required Supplementary Information: Schedule of Pension Contributions - CalPERS ............................................................ 52 Schedule of Proportionate Share of Net Pension Liability ........................................... 53 Schedule of OPEB Contributions ................................................................................. 54 Schedule of Net OPEB Liability ................................................................................... 55 Supplementary Information: Combining Schedule of Net Position - Enterprise Funds ............................................. 58 - 59 Combining Schedule of Activities and Changes in Net Position - Enterprise Funds ... 60 - 61 Combining Schedule of Cash Flows - Enterprise Funds .............................................. 62 - 63 Analysis of Net Position – Supplemental Schedule (Unaudited) ................................. 64 - 65 Independent Auditor’s Report on Internal Control over Financial Reporting and on Compliance and Other Matters Based on an Audit of Financial Statements Performed in Accordance with Government Auditing Standards ........................... 69 - 70
Agenda Packet Page 75

This Page Left Intentionally Blank
Agenda Packet Page 76

INDEPENDENT AUDITOR’S REPORT
To the Commission of Silicon Valley Clean Water Redwood City, California
Report on the Financial Statements
We have audited the accompanying financial statements of Silicon Valley Clean Water ("SVCW"), California, as of and for the fiscal year ended June 30, 2019, and the related notes to the financial statements, which collectively comprise SVCW’s basic financial statements as listed in the table of contents.
Management’s Responsibility for the Financial Statements
SVCW’s management is responsible for the preparation and fair presentation of these financial statements in accordance with accounting principles generally accepted in the United States of America; this includes the design, implementation, and maintenance of internal control relevant to the preparation and fair presentation of financial statements that are free from material misstatement, whether due to fraud or error.
Auditor’s Responsibility
Our responsibility is to express opinions on these financial statements based on our audit. We conducted our audit in accordance with auditing standards generally accepted in the United States of America, the standards applicable to financial audits contained in Government Auditing Standards, issued by the Comptroller General of the United States, and the State Controller's Minimum Audit Requirements for California Special Districts. Those standards require that we plan and perform the audit to obtain reasonable assurance about whether the financial statements are free from material misstatement.
An audit involves performing procedures to obtain audit evidence about the amounts and disclosures in the financial statements. The procedures selected depend on the auditor’s judgment, including the assessment of the risks of material misstatement of the financial statements, whether due to fraud or error. In making those risk assessments, the auditor considers internal control relevant to SVCW’s preparation and fair presentation of the financial statements in order to design audit procedures that are appropriate in the circumstances, but not for the purpose of expressing an opinion on the effectiveness of SVCW’s internal control. Accordingly, we express no such opinion. An audit also includes evaluating the appropriateness of accounting policies used and the reasonableness of significant accounting estimates made by management, as well as evaluating the overall presentation of the financial statements.
We believe that the audit evidence we have obtained is sufficient and appropriate to provide a basis for our audit opinions.
1Agenda Packet Page 77

Opinion
In our opinion, the financial statements referred to above present fairly, in all material respects, the respective financial position of SVCW, as of June 30, 2019, and the respective changes in financial position and, where applicable, cash flows thereof for the year then ended in accordance with accounting principles generally accepted in the United States of America.
Other Matters
Required Supplementary Information
Accounting principles generally accepted in the United States of America require that the Management’s Discussion and Analysis and other Required Supplementary Information, as listed in the table of contents, be presented to supplement the basic financial statements. Such information, although not a part of the basic financial statements, is required by the Governmental Accounting Standards Board who considers it to be an essential part of financial reporting for placing the basic financial statements in an appropriate operational, economic, or historical context. We have applied certain limited procedures to the required supplementary information in accordance with auditing standards generally accepted in the United States of America, which consisted of inquiries of management about the methods of preparing the information and comparing the information for consistency with management’s responses to our inquiries, the basic financial statements, and other knowledge we obtained during our audit of the basic financial statements. We do not express an opinion or provide any assurance on the information because the limited procedures do not provide us with sufficient evidence to express an opinion or provide any assurance.
Supplementary Information
Our audit was conducted for the purpose of forming opinions on the financial statements that collectively comprise SVCW’s basic financial statements. The supplementary information listed in the table of contents is presented for purposes of additional analysis and is not a required part of the financial statements. These schedules are the responsibility of management and were derived from and relate directly to the underlying accounting and other records used to prepare the financial statements. This information, except for Schedule of analysis of Net Position, has been subjected to the auditing procedures applied in the audit of the financial statements and certain additional procedures, including comparing and reconciling such information directly to the underlying accounting and other records used to prepare the financial statements or to the financial statements themselves, and other additional procedures in accordance with auditing standards generally accepted in the United States of America. In our opinion, the Supplementary information, except for Schedule of analysis of Net Position, is fairly stated in all material respects in relation to the financial statements as a whole.
The Schedule of Analysis of Net Position has not been subjected to the auditing procedures applied in the audit of the basic financial statements and, accordingly, we do not express an opinion or provide any assurance on it.
2Agenda Packet Page 78

Other Reporting Required by Government Auditing Standards
In accordance with Government Auditing Standards, we have also issued our report dated November 25, 2019 on our consideration of SVCW’s internal control over financial reporting and on our tests of its compliance with certain provisions of laws, regulations, contracts, and grant agreements and other matters. The purpose of that report is to describe the scope of our testing of internal control over financial reporting and compliance and the results of that testing, and not to provide an opinion on internal control over financial reporting or on compliance. That report is an integral part of an audit performed in accordance with Government Auditing Standards in considering SVCW’s internal control over financial reporting and compliance.
Prior Year Comparative Information
The financial statements and the related notes of SVCW as of June 30, 2018, were audited by other auditor whose report dated November 11, 2018, expressed an unmodified opinion on those statements.
November 25, 2019 Pleasant Hill, California
3Agenda Packet Page 79

This Page Left Intentionally Blank
Agenda Packet Page 80
MANAGEMENT’S DISCUSSION AND ANALYSIS
5Agenda Packet Page 81

This Page Left Intentionally Blank
Agenda Packet Page 82

Silicon Valley Clean Water Management’s Discussion and Analysis
June 30, 2019
Silicon Valley Clean Water (the “Authority”, or “SVCW”) has issued its financial statements for the fiscal year ended June 30, 2019 in conformity with the format prescribed by the provisions of Government Accounting Standards Board Statement 34 (GASB 34). The Management of SVCW presents the following narrative overview and analysis of the financial activities, with comparative data for the fiscal year ended June 30, 2018. The Management’s Discussion and Analysis (MD&A) section is an overview of SVCW’s financial activities and is an integral part of the accompanying Basic Financial Statements. This information should be read in conjunction with the audited financial statements that follow this section.
OVERVIEW OF THE BASIC FINANCIAL STATEMENTS
SVCW’s revenues and expenses are recognized on a full accrual basis; revenues are recognized in the period in which they are earned and expenses are recognized in the period incurred. The basic financial statements are comprised of two components: Financial Statements and Notes to the Financial Statements. The Financial Statements report information about SVCW accounting using methods similar to those used by private sector companies. These statements offer short-term and long-term financial information about its activities and include:
• The Statement of Net Position presents SVCW assets and liabilities, with the differencebetween the two reported as net position. This statement provides information about thenature and amounts of investments in resources (assets) and obligations to creditors(liabilities). It also provides the basis for evaluating the capital structure of the SVCW. Overtime, increases or decreases in net position may serve as a useful indicator of whether thefinancial position of SVCW is improving or deteriorating.
• The Statement of Activities and Changes in Net Position accounts for revenues and expensesand reflects the results of SVCW operations over the course of the fiscal year. This statementcan be used as an indicator of the extent to which SVCW recovers its costs through charges.
• The final required Financial Statement is the Statement of Cash Flows, with the primarypurpose of providing information about SVCW’s cash receipts and cash payments during thereporting period. In addition to cash receipts and payments, this statement illustrates netchanges in cash resulting from operations and investments. It also answers questions aboutthe sources and uses of cash, and describes the change in cash balance during the reportingperiod.
The Notes to Financial Statements provide information that is not displayed on the face of the financial statements but is essential to a reader’s full understanding.
ORGANIZATION AND BUSINESS
SVCW is a joint exercise of powers authority that provides wastewater transmission, treatment, and effluent disposal to the cities of Belmont, Redwood City, and San Carlos, and the West Bay Sanitary District (collectively, the “Members”), all of which are located in the northern part of Silicon Valley between the cities of San Francisco and San Jose. SVCW’s wastewater treatment plant is located in the City of Redwood City and serves more than 200,000 people and businesses located predominantly in San Mateo County, California. SVCW operates in a robust Bay Area economy with a customer base that includes Oracle Corporation, EA Sports, and Facebook. In response to SVCW capital needs, ratepayers have already accommodated the majority of rate increases needed for large infrastructure improvements.
7Agenda Packet Page 83
Silicon Valley Clean Water Management’s Discussion and Analysis
June 30, 2019
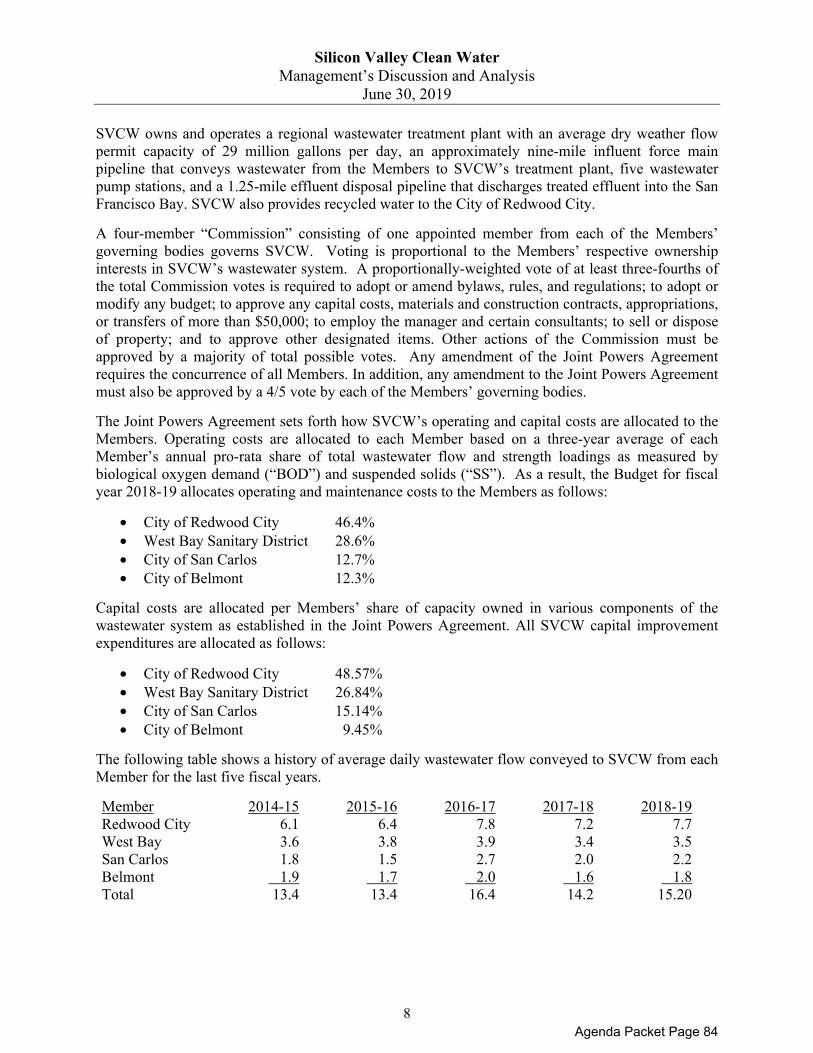
SVCW owns and operates a regional wastewater treatment plant with an average dry weather flow permit capacity of 29 million gallons per day, an approximately nine-mile influent force main pipeline that conveys wastewater from the Members to SVCW’s treatment plant, five wastewater pump stations, and a 1.25-mile effluent disposal pipeline that discharges treated effluent into the San Francisco Bay. SVCW also provides recycled water to the City of Redwood City. A four-member “Commission” consisting of one appointed member from each of the Members’ governing bodies governs SVCW. Voting is proportional to the Members’ respective ownership interests in SVCW’s wastewater system. A proportionally-weighted vote of at least three-fourths of the total Commission votes is required to adopt or amend bylaws, rules, and regulations; to adopt or modify any budget; to approve any capital costs, materials and construction contracts, appropriations, or transfers of more than $50,000; to employ the manager and certain consultants; to sell or dispose of property; and to approve other designated items. Other actions of the Commission must be approved by a majority of total possible votes. Any amendment of the Joint Powers Agreement requires the concurrence of all Members. In addition, any amendment to the Joint Powers Agreement must also be approved by a 4/5 vote by each of the Members’ governing bodies. The Joint Powers Agreement sets forth how SVCW’s operating and capital costs are allocated to the Members. Operating costs are allocated to each Member based on a three-year average of each Member’s annual pro-rata share of total wastewater flow and strength loadings as measured by biological oxygen demand (“BOD”) and suspended solids (“SS”). As a result, the Budget for fiscal year 2018-19 allocates operating and maintenance costs to the Members as follows:
• City of Redwood City 46.4% • West Bay Sanitary District 28.6% • City of San Carlos 12.7% • City of Belmont 12.3%
Capital costs are allocated per Members’ share of capacity owned in various components of the wastewater system as established in the Joint Powers Agreement. All SVCW capital improvement expenditures are allocated as follows:
• City of Redwood City 48.57% • West Bay Sanitary District 26.84% • City of San Carlos 15.14% • City of Belmont 9.45%
The following table shows a history of average daily wastewater flow conveyed to SVCW from each Member for the last five fiscal years. Member 2014-15 2015-16 2016-17 2017-18 2018-19 Redwood City 6.1 6.4 7.8 7.2 7.7 West Bay 3.6 3.8 3.9 3.4 3.5 San Carlos 1.8 1.5 2.7 2.0 2.2 Belmont 1.9 1.7 2.0 1.6 1.8 Total 13.4 13.4 16.4 14.2 15.20
8Agenda Packet Page 84

Silicon Valley Clean Water Management’s Discussion and Analysis
June 30, 2019
FINANCIAL ANALYSIS
Our analysis of SVCW begins on page 17 of the Financial Statements. One of the most important questions asked about SVCW’s finances is “Is SVCW as a whole better off or worse off as a result of the year’s activities?” The Statement of Net Position and the Statement of Activities and Changes in Net Position report information about SVCW’s activities in a way that will help answer this question. These two statements report the net position of SVCW and changes in them, which helps measure the financial health of the organization. Over time, increases or decreases in SVCW’s net position are one indicator of whether its financial health is improving or deteriorating. However, it is important to keep these indicators in context with other non-financial factors such as changes in economic conditions, population growth, climate, zoning, or the regulatory environment.
SVCW’s fiscal year 2018-19 operating revenues and expenses were comparable both to the prior fiscal year as well as to the 2018-19 Budget. The most significant differences from the prior year were caused by increased debt service activities to fund ongoing capital improvements. This closely relates to cash expenditures of $118.1 million for capital improvement construction. The Regional Environmental Sewer Conveyance Upgrade (RESCU) program is in construction and includes a gravity pipeline tunnel, front-of-plant receiving and pretreatment facilities, and improvements to pump stations.
The Capital Improvement Program is largely funded through long-term borrowings and, to a lesser extent, member agency cash contributions. As of June 30, 2019, SVCW long-term debt was $338 million, a net decrease of $6 million after principal payments on Wastewater Revenue Bonds. The State Revolving Fund (SRF) loan balances increased by $1.4M after disbursements and repayments.
The SVCW Commission has an established reserve policy to protect its fiscal solvency. As of June 30, 2018, cash reserves totaled $34.4 million including an Operating Reserve, a Capital Improvement Program Reserve, and a Capacity Construction Reserve. Of this amount, the Authority has restricted $7.8 million as required by SRF loan agreements.
Like other governmental agencies, SVCW implemented Governmental Accounting Standards Board Statement No. 75 (GASB 75) regrading accounting and reporting for post-employment benefits in fiscal year 2017-18.
FINANCIAL HIGHLIGHTS
• SVCW net position increased during fiscal year 2018-19 by $25.1 million (31.5%) from theprevious year. The largest increase in net position occurred in the Capital Improvement ProgramFund, which recognized $17.4 million in cash contributed by members not fully participating inSVCW long-term debt, a net $5.1 million reduction in debt principal owed, and $2.6 million ininvestment earnings. Other increases in net position included a $1.0 million increase in policy-required contributions and associated earnings in the Capital Improvement Program ReserveFund, and a $3.1 million increase in the Construction Stage 2 Reserve Fund as developmentoccurred in the community. The Operating Fund net position declined by $7.8 million afterrecognizing annual depreciation expense.
• The accounts receivable balance at year end increased by $1.2 million due to a $862 thousandreceivable for Stage 2 capacity connection fee and a $600 thousand receivable related to theCalifornia Energy Commission.
9Agenda Packet Page 85

Silicon Valley Clean Water Management’s Discussion and Analysis
June 30, 2019
• SVCW’s net OPEB liability decreased by $724 thousand during the fiscal year as the Authority continued its prefunding program.
• SVCW’s Pension liability decreased by $661 thousand primarily after recognition of CalPERS’ changes in actuarial assumptions.
• Operating revenues increased $23.7 million (52.6%) from the previous year after members contributed more to pay increased debt service.
• Total expenses ended the fiscal year at $48.8 million, a $4.8 million increase (10.9%) compared to the prior year. Operating expenses were $2.2 million more than prior year as SVCW filled personnel vacancies, incurred ordinary inflationary pressures, and settled a legal claim. Non-operating expense increased $2.4 million (21.9%) as the Authority incurred more interest expense associated with additional debt. Depreciation increased by $150.3 thousand as capital projects were placed into service.
• Cash and investment balances, excluding restricted cash, declined $78.9 million as bond proceeds were used to pay for construction.
• Note that, subsequent to June 30, 2019 SVCW issued water revenue notes in August 2019 which generated $196.7 million for CIP projects.
10Agenda Packet Page 86

Silicon Valley Clean Water Management’s Discussion and Analysis
June 30, 2019
NET POSITION A summary of SVCW’s Statement of Net Position is presented in Table 1, which indicates a $25.1 million increase in SVCW’s net position from fiscal year 2018-19. Significant changes during the fiscal year included:
• Current Assets decreased by $76.3 million (48.8%) after cash from bond proceeds was spent on construction.
• Restricted assets marginally increased $130.2 thousand (1.7%) from the prior year-end balance of $7.7 million as SVCW set aside additional reserves for State Revolving Fund loans.
• Capital assets, net of depreciation, increased by $108.3 million (38.2%) as Construction in Progress balances associated with the Capital Improvement Program grow.
• Total SVCW liabilities increased by $6.3 million (1.7%) as SVCW withheld $6.1 million for construction retention. Other activity associated with liabilities included a reduction in long-term debt liabilities after payments, offset by increased accounts payable for construction.
• Deferred Outflows and Deferred Inflows represent changes in the components of Authority’s pension liability. The most significant change in deferred inflows and outflows was the impact of CalPERS’ changed assumptions and earnings.
11Agenda Packet Page 87

Silicon Valley Clean Water Management’s Discussion and Analysis
June 30, 2019
Fiscal Year Fiscal Year $ Higher / % Higher / 2019 2018 (Lower) (Lower)
Current and other assets 80,094,833$ 156,442,864$ (76,348,031)$ (48.8%) Restricted assets 7,823,426 7,693,222 130,204 1.7% Capital assets 391,416,119 283,126,844 108,289,275 38.2%
Total Assets 479,334,378 447,262,930 32,071,448 7.2%
Deferred Outflows 5,611,134 6,236,059 (624,925) (10.0%)
Total Liabilities 378,937,205 372,589,353 6,347,852 1.7%
Deferred Inflows 1,246,858 1,243,778 3,080 0.2%
Net investment in capital assets 87,049,556 61,254,055 25,795,501 42.1% Restricted 7,823,426 7,693,222 130,204 1.7% Unrestricted 9,888,467 10,718,581 (830,114) (7.7%) Total Net Position 104,761,449$ 79,665,858$ 25,095,591$ 31.5%
TABLE 1Condensed Statement of Net Position
12Agenda Packet Page 88

Silicon Valley Clean Water Management’s Discussion and Analysis
June 30, 2019
Table 2 below summarizes activities associated with all construction-related funds. Members contributed $1 million, $1.5 million, and $2.7 million, respectively, to Capital Reserves, pay-go capital projects, and Stage 2, respectively. In the Capital Improvement Program Fund, approximately $38.7 million was received to pay for debt service and project expenditures. As part of continued expenditures on its Capital Improvement Program, SVCW spent $118.1 million on capital projects during fiscal year 2018-19. Specific expenditures included gravity pipeline tunnel, front-of-plant receiving and pretreatment facilities, and improvements to pump stations.
CapitalCapital ImprovementReserve New Capital Replacement Stage 2 Program
(13 Fund) (14 Fund) (17 Fund) (15 Fund) (20 Fund) Totals
Member contributions 1,000,008$ 1,485,504$ -$ 2,747,284$ 38,700,687$ 43,933,483$ Operating income - 6,816 - - - 6,816 Interest Earnings 641,580 - 124,681 411,395 2,492,591 3,670,247 Total Revenue 1,641,588$ 1,492,320$ 124,681$ 3,158,679$ 41,193,278$ 47,610,546$
Cash to construction -$ 838,118$ -$ 117,269,898$ 118,108,016$
TABLE 2Construction Fund Activity
13Agenda Packet Page 89

Silicon Valley Clean Water Management’s Discussion and Analysis
June 30, 2019
While the Statement of Net Position shows the change in financial position from year to year, the Statement of Activities and Changes in Net Position (Table 3 below) addresses the nature and source of the changes. Total 2018-19 revenues increased from the prior year by $27.8 million (60.7%), of which Operating Revenues increased by $23.7 million (52.6%) and reflects increased contributions for debt service. Non-operating Revenues increased $4.1 million as interest income was earned on a higher balance of bond proceeds.
Fiscal year 2018-19 total expenses increased by $4.6 million (10.5%) over the prior year, which included changes in several key expenditures:
• Depreciation expense increased $150.3 thousand (1.7%) after new projects were placed intoservice during the year.
• Operating expenses were $2 million (8.5%) more than the prior year, primarily related tofilling personnel vacancies and settlement of a claim.
• Non-operating expenses increased by $2.4 million, reflecting increased interest expense onoutstanding debt.
Fiscal Year Fiscal Year $ Higher / % Higher /2019 2018 (Lower) (Lower)
Operating revenues 68,827,874$ 45,091,922$ 23,735,952$ 52.6% Non-operating revenues 4,797,281 730,108 4,067,173 557.1% Capital Contributions - - - -
Total Revenues 73,625,155 45,822,030 27,803,125 60.7%
Depreciation expense 8,986,961 8,836,703 150,258 1.7% Operating expense 26,215,903 24,169,268 2,046,635 8.5% Non-operating expense 13,579,021 11,142,216 2,436,805 21.9%
Total Expenses 48,781,885 44,148,187 4,633,698 10.5%
Changes in Net Position 24,843,270 1,673,843 23,169,427 1,384.2%
Prior period adjustment 252,321 (3,686,613) 3,938,934 100.0% Beginning net position 79,665,858 81,678,628 (2,012,770) (2.5%) Beginning net position - adjusted 79,918,179 77,992,015 1,926,164 2.5%
Ending Net Position 104,761,449$ 79,665,858$ 25,095,591$ 31.5%
TABLE 3Condensed Statements of Activities and Changes in Net Position
14Agenda Packet Page 90
Silicon Valley Clean Water Management’s Discussion and Analysis
June 30, 2019
BUDGETARY HIGHLIGHTS
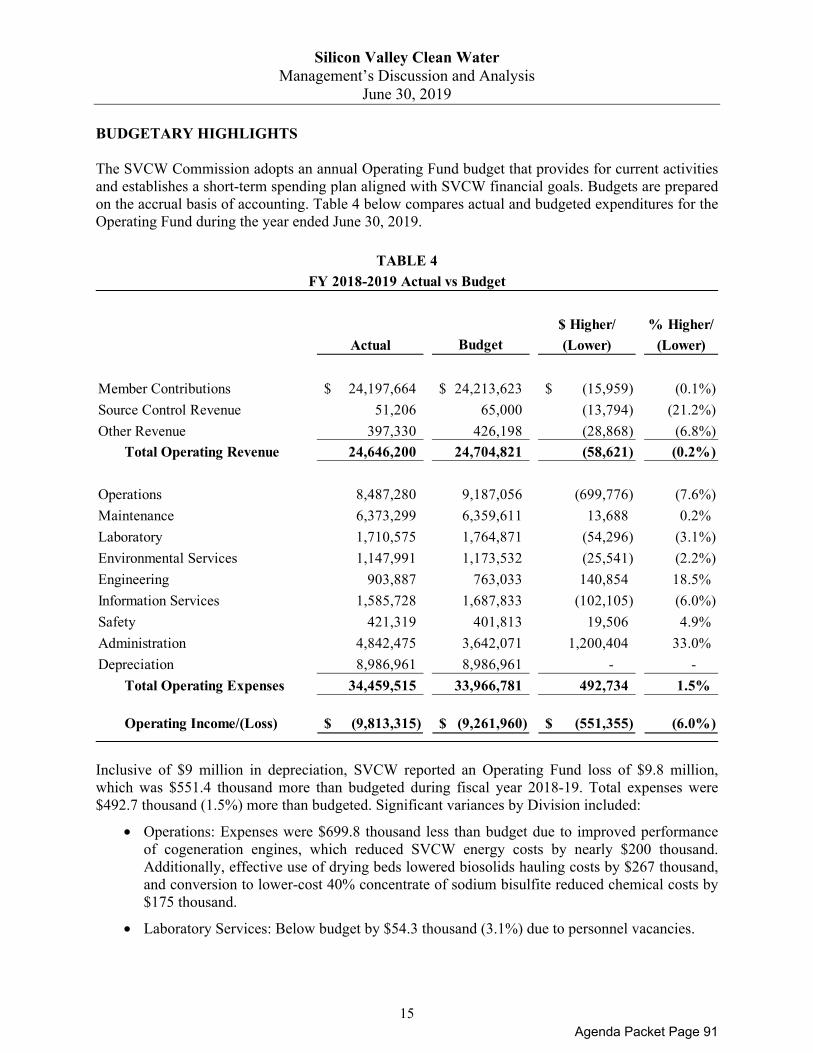
The SVCW Commission adopts an annual Operating Fund budget that provides for current activities and establishes a short-term spending plan aligned with SVCW financial goals. Budgets are prepared on the accrual basis of accounting. Table 4 below compares actual and budgeted expenditures for the Operating Fund during the year ended June 30, 2019.
Inclusive of $9 million in depreciation, SVCW reported an Operating Fund loss of $9.8 million, which was $551.4 thousand more than budgeted during fiscal year 2018-19. Total expenses were $492.7 thousand (1.5%) more than budgeted. Significant variances by Division included:
• Operations: Expenses were $699.8 thousand less than budget due to improved performanceof cogeneration engines, which reduced SVCW energy costs by nearly $200 thousand.Additionally, effective use of drying beds lowered biosolids hauling costs by $267 thousand,and conversion to lower-cost 40% concentrate of sodium bisulfite reduced chemical costs by$175 thousand.
• Laboratory Services: Below budget by $54.3 thousand (3.1%) due to personnel vacancies.
$ Higher/ % Higher/Actual Budget (Lower) (Lower)
Member Contributions 24,197,664$ 24,213,623$ (15,959)$ (0.1%) Source Control Revenue 51,206 65,000 (13,794) (21.2%) Other Revenue 397,330 426,198 (28,868) (6.8%) Total Operating Revenue 24,646,200 24,704,821 (58,621) (0.2%)
Operations 8,487,280 9,187,056 (699,776) (7.6%) Maintenance 6,373,299 6,359,611 13,688 0.2% Laboratory 1,710,575 1,764,871 (54,296) (3.1%) Environmental Services 1,147,991 1,173,532 (25,541) (2.2%) Engineering 903,887 763,033 140,854 18.5% Information Services 1,585,728 1,687,833 (102,105) (6.0%) Safety 421,319 401,813 19,506 4.9% Administration 4,842,475 3,642,071 1,200,404 33.0% Depreciation 8,986,961 8,986,961 - - Total Operating Expenses 34,459,515 33,966,781 492,734 1.5%
Operating Income/(Loss) (9,813,315)$ (9,261,960)$ (551,355)$ (6.0%)
TABLE 4FY 2018-2019 Actual vs Budget
15Agenda Packet Page 91

Silicon Valley Clean Water Management’s Discussion and Analysis
June 30, 2019
• Engineering: $140.9 thousand higher than budget due primarily to organization changesassociated with the Authority Engineer position. Additionally, $43 thousand was spent to jointhe Bay Area’s Potable Reuse Exploratory Plan (PREP) initiative.
• Information Services: Below budget by $140.0 thousand after certain support, backup, andrestore services were not incurred in preparation for hardware upgrades.
• Safety: Higher than budget by $19.5 thousand (4.9%) due to unanticipated purchases of sitesignage and confined space equipment.
• Administration: Over budget by $1.1 million, largely associated with legal fees and paymentto settle a claim.
16Agenda Packet Page 92

Silicon Valley Clean Water Management’s Discussion and Analysis
June 30, 2019
CAPITAL ASSETS
SVCW has a Long-Range Capital Improvement Program to improve existing facilities, build new facilities, rehabilitate assets, repair or replace infrastructure, preserve assets, enhance safety and security, and perform needed maintenance. Significant investments in infrastructure have included replacement of significant lengths of the influent conveyance pipe, modernization of electronic control systems for activated sludge handling, upgrades of electrical systems. SVCW is in construction of its Regional Environmental Sewer Conveyance Upgrade (RESCU) program. This program replaces an existing force main with a gravity pipeline and constructs essential pretreatment facilities.
Consistent with the Capital Improvement Program, the Commission approved these and other capital improvements to protect public health, the environment, and agency facilities. Table 5 below provides a summary of SVCW capital assets and shows how, at the ends of fiscal years 2017-18 and 2018-19, Net Property Plant & Equipment (PP&E) was $151.6 million and $144.1 million, respectively. Additional information about SVCW’s capital acquisitions and construction is presented in Note 5 to the financial statements.
LONG TERM DEBT
Including a Line of Credit but excluding Unamortized Premium on outstanding Bonds, SVCW had total long-term debt outstanding of $314.1 million as of June 30, 2019, a $4.2 million decrease from June 30, 2018. Components of SVCW’s long-term debt liability as of June 30, 2019 include $262.7 million of Wastewater Revenue Bonds (excluding unamortized premiums of $24.7 million), and Notes Payable obligations to the California Clean Water State Revolving Fund for approximately $51.4 million.
Balance at Adjustments & Balance atJune 30, 2018 Additions Deletions Transfers June 30, 2019
Land 1,282,081$ -$ -$ -$ 1,282,081$ Buildings & Struct. 84,599,149 - - 163,804 84,762,953 Pipelines 55,151,004 - - 307,200 55,458,204 Pump Stations 7,175,591 - - 298,362 7,473,953 Machines & Equip. 92,427,359 - (113,260) 860,170 93,174,269 Total PP&E, Cost 240,635,184 - (113,260) 1,629,536 242,151,460
Accum. Depreciation 89,048,596 9,026,438 (16,607) (40,454) 98,017,973 Total PP&E, Net 151,586,588$ (9,026,438)$ (96,653)$ 1,669,990$ 144,133,487$
Construction in Progress:Stage 2 Capacity 2,934,618$ -$ -$ 2,934,618$ General 128,605,638 118,110,915 - (2,368,539) 244,348,014 Total CIP 131,540,256$ 118,110,915$ -$ (2,368,539)$ 247,282,632$
Capital AssetsTABLE 5
17Agenda Packet Page 93

Silicon Valley Clean Water Management’s Discussion and Analysis
June 30, 2019
When SVCW credit ratings were assigned in January 2018, Moody’s maintained its Wastewater Revenue Bonds rating of Aa2, and Standard & Poor’s (S&P) Ratings Services separately affirmed its ‘AA’ long-term rating with a stable outlook. More recently, in June 2019 Moody’s assigned a Aa2 rating to SVCW’s Water Infrastructure Finance and Innovation Act (WIFIA) loan and a Aa3 to its Wastewater Revenue Notes Series 2019A. For the same transaction, S&P assigned an A+ rating.
Wastewater Revenue Bonds
SVCW has $262.7 million outstanding in Wastewater Revenue Bonds par value, the proceeds for which were used to acquire and construct wastewater system improvements. These Bonds are limited obligations of SVCW, payable solely from and secured solely by the revenues pledged under the Indenture, consisting primarily of payments made by the City of Redwood, the City of San Carlos, and the West Bay Sanitary District (the "Participating Members). Table 6 below shows the total bonds outstanding for the fiscal years ended June 30, 2018 and 2019:
State Water Resources Control Board Loan
SVCW has financed three projects by entering into separate sale-repurchase agreements with the State Water Resources Control Board (SWRCB). Combined, the principal due on these agreements totaled $51.4 million as of June 30, 2019. The project funds, together with all accrued interest, are repaid in annual installments commencing one year after the completion of construction.
In August 2011, SVCW secured SWRCB funding for the construction of an administration and plant control building. The outstanding liability was $8.6 million as of June 30, 2019 and is scheduled to be fully repaid by June 2033.
In March 2012, SVCW entered a similar agreement with the SWRCB for up to $35.4 million for certain improvements to the wastewater treatment plant. The total outstanding balance as of June 30, 2019 totaled $28.8 million and the final payment is scheduled October 31, 2036.
In May 2018, SVCW entered a third SWRCB agreement for up to $14 million to plan improvements to its conveyance system. As of June 30, 2019, SVCW had incurred the full $14 million in expenditures under this project. SVCW intends to consolidate this loan into a subsequent construction loan associated with conveyance projects in 2020.
Bonds BondsIssue Maturity Interest Original Outstanding Issued Outstanding
Bond Date Date Rate Issue July 01, 2018 (Redeemed) June 30, 2019
2009 Revenue Bond 2009 8/1/2039 1.74-8.1% 55,855,000$ 2,555,000$ (1,250,000)$ 1,305,000$ 2014 Revenue Bond 2014 2/1/2044 3.0-5.0% 60,000,000 56,135,000 (1,115,000) 55,020,000 2015 Revenue Bond 2015 8/1/2045 2.0-5.0% 70,200,000 68,650,000 (795,000) 67,855,000 2018 Revenue Bond 2018 8/1/2049 3.125-5% 140,955,000 140,955,000 (2,460,000) 138,495,000
Total Wastewater Revenue Bonds 327,010,000$ 268,295,000$ (5,620,000)$ 262,675,000$
TABLE 6Wasterwater Revenue Bonds
18Agenda Packet Page 94

Silicon Valley Clean Water Management’s Discussion and Analysis
June 30, 2019
Line of Credit
On May 29, 2018, SVCW secured a $35 million line of credit with Wells Fargo Bank. Advances on the line of credit provide for an interest rate based on either a fixed per annum rate of interest equal to the LIBOR rate plus the Applicable LIBOR Rate Margin, or a variable per annum rate of interest equal to the Base Rate plus the Applicable Base Rate Margin. SVCW had no borrowings outstanding on the line of credit at June 30, 2019.
More detailed information about SVCW’s long-term debt, Notes Payable, and Line of Credit is presented in Note 6 to the financial statements.
ECONOMIC FACTORS AND NEXT YEAR’S BUDGET
The approved Operating Budget for fiscal year 2019-20 recommends expenditures based on a prioritization of needs, goals and objectives; it also anticipates external cost pressures and provides a roadmap to meet the needs of the community in the coming fiscal year. The Budget considered ordinary inflationary pressures, and incorporated savings from operational improvements. Personnel costs are relatively unchanged in terms of staffing levels, though adjusted to incorporate terms of a Memorandum of Understanding (MOU) between SVCW and the International Union of Operating Engineers Stationary Local 39, AFL-CIO. A new MOU was ratified in October 2018 and expires on June 30, 2023.
Each Member Agency has proactively raised sewer rates to support its allocable share of funding requirements for SVCW’s operations and Capital Improvement Program, as well to meet their own operating and capital needs.
Table 7 compares the fiscal year 2019-20 Operating Fund Budget to the fiscal year 2018-19 actual results. Total 2019-20 Operating Revenues are anticipated to increase $1.3 million (5.5%) from prior year actual revenues as Member Contributions increase to cover operating costs. Additionally, Other Revenues as SVCW implemented a stormwater program, recognized increased deliveries of food grease, and raised its rates charged for laboratory and source control services. Total 2019-20 Operating Expenses are anticipated to increase $796.2 thousand (2.3%) from prior year actual expenditures. The largest increase over 2018-19 actual expenditures is from inflationary pressures on wages and other personnel costs, price hikes by chemical providers, and increased costs associated with hauling biosolids.
19Agenda Packet Page 95

Silicon Valley Clean Water Management’s Discussion and Analysis
June 30, 2019
CONTACTING SILICON VALLEY CLEAN WATER MANAGEMENT
This financial report is designed to provide SVCW officers, investors, stakeholders, and other interested parties with a general overview of SVCW’s financial condition. If you have any questions about this report or need additional financial information, please contact the offices of the Manager or the Chief Financial Officer at Silicon Valley Clean Water, (650) 832-6224, 1400 Radio Road, Redwood City, CA, 94065.
FY 2019-2020 FY2018-2019 $ Increase / % Increase / Budget Actual (Decrease (Decrease)
Member Contributions 25,209,277$ 24,197,664$ 1,011,613$ 4.2%Source Control Revenue 87,500 51,206 36,294 70.9%Other Revenues 697,000 397,330 299,670 75.4% Total Operating Revenue 25,993,777 24,646,200 1,347,577 5.5%
Operations 9,780,104 8,487,280 1,292,824 15.2%Maintenance 6,474,578 6,373,299 101,279 1.6%Laboratory 1,770,665 1,710,575 60,090 3.5%Environmental Services 1,240,862 1,147,991 92,871 8.1%Engineering 809,095 903,887 (94,792) (10.5%) Information Systems 1,813,120 1,585,728 227,392 14.3%Safety 483,627 421,319 62,308 14.8%Administration 3,896,727 4,842,475 (945,748) (19.5%) Depreciation 8,986,961 8,986,961 - - Total Operating Expenses 35,255,739 34,459,515 796,224 2.3%
Operating Income/(Loss) (9,261,962)$ (9,813,315)$ 551,353$ 5.6%
TABLE 7FY 2019-2020 Budget vs FY 2018-2019 Actual
20Agenda Packet Page 96

BASIC FINANCIAL STATEMENTS
21Agenda Packet Page 97

Assets 2019 2018Current Assets:
Cash and investments 71,812,930$ 125,837,918$ Cash restricted for debt service 7,823,426 7,693,222Accounts receivable 1,937,298 712,420Interest receivable 517,075 513,042Employee notes receivable 19,850 16,523Inventory 2,095,290 1,854,529Prepaid expenses 423,325 98,445
Total Current Assets 84,629,194 136,726,099 Noncurrent Assets:
Property held for resale 3,289,065 2,552,962Cash and investments - 24,857,025Capital assets:
Depreciable capital assets - net 142,851,406 150,304,507Non depreciable capital assets:
Land 1,282,081 1,282,081Construction in progress:
Stage 2 2,934,618 2,934,618 General 244,348,014 128,605,638
Total capital assets - net 391,416,119 283,126,844 Total Noncurrent Assets 394,705,184 310,536,831
Total Assets 479,334,378$ 447,262,930$
Deferred Outflows of ResourcesPension related 4,421,241$ 5,046,304$OPEB related 841,064 763,957Deferred Loss on Defeasance 348,829 425,798
Total Deferred Outflows of Resources 5,611,134$ 6,236,059$
LiabilitiesCurrent Liabilities:
Accounts payable 17,856,836$ 5,581,300$Accrued payroll and employee benefits 882,309 892,491Accrued interest payable 6,391,797 6,227,056Unearned revenue 271,903 287,447Noncurrent liabilities due within one year 9,302,782 8,292,753
Total Current Liabilities 34,705,627 21,281,047Noncurrent liabilities due in more than one year 344,231,578 351,308,306
Total Liabilities 378,937,205$ 372,589,353$
Deferred inflows of ResourcesPension related 1,207,125$ 1,243,778$OPEB related 39,733 -
Total Deferred Inflows of Resources 1,246,858$ 1,243,778$
Net PositionNet Investment in Capital Assets 87,049,556$ 61,254,055$ Restricted for:
Debt service 7,823,426 7,693,222Unrestricted 9,888,467 10,718,581
Total Net Position 104,761,449$ 79,665,858$
The notes to basic financial statements are an integral part of this statement
Silicon Valley Clean WaterStatement of Net Position
(With Comparative Totals as of June 30, 2018)June 30, 2019
22Agenda Packet Page 98

2019 2018
Operating Revenues:Member contributions for services 24,439,039$ 23,412,008$ Member contributions for cash reserves 5,232,796 3,676,896 Member contributions for debt service 38,700,687 17,438,142 Sources control charges 51,206 73,859 Miscellaneous revenues 404,146 491,017
Total operating revenues 68,827,874 45,091,922
Operating Expenses:Operations 8,669,851 8,286,120 Maintenance 6,424,080 6,276,632 Laboratory 1,723,215 1,610,107 Environmental services 1,147,991 1,023,191 Engineering 1,320,911 830,765 Information systems 1,585,728 1,560,575 Safety 421,319 366,455 Administration 4,922,808 4,215,423 Depreciation 8,986,961 8,836,703
Total operating expenses 35,202,864 33,005,971
Operating Income (Loss) 33,625,010 12,085,951
Nonoperating Revenues (Expenses):Grants 273,678 262,635 Other revenue (expense) 793,208 - Interest by fund:
Operations fund 40,104 40,696 Stage 2 capacity fund 191,304 135,533 Capital improvement reserve fund 317,406 231,573 Capital improvement fund - 2,405 Self insurance fund - 57 Operating reserve fund 59,403 50,445 Recycled water fund - 50 Capital improvement fund 2,597,917 242,910 Net increase (decrease) in fair value of investments 524,261 (236,196)
Interest expense (14,508,313) (11,941,492) Premium amortization 941,868 941,868 Gain (loss) on disposal of fixed assets (12,576) (142,592)
Total nonoperating revenues (expenses) (8,781,740) (10,412,108)
Change in Net Position 24,843,270 1,673,843
Beginning Net Position 79,665,858 81,678,628 Prior Period Adjustments 252,321 (3,686,613)
Ending Net Position 104,761,449$ 79,665,858$
The notes to basic financial statements are an integral part of this statement
Silicon Valley Clean WaterStatement of Activities and Changes in Net Position
(With Comparative Totals for the Fiscal Year Ended June 30, 2018)For the Fiscal Year Ended June 30, 2019
23Agenda Packet Page 99

2019 2018Cash Flows from Operating Activities:
Cash received from member agencies 67,510,155$ 44,331,023$ Cash paid to suppliers for goods and services and employees for services (14,021,279) (23,937,654) Other cash received (paid) 455,352 491,017
Net Cash Provided (Used) by Operating Activities 53,944,228 20,884,386
Cash Flows from Capital and Related Financing Activities:Cash received from member agencies other than for services 793,208 427,442 Cash received from grants 273,678 262,635 Proceeds from capital debt - 177,319,484Interest paid on capital debt (14,508,313) (9,799,025) Principal paid on capital debt (5,124,831) (28,342,054)Cash received on the sale of capital assets 83,101 41,996Purchases and construction of capital assets (118,108,016) (38,525,900)
Net Cash Provided (Used) by Capital and Related Financing Activities (136,591,173) 101,384,578
Cash Flows from Investing Activities:Noncash equivalent investments - (126,001,716) Investment income 3,895,136 469,038
Net Cash Provided (Used) by Investing Activities 3,895,136 (125,532,678)
Net Increase (Decrease) in Cash and Cash Equivalents (78,751,809) (3,263,714)
Cash and Cash Equivalents Beginning 158,388,165 35,650,163
Cash and Cash Equivalents Ending 79,636,356$ 32,386,449$
Reconciliation of Operating Income (Loss) to Cash Flows Provided (Used)by Operating Activities:
Operating Income (Loss) 33,625,010$ 12,085,951$ Adjustments to reconcile operating income (loss) to net cash provided
(used) by operating activities:Depreciation 8,986,961 8,836,703 OPEB expense adjustment - GASB 75 - (3,686,613) Net change in:
Accounts receivable (1,228,911) (265,267) Employee notes receivable (3,327) 5,218 Inventory (240,761) (26,337) Prepaid expenses (324,880) 100,539 Net OPEB asset - 2,641,436 Deferred outflows of resources for benefits 624,925 (2,201,005) Accounts payable 12,527,857 68,083 Accrued payroll and employee benefits (10,182) 210,391 Unearned revenue (15,544) (9,833) Deferred inflows of resources for benefits 3,080 (109,126) Net pension liability - 2,225,236 Net OPEB liability - 1,000,631 Accrued compensated absences - 8,379
Net Cash Provided (Used) by Operating Activities 53,944,228$ 20,884,386$
Reconciliation of Cash and Cash Equivalents:Cash and investments 79,636,356$ 158,388,165$
Less: investments with original maturities in excess of three months - (126,001,716) Cash and Cash Equivalents 79,636,356$ 32,386,449$
The notes to basic financial statements are an integral part of this statement
Silicon Valley Clean WaterStatement of Cash Flows
(With Comparative Totals for the Fiscal Year Ended June 30, 2018)For the Fiscal Year Ended June 30, 2019
24Agenda Packet Page 100

Silicon Valley Clean Water Notes to Financial Statements
June 30, 2019
NOTE 1 - NATURE OF ORGANIZATION
Silicon Valley Clean Water (SVCW, or “the Authority”), formerly South Bayside System Authority, was founded in 1975 as the successor to the Strategic Consolidation Sewerage Plan. SVCW took title to all property of the Strategic Consolidation Sewerage Plan. SVCW maintains and operates sanitary sewerage pumping, transmission and outfall facilities constructed by the Strategic Consolidation Sewerage Plan. In addition, SVCW has constructed and is operating sewerage treatment plant facilities. The members of SVCW are the Cities of Belmont, Redwood City, San Carlos, and the West Bay Sanitary District.
NOTE 2 - SUMMARY OF SIGNIFICANT ACCOUNTING POLICIES
Basis of Presentation and Accounting
All activities of SVCW are accounted for within enterprise funds. SVCW's financial statements include a Statement of Net Position, a Statement of Activities and Changes in Net Position and a Statement of Cash Flows.
The financial statements are presented on an "economic resources" measurement focus and the accrual basis of accounting. Accordingly, all of SVCW's assets (including capital assets, as well as infrastructure assets), deferred outflows of resources, liabilities, deferred inflows of resources, and long-term liabilities are included in the accompanying Statement of Net Position. The Statement of Activities presents changes in net position. Under the accrual basis of accounting, revenues are recognized in the period in which they are earned while expenses are recognized in the period in which the liability is incurred.
Deferred outflows of resources is a consumption of net assets by SVCW that is applicable to a future reporting period. For example, prepaid items and deferred charges. Deferred inflows of resources is an acquisition of net assets by SVCW that is applicable to a future reporting period. For example, unearned revenue and advance collections.
Unearned revenue arises when assets are received before revenue recognition criteria have been satisfied. Grants and entitlements received before eligibility requirements are met are recorded as deferred inflows from unearned revenue.
SVCW applies all applicable GASB pronouncements for certain accounting and financial reporting guidance. In December of 2010, GASB issued GASB No. 62, Codification of Accounting and Financial Reporting Guidance Contained in Pre-November 30, 1989 FASB and AICPA Pronouncements. This statement incorporates pronouncements issued on or before November 30, 1989 into GASB authoritative literature. This includes pronouncements by the Financial Accounting Standards Board (FASB), Accounting Principles Board Opinions (APB), and the Accounting Research Bulletins of the American Institute of Certified Public Accountants' (AICPA) Committee on Accounting Procedure, unless those pronouncements conflict with or contradict with GASB pronouncements.
Statement of Net Position
The statement of net position is designed to display the financial position of SVCW. SVCW’s net position is classified into three categories as follows:
25Agenda Packet Page 101
Silicon Valley Clean Water Notes to Financial Statements
June 30, 2019
Net investment in capital assets - This component of net position consists of capital assets, including restricted capital assets, net of accumulated depreciation and reduced by the outstanding balances of any bonds, notes, or other borrowings that are attributable to the acquisition, construction, or improvement of those assets. Deferred outflows of resources and deferred inflows of resources that are attributable to the acquisition, construction, or improvement of those assets or related debt are also included in this component of net position, as applicable.
Restricted - This component of net position consists of constraints placed on an assets use through external constraints imposed by creditors (such as through debt covenants), grantors, contributors, or law and regulations of other governments, and reduced by liabilities and deferred inflows of resources related to those assets. It also pertains to constraints imposed by law or constitutional provisions or enabling legislation.
Unrestricted - This component of net position consists of the net amount of the assets, deferred outflows of resources, liabilities, and deferred inflows of resources that are not included in the determination of net investment in capital assets or the restricted component of net position. SVCW first applies restricted resources when an expense is incurred for purposes for which both restricted and unrestricted net position are available.
Statement of Revenues, Expenses, and Changes in Net Position The statement of revenues, expenses, and changes in net position is the operating statement for proprietary funds. This statement distinguishes between operating and non-operating revenues and expenses and presents a separate subtotal for operating revenues, operating expenses, and operating income. Operating revenues in the enterprise funds are those revenues that are generated from the primary operations of the fund. All other revenues are reported as non-operating revenues. Operating expenses are those expenses that are essential to the primary operations of the fund. All other expenses are reported as non-operating expenses.
Budgets and Budgetary Accounting SVCW adopted a one year budget which provides for the general operations of SVCW. Budgets are prepared on the accrual basis of accounting. Project-length financial plans are adopted for all capital projects. Cash and Cash Equivalents For the purposes of the statement of cash flows, cash represents balances that can be readily withdrawn without substantial notice or penalty. Cash equivalents are defined as short-term, highly liquid investments that are both readily convertible to known amounts of cash or so near their maturity that they present insignificant risk of changes in value because of changes in interest rates, and have an original maturity date of three months or less. In accordance with GASB Statement No. 40, Deposit and Investment Disclosures (Amendment of GASB No.3), certain disclosure requirements for deposits and investment risks were made in the areas of interest rate risk and credit risk. The credit risk disclosures include the following components; overall credit risk, custodial credit risk and concentrations of credit risk. In addition, other disclosures are specified including use of certain methods to present deposits and investments, highly sensitive investments, credit quality at year-end and other disclosures.
26Agenda Packet Page 102

Silicon Valley Clean Water Notes to Financial Statements
June 30, 2019
Investments
SVCW participates in various investments, including an investment pool managed by the State of California known as the Local Agency Investment Fund (LAIF), which has invested a portion of the pooled funds in structured notes and asset-backed securities. LAIF’s investments are subject to credit risk with the full faith and credit of the State of California collateralizing these investments. In addition, the structured notes and asset-backed securities are subject to market risk as to change in interest rates.
Investments are recorded at fair value in accordance with GASB Statement No. 72, Fair Value Measurement and Application. Accordingly, the change in fair value of investments is recognized as an increase or decrease to investment assets and investment income.
Fair value is defined as the price that would be received to sell an asset or paid to transfer a liability in an orderly transaction. In determining this amount, three valuation techniques are available:
Market approach - This approach uses prices generated for identical or similar assets or liabilities.The most common example is an investment in a public security traded in an active exchangesuch as the NYSE.
Cost approach - This technique determines the amount required to replace the current asset. Thisapproach may be ideal for valuing donations of capital assets or historical treasures.
Income approach - This approach converts future amounts (such as cash flows) into a currentdiscounted amount.
Each of these valuation techniques requires inputs to calculate a fair value. Observable inputs have been maximized in fair value measures, and unobservable inputs have been minimized.
Receivables
Receivables include amounts due from member assessments, services performed for other agencies, and from the state of California. All receivables are current and reported net of an allowance for uncollectible accounts. The allowance for uncollectible accounts was zero as of June 30, 2019.
Inventories
Inventories are valued using the average cost method. Inventories are recorded as expenses when consumed rather than when purchased.
Capital Assets
Property, plant and equipment purchased after June 30, 1992 are stated at cost. Prior acquisitions are stated at their appraised value as of June 30, 1992. Property, plant and equipment contributed to SVCW are stated at estimated fair value at the time of contribution. SVCW policy has set the capitalization threshold for reporting capital assets at $20,000. Depreciation is computed using the straight-line method over the estimated useful lives of the assets generally as outlined by the State Controller's Report on Fixed Assets. The purpose of depreciation is to spread the cost of plant and equipment equitably among all customers over the life of these assets, so that each customer's bill includes a pro rata share of the cost of these assets. The amount charged to depreciation expense each year represents that year's pro rata share of plant and equipment cost.
27Agenda Packet Page 103

Silicon Valley Clean Water Notes to Financial Statements
June 30, 2019
Depreciation of all plant and equipment in service is charged as an expense against operations each year and the total amount of depreciation taken over the years, called accumulated depreciation, is reported on the statement of net position as a reduction in the book value of the capital assets. SVCW has assigned the useful lives listed below to plant and equipment:
Buildings and Structures 50-70 Pipelines 35 Pump Stations 7-25 Machinery and Equipment 5-10
Compensated Absences SVCW has a policy whereby an employee can accumulate unused vacation. Compensated absences are recorded as a liability when accrued. Accumulated vacation is computed using current employee accumulated vacation hours at current pay rates. SVCW does not offer payment for sick leave at termination or retirement. Pensions For purposes of measuring the net pension liability and deferred outflows/inflows of resources related to pensions, and pension expense, information about the fiduciary net position of the Authority’s California Public Employees’ Retirement System (CalPERS) plans (the Plans) and additions to/deductions from the Plans’ fiduciary net position have been determined on the same basis as they are reported by CalPERS. For this purpose, benefit payments (including refunds of employee contributions) are recognized when due and payable in accordance with the benefit terms. Investments are reported at fair value. Other Postemployment Benefits Other Than Pensions (OPEB)
For purposes of measuring the net OPEB liability, deferred outflows of resources and deferred inflows of resources related to OPEB, and OPEB expense information about the fiduciary net position of SVCW’s Retiree Benefits Plan (the OPEB Plan) and additions to/deductions from the OPEB Plan's fiduciary net position have been determined on the same basis as they are reported by the OPEB Plan. For this purpose, the OPEB Plan recognizes benefit payments when due and payable in accordance with the benefit terms. Accounting Estimates The preparation of the financial statements in conformity with accounting principles generally accepted in the United States of America requires management to make estimates and assumptions that affect the amounts reported in the financial statements and accompanying notes. Subsequent Events Management has reviewed subsequent events and transactions that occurred after the date of the financial statements through the date the financial statements were issued. The financial statements include all events or transactions, including estimates, required to be recognized in accordance with generally accepted accounting principles. Management has determined that there are no non-recognized subsequent events that require additional disclosure.
28Agenda Packet Page 104

Silicon Valley Clean Water Notes to Financial Statements
June 30, 2019
New Accounting Pronouncements
GASB Statement No. 83, Certain Asset Retirement Obligations
This Statement addresses accounting and financial reporting for certain asset retirement obligations (AROs). An ARO is a legally enforceable liability associated with the retirement of a tangible capital asset. A government that has legal obligations to perform future asset retirement activities related to its tangible capital assets should recognize a liability based on the guidance in this Statement. The requirements of this Statement are effective for financial statements for periods beginning after June 15, 2018. Earlier application is encouraged. This statement had no impact on the Authority’s financial statements for the fiscal year 2019.
GASB Statement No. 88, Certain Disclosures Related to Debt, Including Direct Borrowings and Direct Placements
This Statement addresses additional information to be disclosed in the notes to the financial statements regarding debt, including unused lines of credit; assets pledged as collateral for the debt; and terms specified in debt agreements related to significant events of default with finance-related consequences, significant termination events with finance-related consequences, and significant subjective acceleration clauses. The requirements of this Statement are effective for financial statements for periods beginning after June 15, 2018. Earlier application is encouraged. The Authority has implemented this GASB in the fiscal year 2019. See footnote disclosure in Note 6.
Upcoming New Accounting Pronouncements
GASB Statement No. 84, Fiduciary Activities
The objective of this Statement is to improve guidance regarding the identification of fiduciary activities for accounting and financial reporting purposes and how those activities should be reported.
This Statement establishes criteria for identifying fiduciary activities of all state and local governments. The focus of the criteria generally is on (1) whether a government is controlling the assets of the fiduciary activity and (2) the beneficiaries with whom a fiduciary relationship exists. Separate criteria are included to identify fiduciary component units and postemployment benefit arrangements that are fiduciary activities. The requirements of this Statement are effective for financial statements for periods beginning after December 15, 2018. Earlier application is encouraged. The Authority doesn’t believe this statement will have a significant impact on the Authority’s financial statements.
GASB issued Statement No. 87, Leases
The objective of this statement is to better meet the information needs of financial statement users by improving accounting and financial reporting for leases by governments. This statement increases the usefulness of governments’ financial statements by requiring recognition of certain lease assets and liabilities for leases that previously were classified as operating leases and recognized as inflows of resources or outflows of resources based on the payment provisions of the contract. It establishes a single model for lease accounting based on the foundational principle that leases are financings of the right to use an underlying asset. Under this statement, a lessee is required to recognize a lease liability and an intangible right-to-use lease asset, and a lessor is required to recognize a lease receivable and a deferred inflow of resources, thereby enhancing the relevance and consistency of information about governments’ leasing activities. The requirements of this statement are effective for the fiscal year ending June 30, 2021. The Authority does not believe this statement will have a significant impact on the Authority’s financial statements.
29Agenda Packet Page 105
Silicon Valley Clean Water Notes to Financial Statements
June 30, 2019
GASB Statement No. 89, Accounting for Interest Cost Incurred Before the End of the Construction Period This Statement addresses interest costs incurred before the end of a construction period be recognized as an expense in the period in which the cost is incurred for financial statements prepared using the economic resources measurement focus. As a result, interest cost incurred before the end of a construction period will not be included in the historical cost of a capital asset reported in a business-type activity or enterprise fund. The requirements of this Statement are effective for financial statements for periods beginning after December 15, 2019. Earlier application is encouraged. The Authority does not believe this statement will have a significant impact on the Authority’s financial statements. GASB Statement No. 90, Majority Equity Interests The primary objectives of this Statement are to improve the consistency and comparability of reporting a government’s majority equity interest in a legally separate organization and to improve the relevance of financial statement information for certain component units. It defines a majority equity interest and specifies that a majority equity interest in a legally separate organization should be reported as an investment if a government’s holding of the equity interest meets the definition of an investment. This statement is effective for reporting periods beginning after December 15, 2018. The Authority does not believe this statement will have a significant impact on the Authority’s financial statements. GASB Statement No. 91, Conduit Debt Obligation GASB Statement No. 91 – In May 2019, GASB Issued Statement No. 91, Conduit Debt Obligation. The primary objectives of this Statement are to provide a single method of reporting conduit debt obligations by issuers and eliminate diversity in practice associated with (1) commitments extended by issuers, (2) arrangements associated with conduit debt obligations, and (3) related note disclosures. This Statement clarifies the existing definition of a conduit debt obligation; establishing that a conduit debt obligation is not a liability of the issuer; establishing standards for accounting and financial reporting of additional commitments and voluntary commitments extended by issuers and arrangements associated with conduit debt obligations; and improving required note disclosures. This Statement also addresses arrangements -often characterized as leases - that are associated with conduit debt obligations. This Statement is effective for reporting periods beginning after December 15, 2020. Earlier application is encouraged. The Authority has not yet determined its effect on the financial statements.
30Agenda Packet Page 106
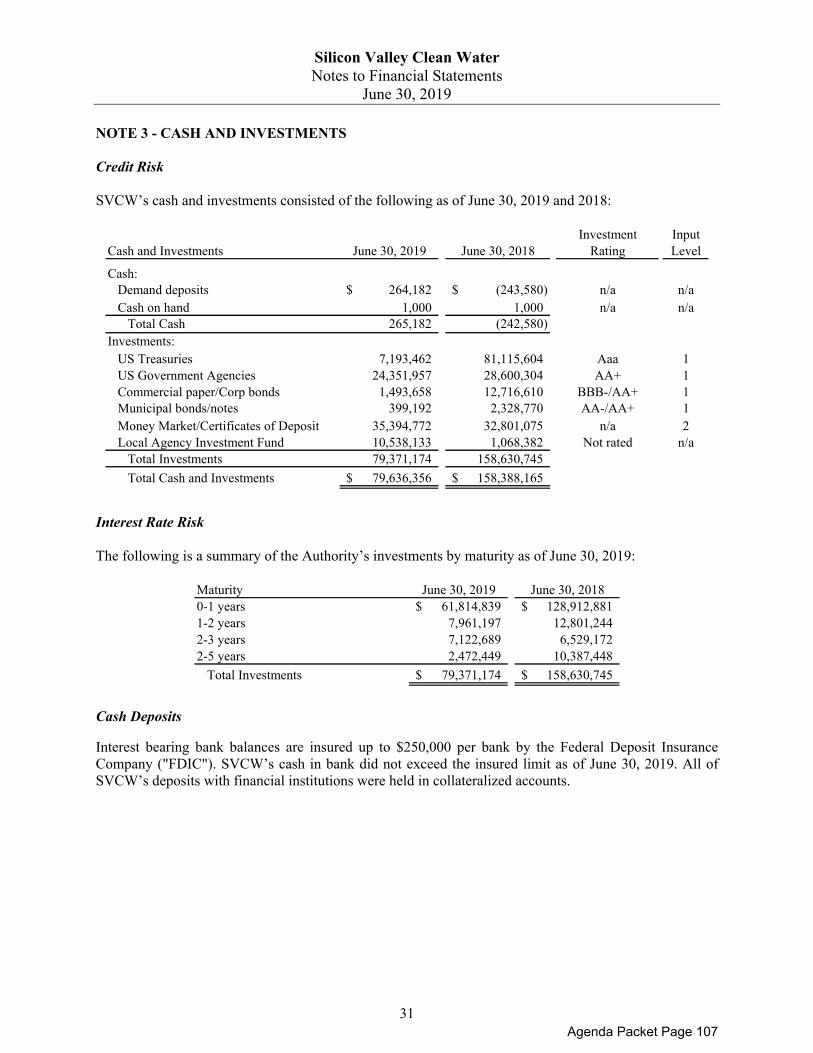
Silicon Valley Clean Water Notes to Financial Statements
June 30, 2019
NOTE 3 - CASH AND INVESTMENTS
Credit Risk
SVCW’s cash and investments consisted of the following as of June 30, 2019 and 2018:
Investment InputCash and Investments June 30, 2019 June 30, 2018 Rating Level
Cash:Demand deposits 264,182$ (243,580)$ n/a n/aCash on hand 1,000 1,000 n/a n/a
Total Cash 265,182 (242,580) Investments:
US Treasuries 7,193,462 81,115,604 Aaa 1US Government Agencies 24,351,957 28,600,304 AA+ 1Commercial paper/Corp bonds 1,493,658 12,716,610 BBB-/AA+ 1Municipal bonds/notes 399,192 2,328,770 AA-/AA+ 1Money Market/Certificates of Deposit 35,394,772 32,801,075 n/a 2Local Agency Investment Fund 10,538,133 1,068,382 Not rated n/a
Total Investments 79,371,174 158,630,745
Total Cash and Investments 79,636,356$ 158,388,165$
Interest Rate Risk
The following is a summary of the Authority’s investments by maturity as of June 30, 2019:
Maturity June 30, 2019 June 30, 20180-1 years 61,814,839$ 128,912,881$ 1-2 years 7,961,197 12,801,244 2-3 years 7,122,689 6,529,172 2-5 years 2,472,449 10,387,448
Total Investments 79,371,174$ 158,630,745$
Cash Deposits
Interest bearing bank balances are insured up to $250,000 per bank by the Federal Deposit Insurance Company ("FDIC"). SVCW’s cash in bank did not exceed the insured limit as of June 30, 2019. All of SVCW’s deposits with financial institutions were held in collateralized accounts.
31Agenda Packet Page 107

Silicon Valley Clean Water Notes to Financial Statements
June 30, 2019
Fair Value Measurements
GASB 72 established a hierarchy of inputs to the valuation techniques above. This hierarchy has three levels:
Level 1 inputs are quoted prices in active markets for identical assets or liabilities. Level 2 inputs are quoted market prices for similar assets or liabilities, quoted prices for identical
or similar assets or liabilities in markets that are not active, or other than quoted prices that arenot observable
Level 3 inputs are unobservable inputs, such as a property valuation or an appraisal.
Collateral and Categorization Requirements
The California Government Code requires California banks and savings and loan associations to secure an agency’s deposits by pledging government securities as collateral. The market value of pledged securities must equal at least 110% of an agency’s deposits. California law also allows financial institutions to secure an agency’s deposits by pledging first trust deed mortgage notes having a value of at least 150% of an agency’s total deposits.
Restricted Cash
SVCW's restricted cash consisted of $7,823,426 in cash and investments as of June 30, 2019 held by trustees or fiscal agent, all of which was pledged for the payment or security of bonds.
Local Agency Investment Fund
LAIF allows local agencies such as SVCW to participate in a Pooled Money Investment Account managed by the State Treasurer’s Office and overseen by the Pooled Money Investment Board and State Treasurer investment committee. The Local Agency Investment Advisory Board oversees LAIF. The investments with LAIF are not classified for credit risk due to their diverse nature and are stated at cost, which approximates fair value. The total amount invested by all public agencies in LAIF, as of June 30, 2019, was approximately $105.7 billion. Of that amount, 99.26% is invested in non-derivative financial products and 0.74% in structured notes and asset-backed securities.
32Agenda Packet Page 108

Silicon Valley Clean Water Notes to Financial Statements
June 30, 2019
Investment Policy
SVCW's investment guidelines as defined by its written investment policy were approved by the Commission, who also establishes its implementation and direction. Monthly, the Board ratifies the investments that have been made. SVCW’s investment policy follows the California Government Code which authorizes SVCW to invest in the following:
SVCW Maximum
Maximum Investment in Single
Authorized Investment Type Maturity Issuer U.S. Treasury Obligations on mortgage-backed/mortgage backed 11 years/10 years* 100%
U.S. Federal Agency and Government-Sponsored Enterprise Obligations non mortgage-backed/mortgage backed 11 years/10 years* 100% California State and Local Agency Obligations 11 years* 5% Other State Obligations 11 years* 5% Medium-Term Notes (Includes corporate and depository institution debt securities) 5 years 5% Bank (non-time) Depositis 5 years 100% California Local Agency Investment Fund (LAIF) N/A $65 million
Money Market Funds N/A 20% Shares of Joint Powers Authority N/A 100%
*U.S. Treasuries, U.S. Agencies, and State/Local Agency obligations measure maximum maturity asaverage remaining maturity at time of purchase.
Risk Disclosures
Limitations as they relate to interest rate risk, credit risk, and concentration of credit risk are described below:
Interest Rate Risk - Interest rate risk is the risk that changes in market interest rates will adverselyaffect the fair value of an investment. Generally, the longer the maturity of an investment, the greaterthe sensitivity of its fair value to the changes in market interest rates. In order to limit loss exposuredue to Interest Rate Risk, the investment policy limits the length of maturity of investments.
Credit Risk - Credit risk is the risk of loss due to the failure of the security issuer. This is measured bythe assignment of a rating by a nationally recognized statistical rating organization. In order to limitloss exposure due to Credit Risk, the investment policy limits purchases of investments to those ratedA-1 by Standard & Poor's or P-1 by Moody's Investors Service.
Custodial Credit Risk - Custodial credit risk is the risk that in the event of a bank failure, SVCW’sdeposits may not be returned to it. Or, in the case of investments, the risk of loss of the investmentdue failure, impairment or malfeasance of the third party whose name in which the investment is heldand who has physical possession of the instrument. In order to limit loss exposure due to CustodialCredit Risk, the investment policy requires all securities be received and delivered using the standarddelivery versus payment (DVP) procedure, and all securities be held by a third party bank or trustdepartment under the terms of a custody or trustee agreement. None of SVCW's investments weresubject to custodial credit risk.
33Agenda Packet Page 109

Silicon Valley Clean Water Notes to Financial Statements
June 30, 2019
• Concentration of Credit Risk - See the chart above for SVCW’s limitations on the amount that can beinvested in any one issuer. As of June 30, 2019, 13% of SVCW’s cash was invested in LAIF, 31% inagencies, 2% in commercial paper and corporate bonds, 1% in municipal bonds and notes, 44% inmoney market accounts, and 9% in U.S. treasuries.
NOTE 4 - EMPLOYEE NOTES RECEIVABLE
All full-time and part-time SVCW employees are eligible to obtain an interest-free loan to purchase a computer or certain tools. All requests for loans must be approved by the Department Manager and Human Resources Director. Repayment of these loans is handled through payroll deductions which are amortized over a two year period. Employees must pay off any outstanding balance of their loans upon ending employment with SVCW. As of June 30, 2019 and 2018, outstanding balances for notes receivable were $19,850 and $16,523, respectively.
NOTE 5 - CAPITAL ASSETS (PROPERTY, PLANT AND EQUIPMENT)
SVCW’s capital assets consisted of the following as of June 30, 2019:
Balance Adjustments/ BalanceCapital Assets July 01, 2018 Additions Deletions Transfer June 30, 2019Non-depreciable: Land 1,282,081$ -$ -$ -$ 1,282,081$
Construction in ProgressStage 2 2,934,618 - - - 2,934,618 General 128,605,638 118,110,915 - (2,368,539) 244,348,014 Total Non-Depreciable 132,822,337 118,110,915 - (2,368,539) 248,564,713
Depreciable: Buildings and structures 84,599,149 - - 163,804 84,762,953 Pipelines 55,151,004 - - 307,200 55,458,204 Pump station 7,175,591 - - 298,362 7,473,953 Machinery and equipment 92,427,359 - (113,260) 860,170 93,174,269 Total Depreciable 239,353,103 - (113,260) 1,629,536 240,869,379 Less Accumulated Depreciation for:
Buildings and structures (38,278,144) (2,601,768) - - (40,879,912) Pipelines (9,872,100) (1,711,732) - - (11,583,832) Pump station (5,663,883) (167,771) - - (5,831,654) Machinery and equipment (35,234,469) (4,545,167) 16,607 40,454 (39,722,575)
Total Accumulated Depreciation (89,048,596) (9,026,438) 16,607 40,454 (98,017,973) Total Depreciable PPE - Net 150,304,507 (9,026,438) (96,653) 1,669,990 142,851,406
Total PPE - Net 283,126,844$ 109,084,477$ (96,653)$ (698,549)$ 391,416,119$
Depreciation expense for the year ended June 30, 2019 and 2018 was $9,026,438 and $8,836,703, respectively.
34Agenda Packet Page 110

Silicon Valley Clean Water Notes to Financial Statements
June 30, 2019
NOTE 6 - NONCURRENT LIABILITIES
SVCW’s noncurrent liabilities consisted of the following as of June 30, 2019:
Debt Note Disclosure:Balance Balance Due Within
Description July 01, 2018 Additions Deductions June 30, 2019 One YearWastewater Revenue Bonds 268,295,000$ -$ 5,620,000$ 262,675,000$ 5,540,000$ Unamortized Premium 25,653,176 - 941,868 24,711,308 941,868 Note Payable (Direct Borrowing) 50,013,131 3,268,635 1,850,520 51,431,246 1,887,871 Line of Credit 55,000 - 55,000 - -Net OPEB Liability 1,000,631 - 724,060 276,571 -Net Pension Obligation 13,762,187 - 254,995 13,507,192 -Compensated Absences 821,934 111,109 - 933,043 933,043
Total Noncurrent Liabilities 359,601,059$ 3,379,744$ 9,446,443$ 353,534,360$ 9,302,782$
Wastewater Revenue Bonds
SVCW’s Wastewater revenue bonds consisted of the following as of June 30, 2019:
Bonds BondsIssue Maturity Interest Original Outstanding OutstandingDate Date Rate Issue July 01, 2018 Redeemed June 30, 2019
2009 Bond 2009 2039 1.74-8.1% 55,855,000$ 2,555,000$ 1,250,000$ 1,305,000$ 2014 Bond 2014 2044 3-5% 60,000,000 56,135,000 1,115,000 55,020,000 2015 Bond 2015 2045 2-5% 70,200,000 68,650,000 795,000 67,855,000 2018 Bond 2018 2049 3.125-5% 140,955,000 140,955,000 2,460,000 138,495,000
Total Wastewater Revenue Bonds 327,010,000$ 268,295,000$ 5,620,000$ 262,675,000$
Wastewater Revenue Bond
2009 Wastewater Revenue Bonds
In July 2009, SVCW issued $55,855,000 of Revenue Bonds. The Bonds were issued to finance the acquisition and construction of capital improvements to SVCW's wastewater system; fund the debt service reserve fund, and pay costs of issuing the Bonds. The Bonds are limited obligations of SVCW which are payable solely from and secured solely by the revenues pledged under the indenture, consisting primarily of payments made by the City of Redwood, the City of San Carlos, and the West Bay Sanitary District (the "Participating Members”). Annual principal and interest payments on the bonds are expected to require less than 10 percent of net revenues.
2014 Wastewater Revenue Bonds
In March 2014, SVCW issued $60,000,000 of Revenue Bonds. The Bonds were issued to finance the acquisition and construction of capital improvements to SVCW's wastewater system and pay costs of issuing the Bonds. The Bonds are limited obligations of SVCW which are payable solely from and secured solely by the revenues pledged under the indenture, consisting primarily of payments made by the City of Redwood, the City of San Carlos, and the West Bay Sanitary District (the "Participating Members”). Annual principal and interest payments on the bonds are expected to require less than 10 percent of net revenues.
35Agenda Packet Page 111

Silicon Valley Clean Water Notes to Financial Statements
June 30, 2019
2015 Wastewater Revenue Bonds Wastewater Revenue Bonds in the amount of $70,200,000 were executed on November 24, 2015. The funds were used to refund the Authority's current outstanding Wastewater Revenue Bonds captioned 2008 Wastewater Revenue Bonds and 2009 Build America Bonds, and to finance certain improvements to the Authority's wastewater treatment system. In conjunction with the issuance of the 2015 Wastewater Revenue Bonds and in accordance with the Authority's refunding plan, $53,246,823 was deposited with an escrow agent to provide for payment when due of all principal and interest with respect to the 2008 and 2009 refunded Bonds. The advance refunding resulted in a difference between the reacquisition price and the net carrying amount of the old debt of approximately $703,660. The difference, reported in the accompanying financial statements as a deduction from bonds payable, will be amortized over the useful life of the refunded bonds using the straight-line method. For financial reporting purposes, the refunded portion of the debt is considered defeased and therefore removed as a liability from these financial statements. As of June 30, 2019 there was $44,765,000 of defeased 2009 bonds outstanding, both to be paid from escrow funds. Interest is payable semi-annually on February 1st and August 1st of each year while principal payments are made on August 1st of each year commencing 2016, with interest rates ranging from 2% to 5%. These wastewater revenue bonds are secured by a pledge of Member revenues. 2018 Wastewater Revenue Bonds In February 2018, SVCW issued $140,955,000 in Revenue Bonds. The Bonds were issued to finance the acquisition and construction of capital improvements to SVCW's wastewater system and pay costs of issuing the Bonds. The Bonds are limited obligations of SVCW which are payable solely from and secured solely by the revenues pledged under the indenture, consisting primarily of payments made by the City of Redwood, the City of San Carlos, and the West Bay Sanitary District (the "Participating Members”). Annual principal and interest payments on the bonds are expected to require less than 10 percent of net revenues. The 2009, 2014, 2015 and 2018 Wastewater Revenue Bonds are general obligations of SVCW, payable solely from pledges of wastewater revenues from participating SVCW member agencies. The bond covenants contain events of default that require the revenue of SVCW to be applied by the Trustee as specified in the terms of the agreement if any of the following conditions occur: default on debt service payments; the failure of SVCW to observe or perform the conditions, covenants, or agreement terms of the debt; bankruptcy filing by SVCW; or if any court or competent jurisdiction shall assume custody or control of SVCW. No such events occurred during the fiscal year ending June 30, 2019.
36Agenda Packet Page 112

Silicon Valley Clean Water Notes to Financial Statements
June 30, 2019
Wastewater Revenue Bonds Debt Service
The debt service requirements for the bonds as of June 30, 2019 were as follows:
Interest toFiscal Year Principal Maturity Total
2020 5,540,000$ 13,456,840$ 18,996,840$ 2021 5,610,000 11,405,619 17,015,619 2022 5,890,000 11,119,619 17,009,619 2023 6,185,000 10,819,369 17,004,369 2024 6,500,000 10,503,869 17,003,869
2025-2029 37,720,000 47,203,969 84,923,969 2030-2034 45,285,000 36,996,894 82,281,894 2035-2039 55,420,000 26,014,384 81,434,384 2040-2044 55,660,000 13,923,237 69,583,237 2045-2049 38,865,000 3,537,363 42,402,363
Total 262,675,000$ 184,981,163$ 447,656,163$
Wastewater Revenue Bonds - Build America Bonds Refundable Credit
SVCW elected to treat the 2009 Wastewater Revenue Bonds as Build America Bonds under section 54AA of the Tax Code, which entitles it to a refundable credit from the United States Treasury equal to 35% of the interest payable on the bonds. Since March 2013, the Internal Revenue Service has reduced the refundable credit amounts by imposing sequestration rates. The sequestration rate from October 1, 2018 to September 30, 2019, the sequestration rate was 6.2%. The credit is reported as member contributions. The 2019 credit received by SVCW totaled $1,198,925.
Notes Payable (Direct Borrowing)
SVCW has financed multiple projects by entering into three separate sale-repurchase agreements with the State Water Resources Control Board (SWRCB). Combined, these notes payable totaled $51,431,246 as of June 30, 2019. The project funds, together with all accrued interest, are repaid in annual installments commencing one year after the completion of construction.
In August 2011, SVCW secured SWRCB funding for the construction of an administration and plant control building. The SWRCB reimbursed SVCW for project-related expenditures as incurred, and the outstanding liability was $8,620,700 as of June 30, 2019. This amount is scheduled to be fully repaid by June 2033.
In March 2012, SVCW entered a similar agreement with the SWRCB for up to $35,385,953 for certain improvements to the wastewater treatment plant. The SWRCB reimbursed SVCW for project-related expenditures as incurred, and the outstanding liability was $28,810,546 as of June 30, 2019. This amount will be repaid by October 2036.
37Agenda Packet Page 113

Silicon Valley Clean Water Notes to Financial Statements
June 30, 2019
In February 2016, SVCW entered a similar agreement with the SWRCB for up to $14,000,000 to plan and design certain improvements to the conveyance system. As of June 30, 2019, SVCW had incurred $14,000,000 in expenditures. This planning is scheduled to be completed in fiscal year 2018-19 and the total incurred expenditures will either be repaid by September 2028 or combined into a subsequent construction loan. The SWRCB has not established the debt service payments for the entirety of the expenditures incurred by SVCW. The following summarizes the scheduled future debt service requirements for the SWRCB loans as of June 30, 2019:
Notes Payable
Interest to
Fiscal Year Principal Maturity Total
2020 1,887,870$ 742,728$ 2,630,599$
2021 1,925,999 704,599 2,630,599$
2022 1,964,922 665,677 2,630,599$
2023 2,004,656 625,943 2,630,599$
2024 2,045,218 585,380 2,630,599$
2025-2029 10,864,810 2,288,183 13,152,993$
2030-2034 11,271,439 1,139,052 12,410,491$
2035-2039 5,466,333 197,958 5,664,291$
Total 37,431,246$ 6,949,521$ 44,380,767$
Line of Credit
SVCW has a $35,000,000 line of credit with Wells Fargo Bank. Advances on the line of credit provide for an interest rate based on either a fixed per annum rate of interest equal to the LIBOR rate plus the Applicable LIBOR Rate Margin, or a variable per annum rate of interest equal to the Base Rate plus the Applicable Base Rate Margin. SVCW had zero outstanding on the line of credit at June 30, 2019.
NOTE 7 - INTERFUND TRANSACTIONS
Interfund transactions are reported as either loans, services provided, reimbursements, or transfers. Loans are reported as interfund receivables and payables, as appropriate, and are subject to elimination upon consolidation. Services provided, deemed to be at market or near market rates, are treated as revenues and expenditures/expenses. Reimbursements occur when one fund incurs a cost, charges the appropriate benefiting fund, and reduces its related cost as a reimbursement. All other interfund transactions are treated as transfers. Transfers among proprietary funds are netted as part of the reconciliation to the government-wide financial statements.
38Agenda Packet Page 114

Silicon Valley Clean Water Notes to Financial Statements
June 30, 2019
Interfund Due-to/from
Interfund receivables and payables as of June 30, 2019 were as follows:
Fund Description Due From Due ToOperations 953,045$ 4,516,700$ Capital Improvement Program 4,658,944 -Recycled Water - 11,126 Self Insurance 186,780 -Construction Stage 2 886,168 -Capital Improvements 6,308,747 -Capital Improvement Program Reserve - 11,700,932 Operating Reserve 3,235,074 -
Totals 16,228,758$ 16,228,758$
Interfund Transfers
Interfund transfers consist of transfers from funds receiving revenue to funds through which the resources are to be expended and transfers of capital assets upon completion of construction. Interfund transfers for the June 30, 2019 fiscal year were as follows:
Fund Description Transfers In Transfers Out
Operations 1,629,537$ -$
Capital Improvement Program - 740,905
Capital Improvements - 888,632
Totals 1,629,537$ 1,629,537$
NOTE 8 - DEFINED BENEFIT PENSION PLAN
General Information about the Pension Plans
Plan Description - All qualified permanent and probationary employees are eligible to participate in the Agency’s Miscellaneous Employee Pension Plans (the Plans); cost-sharing multiple employer defined benefit pension plans administered by the California Public Employees’ Retirement System (CalPERS). Benefit provisions under the Plans are established by State statute and Agency resolution. CalPERS issues publicly available reports that include a full description of the pension plans regarding benefit provisions, assumptions and membership information that can be found on the CalPERS website.
39Agenda Packet Page 115

Silicon Valley Clean Water Notes to Financial Statements
June 30, 2019
Benefits Provided - CalPERS provides service retirement and disability benefits, annual cost of living adjustments and death benefits to plan members, who must be public employees and beneficiaries. Benefits are based on years of credited service, equal to one year of full time employment. Members with five years of total service are eligible to retire at age 50 with statutorily reduced benefits. All members are eligible for non-duty disability benefits after 10 years of service. The death benefit is one of the following: the Basic Death Benefit, the 1957 Survivor Benefit, or the Optional Settlement 2W Death Benefit. The cost of living adjustments for the Plans are applied as specified by the Public Employees’ Retirement Law. The Plans’ provisions and benefits in effect at June 30, 2017, are summarized as follows:
Tier 1 Tier 2 Tier 3Hire date Prior to 7/1/11 7/1/11 to 12/31/12 On/After 1/1/13Benefit formula 2% @ 55 2% @ 60 2% @ 62Benefit vesting schedule 5 Years 5 Years 5 YearsBenefit payments Monthly for Life Monthly for Life Monthly for LifeRetirement age 55 60 62Monthly benefits as a % of eligible compensation 2.0% to 2.42% 2.000% 2.000%
Required employee contribution rates 7.000% 7.000% 6.250%
Required employer contribution rates 17.800% 7.821% 7.183%
Miscellaneous
Employees Covered - At June 30, 2019, the following employees were covered by the benefit terms for
the Plans:
MiscellaneousActive 82 Transferred 22 Separated 24 Retired 76
Total 204
Contributions - Section 20814(c) of the California Public Employees’ Retirement Law requires that the employer contribution rates for all public employers be determined on an annual basis by the actuary and shall be effective on the July 1 following notice of a change in the rate. Funding contributions for the Plans are determined annually on an actuarial basis as of June 30 by CalPERS. The actuarially determined rates are the estimated amount necessary to finance the costs of benefits earned by employees during the year, with an additional amount to finance any unfunded accrued liability. The Agency is required to contribute the difference between the actuarially determined rate and the contribution rate of employees.
40Agenda Packet Page 116

Silicon Valley Clean Water Notes to Financial Statements
June 30, 2019
For the year ended June 30, 2019, SVCW contributed $1,612,511 into the Plans.
Pension Liabilities, Pension Expenses and Deferred Outflows/Inflows of Resources Related to Pensions
As of June 30, 2019, the Agency reported net pension liabilities for its proportionate shares of the net pension liability was $13,507,192.
The Agency’s net pension liability for the Plans is measured as the proportionate share of the net pension liability. The net pension liability of the Plan are measured as of June 30, 2018, and the total pension liability for the Plans used to calculate the net pension liability was determined by an actuarial valuation as of June 30, 2017 rolled forward to June 30, 2018 using standard update procedures. The Agency’s proportion of the net pension liability was based on a projection of the Agency’s long-term share of contributions to the pension plans relative to the projected contributions of all participating employers, actuarially determined. The Agency’s proportionate share of the net pension liability for the Plans as of June 30, 2018 and 2019 was as follows:
Miscellaneous Safety TotalProportion - June 30, 2018 0.34911% 0.00000% 0.13877%Proportion - June 30, 2019 0.37832% 0.00000% 0.14170%Change - Increase/(Decrease) 0.02921% 0.00000% 0.00293%
For the year ended June 30, 2019, the Agency recognized pension expense of $1,945,925. At June 30, 2019, the Agency reported deferred outflows of resources and deferred inflows of resources related to pensions from the following sources:
Deferred Outflows of Resources
Deferred Inflows of Resources
Changes of Assumptions 1,539,860$ (377,390)$ Differences between Expected and Actual Experience 518,247 (176,356) Differences between Projected and Actual Investment Earnings 66,776 -Differences between Employer's Contributions and Proportionate Share of Contributions - (653,379)Change in Employer's Proportion 683,847 Pension Contributions Made Subsequent to Measurement Date 1,612,511 -Total 4,421,241$ (1,207,125)$
The Agency reported $1,612,511 as deferred outflows of resources related to contributions subsequent to the measurement date that will be recognized as a reduction of the net pension liability in the year ended June 30, 2020.
41Agenda Packet Page 117

Silicon Valley Clean Water Notes to Financial Statements
June 30, 2019
Other amounts reported as deferred outflows of resources and deferred inflows of resources related to pensions will be recognized as pension expense as follows:
1,319,385$ 772,524
(368,815) (121,489)
1,601,605$
Fiscal Year Ending June 30:
Total
Annual Amortization
2020202120222023
Actuarial Assumptions - The total pension liabilities in the June 30, 2017 actuarial valuations were determined using the following actuarial assumptions:
Valuation Date June 30, 2017
Measurement Date June 30, 2018Actuarial Cost Method Entry-Age Normal Cost
MethodActuarial Assumptions:
Discount Rate 7.15%
Inflation 2.65%
Payroll Growth 2.75%
Projected Salary Increase 3.2%-12.2% (2)
Investment Rate of Return 7.5
Mortality
Derived using CalPERS Membership Data for all
Funds (4)
Contract COLA up to 2.00% until
Purchasing Power Protection Allowance
Floor on Purchasing Power applies 2.50%
Post Retirement Benefit Increase thereafter
(1) Actuarial assumptions are the same for all benefit tiers (Classic Tier 1, Classic Tier II, and
PEPRA)
(2) Depending on age, service and type of employment
(3) Net of pension plan investment expenses, including inflation
(4) The mortality table used was developed based on CalPERS' specific data. The table
includes 15 years of mortality improvements using Society of Actuaries Scale 90% of
scale MP 2016. For more details on this table, please refer to the CalPERS December 2017
experience study report available on CalPERS website.
42Agenda Packet Page 118

Silicon Valley Clean Water Notes to Financial Statements
June 30, 2019
Discount Rate - The discount rate used to measure the total pension liability was 7.15 percent for the Plan. To determine whether the municipal bond rate should be used in the calculation of a discount rate for the Plan, CalPERS stress tested plans that would most likely result in a discount rate that would be different from the actuarially assumed discount rate. Based on the testing, none of the tested plans run out of assets. Therefore, the current 7.15 percent discount rate is adequate and the use of the municipal bond rate calculation is not necessary. The long term expected discount rate of 7.15 percent will be applied to all plans in the Public Employees Retirement Fund (PERF). The stress test results are presented in a detailed report that can be obtained from the CalPERS website. The long-term expected rate of return on pension plan investments was determined using a building-block method in which best-estimate ranges of expected future real rates of return (expected returns, net of pension plan investment expense and inflation) are developed for each major asset class.
In determining the long-term expected rate of return, CalPERS took into account both short-term and long-term market return expectations as well as the expected pension fund cash flows. Using historical returns of all the funds’ asset classes, expected compound returns were calculated over the short-term (first 10 years) and the long-term (11-60 years) using a building-block approach. Using the expected nominal returns for both short-term and long-term, the present value of benefits was calculated for each fund. The expected rate of return was set by calculating the single equivalent expected return that arrived at the same present value of benefits for cash flows as the one calculated using both short-term and long-term returns. The expected rate of return was then set equivalent to the single equivalent rate calculated above and rounded down to the nearest one quarter of one percent.
The table below reflects the long-term expected real rate of return by asset class. The rate of return was calculated using the capital market assumptions applied to determine the discount rate and asset allocation. These rates of return are net of administrative expenses.
CurrentTarget Real Return Real Return
Asset Class (a) Allocation Years 1 - 10 (b) Years 11+ (c)
Global Equity 50.00% 4.80% 5.90%Fixed Income 28.00% 1.00% 2.62%Inflation Assets 0.00% 0.77% 1.81%Private Equity 8.00% 6.30% 7.23%Real Assets 13.00% 3.75% 4.93%Liquidity 1.00% 0.00% -0.92%Total 100.00%
(a) In the CalPERS CAFR, Fixed Income is included in Global Debt Securities;Liquidity is included in Short-term Investments; Inflation Assets are includedin both Global Equity Securities and Global Debt Securities.(b) An expected inflation of 2.0% used for this period.(c) An expected inflation of 2.92% used for this period.
43Agenda Packet Page 119

Silicon Valley Clean Water Notes to Financial Statements
June 30, 2019
Sensitivity of the Proportionate Share of the Net Pension Liability to Changes in the Discount
Rate - The following presents the Agency’s proportionate share of the net pension liability for the Plans, calculated using the discount rate for the Plans, as well as what the Agency’s proportionate share of the net pension liability would be if it were calculated using a discount rate that is 1-percentage point lower or 1-percentage point higher than the current rate:
Miscellaneous1% Decrease 6.15%Net Pension Liability 22,151,373$
Current 7.15%Net Pension Liability 13,507,192$
1% Increase 8.15%Net Pension Liability 6,371,562$
Pension Plan Fiduciary Net Position - Detailed information about each pension plan’s fiduciary net position is available in the separately issued CalPERS financial reports.
NOTE 9 - OTHER POST EMPLOYMENT BENEFITS (OPEB)
Plan Description
SVCW’s Retiree Healthcare Plan (the Plan) is a single-employer defined benefit healthcare plan administered by SVCW. The plan provides healthcare benefits to eligible retirees and their dependents. Benefit provisions are established and may be amended through agreements and memorandums of understanding between SVCW, its management employees, and unions representing SVCW employees.
Benefits
Following is a description of the current retiree benefit plan. The following table describes benefits available to those hired prior to January 30, 2011. Employees hired on or after this date are entitled only to statutory minimum benefits under sections of the Government Code collectively known as PEMHCA (Public Employees’ Medical and Hospital Care Act).
All Non-Represented Employees
Operating Engineers
Benefits Provided: Medical Only Medical Only
Duration of Benefits: Lifetime LifetimeRequired Services: Retirement under
CalPERSRetirement under
CalPERS
Minimum Age: Retirement under CalPERS
Retirement under CalPERS
Dependent Coverage: Yes YesContribution Percentage: 100% to cap 100% to capCap: Bay Area Kaiser
RateBay Area Kaiser
Rate
44Agenda Packet Page 120

Silicon Valley Clean Water Notes to Financial Statements
June 30, 2019
Employees Covered by Benefit Terms At June 30, 2018 (the valuation date), the benefit terms covered the following employees:
Active employees 82 Inactive employees 37 Total employees 119
Contributions The Authority makes contributions based on an actuarially determined rate and are approved by the authority of the Authority’s Board. Total contributions during the year were $841,064. Total contributions included in the measurement period were $763,957. The actuarially determined contribution for the measurement period was $74,614. The Authority’s contributions were 6.86% of payroll during the fiscal year ended June 30, 2019. Employees are not required to contribute to the plan. Actuarial Assumptions The following summarized the actuarial assumptions for the OPEB plan included in this fiscal year:
Valuation Date: June 30, 2017Measurement Date: June 30, 2018Actuarial Cost Method: Entry-Age Normal
Cost Method
Amortization Period: 20 yearsAsset Valuation Method:Actuarial Assumptions:
Discount Rate 7.00%Inflation 2.75%Salary Increases 2.75%Healthcare Trend RateInvestment Rate of ReturnMortalityRetirement
Rx PA Misc 2% @ 62 min age 52
Level percentage of payroll, closed
7.00%2014 CalPERS Active Mortality for Misc.Rx PA Misc 2% @ 55Rx PA Misc 2% @ 60
4.00%
Discount Rate The projection of cash flows used to determine the discount rate assumed that the Authority contribution will be made at rates equal to the actuarially determined contribution rates. Based on those assumptions, the OPEB plan's fiduciary net position was projected to cover all future OPEB payments. Therefore, the discount rate was set to be equal to the long-term expected rate of return which was applied to all periods of projected benefit payments to determine the total OPEB liability.
45Agenda Packet Page 121
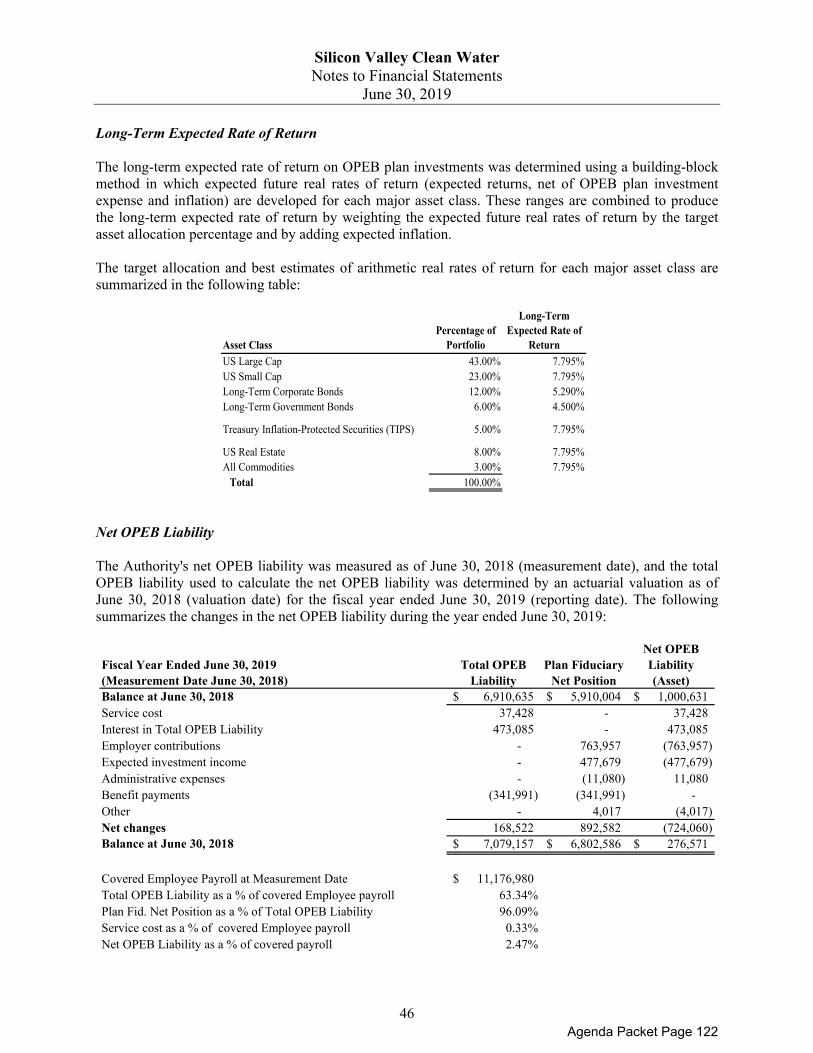
Silicon Valley Clean Water Notes to Financial Statements
June 30, 2019
Long-Term Expected Rate of Return
The long-term expected rate of return on OPEB plan investments was determined using a building-block method in which expected future real rates of return (expected returns, net of OPEB plan investment expense and inflation) are developed for each major asset class. These ranges are combined to produce the long-term expected rate of return by weighting the expected future real rates of return by the target asset allocation percentage and by adding expected inflation.
The target allocation and best estimates of arithmetic real rates of return for each major asset class are summarized in the following table:
Asset ClassPercentage of
Portfolio
Long-Term Expected Rate of
Return
US Large Cap 43.00% 7.795%US Small Cap 23.00% 7.795%Long-Term Corporate Bonds 12.00% 5.290%Long-Term Government Bonds 6.00% 4.500%
Treasury Inflation-Protected Securities (TIPS) 5.00% 7.795%
US Real Estate 8.00% 7.795%All Commodities 3.00% 7.795%
Total 100.00%
Net OPEB Liability
The Authority's net OPEB liability was measured as of June 30, 2018 (measurement date), and the total OPEB liability used to calculate the net OPEB liability was determined by an actuarial valuation as of June 30, 2018 (valuation date) for the fiscal year ended June 30, 2019 (reporting date). The following summarizes the changes in the net OPEB liability during the year ended June 30, 2019:
Fiscal Year Ended June 30, 2019(Measurement Date June 30, 2018)
Total OPEB Liability
Plan Fiduciary Net Position
Net OPEB Liability (Asset)
Balance at June 30, 2018 6,910,635$ 5,910,004$ 1,000,631$ Service cost 37,428 - 37,428Interest in Total OPEB Liability 473,085 - 473,085Employer contributions - 763,957 (763,957) Expected investment income - 477,679 (477,679) Administrative expenses - (11,080) 11,080 Benefit payments (341,991) (341,991) - Other - 4,017 (4,017) Net changes 168,522 892,582 (724,060) Balance at June 30, 2018 7,079,157$ 6,802,586$ 276,571$
Covered Employee Payroll at Measurement Date 11,176,980$ Total OPEB Liability as a % of covered Employee payroll 63.34%Plan Fid. Net Position as a % of Total OPEB Liability 96.09%Service cost as a % of covered Employee payroll 0.33%Net OPEB Liability as a % of covered payroll 2.47%
46Agenda Packet Page 122

Silicon Valley Clean Water Notes to Financial Statements
June 30, 2019
Deferred Inflows and Outflows of Resources
At June 30, 2019, the Authority reported deferred outflows of resources and deferred inflows of resources related to OPEB from the following sources:
Deferred Outflows of Resources
Deferred Inflows of Resources
Difference between actual and expected experience -$ -$ Difference between actual and expected earnings - (39,733) Change in assumptions - -OPEB contribution subsequent to measurement date 841,064 - Totals 841,064$ (39,733)$
The total $841,064 reported as deferred outflows of resources related to OPEB was from Authority contributions subsequent to the measurement date and before the end of the fiscal year and will be included as a reduction of the net OPEB liability in the year ended June 30, 2020.
OPEB Expense
The following summarizes the OPEB expense by source during the year ended June 30, 2019:
Service cost 37,428$ Interest in TOL 473,085 Expected investment income (428,012)
Difference between actual and expected earnings (9,933) Other (PPA of FNP, Per Actuary) (4,017) Administrative expenses 11,080 OPEB Expense 79,631$
The following summarizes changes in the net OPEB liability as reconciled to OPEB expense during the year ended June 30, 2019:
276,571$ (1,000,631)
(724,060) Employer contributions and implicit subsidy 763,958 OPEB Expense 79,631$
Net OPEB liability endingNet OPEB liability beginingChange in net OPEB liability
47Agenda Packet Page 123

Silicon Valley Clean Water Notes to Financial Statements
June 30, 2019
Sensitivity to Changes in the Discount Rate
The net OPEB liability of the Authority, as well as what the Authority's net OPEB liability would be if it were calculated using a discount rate that is one percentage point lower or one percentage point higher, is as follows:
6.0%(1% Decrease )
7.0%(Current Rate)
8.0%(1% Increase )
Net OPEB Liability (Asset) 1,208,121$ 276,571$ (478,547)$
Discount Rate
Sensitivity to Changes in the Healthcare Cost Trend Rates
The net OPEB liability of the Authority, as well as what the Authority's net OPEB liability would be if it were calculated using healthcare cost trend rates that are one percentage point lower or one percentage point higher than current healthcare cost trend rates, is as follows:
3.0%(1% Decrease )
4.0%(Current Rate)
5.0%(1% Increase )
Net OPEB Liability (Asset) (566,411)$ 278,537$ 1,305,792$
Trend Rate
NOTE 10 - RISK MANAGEMENT
SVCW is a member of the California Sanitation Risk Management Authority (CSRMA) which covers the general liability claims up to $15,500,000 and provides coverage of Employment Practices Liability (EPL) up to $15,500,000. Excess public entity general liability insurance of $10,000,000 is obtained by CSRMA commercially, resulting in a total coverage of $25,500,000. SVCW has a self-insured retention of $10,000 per general liability claim and $25,000 per EPL claim. Once SVCW's self-insured retention is met, CSRMA becomes responsible for payment of all claims up to the limit.
SVCW also has workers’ compensation insurance with CSRMA which covers workers' compensation claims up to $750,000. Excess public entity workers' compensation and third party liability insurance are obtained by CSRMA commercially up to statutory limit and $25,500,000 respectively. SVCW has a self-insured retention of $750,000 per claim.
The contributions made to each risk pool equal the ratio of their respective payrolls to the total payrolls of all entities participating in the same layer of each program, in each program year. Actual surpluses or losses are shared according to a formula developed from overall loss costs and spread to member entities on a percentage basis after retrospective rating. CSRMA's audited financial statements may be obtained by writing them at c/o Alliant Insurance Services, 100 Pine Street, 11th Floor, San Francisco, CA 94111.
48Agenda Packet Page 124

Silicon Valley Clean Water Notes to Financial Statements
June 30, 2019
NOTE 11 - COMMITMENTS AND CONTINGENCIES
SVCW is at risk to be a defendant in various lawsuits which arise in the normal course of business. The final disposition of these legal actions ad claims was not determinable. However, in the opinion of management, the outcome of any litigation of these matters will not have a material effect on the financial position or changes in net position of the SVCW.
SVCW had outstanding construction contract commitments on capital projects totaling $251,177,566 at June 30, 2019.
SVCW has a month to month operating lease with San Mateo County for use of real property to facilitate construction activities for the 63” Forcemain Reliability Improvement Project. The monthly rent is $97,300 per month with five option years totaling $5,838,000. SVCW also has a lease with West Bay Sanitary District for $300,000 per year subject to annual CPI increases, for a Flow Equalization facility. Rent expense was $1,505,233 during the year for two lease agreements.
49Agenda Packet Page 125

This Page Left Intentionally Blank
Agenda Packet Page 126

REQUIRED SUPPLEMENTARY INFORMATION
51Agenda Packet Page 127

Silicon Valley Clean WaterCost Sharing Multiple Employers PlanSchedule of Contributions -CalPERS
Last 10 Fiscal Years
Fiscal Year Ended 2019 2018 2017 2016 2015
Contractually Required Contributions 1,612,511$ 1,470,709$ 1,251,217$ 1,130,159$ 1,033,248$ Contributions in Relation to Contractually Required Contributions 1,612,511 1,470,709 1,251,217 1,130,159 1,033,248 Contribution Deficiency (Excess) -$ -$ -$ -$ -$
Covered Payroll 11,073,314$ 11,882,052$ 10,137,714$ 9,454,067$ 9,115,492$
Contributions as a Percentage of Covered Payroll 14.56% 12.38% 12.34% 11.95% 11.34%
Notes to Schedule:Valuation Date: June 30, 2017Assumptions Used: Entry Age Method used for Actuarial Cost Method
Level Percentage of Payroll and Direct Rate Smoothing3.8 Years Remaining Amortization PeriodInflation Assumed at 2.50%Investment Rate of Returns set at 7.15%CalPERS mortality table using 15 years of membership data for all funds
** Fiscal year 2015 was the first year of implementation, therefore only four years are shown.
52Agenda Packet Page 128

Silicon Valley Clean WaterCost Sharing Multiple Employers Plan
Schedule of Proportionate Share of Net Pension LiabilityLast 10 Fiscal Years
Miscellaneous PlanFiscal Year Ended 2019 2018 2017 2016 2015
Proportion of Net Pension Liability 0.35840% 0.34911% 0.33211% 0.30498% 0.32474%Proportionate Share of Net Pension Liability 13,507,192$ 13,762,187$ 11,536,951$ 8,367,040$ 8,025,843$ Covered Payroll 11,882,052$ 10,137,714$ 9,454,067$ 9,115,492$ 8,842,027$
Proportionate Share of NPL as a % of Covered Payroll 113.68% 135.75% 122.03% 91.79% 90.77%
Plan's Fiduciary Net Position as a % of the TPL 76.53% 77.31% 78.40% 83.30% 83.03%
** Fiscal year 2015 was the first year of implementation, therefore only four years are shown.
53Agenda Packet Page 129

Silicon Valley Clean WaterSingle Employer Plan
Schedule of OPEB ContributionsFor the Fiscal Year Ended June 30, 2019
Fiscal Year Ended June 30,2018 2019
Actuarially determined contribution (ADC) 135,456$ 74,614$ Less: actual contribution in relation to ADC (763,957) (841,064) Contribution deficiency (excess) (628,501)$ (766,450)$
Covered payroll for the fiscal year 11,176,980$ 12,259,105$ Contributions as a percentage of covered payroll 6.84% 6.86%
Notes to Schedule:Assumptions and MethodsValuation Date:
Measurement Date:Actuarial Cost Method:
Amortization Period:
Asset Valuation Method:
Actuarial Assumptions:Discount RateInflationSalary IncreasesHealthcare Trend RateInvestment Rate of ReturnMortalityRetirement
Other Notes
June 30, 2017
June 30, 2018
Entry-Age Normal Cost
20 years
GASB 75 requires a schedule of contributions for the last ten fiscal years, or for as many years as are available if less than ten years are available. GASB 75 was adopted as of June 30, 2018.
Level percentage of payroll, closed
Rx PA Misc 2% @ 60Rx PA Misc 2% @ 552014 CalPERS Active 7.00%4.00%
Rx PA Misc 2% @ 62
7.00%2.75%2.75%
54Agenda Packet Page 130

Silicon Valley Clean WaterSingle Employer Plan
Schedule of Net OPEB LiabilityFor the Fiscal Year Ended June 30, 2019
Fiscal Year Ended June 30,Total OPEB liability 2018 2019
Service cost 36,426$ 37,428$Interest 461,630 473,085Changes of benefit terms - -Differences between expected and actual experience - -Changes of assumptions - -Benefit payments (328,838) (341,991) Implicit subsidy fulfilled - -
Net change in Total OPEB Liability 169,218 168,522Total OPEB Liability - beginning 6,741,417 6,910,635Total OPEB Liability - ending 6,910,635$ 7,079,157$
Plan fiduciary net positionEmployer contributions 748,838$ 763,957$Employer implicit subsidy - -Employee contributions - -Net investment income 547,183 477,679Difference between estimated and actual earnings - -Benefit payments (328,838) (341,991) Implicit subsidy fulfilled - -Other - 4,017Administrative expense (4,578) (11,080)
Net change in plan fiduciary net position 962,605 892,582Plan fiduciary net position - beginning 4,947,399 5,910,004Plan fiduciary net position - ending 5,910,004$ 6,802,586$
Net OPEB liability (asset) 1,000,631$ 276,571$
Plan fiduciary net position as a percentage of the total OPEB liability 85.52% 96%
Covered employee payroll for the plan 10,877,839$ 11,176,980$
Net OPEB Liability as a percentage of covered Employee payroll 9.20% 2.47%
Total OPEB Liability as a percentage of covered Employee payroll 63.53% 63.34%
or for as many years as are available if less than ten years are available. GASB 75 was adopted as of June 30, 2018.
GASB 75 requires a schedule of contributions for the last ten fiscal years,
55Agenda Packet Page 131

This Page Left Intentionally Blank
Agenda Packet Page 132

SUPPLEMENTARY INFORMATION
57Agenda Packet Page 133

Silicon Valley Clean WaterCombining Schedule of Net Position
Enterprise FundsJune 30, 2019
CapitalImprovement
Operating Program Capital ConstructionAssets Reserve Reserve Improvements Stage 2Current Assets:
Cash and investments 3,614,865$ 16,094,697$ -$ 12,023,851$ Cash restricted for debt service - 2,630,598 - - Accounts receivable - - - 862,367 Interest receivable - - - - Employee notes receivable - - - - Due from other funds 3,235,074 - 6,308,747 886,168 Inventory - - - - Prepaid expenses - - - -
Total Current Assets 6,849,939 18,725,295 6,308,747 13,772,386 Noncurrent Assets:
Property held for resale - - - - Capital assets:
Depreciable capital assets - net - - - - Non depreciable capital assets:
Land - - - - Construction in progress:
Stage 2 - - - 2,934,618 General - - 2,863,071 -
Total capital assets - net - - 2,863,071 2,934,618 Total Noncurrent Assets - - 2,863,071 2,934,618
Total Assets 6,849,939$ 18,725,295$ 9,171,818$ 16,707,004$
Deferred Outflows of ResourcesPension adjustments -$ -$ -$ -$ OPEB adjustments - - - - Deferred Loss on Defeasance - - - -
Total Deferred Outflows of Resources -$ -$ -$ -$
LiabilitiesCurrent Liabilities:
Accounts payable -$ -$ 84,902$ -$ Accrued payroll and employee benefits - - - - Accrued interest payable - - - - Due to other funds - 11,700,932 - - Unearned revenue 414 7,875 13,264 - Noncurrent liabilities due within one year - - - -
Total Current Liabilities 414 11,708,807 98,166 - Noncurrent liabilities due in more than one year - - - -
Total Liabilities 414$ 11,708,807$ 98,166$ -$
Deferred inflows of ResourcesPension adjustments -$ -$ -$ -$ OPEB adjustments - - - -
Total Deferred Inflows of Resources -$ -$ -$ -$
Net PositionNet Investment in Capital Assets -$ -$ 2,863,071$ 2,934,618$ Restricted for:
Debt service - 2,630,598 - - Capital projects - - - - Retiree health benefits - - - -
Unrestricted 6,849,525 4,385,890 6,210,581 13,772,386 Total Net Position 6,849,525$ 7,016,488$ 9,073,652$ 16,707,004$
(Continued)
58Agenda Packet Page 134

AssetsCurrent Assets:
Cash and investmentsCash restricted for debt serviceAccounts receivableInterest receivableEmployee notes receivableDue from other fundsInventoryPrepaid expenses
Total Current AssetsNoncurrent Assets:
Property held for resaleCapital assets: Depreciable capital assets - net Non depreciable capital assets: Land Construction in progress:
Stage 2 General
Total capital assets - net Total Noncurrent Assets
Total Assets
Deferred Outflows of ResourcesPension adjustmentsOPEB adjustmentsDeferred Loss on Defeasance
Total Deferred Outflows of Resources
LiabilitiesCurrent Liabilities:
Accounts payableAccrued payroll and employee benefitsAccrued interest payableDue to other fundsUnearned revenueNoncurrent liabilities due within one year
Total Current LiabilitiesNoncurrent liabilities due in more than one year
Total Liabilities
Deferred inflows of ResourcesPension adjustmentsOPEB adjustments Total Deferred Inflows of Resources
Net PositionNet Investment in Capital AssetsRestricted for:
Debt serviceCapital projectsRetiree health benefits
UnrestrictedTotal Net Position
Silicon Valley Clean WaterCombining Schedule of Net Position
Enterprise FundsJune 30, 2019
CapitalSelf Recycled Improvement
Insurance Water Program Operation Total
-$ -$ 29,258,163$ 10,821,354$ 71,812,930$ - - 5,192,828 - 7,823,426 - 61,375 610,000 403,556 1,937,298 - - 495,390 21,685 517,075 - - - 19,850 19,850
186,780 - 4,658,944 953,045 16,228,758 - - - 2,095,290 2,095,290 - - - 423,325 423,325
186,780 61,375 40,215,325 14,738,105 100,857,952
- - 3,289,065 - 3,289,065
- - - 142,851,406 142,851,406
- - - 1,282,081 1,282,081
- - - - 2,934,618 - - 241,484,943 - 244,348,014 - - 241,484,943 144,133,487 391,416,119 - - 244,774,008 144,133,487 394,705,184
186,780$ 61,375$ 284,989,333$ 158,871,592$ 495,563,136$
-$ -$ -$ 4,421,241$ 4,421,241$ - - - 841,064 841,064 - - 348,829 - 348,829 -$ -$ 348,829$ 5,262,305$ 5,611,134$
-$ 22,791$ 16,987,571$ 761,572$ 17,856,836$ - 20 - 882,289 882,309 - - 6,391,797 - 6,391,797 - 11,126 - 4,516,700 16,228,758 - - - 250,350 271,903 - - 8,369,739 933,043 9,302,782 - 33,937 31,749,107 7,343,954 50,934,385 - - 330,447,815 13,783,763 344,231,578 -$ 33,937$ 362,196,922$ 21,127,717$ 395,165,963$
-$ -$ -$ 1,207,125$ 1,207,125$ - - - 39,733 39,733 -$ -$ -$ 1,246,858$ 1,246,858$
-$ -$ (62,881,620)$ 144,133,487$ 87,049,556$
- - 5,192,828 - 7,823,426 - - - - - - - - - -
186,780 27,438 (19,169,968) (2,374,165) 9,888,467 186,780$ 27,438$ (76,858,760)$ 141,759,322$ 104,761,449$
(Concluded)
59Agenda Packet Page 135

CapitalImprovement
Operating Program Capital ConstructionReserve Reserve Improvements Stage 2
Operating Revenues:Member contributions for services -$ -$ -$ -$ Member contributions for cash reserves - 1,000,008 1,485,504 2,747,284 Member contributions for debt service - - - - Sources control charges - - - - Miscellaneous revenues - - 6,816 -
Total operating revenues - 1,000,008 1,492,320 2,747,284
Operating Expenses:Operations - - - - Maintenance - - 22,601 - Laboratory - - - - Environmental services - - - - Engineering - - 87 - Information systems - - - - Safety - - - - Administration 6,005 30,139 - 18,705 Depreciation - - - -
Total operating expenses 6,005 30,139 22,688 18,705
Operating Income (Loss) (6,005) 969,869 1,469,632 2,728,579
Nonoperating Revenues (Expenses):Grants - - - - Other revenue (expense) - - - - Interest Income:
Operations fund - - - - Stage 2 capacity fund - - - 191,304 Capital improvement reserve fund - 317,406 - - Operating reserve fund 59,403 - - - Capital improvement fund - - - - Net increase (decrease) in fair value of investments 65,278 324,174 - 220,091
Interest expense - - - -Premium amortization - - - -Gain (loss) on disposal of fixed assets - - - -
Total nonoperating revenues (expenses) 124,681 641,580 - 411,395
Income (Loss) Before Transfers 118,676 1,611,449 1,469,632 3,139,974
Transfers In - - - - Transfers Out - - (888,632) -
Change in Net Position 118,676 1,611,449 581,000 3,139,974
Beginning Net Position 6,730,849 5,405,039 8,492,652 13,567,030 Prior Period Adjustment - - - -
Ending Net Position 6,849,525$ 7,016,488$ 9,073,652$ 16,707,004$
(Continued)
Silicon Valley Clean WaterCombining Schedule of Activities and Changes in Net Position
Enterprise FundsFor the Fiscal Year Ended June 30, 2019
60Agenda Packet Page 136

Operating Revenues:Member contributions for servicesMember contributions for cash reservesMember contributions for debt serviceSources control chargesMiscellaneous revenues Total operating revenues
Operating Expenses:OperationsMaintenanceLaboratoryEnvironmental servicesEngineeringInformation systemsSafetyAdministrationDepreciation
Total operating expenses
Operating Income (Loss)
Nonoperating Revenues (Expenses):GrantsOther revenue (expense)Interest Income:
Operations fundStage 2 capacity fundCapital improvement reserve fundOperating reserve fundCapital improvement fundNet increase (decrease) in fair value of investments
Interest expensePremium amortizationGain (loss) on disposal of fixed assets
Total nonoperating revenues (expenses)
Income (Loss) Before Transfers
Transfers InTransfers Out Change in Net Position
Beginning Net PositionPrior Period Adjustment
Ending Net Position
CapitalSelf Recycled Improvement
Insurance Water Program Operation Total
-$ 241,375$ -$ 24,197,664$ 24,439,039$ - - - - 5,232,796 - - 38,700,687 - 38,700,687 - - - 51,206 51,206 - - - 397,330 404,146 - 241,375 38,700,687 24,646,200 68,827,874
- 172,600 9,971 8,487,280 8,669,851 - 28,180 - 6,373,299 6,424,080 - 12,640 - 1,710,575 1,723,215 - - - 1,147,991 1,147,991 - - 416,937 903,887 1,320,911 - - - 1,585,728 1,585,728 - - - 421,319 421,319
25,270 - 214 4,842,475 4,922,808 - - - 8,986,961 8,986,961
25,270 213,420 427,122 34,459,515 35,202,864
(25,270) 27,955 38,273,565 (9,813,315) 33,625,010
- - - 273,678 273,678 - - - 793,208 793,208
- - - 40,104 40,104 - - - - 191,304 - - - - 317,406 - - - - 59,403 - - 2,597,917 - 2,597,917 - - (105,326) 20,044 524,261 - - (14,508,313) - (14,508,313) - - 941,868 - 941,868 - - - (12,576) (12,576) - - (11,073,854) 1,114,458 (8,781,740)
(25,270) 27,955 27,199,711 (8,698,857) 24,843,270
- - - 1,629,537 1,629,537 - - (740,905) - (1,629,537)
(25,270) 27,955 26,458,806 (7,069,320) 24,843,270
212,050 (517) (103,569,887) 148,828,642 79,665,858 - - 252,321 - 252,321
186,780$ 27,438$ (76,858,760)$ 141,759,322$ 104,761,449$
(Concluded)
For the Fiscal Year Ended June 30, 2019Enterprise Funds
Combining Schedule of Activities and Changes in Net PositionSilicon Valley Clean Water
61Agenda Packet Page 137
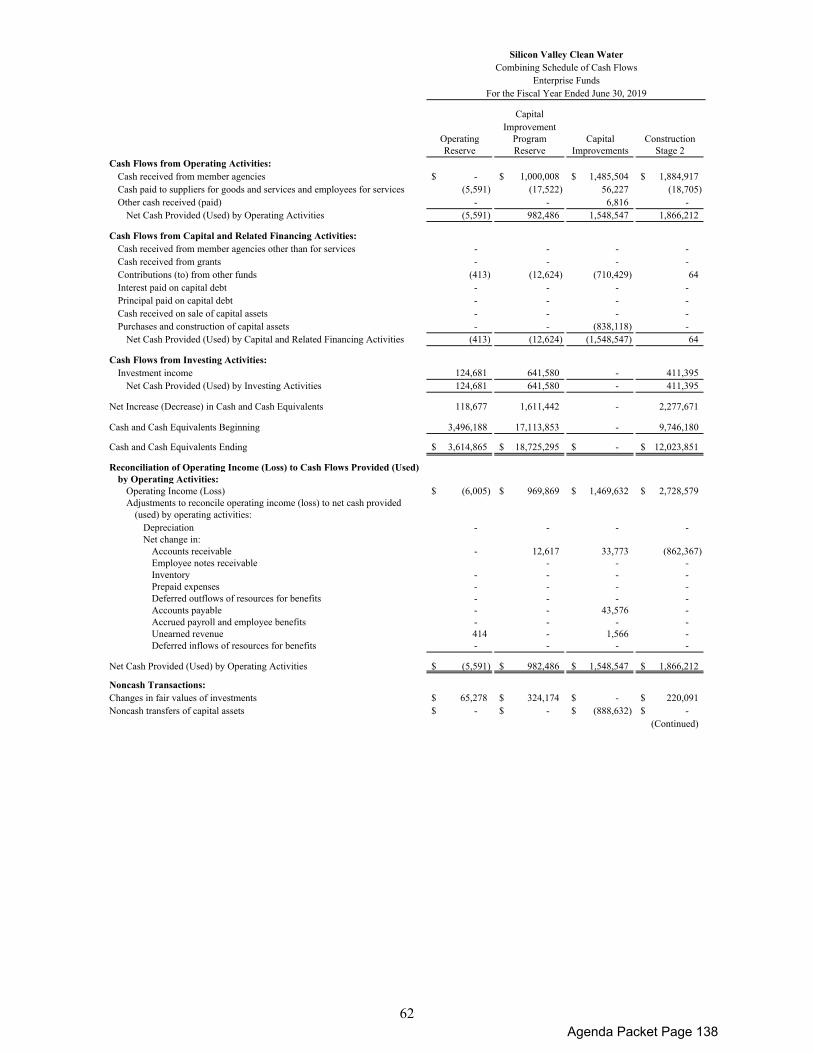
CapitalImprovement
Operating Program Capital ConstructionReserve Reserve Improvements Stage 2
Cash Flows from Operating Activities:Cash received from member agencies -$ 1,000,008$ 1,485,504$ 1,884,917$ Cash paid to suppliers for goods and services and employees for services (5,591) (17,522) 56,227 (18,705) Other cash received (paid) - - 6,816 -
Net Cash Provided (Used) by Operating Activities (5,591) 982,486 1,548,547 1,866,212
Cash Flows from Capital and Related Financing Activities:Cash received from member agencies other than for services - - - - Cash received from grants - - - - Contributions (to) from other funds (413) (12,624) (710,429) 64 Interest paid on capital debt - - - - Principal paid on capital debt - - - - Cash received on sale of capital assets - - - - Purchases and construction of capital assets - - (838,118) -
Net Cash Provided (Used) by Capital and Related Financing Activities (413) (12,624) (1,548,547) 64
Cash Flows from Investing Activities:Investment income 124,681 641,580 - 411,395
Net Cash Provided (Used) by Investing Activities 124,681 641,580 - 411,395
Net Increase (Decrease) in Cash and Cash Equivalents 118,677 1,611,442 - 2,277,671
Cash and Cash Equivalents Beginning 3,496,188 17,113,853 - 9,746,180
Cash and Cash Equivalents Ending 3,614,865$ 18,725,295$ -$ 12,023,851$
Reconciliation of Operating Income (Loss) to Cash Flows Provided (Used)by Operating Activities:
Operating Income (Loss) (6,005)$ 969,869$ 1,469,632$ 2,728,579$ Adjustments to reconcile operating income (loss) to net cash provided
(used) by operating activities:Depreciation - - - - Net change in:
Accounts receivable - 12,617 33,773 (862,367) Employee notes receivable - - - Inventory - - - - Prepaid expenses - - - - Deferred outflows of resources for benefits - - - - Accounts payable - - 43,576 - Accrued payroll and employee benefits - - - - Unearned revenue 414 - 1,566 - Deferred inflows of resources for benefits - - - -
Net Cash Provided (Used) by Operating Activities (5,591)$ 982,486$ 1,548,547$ 1,866,212$
Noncash Transactions:Changes in fair values of investments 65,278$ 324,174$ -$ 220,091$ Noncash transfers of capital assets -$ -$ (888,632)$ -$
(Continued)
Silicon Valley Clean WaterCombining Schedule of Cash Flows
Enterprise FundsFor the Fiscal Year Ended June 30, 2019
62Agenda Packet Page 138

Cash Flows from Operating Activities:Cash received from member agenciesCash paid to suppliers for goods and services and employees for servicesOther cash received (paid)
Net Cash Provided (Used) by Operating Activities
Cash Flows from Capital and Related Financing Activities:Cash received from member agencies other than for servicesCash received from grantsContributions (to) from other fundsInterest paid on capital debtPrincipal paid on capital debtCash received on sale of capital assetsPurchases and construction of capital assets
Net Cash Provided (Used) by Capital and Related Financing Activities
Cash Flows from Investing Activities:Investment income
Net Cash Provided (Used) by Investing Activities
Net Increase (Decrease) in Cash and Cash Equivalents
Cash and Cash Equivalents Beginning
Cash and Cash Equivalents Ending
Reconciliation of Operating Income (Loss) to Cash Flows Provided (Used)by Operating Activities:
Operating Income (Loss)Adjustments to reconcile operating income (loss) to net cash provided
(used) by operating activities:DepreciationNet change in:
Accounts receivableEmployee notes receivableInventoryPrepaid expensesDeferred outflows of resources for benefitsAccounts payableAccrued payroll and employee benefitsUnearned revenueDeferred inflows of resources for benefits
Net Cash Provided (Used) by Operating Activities
Noncash Transactions:Changes in fair values of investmentsNoncash transfers of capital assets
CapitalSelf Recycled Improvement
Insurance Water Program Operation Total
-$ 241,375$ 38,700,687$ 24,197,664$ 67,510,155$ (25,619) (317,972) 11,652,026 (25,344,123) (14,021,279)
- - - 448,536 455,352 (25,619) (76,597) 50,352,713 (697,923) 53,944,228
- - - 793,208 793,208 - - - 273,678 273,678
25,619 76,597 (9,785,100) 10,406,286 - - - (14,508,313) - (14,508,313) - - (4,201,885) (922,946) (5,124,831) - - - 83,101 83,101- - (117,269,898) - (118,108,016)
25,619 76,597 (145,765,196) 10,633,327 (136,591,173)
- - 2,657,332 60,148 3,895,136 - - 2,657,332 60,148 3,895,136
- - (92,755,151) 9,995,552 (78,751,809)
- - 127,206,142 825,802 158,388,165
-$ -$ 34,450,991$ 10,821,354$ 79,636,356$
(25,270)$ 27,955$ 38,273,565$ (9,813,315)$ 33,625,010$
- - - 8,986,961 8,986,961
- (61,375) (550,175) 198,616 (1,228,911) - - - (3,327) (3,327) - - - (240,761) (240,761) - - - (324,880) (324,880) - - 76,969 547,956 624,925
(349) (24,473) 12,559,342 (50,239) 12,527,857 - 20 (6,988) (3,214) (10,182) - (18,724) - 1,200 (15,544) - - - 3,080 3,080
(25,619)$ (76,597)$ 50,352,713$ (697,923)$ 53,944,228$
-$ -$ (105,326)$ 20,044$ 524,261$ -$ -$ (740,905)$ 1,629,537$ -$
(Concluded)
Silicon Valley Clean WaterCombining Schedule of Cash Flows
Enterprise FundsFor the Fiscal Year Ended June 30, 2019
63Agenda Packet Page 139

Silicon Valley Clean WaterAnalysis of Net Position
Supplemental Schedule (Unaudited)For the Year Ended June 30, 2019
Fund / Location Belmont Redwood
City San
Carlos
West Bay Sanitary District Total
Operations (Fund 18)Balance at June 30, 2018 13,199,044$ 74,045,634$ 21,810,920$ 39,863,073$ 148,918,671$ Member Agency Contributions 2,971,800 11,237,544 3,065,580 6,922,740 24,197,664 Other Miscellaneous Revenue 52,793 222,519 66,473 106,752 448,536 Grant Revenue 32,212 135,772 40,559 65,135 273,678 Unrealized Gain / (Loss) on Investments 2,359 9,944 2,971 4,770 20,044 Interest Income 4,913 18,540 4,985 11,666 40,104 Capitalized Projects Transferred from other Funds 153,991 791,466 246,712 437,368 1,629,536 Gain / (Loss) on Asset Disposal (1,188) (6,108) (1,904) (3,375) (12,576) Operating & Maintenance Costs (2,961,558) (12,414,276) (3,514,015) (6,503,074) (25,392,922) Depreciation Expenditures (849,268) (4,364,967) (1,360,626) (2,412,100) (8,986,960)
Balance at June 30, 2019 12,605,098$ 69,676,067$ 20,361,655$ 38,492,955$ 141,135,774$
Retiree Medical Health Benefits Reserve (Fund 12)Balance at June 30, 2018 (4,026)$ (73,360)$ 53,759$ (66,404)$ (90,031)$ Contributions to Fund 12 93,361 393,511 117,553 188,784 793,208 Expenditures (9,372) (39,504) (11,801) (18,952) (79,630)
Balance at June 30, 2019 79,962$ 280,646$ 159,511$ 103,428$ 623,548$
Capital Improvement Program Reserve (Fund 13)Balance at June 30, 2018 510,768$ 2,625,217$ 818,332$ 1,450,722$ 5,405,039$ Member Contributions - Replacement Reserve 94,500 485,700 151,404 268,404 1,000,008 Change in Fair Value, Unrealized Gain/(Loss) 30,634 157,451 49,080 87,008 324,174 Fees (2,848) (14,638) (4,563) (8,089) (30,139) Interest Income 29,995 154,164 48,055 85,192 317,406
Balance at June 30, 2019 663,049$ 3,407,894$ 1,062,308$ 1,883,237$ 7,016,488$
Construction Stage 2 (Fund 15)Balance at June 30, 2018 529,038$ 7,154,350$ 2,082,073$ 3,801,569$ 13,567,030$ Member Purchases of Capacity - 2,048,946 698,338 - 2,747,284 Interest Income 18,078 92,916 28,963 51,346 191,304 Interest / (Unrealized Loss) Investments 20,799 106,898 33,322 59,072 220,091 Fees (1,768) (9,085) (2,832) (5,020) (18,705) Capitalized Projects Transferred to Fund 18 - - - - -
Balance at June 30, 2019 566,147$ 9,394,025$ 2,839,865$ 3,906,967$ 16,707,004$
Self Insurance (Fund 16)Balance at June 30, 2018 22,613$ 88,168$ 37,855$ 63,413$ 212,050$ Expenses / Claims (2,974) (12,537) (3,745) (6,014) (25,270)
Balance at June 30, 2019 19,639$ 75,631$ 34,110$ 57,399$ 186,780$
Operating & Capital Reserve (Fund 17)Balance at June 30, 2018 758,137$ 3,314,915$ 862,410$ 1,795,387$ 6,730,849$ Member Contributions - - - - - Unrealized Gain / (Loss) on Investment 7,683 32,385 9,674 15,536 65,278 Fees (707) (2,979) (890) (1,429) (6,005) Interest Income 6,992 29,470 8,803 14,138 59,403
Balance at June 30, 2019 772,105$ 3,373,790$ 879,998$ 1,823,632$ 6,849,525$
64Agenda Packet Page 140

Silicon Valley Clean WaterAnalysis of Net Position
Supplemental Schedule (Unaudited)For the Year Ended June 30, 2019
Fund / Location Belmont Redwood
City San
Carlos
West Bay Sanitary District Total
Revenue-Funded Capital Improvements (Fund 14)Balance at June 30, 2018 860,743$ 4,210,257$ 1,047,363$ 2,374,290$ 8,492,653$ Member Contributions - Pay go capital projects 140,380 721,509 224,905 398,709 1,485,504 Miscellaneous Revenue 644 3,311 1,032 1,830 6,816 Project Expenditures not yet transferred to Fund 18 (2,144) (11,020) (3,435) (6,090) (22,689) Capitalized Projects transferred to Fund 18 (83,976) (431,609) (134,539) (238,509) (888,632)
Balance at June 30, 2019 915,647$ 4,492,448$ 1,135,326$ 2,530,230$ 9,073,652$
Recycled Water (Fund 19)Balance at June 30, 2018 -$ (517)$ -$ -$ (517)$ RWC Recycled Water O&M Contributions - 241,375 - - 241,375 RWC Recycled Water O&M Expenditures - (213,420) - - (213,420)
Balance at June 30, 2019 -$ 27,438$ -$ -$ 27,438$
Plant Capital Improvement Program (Fund 20)Balance at June 30, 2018 8,184,201 (54,089,588) (20,567,391) (37,097,108) (103,569,886)$ Member Contributions 10,758,841 11,841,520 3,689,899 12,410,427 38,700,687 Unrealized Gain (Loss) - (61,423) (19,160) (24,743) (105,326) Interest on Trustee Reserves - 1,515,030 472,587 610,299 2,597,917 Capitalized Projects Transferred to Fund 18 (70,015) (359,857) (112,173) (198,859) (740,905) Interest Expense, Direct (19,706) (7,484,401) (2,335,037) (3,639,055) (13,478,198) Interest Expense, Allocated (51,295) (492,839) (154,596) (254,415) (953,145) Amortization of Bond Premium - 538,565 156,844 246,459 941,868 Other Expenses (47,637) (244,838) (76,320) (135,299) (504,093) Prior Period Adjustment 23,844 122,552 38,201 67,723 252,321
Balance at June 30, 2019 18,778,233$ (48,715,278)$ (18,907,145)$ (28,014,570)$ (76,858,760)$
TOTAL NET POSITION - June 30, 2019 34,399,880$ 42,012,663$ 7,565,628$ 20,783,277$ 104,761,449$ CY % 32.84% 40.10% 7.22% 19.84% 100.00%
65Agenda Packet Page 141

This Page Left Intentionally Blank
Agenda Packet Page 142

OTHER INDEPENDENT AUDITOR’S REPORT
67Agenda Packet Page 143

This Page Left Intentionally Blank
Agenda Packet Page 144

INDEPENDENT AUDITOR’S REPORT ON INTERNAL CONTROL OVER FINANCIAL REPORTING AND ON COMPLIANCE AND OTHER MATTERS BASED ON AN AUDIT OF
FINANCIAL STATEMENTS PERFORMED IN ACCORDANCE WITH GOVERNMENT AUDITING STANDARDS
To the Commission Silicon Valley Clean Water
We have audited, in accordance with auditing standards generally accepted in the United States of America and the standards applicable to financial audits contained in Government Auditing Standards issued by the Comptroller General of the United States, the financial statements of the Silicon Valley Clean Water (SVCW) as of and for the year ended June 30, 2019, and the related notes to the financial statements, which collectively comprise SVCW’s basic financial statements, and have issued our report thereon dated November 25, 2019.
Internal Control over Financial Reporting
In planning and performing our audit of the financial statements, we considered SVCW’s internal control over financial reporting (internal control) to determine the audit procedures that are appropriate in the circumstances for the purpose of expressing our opinions on the financial statements, but not for the purpose of expressing an opinion on the effectiveness of SVCW’s internal control. Accordingly, we do not express an opinion on the effectiveness of SVCW’s internal control.
A deficiency in internal control exists when the design or operation of a control does not allow management or employees in the normal course of performing their assigned functions, to prevent, or detect and correct misstatements on a timely basis. A material weakness is a deficiency, or a combination of deficiencies, in internal control, such that there is a reasonable possibility that a material misstatement of the entity’s financial statements will not be prevented, or detected and corrected on a timely basis. A significant deficiency is a deficiency, or a combination of deficiencies, in internal control that is less severe than a material weakness, yet important enough to merit attention by those charged with governance.
Our consideration of internal control over financial reporting was for the limited purpose described in the first paragraph of this section and was not designed to identify all deficiencies in internal control over financial reporting that might be material weaknesses or significant deficiencies. Given these limitations, during our audit we did not identify any deficiencies in internal control over financial reporting that we consider to be material weaknesses. However, material weaknesses may exist that have not been identified.
Compliance and Other Matters
As part of obtaining reasonable assurance about whether SVCW’s financial statements are free of material misstatement, we performed tests of its compliance with certain provisions of laws, regulations, contracts, and grant agreements, noncompliance with which could have a direct and material effect on the determination of financial statement amounts. However, providing an opinion on compliance with those provisions was not an objective of our audit, and accordingly, we do not express such an opinion. The results of our tests disclosed no instances of noncompliance or other matters that are required to be reported under Government Auditing Standards.
69Agenda Packet Page 145

Purpose of this Report
The purpose of this report is solely to describe the scope of our testing of internal control and compliance and the results of that testing, and not to provide an opinion on the effectiveness of the entity’s internal control or on compliance. This report is an integral part of an audit performed in accordance with Government Auditing Standards in considering the entity’s internal control and compliance. Accordingly, this communication is not suitable for any other purpose.
November 25, 2019 Pleasant Hill, California
70Agenda Packet Page 146

SILICON VALLEY CLEAN WATER MEMORANDUM ON INTERNAL CONTROL
FOR THE YEAR ENDED JUNE 30, 2019
Agenda Packet Page 147

This Page Left Intentionally Blank
Agenda Packet Page 148

SILICON VALLEY CLEAN WATER MEMORANDUM ON INTERNAL CONTROL
For The Year Ended June 30, 2019
Table of Contents
Page
Memorandum on Internal Control ................................................................................................................... 1 Schedule of Other Matters ....................................................................................................................... 3
Agenda Packet Page 149

This Page Left Intentionally Blank
Agenda Packet Page 150

MEMORANDUM ON INTERNAL CONTROL
To the Commission of Silicon Valley Clean Water Redwood City, California
In planning and performing our audit of the basic financial statements of Silicon Valley Clean Water for the year ended June 30, 2019, in accordance with auditing standards generally accepted in the United States of America, we considered the Authority’s internal control over financial reporting (internal control) as a basis for designing audit procedures that are appropriate in the circumstances for the purpose of expressing our opinions on the financial statements, but not for the purpose of expressing an opinion on the effectiveness of the Authority’s internal control. Accordingly, we do not express an opinion on the effectiveness of the Authority’s internal control.
A deficiency in internal control exists when the design or operation of a control does not allow management or employees, in the normal course of performing their assigned functions, to prevent, or detect and correct misstatements on a timely basis. A material weakness is a deficiency, or a combination of deficiencies, in internal control, such that there is a reasonable possibility that a material misstatement of the Authority’s financial statements will not be prevented, or detected and corrected, on a timely basis.
Our consideration of internal control was for the limited purpose described in the first paragraph and was not designed to identify all deficiencies in internal control that might be material weaknesses. In addition, because of inherent limitations in internal control, including the possibility of management override of controls, misstatements due to error or fraud may occur and not be detected by such controls. Given these limitations, during our audit we did not identify any deficiencies in internal control that we consider to be material weaknesses. However, material weaknesses may exist that have not been identified.
Included in the Schedule of Other Matters are recommendations not meeting the above definitions that we believe are opportunities for strengthening internal controls and operating efficiency.
Management’s written responses included in this report have not been subjected to the audit procedures applied in the audit of the financial statements, and accordingly, we express no opinion on them.
This communication is intended solely for the information and use of the Commission and others within the organization, and agencies and pass-through entities requiring compliance with Government Auditing Standards, and is not intended to be and should not be used by anyone other than these specified parties.
Pleasant Hill, California November 25, 2019
1Agenda Packet Page 151

This Page Left Intentionally Blank
Agenda Packet Page 152

MEMORANDUM ON INTERNAL CONTROL
SCHEDULE OF OTHER MATTERS
2019-01: Accounting Department Super-User Rights
Criteria: A system administrative user (Super user) is an individual who has full access over the financial system including all modules and all functions. This type of access should be limited to as few people as possible. If possible, Super-users’ rights should be removed from Accounting Department Staff.
Condition: We noted that both the CFO and Accounting Supervisor have full access to process invoices, create/update purchase orders, add or delete vendors, maintains vendor database and print checks. In addition, they also have access to the blank check stocks and signature plates.
Cause: It appears that such access is granted to the Accounting Department Staff for convenience due to the limited staffing availability.
Potential Effect: This condition does not permit for good checks and balances to be performed by multiple employees. Good internal control dictates that one employee who reviews should not have access to process the related assets. Good internal control further dictates that another employee who does not involve in the full financial operating process should perform any changes to the database and perform top to bottom review of system privileges to maintain good check and balance.
Recommendation: The District should review the necessity of granting any employee the privilege rights to the financial system. For any module within the financial system that these employees do not need to edit, their access should be limited to either read-only, or have a 2nd staff to review vendor database update monthly at the minimum.
Management’s Response: Silicon Valley Clean Water successfully implemented its new financial system beginning July 01, 2018. Prior to implementation there was a discovery period when workflows and authorization processes were agreed upon that endeavor to make SVCW disbursements accurately, on time, and with appropriate approval. These workflows:
• Departmental administrative staff receive invoices, obtain appropriate signatures, and make theinitial entry into the financial system. Documentation is forwarded to Accounting.
• There is an Accounting Technician as well as two Accountants dedicated to assisting with invoiceentry or reviewing activity already entered.
• Once satisfied that entries are accurate, an Accountant will post the batch of invoices for approvalby the Accounting Supervisor.
• The Accounting Supervisor is notified electronically when a payment batch needs approval.
• The Chief Financial Officer is notified electronically when a payment batch is approved.
• The risk of fraudulent vendors is mitigated by a review process, whereby the Chief FinancialOfficer and Accounting Supervisor routinely review transaction logs that describe any changesmade to vendor records.
• Separately, a comprehensive list of disbursements is generated into a Warrant Register by aFinancial Analyst and reviewed by SVCW’s Chief Financial Officer and its Manager. EachWarrant Register is forwarded to the Redwood City Finance Manager in his/her capacity asSVCW Controller and, after signature, is presented to the Commission.
3Agenda Packet Page 153

MEMORANDUM ON INTERNAL CONTROL
SCHEDULE OF OTHER MATTERS
2019-01: Accounting Department Super-User Rights, (Continued)
After receiving the auditor’s comments, SVCW reassessed its super-user rights and made the following adjustments:
• Removed super-user rights from Chief Financial Officer, Accounting Supervisor, and FinancialAnalyst
• Began the process to extend the system administrator role to Information Technology Analysts tofurther segregate super-user rights from Accounting. We anticipate this transition to be completedby end of the 2019-20 fiscal year.
2019-02: Internal Controls over Check, EFT, and ACH Receipts
Criteria: Check, EFT, and ACH receipts reconciliations should have audit trails of reviewer’s sign off and date to ensure proper approval are conducted in a timely manner.
Condition: During our review of internal control, we noted that although the Accounting Department Staff cross-check each other’s work, the reviewer does not leave an audit trail of sign off and date.
Cause: Staff was not aware that such audit trail was necessary.
Potential Effect: There is increased risk of errors or unauthorized transaction without audit trail for proper review and signoff.
Recommendation: Staff performing the reviews should leave an audit trial of sign off and date to ensure the review are done timely.
Management’s Response:SVCW agrees with the recommendation to strengthen evidence of its review process; Signatures and dates are now being applied during reviews.
4Agenda Packet Page 154
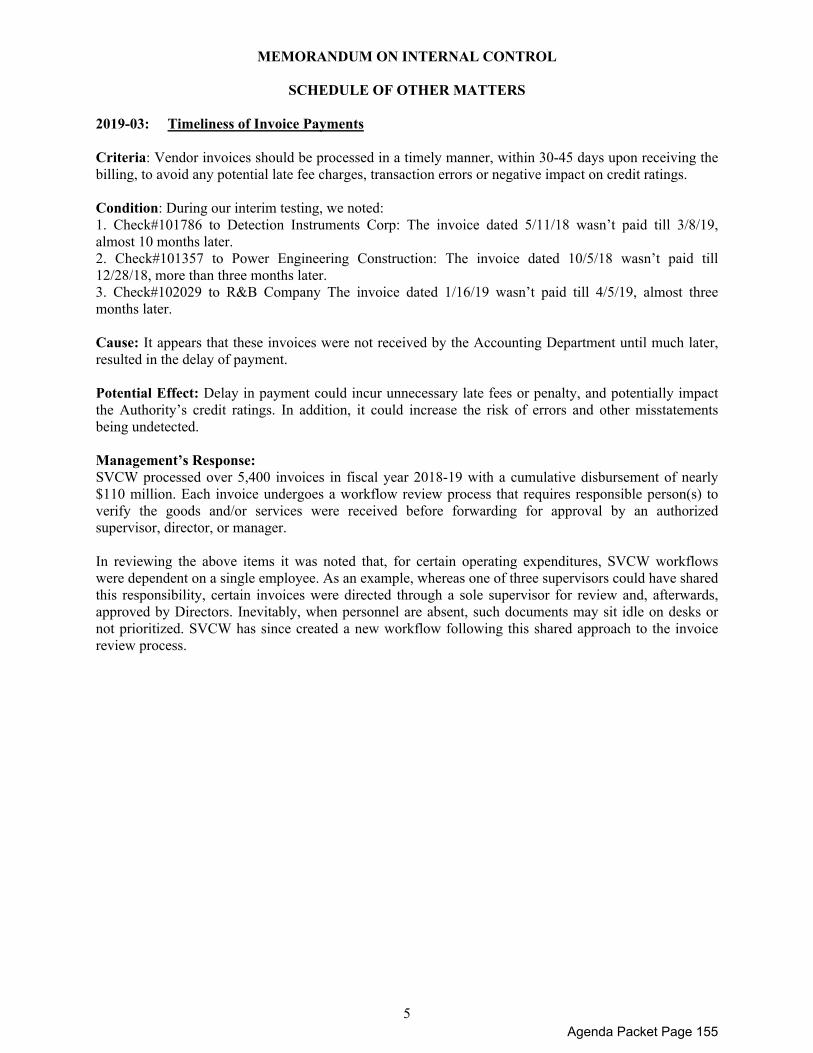
MEMORANDUM ON INTERNAL CONTROL
SCHEDULE OF OTHER MATTERS
2019-03: Timeliness of Invoice Payments
Criteria: Vendor invoices should be processed in a timely manner, within 30-45 days upon receiving the billing, to avoid any potential late fee charges, transaction errors or negative impact on credit ratings.
Condition: During our interim testing, we noted: 1. Check#101786 to Detection Instruments Corp: The invoice dated 5/11/18 wasn’t paid till 3/8/19,almost 10 months later.2. Check#101357 to Power Engineering Construction: The invoice dated 10/5/18 wasn’t paid till12/28/18, more than three months later.3. Check#102029 to R&B Company The invoice dated 1/16/19 wasn’t paid till 4/5/19, almost threemonths later.
Cause: It appears that these invoices were not received by the Accounting Department until much later, resulted in the delay of payment.
Potential Effect: Delay in payment could incur unnecessary late fees or penalty, and potentially impact the Authority’s credit ratings. In addition, it could increase the risk of errors and other misstatements being undetected.
Management’s Response:SVCW processed over 5,400 invoices in fiscal year 2018-19 with a cumulative disbursement of nearly $110 million. Each invoice undergoes a workflow review process that requires responsible person(s) to verify the goods and/or services were received before forwarding for approval by an authorized supervisor, director, or manager.
In reviewing the above items it was noted that, for certain operating expenditures, SVCW workflows were dependent on a single employee. As an example, whereas one of three supervisors could have shared this responsibility, certain invoices were directed through a sole supervisor for review and, afterwards, approved by Directors. Inevitably, when personnel are absent, such documents may sit idle on desks or not prioritized. SVCW has since created a new workflow following this shared approach to the invoice review process.
5Agenda Packet Page 155
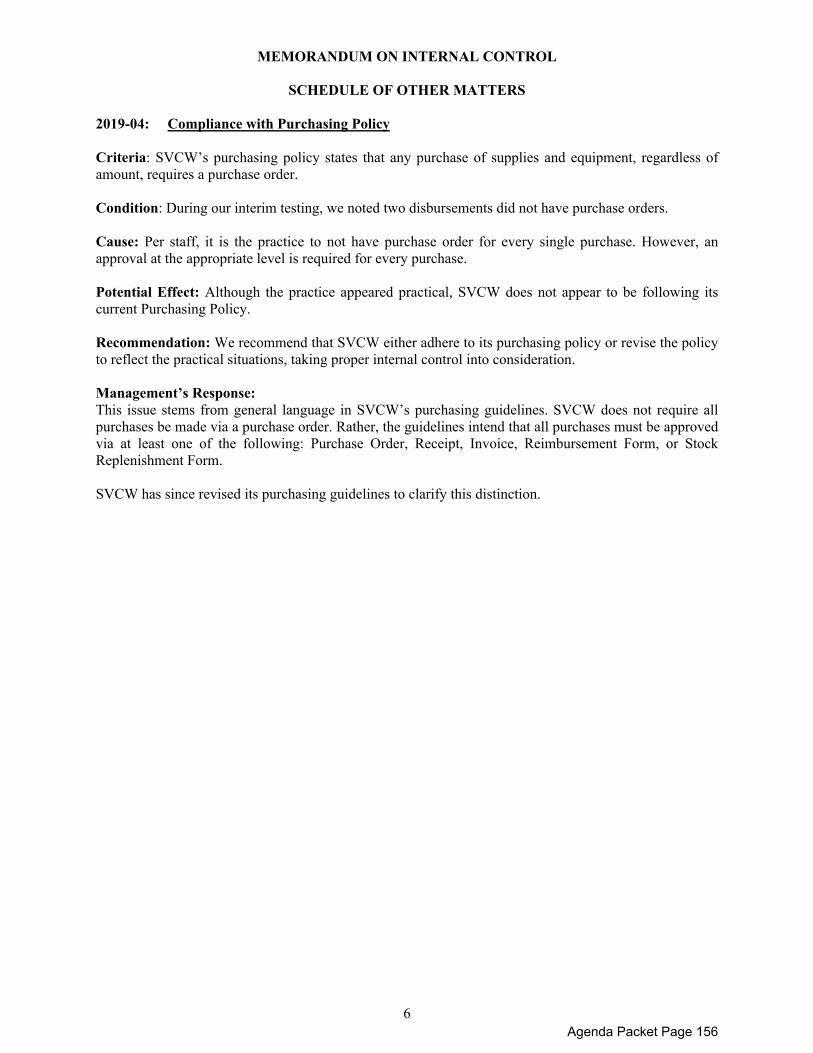
MEMORANDUM ON INTERNAL CONTROL
SCHEDULE OF OTHER MATTERS
2019-04: Compliance with Purchasing Policy Criteria: SVCW’s purchasing policy states that any purchase of supplies and equipment, regardless of amount, requires a purchase order. Condition: During our interim testing, we noted two disbursements did not have purchase orders. Cause: Per staff, it is the practice to not have purchase order for every single purchase. However, an approval at the appropriate level is required for every purchase. Potential Effect: Although the practice appeared practical, SVCW does not appear to be following its current Purchasing Policy. Recommendation: We recommend that SVCW either adhere to its purchasing policy or revise the policy to reflect the practical situations, taking proper internal control into consideration. Management’s Response: This issue stems from general language in SVCW’s purchasing guidelines. SVCW does not require all purchases be made via a purchase order. Rather, the guidelines intend that all purchases must be approved via at least one of the following: Purchase Order, Receipt, Invoice, Reimbursement Form, or Stock Replenishment Form. SVCW has since revised its purchasing guidelines to clarify this distinction.
6Agenda Packet Page 156

MEMORANDUM ON INTERNAL CONTROL
SCHEDULE OF OTHER MATTERS
NEW GASB PRONOUNCEMENTS OR PRONOUNCEMENTS NOT YET EFFECTIVE
The following comment represents new pronouncements taking affect in the next few years. We cite them here to keep you informed of developments:
EFFECTIVE FISCAL YEAR 2019/20:
GASB Statement No. 84, Fiduciary Activities
The objective of this Statement is to improve guidance regarding the identification of fiduciary activities for accounting and financial reporting purposes and how those activities should be reported.
This Statement establishes criteria for identifying fiduciary activities of all state and local governments. The focus of the criteria generally is on (1) whether a government is controlling the assets of the fiduciary activity and (2) the beneficiaries with whom a fiduciary relationship exists. Separate criteria are included to identify fiduciary component units and postemployment benefit arrangements that are fiduciary activities.
An activity meeting the criteria should be reported in a fiduciary fund in the basic financial statements. Governments with activities meeting the criteria should present a statement of fiduciary net position and a statement of changes in fiduciary net position. An exception to that requirement is provided for a business-type activity that normally expects to hold custodial assets for three months or less.
This Statement describes four fiduciary funds that should be reported, if applicable: (1) pension (and other employee benefit) trust funds, (2) investment trust funds, (3) private-purpose trust funds, and (4) custodial funds. Custodial funds generally should report fiduciary activities that are not held in a trust or equivalent arrangement that meets specific criteria.
A fiduciary component unit, when reported in the fiduciary fund financial statements of a primary government, should combine its information with its component units that are fiduciary component units and aggregate that combined information with the primary government’s fiduciary funds.
This Statement also provides for recognition of a liability to the beneficiaries in a fiduciary fund when an event has occurred that compels the government to disburse fiduciary resources. Events that compel a government to disburse fiduciary resources occur when a demand for the resources has been made or when no further action, approval, or condition is required to be taken or met by the beneficiary to release the assets.
How the Changes in This Statement Will Improve Financial Reporting
The requirements of this Statement will enhance consistency and comparability by (1) establishing specific criteria for identifying activities that should be reported as fiduciary activities and (2) clarifying whether and how business-type activities should report their fiduciary activities. Greater consistency and comparability enhance the value provided by the information reported in financial statements for assessing government accountability and stewardship.
7Agenda Packet Page 157

MEMORANDUM ON INTERNAL CONTROL
SCHEDULE OF OTHER MATTERS
GASB 90 – Majority Equity Interests—an amendment of GASB Statements No. 14 and No. 61)
The primary objectives of this Statement are to improve the consistency and comparability of reporting a government’s majority equity interest in a legally separate organization and to improve the relevance of financial statement information for certain component units. It defines a majority equity interest and specifies that a majority equity interest in a legally separate organization should be reported as an investment if a government’s holding of the equity interest meets the definition of an investment. A majority equity interest that meets the definition of an investment should be measured using the equity method, unless it is held by a special-purpose government engaged only in fiduciary activities, a fiduciary fund, or an endowment (including permanent and term endowments) or permanent fund. Those governments and funds should measure the majority equity interest at fair value.
For all other holdings of a majority equity interest in a legally separate organization, a government should report the legally separate organization as a component unit, and the government or fund that holds the equity interest should report an asset related to the majority equity interest using the equity method. This Statement establishes that ownership of a majority equity interest in a legally separate organization results in the government being financially accountable for the legally separate organization and, therefore, the government should report that organization as a component unit.
This Statement also requires that a component unit in which a government has a 100 percent equity interest account for its assets, deferred outflows of resources, liabilities, and deferred inflows of resources at acquisition value at the date the government acquired a 100 percent equity interest in the component unit. Transactions presented in flows statements of the component unit in that circumstance should include only transactions that occurred subsequent to the acquisition.
The requirements of this Statement are effective for reporting periods beginning after December 15, 2018. Earlier application is encouraged. The requirements should be applied retroactively, except for the provisions related to (1) reporting a majority equity interest in a component unit and (2) reporting a component unit if the government acquires a 100 percent equity interest. Those provisions should be applied on a prospective basis.
8Agenda Packet Page 158

MEMORANDUM ON INTERNAL CONTROL
SCHEDULE OF OTHER MATTERS
EFFECTIVE FISCAL YEAR 2020/21:
GASB 87 – Leases
The objective of this Statement is to better meet the information needs of financial statement users by improving accounting and financial reporting for leases by governments. This Statement increases the usefulness of governments’ financial statements by requiring recognition of certain lease assets and liabilities for leases that previously were classified as operating leases and recognized as inflows of resources or outflows of resources based on the payment provisions of the contract. It establishes a single model for lease accounting based on the foundational principle that leases are financings of the right to use an underlying asset. Under this Statement, a lessee is required to recognize a lease liability and an intangible right-to-use lease asset, and a lessor is required to recognize a lease receivable and a deferred inflow of resources, thereby enhancing the relevance and consistency of information about governments’ leasing activities. A lease is defined as a contract that conveys control of the right to use another entity’s nonfinancial asset (the underlying asset) as specified in the contract for a period of time in an exchange or exchange-like transaction. Examples of nonfinancial assets include buildings, land, vehicles, and equipment. Any contract that meets this definition should be accounted for under the leases guidance, unless specifically excluded in this Statement.
9Agenda Packet Page 159

This Page Left Intentionally Blank
Agenda Packet Page 160

SILICON VALLEY CLEAN WATER
REQUIRED COMMUNICATIONS
FOR THE YEAR ENDED JUNE 30, 2019
Agenda Packet Page 161

This Page Left Intentionally Blank
Agenda Packet Page 162

SILICON VALLEY CLEAN WATER
REQUIRED COMMUNICATIONS
For the Year Ended June 30, 2019
Table of Contents
Page
Required Communications ............................................................................................................... 1
Significant Audit Findings............................................................................................................ 1
Accounting Policies................................................................................................................ 1
Unusual Transactions, Controversial or Emerging Areas .................................................... 1
Accounting Estimates ............................................................................................................. 1
Disclosures .............................................................................................................................. 2
Difficulties Encountered in Performing the Audit ................................................................. 2
Corrected and Uncorrected Misstatements ............................................................................. 2
Disagreements with Management .......................................................................................... 3
Management Representations ................................................................................................. 3
Management Consultations with Other Independent Accountants ........................................ 3
Other Audit Findings or Issues ............................................................................................... 3
Other Information Accompanying the Financial Statements ....................................................... 3
Agenda Packet Page 163

This Page Left Intentionally Blank
Agenda Packet Page 164

REQUIRED COMMUNICATIONS
To the Commission of Silicon Valley Clean Water Redwood City, California
We have audited the basic financial statements of the Silicon Valley Clean Water for the year ended June 30, 2019. Professional standards require that we communicate to you the following information related to our audit under generally accepted auditing standards and Government Auditing Standards.
Significant Audit Findings
Accounting Policies
Management is responsible for the selection and use of appropriate accounting policies. The significant accounting policies used by Authority are described in Note 2 to the financial statements. No new accounting policies were adopted, and the application of existing policies was not changed during the year.
The following pronouncements became effective, but did not have a material effect on the financial statements:
GASB 83 – Certain Asset Retirement Obligations
GASB 88 – Certain Disclosure Related to Debt, including Direct Borrowings and Direct Placements
Unusual Transactions, Controversial or Emerging Areas
We noted no transactions entered into by the Authority during the year for which there is a lack of authoritative guidance or consensus. All significant transactions have been recognized in the financial statements in the proper period.
Accounting Estimates
Accounting estimates are an integral part of the financial statements prepared by management and are based on management’s knowledge and experience about past and current events and assumptions about future events. Certain accounting estimates are particularly sensitive because of their significance to the financial statements and because of the possibility that future events affecting them may differ significantly from those expected. The most sensitive estimates affecting the Authority’s financial statements were:
• Estimated Net Pension Liabilities and Pension-Related Deferred Outflows and Inflows of Resources:Management’s estimate of the net pension liabilities and deferred outflows/inflows of resources aredisclosed in Note 8 to the financial statements and are based on actuarial studies determined by aconsultant, which are based on the experience of the Authority. We evaluated the key factors andassumptions used to develop the estimate and determined that it is reasonable in relation to the basicfinancial statements taken as a whole.
1Agenda Packet Page 165
• Estimated Net OPEB Obligation: Management’s estimate of the net OPEB obligation is disclosed inNote 9 to the financial statements and is based on actuarial study determined by a consultant, which isbased on the experience of the Authority. We evaluated the key factors and assumptions used todevelop the estimate and determined that it is reasonable in relation to the basic financial statementstaken as a whole.
• Estimated Fair Value of Investments: As of June 30, 2019, the Authority held approximately $79.6million of cash and investments as measured by fair value as disclosed in Note 3 to the financialstatements. Fair value is essentially market pricing in effect as of June 30, 2019. These fair valuesare not required to be adjusted for changes in general market conditions occurring subsequent to June30, 2019.
• Estimate of Depreciation: Management’s estimate of the depreciation is based on useful livesdetermined by management. These lives have been determined by management based on theexpected useful life of assets as disclosed in Note 2 to the financial statements. We evaluated the keyfactors and assumptions used to develop the depreciation estimate and determined that it is reasonablein relation to the basic financial statements taken as a whole.
• Estimate of Compensated Absences: Accrued compensated absences which are comprised of accruedvacation, holiday, and certain other compensating time is estimated using accumulated unpaid leavehours and hourly pay rates in effect at the end of the fiscal year as disclosed in Note 2 to the financialstatements. We evaluated the key factors and assumptions used to develop the accrued compensatedabsences and determined that it is reasonable in relation to the basic financial statements taken as awhole.
• Estimated Claims Liabilities: Management’s estimate of the claims liabilities payable is disclosed inNote 10 to the financial statements and is based on the claims experience of the Authority. Weevaluated the key factors and assumptions used to develop the estimate and determined that it isreasonable in relation to the basic financial statements taken as a whole.
Disclosures
The financial statement disclosures are neutral, consistent, and clear.
Difficulties Encountered in Performing the Audit
We encountered no significant difficulties in dealing with management in performing and completing our audit.
Corrected and Uncorrected Misstatements
Professional standards require us to accumulate all known and likely misstatements identified during the audit, other than those that are clearly trivial, and communicate them to the appropriate level of management. Management has corrected all such misstatements. In addition, none of the misstatements detected as a result of audit procedures and corrected by management were material, either individually or in the aggregate, to each opinion unit’s financial statements taken as a whole.
Professional standards require us to accumulate all known and likely uncorrected misstatements identified during the audit, other than those that are trivial, and communicate them to the appropriate level of management. We have no such misstatements to report to the Commission.
2Agenda Packet Page 166

Disagreements with Management
For purposes of this letter, a disagreement with management is a financial accounting, reporting, or auditing matter, whether or not resolved to our satisfaction, that could be significant to the financial statements or the auditor’s report. We are pleased to report that no such disagreements arose during the course of our audit.
Management Representations
We have requested certain representations from management that are included in a management representation letter dated November 25, 2019.
Management Consultations with Other Independent Accountants
In some cases, management may decide to consult with other accountants about auditing and accounting matters, similar to obtaining a “second opinion” on certain situations. If a consultation involves application of an accounting principle to the Authority’s financial statements or a determination of the type of auditor’s opinion that may be expressed on those statements, our professional standards require the consulting accountant to check with us to determine that the consultant has all the relevant facts. To our knowledge, there were no such consultations with other accountants.
Other Audit Findings or Issues
We generally discuss a variety of matters, including the application of accounting principles and auditing standards, with management each year prior to retention as the Authority’s auditors. However, these discussions occurred in the normal course of our professional relationship and our responses were not a condition to our retention.
Other Information Accompanying the Financial Statements
We applied certain limited procedures to the required supplementary information that accompanies and supplements the basic financial statements. Our procedures consisted of inquiries of management regarding the methods of preparing the information and comparing the information for consistency with management’s responses to our inquiries, the basic financial statements, and other knowledge we obtained during our audit of the basic financial statements. We did not audit the required supplementary information and do not express an opinion or provide any assurance on the required supplementary information.
We were engaged to report on the supplementary information which accompany the financial statements, but are not required supplementary information. With respect to this supplementary information, we made certain inquiries of management and evaluated the form, content, and methods of preparing the information to determine that the information complies with accounting principles generally accepted in the United States of America, the method of preparing it has not changed from the prior period, and the information is appropriate and complete in relation to our audit of the financial statements. We compared and reconciled the supplementary information to the underlying accounting records used to prepare the financial statements or to the financial statements themselves.
We were not engaged to report on the Introductory and Statistical Sections which accompany the financial statements, but are not required supplementary information. Such information has not been subjected to the auditing procedures applied in the audit of the basic financial statements, and accordingly, we do not express an opinion or provide any assurance on them.
3Agenda Packet Page 167

******
This information is intended solely for the use of Commission and management and is not intended to be, and should not be, used by anyone other than these specified parties.
Pleasant Hill, California November 25, 2019
4Agenda Packet Page 168

Silicon Valley Clean Water DECEMBER 16, 2019
AGENDA ITEM 7F
Agenda Packet Page 169

This page intentionally left blank
Agenda Packet Page 170

Silicon Valley Clean Water AGENDA ITEM 7F DECEMBER 16, 2019
Report By: T.H. 7F-1
SALE OF REAL PROPERTY ISSUE Approve Sale of Real Property Owned by Silicon Valley Clean Water BACKGROUND In 2010, SVCW purchased a residential property at 379 Greendale Avenue in Redwood City pursuant to an employment agreement with SVCW’s previous Manager. In June, 2019, the Commission determined the property was no longer needed by SVCW and authorized retaining the services of a real estate broker who then offered the property for sale in the open market. On November 18, 2019, two offers within the market value range were received for the property, which were presented to the Commission during closed session. The Commission authorized the Manager to enter into a purchase and sale agreement for either of the two offers. Consistent with the authority provided by the Commission, the higher of the two offers was accepted on November 18, 2019 in the amount of $3.55 million and a purchase and sale agreement was negotiated and executed. DISCUSSION Escrow opened on November 18, 2019 and is scheduled to close forty days after acceptance of the offer. The buyers are motivated to close early and it is anticipated that the sale will be complete on December 17, 2019. This agenda item will ratify the acceptance of the offer/purchase and sale agreement and authorize conveyance of title to the property. RECOMMENDATION Move adoption of RESOLUTION APPROVING SALE OF CERTAIN HEREIN DESCRIBED REAL PROPERTY AND AUTHORIZING EXECUTION OF ALL DOCUMENTS NECESSARY AND APPROPRIATE FOR SAID TRANSACTION (APN 057-133-010, -020, -030, -040, -050, -080)
Agenda Packet Page 171

This page intentionally left blank
Agenda Packet Page 172

Silicon Valley Clean Water DECEMBER 16, 2019
AGENDA ITEM 8A
Agenda Packet Page 173

This page intentionally left blank
Agenda Packet Page 174

Silicon Valley Clean Water AGENDA ITEM 8A DECEMBER 16, 2019
Report By: K.R.H. 8A-1
RESCU PROGRAM PRESENTATION ON PROGRAM STATUS
ISSUE Receive Presentation on RESCU Program Status Including Potential Project Changes BACKGROUND One of the highest priority programs for Silicon Valley Clean Water is upgrades to the conveyance system facilities. Conveyance facilities include the influent force main, all pump stations, and preliminary treatment. Replacement of the conveyance facilities was identified in the original 2008 Capital Improvement Program (CIP) and work on a replacement program began almost immediately upon approval of the 2008 CIP. It is not uncommon for comprehensive infrastructure replacement programs to take 10 to 15 years to complete. Indeed, SVCW’s Regional Environmental Sewer Conveyance Upgrades (RESCU) program is slated for completion in 2023 which will have been a 15-year program life. The program has undergone several iterations since its inception and has now reached the point where all projects are advanced into contracts with design-builders. Two of the three major projects are in construction and the third major project is scheduled to begin construction in Spring 2020. With a RESCU completion date in 2023, SVCW will cap a 15-year effort for the conveyance system upgrades, ensuring that SVCW will protect public health and the environment for the next 50 to 100 years. The Commission has supported the needs to upgrade and ensure a robust infrastructure, making the hard decisions necessary to meeting the financial needs of the agency. Staff continues to ensure that SVCW service area ratepayers are receiving a high level of service with quality facilities designed and constructed with capital and life cycle costs at the most efficient levels possible. DISCUSSION Staff’s responsibilities are to ensure that projects being undertaken meet the primary mission of the agency, that they are carried out efficiently, that the Commission remain apprised of project status and that full transparency is followed. To this end, staff will make a presentation on the status of the RESCU program and will provide information known at this time on necessary project changes. The presentation content will support the upcoming CIP Update that will be presented to the Commission at its January 2020 meeting. Some of the potential changes to the RESCU program are 100% certain while others are less certain. For example, changes related to sales tax increases are certain while a possible change due to lack of sites for tunneling muck disposal is less certain. To the extent possible, staff will inform the Commission of potential project changes keeping in context the inherent uncertainties.
Agenda Packet Page 175

8A-2
RECOMMENDATION Receive PRESENTATION ON RESCU PROGRAM STATUS INCLUDING POTENTIAL PROJECT CHANGES
Agenda Packet Page 176
Silicon Valley Clean Water DECEMBER 16, 2019
AGENDA ITEM 8B
Agenda Packet Page 177

This page intentionally left blank
Agenda Packet Page 178

Silicon Valley Clean Water AGENDA ITEM 8B DECEMBER 16, 2019
Report By: K.H. 8B-1
RESCU PROGRAM - FRONT OF PLANT PROJECT (CIP #9502) APPROVAL OF CHANGE ORDER
ISSUE Approve Contract Change Order to the RESCU Program Front of Plant Project BACKGROUND The Commission has previously approved Stage 2 amendments to the Design-Build Agreement for the RESCU Program Front of Plant Project with Shea-Parsons Joint Venture (SPJV). There were several Stage 2 Amendments to this project to allow early work packages to begin while other aspects of the designs were being completed. In December 2018, the Commission approved the Front of Plant (FoP) Project Stage 2D Amendment and authorized the SVCW Manager to approve Contract Change orders and Allowances up to ten percent (10%) of the Contract Price for said Amendment. This Amendment covered the work to complete design and construction for the project. It was negotiated as a lump sum contract amount. SVCW held back on inclusion of two specific elements to the lump sum amount as the opportunity to reduce costs via value engineering of these elements was high. Staff continued working with SPJV to value engineer the two items to reduce costs: 1) the electrical, instrumentation and controls scope, and 2) SPJV Project Management beyond December 2021. This project is scheduled to last over five years; as with any multi-year project, there are factors that arise during the course of implementation that can necessitate changes to the contract amounts. They can be classified as “discretionary” or “non-discretionary”. Discretionary changes may result from value engineering or requests for scope changes by the Authority, while non-discretionary changes typically result from “unforeseen conditions” found during construction or that arise as a result of authorities having jurisdiction over SVCW’s operations instituting new regulations or laws. During the May 2019 SVCW Commission Meeting, SVCW staff reported that the Bay Area Air Quality Management District (BAAQMD) had instituted new emission limits for Precursor Organic Compounds (POCs) on the Front of Plant Project’s Odor Control System. BAAQMD is instituting this new requirement across the entire wastewater industry, presenting a complex challenge for wastewater facilities. For the FoP project, meeting POC limits requires a different type of air pollution control technology than was developed and contractually agreed to in the Stage 2D Amendment, resulting in a non-discretionary change order to design and construct a new odor control system. DISCUSSION SPJV has completed the design and developed a cost estimate for supplying and installing the new Odor Control System. During the time period whereby changes to the odor system were being developed, additional discretionary and non-discretionary items have been identified that require adjustments to the contract cost. A change order has been negotiated with SPJV that includes four items:
Agenda Packet Page 179

8B-2
1) Electrical, Instrumentation, and Controls Scope Progression 2) Removal of 48-inch Pipeline 3) Odor Control Technology Change
4) Project Management beyond December 2021 Below is a brief description of each element of the Change Order. 1) Electrical, Instrumentation, and Controls Scope Progression During Stage 2D final negotiations, SPJV estimated the cost to finalize the design and construct the electrical, instrumentation and controls scope to be $3 million, lump sum. SVCW believed there was opportunity to identify savings by working with SPJV to value engineer the scope as it progressed from the Stage 2D to final design. In the Amendment Scope of Work, it was mutually agreed that SVCW would carry these costs, value engineer the scope and come to mutual agreement on costs via a future Change Order. With input from SVCW staff and project representatives, SPJV completed the 100% design and construction cost estimate for a lump sum amount of $1.34 million; a $1.66 million reduction from the previous estimate. Savings were derived from a reduction in the estimated number of input/output (I/O) points, along with a reduction in the number and total length of power and instrumentation conduits runs, wiring and connections. SVCW’s Owner’s Advisor and Quality Assurance consulting teams independently reviewed and negotiated the costs and concluded that the final net increase was reasonable. 2) Removal of 48-Inch Pipeline As part of the value engineering process, SVCW and SPJV continued to evaluate the necessity of a new 48-inch pipeline originally included to facilitate plant commissioning of the headworks facilities. As design progressed from 60% to 100%, SPJV finalized its equipment selection, utilizing products that SVCW staff possess significant experience operating and troubleshooting. With this increased confidence, SVCW and SPJV mutually agreed that the new pipeline was an unnecessary discretionary cost. SPJV prepared and issued a deductive Change Order for $395,000. SVCW’s Owner’s Advisor and Quality Assurance consulting teams independently reviewed and negotiated the credit and concluded that the final net deduction was reasonable. 3) Odor Control Technology Change SPJV and the SVCW FoP Team evaluated various types of air pollution control technologies and vendors to determine the preferred solution that will reliably meet the new POC limits. This included Bio-Trickling Filter (BTF) / Granular Activated Carbon (GAC) and Chemical odor scrubber technologies to determine their ability to reliably meet the POC requirements. It was determined that a biological trickling filter system with radial activated carbon adsorption scrubbers and mist/degrease filters provided the necessary redundancy to reliably meet the BAAQMD air permit requirements during maximum flows. The introduction of the POC requirements required significant work by SPJV, including additional technical research and evaluation, redesign of the odor control system and ancillary systems, solicitation of proposals from qualified vendors, supplementary
Agenda Packet Page 180

8B-3
technical resources, and time. Additionally, SPJV will need to accelerate its construction to complete the headworks so it may receive wastewater from the Gravity Pipeline. The costs of all of these impacts are incorporated into the Change Order amount. SCVW’s Owner’s Advisor and Quality Assurance consulting teams independently reviewed the revised design drawings, cost estimates, vendor/subcontractor quotes, and schedule to assess the additional costs, in addition to the credits that were due to SVCW. Credits were associated with scope no longer necessary due to design efficiencies or replaced with redesign of the new Odor Control system. This included, but was not limited to, the original chemical odor control system, and related chemical storage tanks, electrical equipment and conduits, piping, valves and controls. Both firms independently confirmed that the net increase of $2.33 million ($1.65 million credit plus $3.98 million increase for the new system) was appropriate and reasonable, and that SPJV would be able to complete the project as originally scheduled. 4) SPJV Project Management Costs beyond December 2021 As part of its original lump sum proposal, SPJV estimated the monthly Project Management and Construction Administration cost to be $391,000 over the project’s entire duration. SVCW felt this monthly average rate was appropriate for the bulk of the project but should be reduced during the project’s final 11 months (i.e., Jan 2022 through November 2022). Specifically, SVCW felt that the level of resources required to reach substantial completion, commission the facilities and complete final punch list would be significantly less. As such, both Parties agreed to carrying Project Management and Construction Administration costs through December 2021 as part of the Stage 2D Amendment and re-assess this item as both parties become more confident in the actual costs. At this time, both parties have estimated that the final 11-months should cost approximately $2.1 million ($190,900 monthly) for Project Management and Construction Administration. This is a significant reduction from the $4.3 million ($391,000 monthly) lump sum budget originally proposed. SVCW’s Owner’s Advisor and Quality Assurance consulting teams independently reviewed this revised estimate. Both concluded that the final net deduction was reasonable, but it should be processed as an Allowance Change Order (i.e., reimbursed based on actual expenses), affording SVCW the ability to recognize additional savings. FINANCIAL IMPACT There are additional costs in the amount of $5,375,000 to the Front of Plant Project associated with value engineering of the electrical and pipeline scopes and project management costs, in addition to the unforeseen impacts resulting from BAAQMD’s new POC permit requirements. This Change Order would utilize 4.4% of the 10% Change Order and Allowance Contingency previously authorized by the Commission in December 2018. CIP budget amounts will require updating to account for these additional costs, which will occur as part of the CIP Update occurring in January 2020.
Agenda Packet Page 181

8B-4
RECOMMENDATION Move adoption of RESOLUTION AUTHORIZING THE SILICON VALLEY CLEAN WATER MANAGER TO APPROVE CONTRACT CHANGE ORDERS FOR THE FRONT OF PLANT PROJECT IN AN AMOUNT NOT TO EXCEED $5,375,000.
Agenda Packet Page 182