commercialization of aquaculture for sustainable trade
TRANSCRIPT

Commercialization of Aquaculture for Sustainable Trade (CAST) Cambodia:
Baseline Study Report
The Commercialization of Aquaculture for Sustainable Trade (CAST), Cambodia, project is funded by the United States Department of Agriculture (USDA) and implemented by the American Soybean Association (ASA) and World
Initiative for Soy in Human Health (WISHH).
The project supports increased agricultural production and trade in Cambodian aquaculture.
Project Duration: 2018-2023
Implemented by: American Soybean Association (ASA)/World Initiative for Soy in Human Health (WISHH)
Baseline study conducted by: WorldFish

i
Commercialization of Aquaculture for Sustainable Trade (CAST) Cambodia
Baseline Study Report
Prepared for
American Soybean Association (ASA) and World Initiative for Soy in Human Health (WISHH)
Prepared by
WorldFish
August 2019

BASELINE STUDY TEAM
The study was conducted by WorldFish and Nuppun Research and Consulting LtD. The WorldFish team members were:
• Olivier Joffre, PhD (corresponding author);
• Sarah Freed, PhD
• Cristiano Rossignoli, PhD
• Nhuong Tran, PhD
• Kai Ching Cheong
• Mith Samonn
• Eam Dyna
• Bun Chantrea
• Peter Jackson
• Yumiko Kura
The Nuppun Research and Consulting team included:
• Pisey Khin
• Chanthan Tha
• Julie Ngo
• Sreykhouch Ek
• Porleang Sim
• Phearum Heng
• Sokha Eng
ACKNOWLEDGMENTS
The evaluation team wishes to acknowledge ASA/WISSH for providing guidance and support.
Many individuals representing government, donors, and the private sector, participated in the interviews conducted by the evaluation team. The evaluation team expresses gratitude to the provincial and district, commune and village authorities for their support in identifying survey respondents. We would like to especially thank Fisheries Administration Cantonment officers who supported fieldwork and helped the survey team in identifying aquaculture producers and other actors of the value chain. We also thank Mr Thay Somony, Director of the Department of Aquaculture Development, and Dr Hav Viseth, Deputy Director General, Fisheries Administration, Cambodia, for their support and guidance.
We also extend sincere appreciation to Nuppun enumerators and field supervisors for their invaluable input and tireless effort from the pre-test to the end of fieldwork, and to all participating survey respondents for their generosity. We would like to thank various other respondents, donors, development partners, actors of the aquaculture value chain for their time and valuable inputs during the Key Informant Interviews.
Finally, we would like to thanks our data analysis teams at the Nuppun Research and Consulting and the WorldFish headquarters for their patience and time in cleaning and analyzing the data.
WorldFish
August 2019

Table of Contents EXECUTIVE SUMMARY ...................................................................................................... 1
1. INTRODUCTION ......................................................................................................... 7
2. METHODOLOGY ......................................................................................................... 8
2.1 Methods for population-based survey ................................................................................. 8 2.1.1 Survey design and objectives ............................................................................................................... 8 2.1.2. Respondents and study areas ..................................................................................................... 9 2.1.3. Understanding the population of interest ................................................................................ 11 2.1.4. Sample design ............................................................................................................................ 11 2.1.5. Questionnaire design ................................................................................................................. 13 2.1.6. Field work ................................................................................................................................... 13 2.1.7. Quality control and data cleaning ............................................................................................. 15 2.1.8. Data analysis and indicators ...................................................................................................... 15 2.1.9. Covariate and propensity score matching (PSM) ..................................................................... 16
2.2. Methods for qualitative study .......................................................................................... 17 2.2.1. Objectives and topical focus area ............................................................................................. 17 2.2.2. Study participants, interviewing and data collection ............................................................... 18 2.2.3. Data preparation, coding and analysis ...................................................................................... 18
2.3. Limitation of the data collected ................................................................................... 19
3. BASELINE RESEARCH QUESTIONS ............................................................................. 20
3.1. What is the current productivity of feed mills, aquaculture producers and hatcheries and
nurseries? .............................................................................................................................. 20
3.2. What is the current soy protein and fish product trade in Cambodia? ........................... 20
3.3. What is the current quantity and quality of feed and seed produced for aquaculture
producers and its availability and accessibility? ....................................................................... 21
3.4. What is the current supply of premium quality, Cambodian-grown freshwater fish to the
local market? ......................................................................................................................... 22
3.5. What is the current potential beneficiaries’ ability to access finance that is needed for
business growth and development? ........................................................................................ 23
3.6. Where are clusters of active SME farms and hatcheries that meet the selection criteria as
potential beneficiaries of CAST? ............................................................................................. 25
3.7. Where are existing value chain networks at provincial level that can be strengthened to
meet CAST objectives? ........................................................................................................... 25
3.8. Who and where are existing or potential extension service agents that can become core
facilitators of value chain networks? ....................................................................................... 25
3.9. What are the constraints and opportunities within various segments of the commercial
aquaculture value chain in Cambodia? .................................................................................... 26
4. SITUATION ANALYSIS ............................................................................................... 26
4.1. Population characteristics ................................................................................................ 26

4.2. Seasonality of production and sales ............................................................................. 27
4.3. Hatcheries and nurseries production systems .............................................................. 29
4.4. Fish farm production systems ...................................................................................... 30
4.5. Post-harvest (collectors, wholesalers and processors) .................................................. 33
4.6. Support system ........................................................................................................... 35 4.6.1. Access to loans ........................................................................................................................... 35 4.6.2. Access to knowledge and information ...................................................................................... 36
4.7. Aquaculture feed production and distribution.............................................................. 37
4.8. Climate change adaptation .......................................................................................... 38
4.9. Spatial distribution of farmer clusters and processing hubs .......................................... 39
5. STANDARD AND CUSTOM INDICATORS .................................................................... 41
5.1. Infrastructure and assets ............................................................................................. 41
5.2. Production and value of aquaculture products ............................................................. 43
5.3. Management practices of producers and input suppliers .............................................. 44
5.4. Post-harvest related indicators .................................................................................... 45
5.5. Access to loans and information .................................................................................. 47
6. COVARIATE AND CONFOUNDER ANALYSIS AND PROPENSITY SCORE MATCHING ...... 48
6.1. Covariate analysis ....................................................................................................... 48
6.2. Confounder variables .................................................................................................. 50
6.3. Propensity Score Matching (PSM) analysis ................................................................... 51
7. QUALITATIVE STUDY ................................................................................................ 51
7.1. Aquaculture industry ....................................................................................................... 52 7.1.1. Constraints and opportunities to development of commercial aquaculture sector ...................... 52 7.1.2. Constraints and opportunities to developing a traceability and quality control system for
aquaculture products .................................................................................................................................. 53
7.2. Program implementation ................................................................................................. 53 7.2.1. Barriers to program implementation ............................................................................................... 53 7.2.2. Facilitators to program implementation .......................................................................................... 54
7.3. Services and support needed for beneficiaries’ success ..................................................... 55
7.4. Relationship building ....................................................................................................... 55
8. KEY FINDINGS .......................................................................................................... 57
8.1. Aquaculture production and quality ............................................................................ 57
8.2. Value chain efficiency .................................................................................................. 59
9. RECOMMENDATIONS .............................................................................................. 59
9.1. Aquaculture production and quality ............................................................................ 59
9.2. Value Chain efficiency ................................................................................................. 61

9.3. Design of Monitoring and Evaluation system for CAST .................................................. 62
10. CONCLUSION ........................................................................................................ 63
REFERENCES ................................................................................................................... 64
ANNEXES ........................................................................................................................ 64
ANNEX A: REQUEST FOR PROPOSALS (RFP) TO CONDUCT A BASELINE EVALUATION FOR
ASA/WISHH’S FOOD FOR PROGRESS (FFPR) PROGRAM IN CAMBODIA ......................... 65
ANNEX B: SAMPLING FRAMEWORK ............................................................................... 97
ANNEX C: QUESTIONNAIRES & SURVEY TOOLS .............................................................. 115
ANNEX D: STANDARD AND CUSTOM INDICATORS ......................................................... 215
ANNEX E: LIST OF KEY INFORMANTS ............................................................................. 225
ANNEX F: ADDITIONAL RESULTS TO ANSWER BASELINE RESEARCH QUESTIONS ............. 226
ANNEX G: COVARIATES ANALYSIS ................................................................................. 242
ANNEX I: QUALITATIVE STUDY FINDINGS ...................................................................... 268

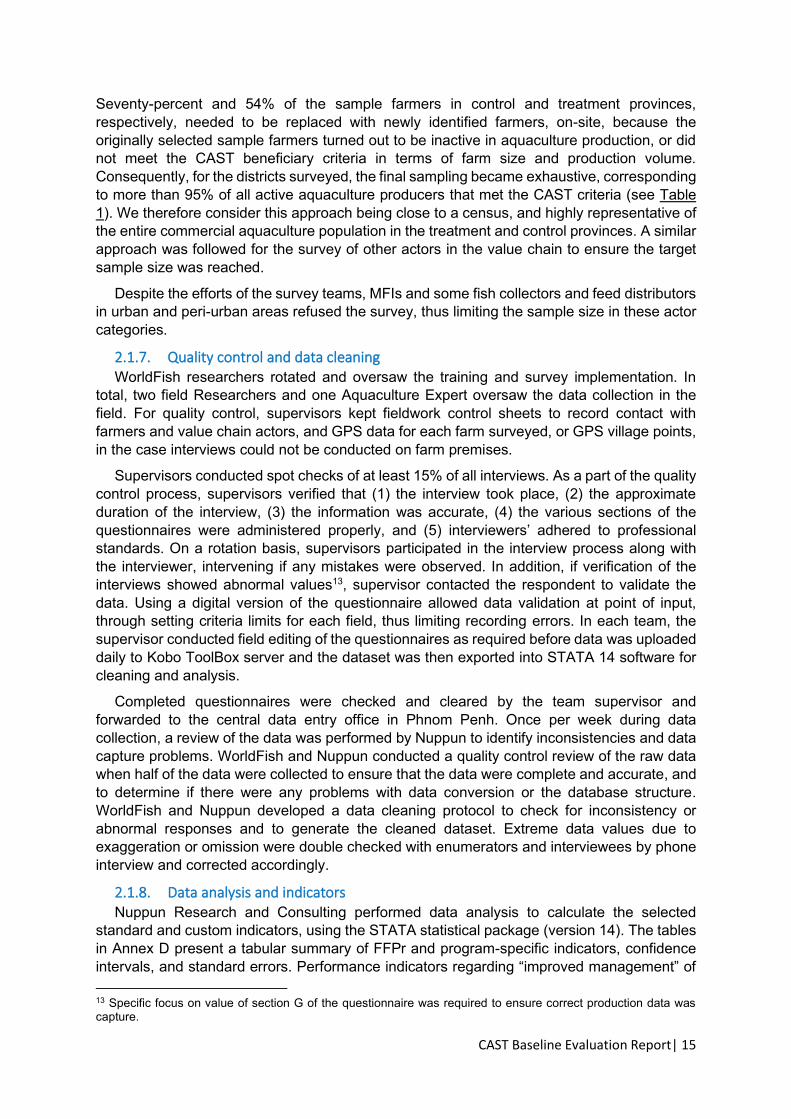
List of Figures Figure 1: Treatment (green) and control (blue) provinces of CAST program ____________________________ 10 Figure 2: Yield of cage (left) and pond-based (right) aquaculture systems in treatment and control provinces _ 20 Figure 3: Relative volume of fingerlings species sold by hatcheries and nurseries in 2018 _________________ 22 Figure 4: Distribution per species of 2018 aquaculture production in the treatment provinces _____________ 23 Figure 5: Distribution of loans granted by MFI to the different types of respondents _____________________ 24 Figure 6: Loan amount disbursed by MFI to aquaculture value chain actor in 2018 in control and treatment
provinces. _________________________________________________________________________________ 25 Figure 7 : Production calendar and selling period for different actors of the aquaculture value chain (S: stocking
fingerlings; H: Harvesting fish) ________________________________________________________________ 28 Figure 8: Average amount of feed sold by feed distributors during 2018 peak season in treatment (n=15) and
control (n=7) groups ________________________________________________________________________ 28 Figure 9: Number of fingerlings sold by hatcheries and nurseries in treatment provinces in 2018 (see Annex F,
Table I) ___________________________________________________________________________________ 30 Figure 10: Distribution of pond and cage fish farm by class size in control and treatment provinces _________ 31 Figure 11: Average stocking density in ponds (fish/m2) and cages (fish/m3) of the three most common
aquaculture species _________________________________________________________________________ 32 Figure 12: Feeding practices of producers in the different treatment and control provinces. _______________ 32 Figure 13: Type of information received by aquaculture producers ___________________________________ 33 Figure 14: Collectors, wholesalers, processors volume and origin of fish purchased in 2018 in treatment
provinces _________________________________________________________________________________ 34 Figure 15::Percentage of respondent using loans in the treatment and control groups ___________________ 35 Figure 16: Percentage of respondents who received aquaculture related training in the past ______________ 36 Figure 17: Aquaculture training received by respondents between 1998 and 2018 in treatment (left) and control
(right) groups. _____________________________________________________________________________ 37 Figure 18: Percentage of producers affected by drought and flood and equipped with a well in treatment and
control provinces ___________________________________________________________________________ 39 Figure 19: Cluster of producers (number of farms within 5 km radius), hatcheries and nurseries surveyed in
treatment provinces. The circle symbol is sized to portray a central point of each cluster based on the number of
aquaculture farms fall within the cluster ________________________________________________________ 40 Figure 20: Average number of production assets of fish farmers and hatcheries ________________________ 42 Figure 21: Average number of transportation assets of collectors, wholesalers and processors in control and
treatment provinces ________________________________________________________________________ 42 Figure 22: Total value (Million US$) and volume (thousand metric ton) Cambodian product sold by producers,
collectors, wholesalers and processors in treatment provinces. ______________________________________ 43 Figure 23: Distribution of adoption of improvement management practices in treatment and control groups of
producers _________________________________________________________________________________ 45 Figure 24: Distribution of adoption of improvement management practices of collectors, wholesalers and
processors in treatment (T) and control group (C) _________________________________________________ 46 Figure 25:: Percentage of wholesalers and processors that claimed to receive market information about i)
processed fish price; 2) live and dead on ice fish price; 3) fish quality and standard. _____________________ 48

List of Tables Table 1: Study respondents’ definition __________________________________________________________ 10 Table 2: Summary of sample for each category in treatment and control groups ________________________ 12 Table 3: Surveyed population per province ______________________________________________________ 12 Table 4: Modification in data collection method and sampling method during survey implementation ______ 14 Table 5: Key topics covered during the interviews and audience _____________________________________ 18 Table 6: Characteristics of the surveyed population _______________________________________________ 27 Table 7: Access to loan by different type of respondents ___________________________________________ 36 Table 8: List of major landing site for aquaculture products _________________________________________ 40 Table 9: List of major processing hubs __________________________________________________________ 41 Table 10: Results about Standard indicator #4; Custom indicator #11, Custom indicator #5 and perception of
the quality of Cambodian aquaculture product (related to Custom indicator #10) in treatment provinces ____ 47 Table 11: Potential confounder variables influencing CAST outcomes _________________________________ 50

Abbreviations and Acronyms
ASA American Soybean Association BAqMP Best Aquaculture Management Practice BMP Best Management Practice CAST Commercialization of Aquaculture for Sustainable Trade CE SAIN Center of Excellence for Sustainable Agricultural Intensification and
Nutrition DID Difference-in-differences FiA Fisheries Administration FFPr Food for Progress IPTT Indicator Performance Tracking Table ha HORECA
hectares Hotel, Restaurant & Caterers
KII Key informant interview LOP Life of Project MFI Micro-finance institution MT Metric tons PMP Project Monitoring Plan PSM Propensity Score Matching SPS Sanitary-phytosanitary USDA United States Department of Agriculture WISHH World Initiative for Soy in Human Health

CAST Baseline Evaluation Report| 1
EXECUTIVE SUMMARY
Introduction
Commercialization of Aquaculture for Sustainable Trade (CAST), Cambodia, is a new project funded by the U.S. Department of Agriculture (USDA), Food for Progress (FFPr) Program. The five-year program, signed in September 2018, is being implemented by American Soybean Association’s (ASA) World Initiative for Soy in Human Health (WISHH) Program. The project supports the USDA’s FFPr principal objectives of increased agricultural production and trade, by increasing the use of improved agricultural techniques and technologies among target populations, and improving linkages between buyers and sellers.
To achieve the main objectives, the project will be supporting 10 activities:
Activity #1: Capacity Building: Agricultural extension agents/services Activity #2: Inputs: Develop agro-dealers and/or other input suppliers Activity #3: Training: Improved farm management Activity #4: Training: Demonstration plots Activity #5: Training: Sanitary and phytosanitary standards (SPS) Activity #6: Capacity Building; Business management Activity #7: Capacity Building: Producer groups/cooperatives Activity #8: Training: Improved marketing and branding Activity #9: Market Access: Facilitate a traceability system for domestic aquaculture Activity #10: Financial Services: Provide SME finance, technical assistance loans and
grants
CAST engaged WorldFish in March 2019 to conduct a baseline evaluation for the project. The purposes of the baseline study were:
i) to provide baseline data for the Project Monitoring Plan (PMP), and serve as the basis for updating baseline figures for all outcome indicators, and the yearly and life-of-project (LOP) targets, as described in the Indicator Performance Tracking Table (IPTT).
ii) to provide the benchmark for the project’s midterm and final evaluations. iii) to provide contextual information and a situation analysis of the aquaculture sector
information to validate and inform the project’s interventions.
Methodology
The study was conducted from April to August 2019, including data collection using mixed methods in six treatment provinces and Phnom Penh municipality, and three control provinces of Cambodia. The data collection consisted firstly, of a Population Based Survey (1,204 producers and 191 other actors, including hatcheries, nurseries, producers, fish collectors, fish processors, fish wholesalers, feed mills, feed distributors, micro-finance institutions) framed as a quasi-experimental design with a treatment and control groups. Secondly, a qualitative study was based on 46 Key Informant Interviews (KII). The baseline study focused on “commercial” aquaculture farmers, as defined by ponds larger than 200m2 and cages more than 30m3. These included small, medium, and large-scale farms, and did not include subsistence or micro-scale producers. The quantitative survey questionnaire covered thematic modules on human resources, farm assets, production and sales, management practices, access to knowledge and training, and loans, for the 2018 calendar year.
All the data were collected and compiled using Kobo Toolbox on digital tablets. The survey data were stored and analyzed using STATA 14 (standard and custom indicators and

CAST Baseline Evaluation Report| 2
Propensity Score Matching), Excel 2016 (situation analysis) and R software (covariate analysis). The KII data were analyzed using Nvivo 12.
Baseline research questions
What is the current productivity of feed mills, aquaculture producers and hatcheries and nurseries?
The average yield of aquaculture was 4.8 kg/m2/year in ponds, and 44 kg/m3/year in cages. However, the range for both production systems varied widely, due to differences in production intensity between species1. The production intensity was generally low; the average productivity in pond culture of Pangasius in Cambodia achieved less than 25% of a similar system in Vietnam2, in terms of kg/m2.
On average, hatcheries produced 1.2 million fingerlings annually, although there was a wide range in hatchery performance, from less than 0.3 million fingerlings to 7 million. Nurseries in the treatment provinces traded about twice as much fingerlings as the total produced by 17 hatcheries surveyed in the same provinces. Hatcheries in Vietnam are the main source of fingerlings in Cambodia in both control and treatment provinces. There were no feed mills producing aquaculture feed in Cambodia in 2018.
What is the current soy protein and fish product trade in Cambodia?
Soybean production in Cambodia increased from 40,758 metric tons (MT) in 2016 to 91,729 MT in 2018. The volume of soybeans (beans, meal and cake) imported from the U.S. reached 51,000 MT in 2017, or US$19 million in value3. None of the feed mills interviewed reported the U.S. as a main source of soymeal for their animal feed ingredients.
Thirteen thousand MT of fresh and processed fish products were exported from Cambodia in 2017. Major destinations for the fish products were Thailand and Vietnam. Capture fisheries are considered to be the main source of export products.
What is the current quantity and quality of feed and seed produced for aquaculture producers and its availability and accessibility?
All manufactured pellet feed sold in Cambodia was imported. One feed mill was starting aquaculture feed production in Cambodia, but still in the development phase at the time of interview. This feed mill planned to comply with international quality standards. The feed distributors surveyed sold one to four brands of feed, and nearly all reported that at least one of the products met at least one international standard. The average volume sold by the surveyed distributors during the peak growing season was 23.4 MT, varying from 1.5 MT to 54 MT per distributor.
A total of approximately 20.3 million fingerlings, of unknown quality, were produced annually in the treatment provinces. Similarly, imported fingerlings were of unknown origin and quality. Pangasius, tilapia, and carps were the main species produced by local hatcheries, while catfish and snakehead were the main species sold by nurseries. Ninety-five percent of the total volume of Pangasius fingerling production in Cambodia came from a single hatchery. Average price of one Pangasius fingerling produced by local hatcheries was US 2.4 cents, while nurseries sold one fingerling of the same species for US 2 cents. A similar pattern was
1 For example, Pangasius stocking density in cage was estimated to 76 ind/m3 and 244 ind/m3 for Channa striata 2 http://www.fao.org/fishery/culturedspecies/Pangasius_hypophthalmus/en 3 GATS, USDA for US export to Cambodia. https://www.fas.usda.gov/data/search?f%5B0%5D=field_commodities%3A27 [accessed July 2019]

CAST Baseline Evaluation Report| 3
observed for tilapia and carp. This indicated that imported fingerlings were far more available and accessible to aquaculture producers, through licensed and unlicensed nurseries that primarily traded imported fingerlings. No Cambodian producer or importer supplied certified seed at the time of the survey.
What is the current supply of premium quality, Cambodian-grown freshwater fish to the local market?
The surveyed commercial aquaculture producers in treatment provinces sold a total of 7,941 MT of fish per year, dominated by Pangasius and giant snakehead. Top producer provinces were Phnom Penh, Pursat and Battambang. Collectors and wholesalers surveyed in treatment provinces reported purchasing a total of 8,820 MT of fish from Cambodian aquaculture producers.
None of the producers or post-harvest actors followed any recognized standard procedure in both control and treatment provinces. However, perceived quality of the Cambodian aquaculture fish by post-harvest actors was either “good” or “very good” in 70% of the respondents, and the average spoilage rate was estimated by the survey respondents to be below 5%.
What is the current beneficiaries’ ability to access finance that is needed for business growth and development?
Forty-eight percent of the respondents had contracted a loan from formal Micro Finance Institutes (MFIs) or informal sources. Fish producers were the category of respondents with the highest percentage of loans (51%). Twenty-four percent of the producers contracted loans from MFI or banks, mostly to purchase fish feed.
MFIs interviewed in treatment provinces reported an average of 12 loans each, disbursed to aquaculture value chain respondents. The average size of these loans was $26,375, with very high variability (± $25,250). Fish producers’ contracted 58% of those loans, also with high variability ($32,000 ± $30,250). Interest rates charged by MFIs were high (13% per year).
Where are clusters of active SME farms and hatcheries that meet the selection criteria as potential beneficiaries of CAST?
In the treatment provinces, we identified 50 clusters of producers within a five-kilometer radius. Those clusters varied in size, from three producers to more than 80 producers. Largest clusters are found in floating villages on the Tonle Sap Lake.
Where are existing value chain networks at provincial level that can be strengthened to meet CAST objectives?
We identified seven major wholesale fish markets (locally called “landing sites”) where aquaculture fish are traded. Those landing sites are located in Siem Reap, Kampong Cham, Pursat, Battambang Provinces and Phnom Penh. In addition, we identified 12 “processing hubs” in seven provinces, where dried fish, fermented fish, and smoked fish are produced at commercial scale. We did not find any semi-industrial fish-processing hub.
Who and where are existing or potential extension service agents that can become core facilitators of value chain networks?
Aquaculture extension services are not functioning well in Cambodia. However, we found the private sector can be a source of knowledge and information diffusion to support adoption of improved management techniques. Forty-one percent of the feed manufacturers provided

CAST Baseline Evaluation Report| 4
technical support to feed distributors. Feed distributors mostly supported farmers with technical advice at the shop, but also had technicians supporting farmers directly. On average, one feed distributor supports 13 producers.
What are the constraints and opportunities within various segments of the commercial aquaculture value chain in Cambodia?
Access to quality fingerlings and manufactured feed is limited. Fingerlings of the main commercial species are imported and local production is limited. Those imported materials are of unknown origin and quality. The high price of imported feed hindered wide spread use by producers. We found limited adoption of improved technology and practices used in all segments of the value chain, resulting in low productivity and performance of the production systems. There is no standard procedure in production and post-harvest segment.
However, the demand for local aquaculture fish, considered to be of higher quality than imported products, was found to be significant. Access to lower priced inputs, and improved efficiency of input use at the farm level would improve economic competiveness of aquaculture products on the local market.
Key findings and recommendations
Aquaculture production and quality were sub-optimal for the cultivated area. Low quality inputs, especially fingerlings of unknown origin, hindered productivity. Production systems were not diverse. However, significant differences in terms of production systems, volume, and level of management practices across provinces indicated high potential for increasing both the quantity and quality of fish produced by existing aquaculture producers.
Competition from low cost, imported fingerlings was the biggest challenge to Cambodian hatcheries. The feed supply would continue to rely on imported products for the foreseeable future, as the domestic feed production was still at a developmental stage. Formal loans from MFIs used interest rates that were prohibitively high for small- and medium-scale operators with limited profit margins. With improved access to financial and technical assistance, the producers may gain more confidence for investing in improved feed and feeding regimes.
The findings of the CAST Baseline Study are consistent with recent reviews and value chain studies of the sector. The sector is dependent on imports for inputs and the practices and performance of the sector are sub-optimal. The value chains are inefficient, and neither vertically nor horizontally integrated. Those challenges can be grouped into two categories related to i) aquaculture production and quality and ii) value chain efficiency. Therefore, various CAST sub-activities need to be implemented in a coordinated manner to achieve performance improvements in productivity and quality at the same time as the improvement in access to market and profitability.
Based on these findings, it is recommended that the CAST Activities #1, #2, #3, #4, and #10 consider the following strategies to address challenges related to aquaculture production and quality:
• Focus the project interventions, initially, on existing producer clusters, in selected locations, and key species, and use an “incremental innovation approach” to gradually upgrade management practices of producers, particularly feeding.
• Focus the technical interventions, initially, to support a large number of pond-based producers who can improve the productivity through relatively simple changes in water management and pond preparation.

CAST Baseline Evaluation Report| 5
• Develop Best Aquaculture Management Practice (BAqMP) guidelines for CAST, that can later inform the contents of future national Best Management Practices (BMP) to be developed by the Fisheries Administration.
• Develop model farms, for both ponds and cages, to demonstrate improved production techniques as well as effective business models.
• Apply an integrated approach to address financial and technical obstacles simultaneously throughout the production and post-harvest value chain.
• Support MFIs and insurance companies to gain improved understanding of aquaculture-related businesses and assess their financial performance and lending risks.
• Support climate change adaptation by identifying key communes and districts where access to water is a constraint and/or frequently affected by flooding.
Demand for quality aquaculture fish produced in Cambodia is increasing, but the current production level, and the capacity of local producers, is too low to meet this demand. A reliable mechanism for assuring traceability and quality standards, such as third-party certification, or a “block-chain” mechanism using digital technology, needs to be established. Without such system, it is difficult for products that meet certain consumer preferences and market niches to gain premium prices. These premiums will, in turn, attract more producer compliance, and gradually lead to an overall improvement in the industry. The hygiene standards and fish handling/transportation technologies of post-harvest operators need to be improved as a priority.
Fish buyers and traders are often the only source of market information for producers, and thus have distinct advantage over the producers. Many producers are also tied to particular buyers through debt. Improved access to other financial services, market information, and alternative models of trading and marketing, can improve the negotiating position and profit of producers in the value chain.
Based on these findings, it is recommended that the CAST Activities #5, #6, #7, #8 and #9 consider the following strategies to improve value chain efficiency:
• Enhance and expand the existing networks of hatcheries/nurseries and producer clusters to include post-harvest operators, to improve the quality and flow of new knowledge and technology, and market information to the producers, and demonstrate a more transparent and equitable value chain.
• Improve business management practices at individual farm and business operator level, to promote self-sufficiency, and avoid over-reliance on external subsidies.
• Identify markets for higher quality fish and fish products, before engaging in training. Training for improved hygiene and quality, as well as traceability system should be demand driven
• Provide training and awareness raising on hygiene and quality control, and develop a traceability system, that responds to specific market demand for certain types of fish and fish products.
• Focus on key species (Pangasius and snakehead) and product (dry and smoked fish) and also include live-fish when developing improved post-harvest and marketing practices.
• Facilitate alternative contractual arrangements between producers and buyers (such as group contracts), and pricing systems (such as collective marketing and/or auctioning of farmed fish).
• Support for the traceability and SPS mechanisms should initially focus on a limited number of commodities or products, as a pilot, such as Pangasius or giant snakehead,

CAST Baseline Evaluation Report| 6
that are already linked, with a relatively well-organized value chain, to major consumer markets in urban areas.
• Develop an SPS scheme for CAST, in line with existing SPS in the aquaculture industry in Southeast Asia, and start testing the implementation in collaboration with the Cambodian government and private sector.
• Provide support to value chain actors that have limited access to formal loans to develop robust business models and plans to facilitate improved access to formal loans.

CAST Baseline Evaluation Report| 7
1. INTRODUCTION In the 2018 fiscal year, the U.S. Department of Agriculture (USDA) entered into a new
award for the Food for Progress (FFPr) Program. The FFPr program has two principal objectives: to improve agricultural productivity and to expand trade of agricultural products. The FFPr program provides for the donation of U.S. agricultural commodities to developing countries and emerging democracies, committed to introducing and expanding free enterprise in the agricultural sector.
Commercialization of Aquaculture for Sustainable Trade (CAST), Cambodia is a new five-year program under FFPr, signed in September 2018, and implemented by the American Soybean Association / World Initiative for Soy in Human Health (WISHH). The project supports the USDA FFPr principal objectives by increasing the use of improved agricultural techniques and technologies among target populations and improving linkages between buyers and sellers. The two main objectives of CAST Cambodia are:
• Increase agricultural productivity in the freshwater aquaculture industry through improved inputs and practices; and
• Increase trade in Cambodian aquaculture, by volume and value.
To achieve the main objectives, the project will be supporting 10 activities:
Activity #1: Capacity Building: Agricultural extension agents/services Activity #2: Inputs: Develop agro-dealers and/or other input suppliers Activity #3: Training: Improved farm management Activity #4: Training: Demonstration plots Activity #5: Training: Sanitary and phytosanitary standards (SPS) Activity #6: Capacity Building ; Business management Activity #7: Capacity Building: Producer groups/cooperatives Activity #8: Training: Improved marketing and branding Activity #9: Market Access: Facilitate a traceability system for domestic aquaculture Activity #10: Financial Services: Provide SME finance, technical assistance loans and
grants
These activities are linked to the USDA FFPr Results Framework #1 Increased Agricultural Productivity. Two key “results streams” will lead the achievement of this Strategic Objective: Result Stream 1, under the result Increased Use of Improved Agricultural Techniques and Technologies and Result Stream 2, under the result Improved Farm Management (Operations, Financial). CAST project activities are also linked to FFPr Results Framework #2: Expanded Trade of Agriculture Products on domestic, regional, and/or international levels. Results Framework #2 possesses three key “result streams”: Result Stream 1, under the result Increased Value Added to Post-Production Agricultural Products; Result Stream 2, under the result Increased Access to Markets to Sell Agricultural Products; and Result Stream 3, under the result Improved Transaction Efficiency.
In addition, activities are related to foundational results that are linked to either Result Framework #1 or #2. Those foundational results are:
• Increased Capacity of Government Institutions • Improved Policy and Regulatory Framework • Increased Access to Improved Market Information • Improved Capacity of Key Groups in the Agriculture Production Sector (i.e. cooperatives and small shareholder farmers) • Increased Leverage of Private Sector Resources (i.e. cost-sharing or leveraging of private sector resources, either cash or in-kind, that seeks to improve production infrastructure)

CAST Baseline Evaluation Report| 8
The project will implement these activities in six provinces (Kampong Cham, Kampong Thom, Siem Reap, Battambang, Pursat, Kandal) and Phnom Penh in Cambodia.
In line with the USDA’s Monitoring & Evaluation Policy, updated in February 2019, CAST Cambodia contracted WorldFish to perform a baseline study of the program (see Annex A – Terms of Reference). The purposes of the baseline study are:
i) to provide baseline data for the Project Monitoring Plan (PMP) and serve as the basis for updating baseline figures for all outcome indicators and the yearly and life-of-project (LOP) targets described in the Indicator Performance Tracking Table (IPTT).
ii) to provide the benchmark for the project’s midterm and final evaluations. iii) to provide contextual information and a situation analysis of the aquaculture sector to
inform the project interventions.
This baseline survey is the first phase of a pre-post evaluation. The second phase comprises an end-line survey or final evaluation, following project completion.
This baseline report is organized as follows. We first present the methodology used in both quantitative and qualitative surveys (Section 2). Section 3 presents answers to the baseline research questions. Situation analysis (Section 4) gives an updated picture of the aquaculture sector in the treatment and control provinces. Section 5 presents the evaluation of baseline standard and custom indicators and provides details on organization and performance of the sector. Co-variate and confounder analysis are presented in Section 6. In Section 7 we present findings of the qualitative study. Key findings are presented in Section 8 before presenting the recommendations for project implementation and M&E in Section 9.
2. METHODOLOGY The study uses a mixed-methods approach, involving quantitative and qualitative
investigations. The quantitative component adopts a quasi-experimental design in which nine different types of potential project beneficiaries, across the six treatment provinces and Phnom Penh municipality, and three control provinces, are surveyed for their performance and current practices. The qualitative component consists of key informant interviews (KIIs) with different actors within the aquaculture value chain.
Following are details of the methods deployed to answer baseline questions and calculate baseline figures for the associated Standard and project–specific (Custom) indicators, as well as detailed information on performance and organization of the sector to inform project intervention.
2.1 Methods for population-based survey
2.1.1 Survey design and objectives The primary objective of the population-based survey was to establish baseline figures for
key project indicators in the program’s IPTT, to be approved by USDA before the project implementation period begins in October 2019. To quantify the impact of the project intervention on target outcomes during the final evaluation, we recommend that the CAST project use a Difference-in-Differences (DID) approach, which compares the before-after changes in outcomes between individuals in the intervention group and those in the control group.
Data analysis is to set the stage for the use of the DID methods during the final evaluation. In order to increase accuracy of impact evaluation, and avoid bias due to differences between control and treatment groups, we conducted a Propensity Score Matching (PSM) to match individuals from control groups with individuals from treatment groups. The matching is done at the farm level and based on farm characteristics. After matching, it is expected that there

CAST Baseline Evaluation Report| 9
will be no significant differences in characteristics (control variables) between treatment and control groups for those farm characteristics and thus adequate comparative analysis of farm performance can be done during the final evaluation.
2.1.2. Respondents and study areas For the purpose of conducting an impact evaluation at the end of the project, the baseline
was based on a binary approach with treatment and control groups. The baseline sample was selected based on the list of potential project participants, considering project participation and geography to define treatment and control groups.
The treatment group covers the six CAST-selected provinces (Kampong Cham, Kampong Thom, Siem Reap, Battambang, Pursat, Kandal) and Phnom Penh. The control group covers three provinces: Takeo, Banteay Meanchey (pond aquaculture) and Kampong Chhnang (cage aquaculture). This group is well representative of the diversity of aquaculture production systems (Figure 1Error! Reference source not found.). Kampong Chhnang has been selected to represent aquaculture production using cage technology, whereas Takeo and Banteay Meanchey represent pond technology. Banteay Meanchey was also selected to include within the control group the influence of Thailand on the aquaculture sector. Takeo is included in the control group to mirror the influence of Vietnam. In addition, a Japanese funded aquaculture project was operating in Takeo (2005-2010) and Banteay Meanchey (2011-2015) Provinces. Cambodia HARVEST, a USAID funded project operated in treatment provinces (Siem Reap, Kampong Thom, Battambang, and Pursat) between 2010 and 2016. During the timeframe of CAST project, a large EU funded project, implemented by the Fisheries Administration and Agence Française de Development (AfD), named EU-CAPFishAqua, will be deployed 2019 -2025. The province of intervention of this project is not yet finalized but it will surely overlap with provinces included in the treatment and control group.
The population-based survey encompasses nine groups of value chain respondents: hatcheries, nurseries, producers, fish collectors, fish processors, fish wholesalers, feed mills, feed distributors, and micro-finance institutions. For the purpose of this study, definition of these value chain respondents is provided in Table 1. Note that the survey focused on commercial aquaculture, including smallholder farms, but excluded subsistence farmers and micro-scale producers, with pond area smaller than 200m2 or cage volume smaller than 30m2. This choice was motivated by the fact that CAST project focus on commercial aquaculture and will not work with subsistence farmers.
First, the treatment and control populations were clustered by province. In the second step, a random sampling procedure was used to ensure a representative sample of the farms, for both cage and pond producers, across the treatment and control provinces. Details of the sampling procedure are found in Section 2.1.4.
For other respondents (feed mills, hatcheries, nurseries, feed distributors, processors and
wholesalers), due to the small size of the population considered, we used a descriptive statistics of a purposive sample to allow comparisons of the quantitative values before, during, and after the project interventions.

CAST Baseline Evaluation Report| 10
Table 1: Study respondent definition
Respondents Definition Hatcheries Actors who are producing at least 100,000 fish fry and fingerlings per year
in Cambodia, to sell to producers and/or to nurseries. Nurseries Actors who are purchasing fry and/or fingerlings from a hatchery (including
abroad) to nurse them for a variable period, to re-sell later to producers. Producers Actors who are producing fish for income generation. They operate
production units larger than 200m2 (pond) or 30m3 (cage) and are selling more than 80% of their production.
Collectors Actors who are buying fish at the farm level and selling fish to wholesalers/processors; some of these individuals/actors may also sell some fish to the end user/consumer
Wholesalers Actors who are buying fish either directly at the farm or from collectors. Wholesalers re-sell fish to retailers at market, restaurants, caterers or processors. Their transportation and trading capacity is larger than collectors (car or trucks)
Processors Actors who are buying fish either directly at the farm, from collectors, or wholesalers. Processors are can be still family based, but with long term or seasonal employees. Processors transform the “raw material” (fish) before marketing their products
Feed distributors Local businesses who are managing shops that sell aquaculture feed and other inputs used to culture fish
Feed mills (managers)
Manager of factory where animal feed is processed. It can be animal feed for chicken, pork or fish production.
Micro-finance institutions
Bank or formal MFI providing loans to actors within the aquaculture value chain
Figure 1: Treatment (green) and control (blue) provinces of CAST program

CAST Baseline Evaluation Report| 11
2.1.3. Understanding the population of interest Information related to aquaculture producers and stakeholders in the value chain is scarce
in Cambodia. To estimate existing population and inform sample size we triangulated secondary sources of information and conducted a scoping exercise in each of the treatment and control province to verify information and identify potential survey respondent.
To achieve this, we triangulated secondary sources of information, including statistics collected from several governmental sources (e.g., 2015 Cambodia Socio-Economic Survey; Fisheries Statistics at provincial level) and past aquaculture projects, to identify clusters of aquaculture producers that responded to CAST project beneficiary criteria. The data informed the scoping exercise in identifying districts and communes where aquaculture operations are concentrated. This information was verified during the scoping exercise.
During April and May 2019, three WorldFish researchers conducted field missions to treatment and control provinces, and collected lists of producers and other respondents at district and commune levels in collaboration with the Fisheries Administration Cantonment Officers.
The team collected updated information about fish farmers and other CAST targeted respondents, with input from Fisheries Administration (FiA) Cantonment officers, local authorities and key stakeholders of the aquaculture value chain. The researchers followed the same procedure in each province:
• Contacting local FiA authorities to inform them about the plans for the scoping exercise and the upcoming survey
• Identify, in collaboration with FiA Cantonment officers, key stakeholders of the value chain and list producers and other potential respondents responding to project criteria.
• Collect the name and contact information of the respondents and/or local village leaders to facilitate survey organization and implementation.
The scoping resulted in identifying 1,617 potential respondents in the aquaculture producer category and 406 respondents in the other categories (hatcheries, nurseries, post-harvest actors, feed mills, and feed distributors).
2.1.4. Sample design Based on the sample size calculating formula4, a 3% margin of error, and a 95% confidence
interval, the total population of aquaculture farmers in each province was used to determine the target sample size for aquaculture farmers. The sample size at the provincial level for aquaculture farmers was adjusted for an expected response rate of 70%. Using this method, the sample size of the treatment group was determined as 894 respondents. The sample size for the control group was revised upward to 300, from the initial target of 260 respondents. This addressed possible heterogeneity due to different aquaculture technology (pond and cage), and in anticipation of potential future drop-off of some farmers from aquaculture business, that could undermine the final evaluation process due to a reduction in the sample size of the control group.
During implementation of the survey, the random sampling was partially abandoned as the listing was not accurate enough (producers already stopped aquaculture activities or not corresponding to the CAST criteria of beneficiaries). Those aquaculture farmers were replaced
4 Formula calculating sample size: n=((z^2 r(1-r))/e^2 )/(1+(z^2 r(1-r))/(e^2 N)) Where, n = Sample size; z = z-score (following the normal distribution); N = Population size; r = Response distribution, assumed at 50%

CAST Baseline Evaluation Report| 12
(58% of total sample) by other farmers corresponding to the criteria in order to achieve the target sample size. In addition, two districts in Battambang Province were added to the sampling framework in order to achieve the target sample size. The selection of new farmers and new districts was performed during the survey and in collaboration with village authorities who have detailed and updated information about aquaculture activities. ANNEX B: SAMPLING FRAMEWORK presents the details of those changes.
Thus, the sampling has shifted to purposive selection, achieving much higher representativeness of the target beneficiary farms than would have been possible with random sampling.
The total population of other respondents was estimated at 406 (Table D, ANNEX B: SAMPLING FRAMEWORK), in the treatment and control provinces. Of this population, we selected a sub-sample, with the following criteria, per province: i. all feed mills in activities; ii. three micro-finance institutions; iii. three feed distributors5; iv. three wholesalers; v. five collectors; vi. 30% of the existing medium scale fish processor; vii. all hatchery operations; viii 10 nurseries6.
Table 2: Summary of sample for each category in treatment and control groups
Aquaculture Producers Other value chain actors (purposive sample)
Total Number of producers
Planned sample
size
Number of producers surveyed
Feed
mills
Hat
cher
ies
Nur
serie
s
Proc
esso
rs
Who
lesa
lers
Col
lect
ors
Feed
di
strib
utor
s
Fina
ncia
l in
stitu
tions
Treatment Provinces
1209 894 918 17 8 26 21 24 17 11
Control Provinces
408 300 286 8 13 1 8 8 16 7 6
Total 1,617 1,194 1,204 8 30 9 34 29 40 24 17
Table 3: Surveyed population per province
Producers Hatcheries Nurseries Collectors Wholesalers Processors Feed distributors
Feed mills
MFI
Treatment Provinces Phnom Penh
70 0 1 3 4 3 1 6 1
Kandal 99 2 1 3 2 2 0 1 1 Kampong Cham
137 3 2 1 4 2 2 1 1
Kampong Thom
109 1 1 5 3 8 3 0 1
Siem Reap 162 3 1 3 3 5 3 0 3 Battambang 96 5 2 4 2 4 5 0 2 Pursat 245 3 0 5 3 2 3 0 2 Control Provinces Takeo 106 12 1 5 3 2 3 0 3 Kampong Chhnang
146 1 0 6 4 4 3 0 2
Banteay Meanchey
34 0 0 5 1 2 1 0 1
5. Feed distributors have been selected from i) a list of CAST project partners and ii) when not available in the province additional feed distributors were selected with a single criteria (currently sell aquaculture) 6 Licensed nurseries were selected in the existing provinces

CAST Baseline Evaluation Report| 13
Using these categories of actors, in treatment and control populations, a final sample of 1,395 respondents was realized. Table 2 and 3 summarize the distribution of producers and respondents in Control and Treatment provinces. The detailed sampling framework is described in Annex B and observed differences between our planned and realized survey is detailed in Section 2.1.6.
2.1.5. Questionnaire design The survey questionnaires (see ANNEX C: QUESTIONNAIRES & SURVEY TOOLS for
the English version of the questionnaire) were developed through consultation with local aquaculture experts, CAST team, and the Fisheries Administration. The questionnaire was designed to capture the data and information needed for the indicators and the level of disaggregation required for each type of respondents using the USDA FFPr Standard Indicators Handbook7. Definitions for program-specific indicators were discussed and confirmed with CAST before drafting the questionnaire.
The questionnaire is composed of 15 thematic modules8, that cover all indicators for all applicable beneficiary groups (ANNEX C: QUESTIONNAIRES & SURVEY TOOLS). To minimize errors, speed up data collection, and facilitate quality control, a digital tablet-based data collection application was utilized: KoBoToolBox9. To reduce the complexity of programming the questionnaire in KoBoToolBox, the questionnaire was split into five digital questionnaires based on actors’ typology (1: aquaculture producers; 2: post-harvest actors and feed distributors; 3: feed mills; 4: micro-finance institutions; 5: nurseries and hatcheries). Data collected for the Baseline survey covers the period of production and trade in the 2018 calendar year.
For training enumerators, WorldFish developed a glossary of key terms and a Powerpoint presentation that illustrated key techniques and terms related to aquaculture in Cambodia. Nuppun Research and Consulting facilitated enumerator training May 21st – 23rd in Phnom Penh. A representative of WorldFish staff was present during all the sessions to provide technical guidance regarding aquaculture. The training covered topics such as supervisor roles and responsibilities, behaviors and ethics, and GPS data collection. Also included was a detailed review of the producer’s survey questionnaire with group practices and mock interviews and role playing. Twenty-five enumerators and five field supervisors joined the training and field testing. Producer questionnaires were field tested on May 29th in four villages in Kampong Chhnang Province, and the questionnaire was finalized10 after feedback from the team on May 30th. Questionnaire for other respondents was tested in Kandal Province on June 23rd and updated on June 24th. Field testing was the opportunity to verify the functioning of digital survey tool (skipping logic, data capture and transfer to server), question phrasing, units of variables11, and logic within the different modules.
Based on the feedback from those exercises, several questions needed to be re-phrased, units updated to fit local practices or complemented with additional pre-determined choices.
7 Food Assistance Indicators and Definitions. Foreign Agricultural Service – Food Assistance Division. United States Department of Agriculture. February 2019 8 A: Registration; B: human Resources; C: Farm Assets; D: Post harvest equipment; E: Hatcheries sales & production; F: Nurseries stocking and sales; G: Producers; H: Management practices; I: Trade of fish (live, chilled and processed); J: Quality post-harvest; K: Knowledge and training; L: Finance and access to loan; M: Feed mills; N: Micro-finance and Banking; O: Feed distributors 9 https://www.kobotoolbox.org/ 10 For example, the fish species included in the questionnaire or the capture of production cycle needed to be updated 11 For example, certain value capture in KHR needed to be changed to be capture in million KHR as KoboToolBox does not allow integer of more than 9 digits.

CAST Baseline Evaluation Report| 14
2.1.6. Field work Fieldwork occurred June 5th to July 12th, in two phases. The first phase (June 5th to July 5th)
surveyed fish producers, and a second phase (June 27th to July 12th) surveyed other actors of the value chain. All survey interviews were conducted in Khmer language. The aquaculture producer survey was carried out by five teams, each consisting of a field supervisor and five enumerators. The survey of other value chain actors was conducted by three teams, each consisting of a field supervisor and 2-3 enumerators.
Table 4: Modification in data collection method and sampling method during survey implementation
Content area Original plan Change made Rationale Sampling approach and strategy
Random selection of respondents based on data collecting during scoping exercise
No longer random, but purposive. Adjustment of rules due to: - logistic issues by substituting and replacing farmers in remote area by farmers located near other sampled farmers - low accuracy of listing of aquaculture producers. Replacement by other farmers in the same commune.
To effectively select farmers that responded to CAST beneficiary selection criteria and collect the targeted sample size
Data collection for purposive sample
Respondents to be interviewed in person
10 MFI and one feed mill, interviews were conducted over the phone.
To ensure accuracy of administrative data as respondent need to check his/her record to answer the question(s) Limit transport cost and time to provinces
Key Informant Interview selected within the Purposive sample
Select another respondent for KII or purposive sample selection due to survey fatigue (3 cases)]
Survey fatigue of respondent having to respond to two surveys within one month increased non-response rate
Approach to MFI Approaching MFI directly at provincial level
Approaching MFI at Headquarter in Phnom to get access to information in province
MFI office in province were reluctant to respond to our survey
For both surveys, one survey manager oversaw the entire process, and one data manager oversaw the data upload on Kobo ToolBox server12. All interviews were conducted face-to-face, but interviews with MFIs were performed by phone, due to the short length of the questionnaire and the other reasons described in Table 4. Questionnaires were sent in advance by e-mail, as respondents needed to consult their records to answer the survey. The survey data were GPS-referenced to facilitate replication of surveys for the final evaluation and project activities.
The data collection occurred on the farm premises, unless logistical or transportation constraints prevented the enumerator's visit (e.g., in about 30% of the floating villages, corresponding to 130 farms and about 10 other farms in Battambang where interviews occurred at the house of the producer). During survey implementation, several modifications to the plan were required to fit the local context (Table 4), notably the inaccuracy of the listing of commercial aquaculture producers developed in collaboration with FiA Cantonments.
12 https://kobo.humanitarianresponse.info/accounts/login/?next=/#/
CAST Baseline Evaluation Report| 15
Seventy-percent and 54% of the sample farmers in control and treatment provinces, respectively, needed to be replaced with newly identified farmers, on-site, because the originally selected sample farmers turned out to be inactive in aquaculture production, or did not meet the CAST beneficiary criteria in terms of farm size and production volume. Consequently, for the districts surveyed, the final sampling became exhaustive, corresponding to more than 95% of all active aquaculture producers that met the CAST criteria (see Table 1). We therefore consider this approach being close to a census, and highly representative of the entire commercial aquaculture population in the treatment and control provinces. A similar approach was followed for the survey of other actors in the value chain to ensure the target sample size was reached.
Despite the efforts of the survey teams, MFIs and some fish collectors and feed distributors in urban and peri-urban areas refused the survey, thus limiting the sample size in these actor categories.
2.1.7. Quality control and data cleaning WorldFish researchers rotated and oversaw the training and survey implementation. In
total, two field Researchers and one Aquaculture Expert oversaw the data collection in the field. For quality control, supervisors kept fieldwork control sheets to record contact with farmers and value chain actors, and GPS data for each farm surveyed, or GPS village points, in the case interviews could not be conducted on farm premises.
Supervisors conducted spot checks of at least 15% of all interviews. As a part of the quality control process, supervisors verified that (1) the interview took place, (2) the approximate duration of the interview, (3) the information was accurate, (4) the various sections of the questionnaires were administered properly, and (5) interviewers’ adhered to professional standards. On a rotation basis, supervisors participated in the interview process along with the interviewer, intervening if any mistakes were observed. In addition, if verification of the interviews showed abnormal values13, supervisor contacted the respondent to validate the data. Using a digital version of the questionnaire allowed data validation at point of input, through setting criteria limits for each field, thus limiting recording errors. In each team, the supervisor conducted field editing of the questionnaires as required before data was uploaded daily to Kobo ToolBox server and the dataset was then exported into STATA 14 software for cleaning and analysis.
Completed questionnaires were checked and cleared by the team supervisor and forwarded to the central data entry office in Phnom Penh. Once per week during data collection, a review of the data was performed by Nuppun to identify inconsistencies and data capture problems. WorldFish and Nuppun conducted a quality control review of the raw data when half of the data were collected to ensure that the data were complete and accurate, and to determine if there were any problems with data conversion or the database structure. WorldFish and Nuppun developed a data cleaning protocol to check for inconsistency or abnormal responses and to generate the cleaned dataset. Extreme data values due to exaggeration or omission were double checked with enumerators and interviewees by phone interview and corrected accordingly.
2.1.8. Data analysis and indicators Nuppun Research and Consulting performed data analysis to calculate the selected
standard and custom indicators, using the STATA statistical package (version 14). The tables in Annex D present a tabular summary of FFPr and program-specific indicators, confidence intervals, and standard errors. Performance indicators regarding “improved management” of
13 Specific focus on value of section G of the questionnaire was required to ensure correct production data was capture.

CAST Baseline Evaluation Report| 16
farms and businesses14 were constructed based on several sub-indicators, reflecting an array of technology and practices. The sub-indicators include: “improved aquaculture technology and practices”, “marketing practices”, “post-harvest practices and technology”, and “other improved technology” (including business management)15. A firm or a farm was considered to be following “improved management practices”, only if the management follows at least 50% (±10%) of improved aquaculture technology and practices and 80% (±10%) of marketing, post-harvest and other improved technology and practices. Those thresholds were set up to reflect common improved management practices. For example, the sub-indicator “improved aquaculture technology and practices” is composed of a list of 15 aquaculture management practices.
Missing data were excluded from calculation in both enumerator and denominator. “Don’t know” responses were considered as answers and counted separately. For the calculation of the indicators, “don’t know” responses were considered as a missing value.
For spatial analysis, the team used ArcGIS software to identify clusters of farmers within a 5 km radius to each other, using the GPS coordinate of the interviewed farms. Thus, the identified clusters include aquaculture farms within a 5 km radius.
Using the same tools and data, we included the location of the top 15 producers in each province (in terms of annual aquaculture volume produce per year) and location of hatcheries and nurseries to capture the geographical location of the farmer clusters and the source of fingerlings.
Analysis of other situational analysis variables was completed in Excel 2016 or STATA 14. These included aquaculture production system related variables (yield, stocking density, production) disaggregated for the main aquaculture species, and province. Variables related to performance of hatcheries, nurseries, feed distributors and post-harvest respondents were also disaggregated by species or product. Analysis included frequency of response in treatment and control provinces. In addition, qualitative information collected during the scoping exercise concerning main processing hubs and aquaculture fish wholesaler market was added to the analysis.
2.1.9. Covariate and propensity score matching (PSM) We performed covariate analysis using R software, and tested the influence of key
covariates on a selected number of variables. This covariate analysis explores which factors may affect outcomes from future projects.
Selected covariates include: province of farm or business; age and gender of farm or business owner; participation in a past project; receipt of loans; and for producers, the type of production (cage or pond). Control and treatment groups were tested for the confounder analysis. The effect of covariates were tested on the following variables: sales volume; sales value; yield; frequency of pellet feed; top fish species (in terms of volumes produced for hatcheries, nurseries, and producers; markets for collectors and wholesalers; processed products for processors); and the most frequently-reported type of management practice or technology (for aquaculture management and post-harvest/business/market practices). For the variable of yield, cage and pond producers were treated as separate populations rather than a covariate. This is due to the substantial difference in yield between cage and pond production systems. The covariate analysis used descriptive measures (frequencies and
14 Corresponding to Standard indicators #2; #3; #4; and custom indicators Custom #2; #3; #11. See Annexes D for definitions of the indicators. 15 Those sub-indicators are based on the disaggregation level of Standard indicators #3 and #4 indicated in the USDA Indicators and Definitions Handbook February 2019

CAST Baseline Evaluation Report| 17
means as appropriate) and variance measures (standard deviation and chi-squared tests as appropriate).
Our plan for data analysis sets the stage for the use of the Difference-in-Difference methods. However, baseline data alone is not sufficient to carry out this analysis. To prepare the final evaluation we conducted a propensity score matching (PSM) analysis in order to match individuals from control groups with producers from treatment groups for the future evaluation process. PSM uses observed characteristics to construct a statistical comparison group that is based on a model of the probability of participating in the program intervention. We conducted PSM for the aquaculture producer group only because of the insufficient sample size for other value chain actors. To be statistically significant, the minimum sample size of the control group should be at least 30 while that of treatment should be double. Considering the sampling framework (Table 2), we could only perform PSM on the aquaculture producer group.
After matching, it is expected that there will be no significant differences in characteristics (control variables) between treatment and control groups. To assess the matching quality, we checked the standardized bias of each independent variable in the logistic regression before and after matching. A standardized mean bias below 3% or 5% after matching is sufficient.
A priori, we used 11 variables16 to conduct the PSM. This analysis was performed under STATA 14, using the psmatch2 command and included the following three main steps: (i) checking the goodness-of-fit of the model; (ii) checking balancing property using the pscore command; and (iii) conducting the pstest.
2.2. Methods for the qualitative study
2.2.1. Objectives and topical focus area The purpose of this research is first to learn more about the aquaculture industry in
Cambodia, what are the facilitators and barriers to future project implementation, and to identify constraints and opportunities to build relationships between actors along the value chain.
The study covers the three topics described in
16 1. Age of proprietor; 2. Sex of proprietor; 3.Total number of household laborers involved in aquaculture; 4. Total number of full time and part time employees; 5. Total area (m2) of grow-out ponds; 6. Total volume (m3) of grow-out cages; 7. Main source of water; 8. Number of pumps owned; 9. Operate a feed cooker; 10. Number of production cycles in 2018; 11. Number of species stocked in 2018.

CAST Baseline Evaluation Report| 18
Table 5, developed in collaboration with CAST, and discussed with an array of stakeholders involved in the aquaculture value chain. The content of

CAST Baseline Evaluation Report| 19
Table 5 guided the development of several interview guides that varied according to the audience. The English version of the interview guides are found in ANNEX C: QUESTIONNAIRES & SURVEY TOOLS.

CAST Baseline Evaluation Report| 20
Table 5: Key topics covered during the interviews and audience
Key Topics Additional Information Aquaculture Industry
Areas of interest: • Commercialization of the
aquaculture sector • Traceability and quality control
system for aquaculture products
Purpose: Better understand the constraints and opportunities to development of a commercial aquaculture sector and specifically a traceability and quality control system at the sector level. Audience: Development partners, HORECA, Government, MFI
Program Implementation Areas of interest: • Barriers and facilitators to
program implementation • Services and support needed for
beneficiaries’ success • Awareness of and participation in
other aquaculture support programs
Purpose: Better understand the barriers ad facilitators to deploy the project on the ground, reach beneficiaries and provide appropriate support in terms of content and format. Understand where CAST is placed compare to aquaculture project.
Audience: CAST partners, project potential beneficiaries* (Development partners, Government will be asked about Awareness area of interest, only)
Relationship Building Areas of interest: • Current and future communication
between market actors
Purpose: Better understand the gaps and needs in terms of communication between actors of the value chain and access to knowledge for specific actors of the value chain
Audience: Project potential beneficiaries; HORECA, MFI
2.2.2. Study participants, interviewing and data collection The qualitative study covered more actors in the sector than the population-based survey,
including CAST project partners, Government representative, development partners and fish retailers, in addition to project potential beneficiaries.
WorldFish and CAST selected a total of 46 Key Informants (ANNEX E: LIST OF KEY INFORMANTS). Criteria for selection included their level of interest toward CAST activities and their role and importance in the value chain. The scoping exercise performed by WorldFish (see Section 2.1.3Error! Reference source not found.) identified some key actors of the value chain (hatcheries, nurseries, wholesalers, collectors, processors). These actors were selected for KII, based on their volume of operation and reputation. For feed distributors, Agri-Master, a feed company that will be a key partner of CAST, provided us a list of their feed distributors to interview. Government agency representatives, development partners and donors, were identified within the members of Technical Working Group Technical Working Group on Fisheries.
WorldFish implemented the qualitative study. Three staff conducted the interviews from June 3rd-30th, 2019. The interviewers contacted the key informants in advance, either by e-mail or by phone to make appointments, inform them about the study, and give details about the purpose and topics to be covered during the interview. Interviews lasted 30 - 45 minutes, and were recorded with an audio recorder. In case audio recording was not accepted by the interviewee, the interviewer took notes, following the “free-listing method” (provided by CAST team) and generated an interview report. Audio recordings in Khmer were sent for transcription in Khmer, and later translated in English.
2.2.3. Data preparation, coding and analysis During the transcription and translation phases, the interviewer verified the accuracy of both
the transcription and translation. Transcription/translation proceeded from June 4 until July 30. Following feedback from several interviews, the WorldFish team established a coding protocol, including a code book, to code each transcript. Protocol for coding and analysis was

CAST Baseline Evaluation Report| 21
developed in collaboration with CAST team. WorldFish’s lead consultant and two field researchers coded the 46 transcripts. After coding was completed, the team produced node reports that were further analyzed to identify emerging themes, and report frequency and extensiveness, using the functions available in NVivo.
2.3. Limitation of the data collected The baseline study faced several challenges during its design and implementation, and
thus the resulting data have limitations.
Complexity of questionnaire
The population-based survey required respondents to provide detailed information on multiple aspects of their farm activities. The quantitative questionnaire’s complexity made interviews difficult, and affected the data accuracy. Respondents became tired and distracted toward the end of the interview and needed extra coaxing to complete the survey.
Inaccuracy of key secondary sources of information
The list of existing aquaculture farmers, compiled from national/sub-national government authorities during the scoping exercise, and used for survey sampling frame, was found to be outdated during the field missions. Despite triangulation and regular communication with local government authorities, we were not able to verify the accuracy and quality of information for all the villages, in advance of the survey. Additional scoping was needed in communes to find additional fish farmers and modified the sampling framework (see Section 2.1.4).
Accessibility and language issues
Interviewing fish producers from ethnic minority groups (corresponding to about 5% of the sample) was constrained by language barriers, as the enumerators did not speak Vietnamese. Interviewing cage farmers that migrate along the river on the Tonle Sap Lake created additional challenges. Some stakeholders in the value chain declined to participate in the survey. While producers and hatcheries were willing to participate in the survey, traders had less time to answer the questions. This was particularly the case in Kandal and Phnom Penh Provinces. These constraints resulted in replacing respondents and delayed data collection.
Validity and reliability of self-reported data
Most data collected for the farm survey are self-reported by the respondents. This has several limitations, such as the possibility of exaggeration or omission of information, inaccurate recollection of experiences or events, social-desirability bias, or reporting of untruthful information and reduced validity when respondents do not fully understand a question. This issue was limited by training the enumerators about aquaculture practices, and acceptable ranges of responses. Extreme values were verified during data cleaning, and discarded, if necessary, during data analysis.
Small sample sizes for certain categories of respondents
The sample size for certain categories of actors, such as feed mills, MFIs or feed distributors is small, compared to the sample considered for producers. Thus, the analyses for these specific small groups should be interpreted with caution as the small sample sizes may yield unreliable estimates and limit the validity of differences observed.

CAST Baseline Evaluation Report| 22
3. BASELINE RESEARCH QUESTIONS This section provides baseline information in response to the CAST research questions.
The original research questions, meant for impact evaluation at the end of the project, have been rephrased here to establish the baseline conditions for the purpose of the current study.
3.1. What is the current productivity of feed mills, aquaculture producers and
hatcheries and nurseries? The average yield of aquaculture is 4.77 kg/m2/year in pond and 44.00 kg/m3/year in cage,
considered very low productivity (Standard indicator #1). The range for both production systems varies widely due to differences in production intensity. Pangasius17 culture in pond and cage for example, produced 6.7 kg/m2 and 31 kg/m3 respectively, achieving significantly lower levels of production intensity, compared to similar production systems in Vietnam, with 27.5 kg/m2/year and 100 to 120 kg/m3/year18 in pond and cage, respectively. Cage and pond production systems with giant snakehead are the most productive (65 kg/m3/year in cage and 7.2 kg/m2/year in ponds) (Figure 2). Results are within the same range in control provinces, with giant snakehead reaching a productivity of 9.2 kg/m2 in ponds and 49 kg/m3 for Pangasius produced in cage and average yield of 2.11 kg/m2 and 32 kg/m3 in pond and cages, respectively (Figure 2).
Hatcheries produce on average 1.2 million fingerlings, annually. Among the 17 hatcheries surveyed in treatment provinces, there was wide variation observed in hatchery performance, with 11 hatcheries producing less than 0.3 million fingerlings, while four hatcheries recorded more than three million. The number of fingerlings traded by eight nurseries surveyed in treatment provinces, is about two times larger than the number of fingerlings produced by all 17 hatcheries surveyed in the same provinces. A similar pattern is observed in control provinces, with an average hatchery production of 431,000 fingerlings per year. Only one of the 13 hatcheries interviewed in control provinces produce more than one million fingerlings per year. Hatcheries in Vietnam are the main source of fingerlings in Cambodia in both control and treatment provinces. No feed mill produced aquaculture feed in Cambodia in 2018.
Figure 2: Yield of cage (left) and pond-based (right) aquaculture systems in treatment and control provinces
3.2. What is the current soy protein and fish product trade in Cambodia? Thirteen thousand MT of fisheries product was reportedly exported in 2017, of which 8,500
MT was fresh fish (sold alive, trash fish and dead on ice) and 4,500 MT was processed fish19
17 In this report Pangasius refers to the main cultivated species of Pangasius in Cambodia: Pangasius hypophthalmus 18 http://www.fao.org/fishery/culturedspecies/Pangasius_hypophthalmus/en 19 More than 50% of the processed fish product in Cambodia are prahok (fish paste) and dry fish, representing an annual production of 30,000 MT and 18,000 MT respectively

CAST Baseline Evaluation Report| 23
(FiA 2017). Major export destinations were Thailand and Vietnam for both fresh and processed products. Disaggregated data on source are not available, but recent literature indicates capture fisheries20 as the main source of export products (e.g., fermented fish paste called prahoc) (VCA4D, 2018; Kusakabe, 2016).
Soybean production in Cambodia increased from 40,758 MT in 2016 to 91,729 MT in 2018 (MAFF 2018). Fueled by the animal feed market demand, the volume of soybean imported from the U.S. to Cambodia reached 51,000 MT in 2017 (composed of soy cake and meals), corresponding to a value of US$19 million (see ANNEX F: ADDITIONAL RESULTS TO ANSWER BASELINE RESEARCH QUESTIONS, Table A). None of the feed mills interviewed reported U.S.21 as the main source of soymeal for their animal feed ingredient. As of 2018, there is no indication that the aquaculture sector has any significant influence on the trade of soybeans in Cambodia.
3.3. What is the current quantity and quality of feed and seed produced for
aquaculture producers and its availability and accessibility? The study found only one feed mill starting aquaculture feed production in Cambodia, but
this is yet to reach commercialization. This feed mill plans to comply with international quality standards22. Therefore, all manufactured aquaculture pellet feed sold in Cambodia is currently being imported. The 17 feed distributors surveyed each sell on average 1 to 4 brands of feed, and 92% of feed distributors report that at least one of the products sold meet at least one international standard. The average volume sold by the surveyed distributors during the peak growing season is 23.4 MT, varying from 1.5 MT to 54 MT per distributor.
Approximately 20.3 million fingerlings are produced annually in the treatment provinces (5.5 million in control provinces). There is no quality certification23, even though some producers claim their fingerlings are “certified”. Similarly, imported fingerlings are not certified. Tilapia and Pangasius are the main species of fingerlings produced locally, representing 40% and 36% of the total volume produced in Cambodia (Figure 3). However more than 95% of the Pangasius production comes from one single hatchery. For nurseries, the dominant species are Pangasius (38%), Clarias (walking catfish) (38%) and giant snakehead (19%). Average price of fingerlings is US 2.4 cents per individual for Pangasius in hatcheries, and US 2 cents in nurseries. For similar species, the price can be 20 – 60% lower in nurseries. Product destination is within the province (76%) or other provinces (23%). Aquaculture producers usually source their fingerlings from fingerling traders or nurseries (78%).
Nurseries are central to fingerling provision to farmers. We selected only licensed nurseries, however, unlicensed nurseries probably contribute to large imports of snakehead and giant snakehead in the country. In addition, unlicensed nurseries of wild fingerlings exist but were not included in the sample.
20 We define capture fishery as the harvesting of naturally occurring living resources in both marine and freshwater environments. It is opposed to aquaculture systems that are broadly defined as Aquaculture is the farming of aquatic organisms, including fish, molluscs, crustaceans and aquatic plants (FAO, http://www.fao.org/3/x6941e/x6941e04.htm 21 Note that most of the soymeal imported to Vietnam is sourced from Argentina (WISHH 2016). 22 ISO 9001: Quality management; ISO 14001: Environment System Certification; ISO 22000: Food safety management; HACCP Hazard Analysis and Critical Control Points; Best Aquaculture Practices; Global G.A.P. standard 23 Quality certification for fingerlings can include specific strain (genetic material), absence of parasite or disease

CAST Baseline Evaluation Report| 24
As mentioned above, no Cambodian hatcheries or nurseries supply certified seed, and no feed mills produce feed of international standard, resulting in a null score for Custom #3 indicator (i.e. number of hatcheries and feed mills that are supplying seed or feed that meets improved quality standards) in both control and treatment provinces.
Figure 3: Relative volume of fingerlings species sold by hatcheries and nurseries in 2018
3.4. What is the current supply of premium quality, Cambodian-grown
freshwater fish to the local market? On average, commercial aquaculture producers in treatment provinces sold 8.7 MT of fish
per year, dominated by Pangasius hypophthalmus (river catfish) (59%) and Channa micropeltes (giant snakehead) (23%). Total volume sold by surveyed farms in treatment provinces was 7,941 MT (Standard #19) (Figure 4). Although the average sales volume was lower in control provinces (4.1 MT of fish per yearper farmer), the top species were similar to treatment provinces, with Pangasius and giant snakehead representing 40% and 33% of the volume produced. In the treatment group, the top producing provinces are Phnom Penh (33%), Pursat (13%) and Battambang (24%) (ANNEX F: ADDITIONAL RESULTS TO ANSWER BASELINE RESEARCH QUESTIONS, Table E). Kampong Chhang Province represents 77% of the volume produced of the three control provinces, followed by Takeo (16%) and Banteay Meanchey (7%).
Snakehead (Channa striata) and giant snakehead are ranked as the most traded aquaculture products, in terms of volume, for collectors, wholesaler and processors. In post-harvest segments of the value chain, the total volume of fish purchased per year by collectors, wholesalers and processors combined is 16,334 MT, of which 54% and 69% comes from Cambodian aquaculture for collector and wholesalers, and processors, respectively.
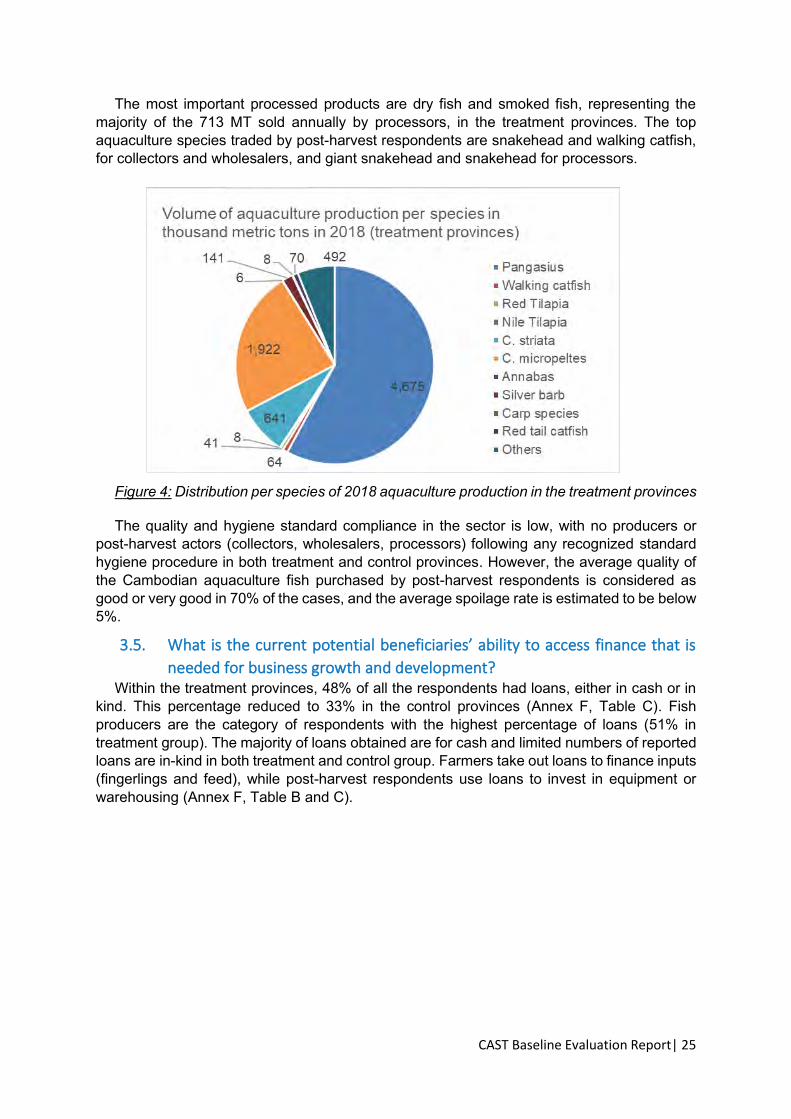
CAST Baseline Evaluation Report| 25
The most important processed products are dry fish and smoked fish, representing the majority of the 713 MT sold annually by processors, in the treatment provinces. The top aquaculture species traded by post-harvest respondents are snakehead and walking catfish, for collectors and wholesalers, and giant snakehead and snakehead for processors.
Figure 4: Distribution per species of 2018 aquaculture production in the treatment provinces
The quality and hygiene standard compliance in the sector is low, with no producers or post-harvest actors (collectors, wholesalers, processors) following any recognized standard hygiene procedure in both treatment and control provinces. However, the average quality of the Cambodian aquaculture fish purchased by post-harvest respondents is considered as good or very good in 70% of the cases, and the average spoilage rate is estimated to be below 5%.
3.5. What is the current potential beneficiaries’ ability to access finance that is
needed for business growth and development? Within the treatment provinces, 48% of all the respondents had loans, either in cash or in
kind. This percentage reduced to 33% in the control provinces (Annex F, Table C). Fish producers are the category of respondents with the highest percentage of loans (51% in treatment group). The majority of loans obtained are for cash and limited numbers of reported loans are in-kind in both treatment and control group. Farmers take out loans to finance inputs (fingerlings and feed), while post-harvest respondents use loans to invest in equipment or warehousing (Annex F, Table B and C).

CAST Baseline Evaluation Report| 26
The occurrence of loans is lower in the control provinces, with 25% of wholesalers and 33% of producers taking loans. These data are self-reported, and include not only the formal loans contracted from banks or micro-finance institutions, but also money borrowed from informal money lenders. Twenty-four percent of farmers in the treatment group claimed to have loans from MFIs, with an average size of $9,375. In the control group 18% of the producers had loans with MFIs, with an average size of $2,459.
Figure 5: Distribution of loans granted by MFI to the different types of respondents (treatment group)
On the other hand, the eleven MFIs interviewed in treatment provinces reported on average only 12 loans disbursed to aquaculture value chain actors. In treatment provinces, the average size of these loans was $26,375, with very high variability (± $25,250). In control provinces, the average loan size is larger ($ 84,250 ± 82,699), but based on a smaller sample size. Fish producers contract 58% of these loans (Figure 5) and again for very variable amounts ($32,000 ± $30,250, Figure 6). Interest rates provided by MFIs are high (13% per year). The qualitative study reports the limited knowledge of MFIs about the aquaculture sector, and the absence of tools and infrastructure to help producers and post-harvest actors to apply for formal loans. Also, several interviewees reported that loans from fish collectors and wholesalers constrain access to higher market prices for fish producers. Fish producers have to sell their production at prices decided by the buyers, who are also providing the loans.

CAST Baseline Evaluation Report| 27
Figure 6: Loan amount disbursed by MFI to aquaculture value chain actor in 2018 in control and treatment provinces.
3.6. Where are clusters of active SME farms and hatcheries that meet the
selection criteria as potential beneficiaries of CAST? Spatial analysis within the treatment provinces identified 50 clusters of producers that are
separated from each other by more than five kilometers (see Figure 19). Those clusters vary in size, from three producers to more than 80 producers. Largest clusters are found in floating villages around the Tonle Sap. In all treatment provinces a nursery or hatchery is operating and providing access to fingerlings, however producers do not necessarily purchase fingerlings from hatcheries or nurseries in the same province. The presence of nursery importing fingerlings of snakehead, giant snakehead and Pangasius is required to operate commercial aquaculture clusters. Additional details regarding cluster and spatial distribution of aquaculture cluster is found in section 4.9.
3.7. Where are existing value chain networks at provincial level that can be
strengthened to meet CAST objectives? We identified seven major wholesale fish markets (locally called “landing sites”) where
aquaculture fish are traded (see Table 8 in section 4.9). Those landing sites are located in Siem Reap, Kampong Cham, Pursat, Battambang Provinces and Phnom Penh. In these landing sites, not only Cambodian aquaculture produced fish is traded, but imported fish and fish from capture fisheries are found. However, those landing sites are key “hubs” where fish is later redistributed within the country.
In addition to the landing sites, 12 “processing hubs” are identified in seven provinces (see Table 9 in section 4.9). Processing hubs are concerned with dry fish, fermented fish and smoke fish. We did not find any semi-industrial fish processing hub. Additional details are found in section 4.9.
3.8. Who and where are existing or potential extension service agents that can
become core facilitators of value chain networks? Aquaculture extension is weak in Cambodia (Richardson et al. 2017). Fisheries
Cantonment officers are not the main source of training and information about aquaculture

CAST Baseline Evaluation Report| 28
product. We found that feed manufacturers can provide technical support to feed distributors (in 41% of the cases). Feed distributors mostly support farmers with technical advice at the shop, but also with technicians supporting farmers directly, with 13 producers supported by one feed distributor, on average. The scoping exercise found an example (in Kampong Cham Province) of a hatchery working in collaboration with a feed distributor to sell their product and advice. This type of collaboration helps to build trust with farmers who can witness farm operations.
3.9. What are the constraints and opportunities within various segments of the
commercial aquaculture value chain in Cambodia? Constraints and opportunities along the various segment of the value chain are analyzed
in detail in Section 4. We found that access to inputs (fingerlings and manufactured feed) is limited due to high prices. Production of fingerlings of the main commercial species is low or absent and the sector, as for manufactured feed, depends on imports from Vietnam. Quality and source of the imported fingerlings is unknown and current aquaculture management practices are low, explaining, at least partially, the low productivity observed in this study (see section 3.1). Access to training for aquaculture and post-harvest technique is limited and the source of information and knowledge are scarce (section 4.6.2). Post-harvest segments operate at limited level of improved management practices, with no standard sanitary and phyto-sanitary procedures.
Proportion of Cambodian aquaculture fish traded or transformed in the post-harvest segment can be high compared to imported fish. However, aquaculture fish is in most cases sold alive, and cold chain equipment is rarely found (section 4.5). No industrial or semi-industrial aquaculture fish processing are yet operating in the treatment provinces.
Despite those constraints, the qualitative study shows that there is a growing demand for Cambodian aquaculture fish, considered of higher quality than imported fish. Although producers face drought and flood, pond producers are equipped with flood protection fences, but access to water can remain problematic. Competitiveness of production system could be improved by providing access to affordable, non-imported, high quality pellet feed. Combination of lower input prices and optimal management of the pond and cages will improve economic competiveness of aquaculture products on the local market.
4. SITUATION ANALYSIS This section provides an overview of the commercial freshwater aquaculture sector in
Cambodia based on the population-based survey results and scoping exercise.
4.1. Population characteristics The majority of producers are male (96%), aged older than 29 years. Only 11% of
aquaculture farm proprietors are female (

CAST Baseline Evaluation Report| 29
Table 6). Women proprietors are well represented in the post-harvest segment of the value chain. The average number of employees remains limited amongst all the respondents, except for feed mills and MFIs. Within our sample, the total number of longer-term employees at producer farms is 189 (0.2 on average), and majority are male older than 29 years. On-farm, short term employees are also predominantly male, with an average of two persons per year/farm, hired for an average of 7 days per year. Gender and age proportion were similar in the control population (see ANNEX F: ADDITIONAL RESULTS TO ANSWER BASELINE RESEARCH QUESTIONS, Table D).

CAST Baseline Evaluation Report| 30
Table 6: Characteristics of the surveyed population
Producers Hatcheries Nurseries Collectors Wholesalers Processors Feed distributors
Feed mills
MFI
n 918 17 8 24 21 26 17 8 11 % of proprietor 15-29 years old
4 6 13 8 0 4 6 0 0
% of proprietor ≥30 years old
96 94 88 92 100 96 94 100 100
% of proprietor male
89 100 88 46 57 48 59 100 91
% of proprietor female
11 0 13 54 43 52 41 0 9
Average number of employees*
0.2 1.6 0.7 1.3 3.1 1.7 0.5 290 88
Total number of employees
189 28 6 32 66 43 9 2,317 967
% of employees ≥30 years old
98 100 100 97 100 100 89 - -
% of employees male
88 100 50 16 47 56 33 - -
Note: *Not including the proprietor and family members
Based on USDA Indicators and Definitions Handbook, our producer sample is composed of six ‘non-smallholder’24 (> 5ha), with the remainder considered ‘smallholder’ (<5ha). For other respondents, “small-enterprise” accounted for only two hatcheries, while all input suppliers and post-harvest respondents are considered “micro-enterprises25”. This classification does not take into account MFIs and feed mills.
4.2. Seasonality of production and sales Aquaculture in Cambodia is characterized by strong seasonality. The main drivers
explaining seasonality of aquaculture production are access to water during the dry season (November to May), rainy season (May to October) and peak season of capture fisheries in November to February (the main source of fish to the local market).
The peak harvesting and selling period of aquaculture is in April/May for pond production, and in March for cage production. For both, stocking period is concentrated between June and August (Figure 7). The peak periods for hatcheries and nurseries are different. Hatcheries peak corresponds to the peak demand for farmers, while nurseries seem to operate all year round. Only 45% of hatcheries are able to meet the demand during the peak stocking period. The interview results from feed distributors indicate uncertainty about feed demand trends over the past 5 years, with 33% reporting increasing demand, 25% indicating stable demand, and 38% reporting a decline. . For feed distributors, the peak selling period was May-July for 50% of the sample, and extended until December for 40% of sample. Feed distributors do not
24Smallholder Definition: While country-specific definitions may vary, use the Feed the Future definition of a smallholder producer, which is one who holds 5 hectares or less of arable land or equivalent units of livestock (USDA Indicators and Definitions Handbook February 2019) 25 Microenterprises employed <10 people in the previous 12 months, small enterprises employed 10-49 people, medium enterprises employed 50-249 individuals and large enterprises and corporations employed >250 individuals (USDA Indicators and Definitions Handbook February 2019)

CAST Baseline Evaluation Report| 31
distinguish a clear end of the peak season, and responses varied according to each situation. Average volume sold per shop during this peak period varied across our sample from 1.5 to 91 MT (average of 18 MT) (Figure 8). In the control group, the amount sold during the same period varies from 5 to 45 MT (average of 13 MT). Seasonality is similar in the producer control group, with a peak harvest from April to May, while hatcheries peak selling season is from August to October.
Post-harvest segments of the value chain have a peak period of activity from November/December to April, corresponding to an overall increase of activity in the fisheries industry in Cambodia, and not specifically for aquaculture. On average, the shortage of aquaculture fish lasts 3 months starting from April/July to August/October, depending on the season. Processors have a peak period later in the year April to July. In the control group, the peak for collectors and wholesalers is similar, but processors report a shorter peak season from November to December.
Jan Feb Mar Apr May Jun Jul Aug Sep Oct Nov Dec
Processors Collectors/ Wholesalers
Feed Dis. Nurseries Hatcheries Pond farmers H H S S Cage farmers H S S
Figure 7 : Production calendar and selling period for different actors of the aquaculture value chain (S: stocking fingerlings; H: Harvesting fish)
Figure 8: Average amount of feed sold by feed distributors during 2018 peak season in treatment (n=15) and control (n=7) groups

CAST Baseline Evaluation Report| 32
4.3. Hatcheries and nurseries production systems The average hatchery operates with 12 ponds (average surface area of 744 m2), including
four to five ponds for broodfish. Most hatcheries also have grow-out ponds to raise fish. On average, a hatchery owns 5.5 tanks for spawning and hatching. All hatcheries and nurseries own at least one pump. Seven hatcheries (41% of the sample) and four nurseries (50% of the sample) are equipped with a well, of which two rank groundwater as the main source of water for their operations. In these two cases the average well depth is 16 m. Fifty-two percent consider river and stream as their main source of water in treatment provinces, while 84% of the hatcheries in control provinces are rainfed. However, in control provinces, 76% and 100% of the hatcheries and nurseries are equipped with a well. Overall, hatcheries are not all well-equipped, with only 76% of the hatcheries having an oxygen tank, 18% equipped with larval rearing cones and only 12% with a refrigerator to keep hormones (for production of mono-sex tilapia).
Hatcheries in control provinces are overall better equipped than in treatment provinces, with 100% of hatcheries equipped with oxygen tank and 23% using a refrigerator to store hormones, for example. The average hatchery in the treatment group produces two to three species, and three to four species for the control group. Nurseries trade between one and nine species. Locally, the most frequent species produced are tilapia (both nile and red), and silver barb and carp. A similar pattern is found in the control group, but with more frequent Pangasius and walking catfish production. In the treatment group only four hatcheries produced Pangasius fingerlings (7.3 million per year in total), while six control group hatcheries produce 2.1 million Pangasius fingerlings.
Fingerlings of the most important species (by volume) (e.g., snakehead), are imported from Vietnam, due to better supply security (Figure 9). In total, the 17 hatcheries in treatment provinces sold 23.3 million fingerlings while 5.5 million were sold in the 13 hatcheries surveyed in control provinces.
Only 37% of the hatcheries interviewed follow any recommendations from past projects and extension services. Further, the hatchery sample implemented only 4.17 of 12 different common best management practices, prompted in the interviews. A similar pattern is found in the control group, with in average 3.58 best management practices adopted. No hatcheries produce fingerlings to international standards.
More than 82% of hatcheries quarantine their brood-fish (92% in control group), but only 41% do parasite checks (16% in control group), or follow proper hygiene practices. In both hatcheries and nurseries, fingerlings size was small (7 cm or 3.5 g). In addition, proper grading is done only in 14% of nurseries and hatcheries (14% in control group). Hatcheries generally sell within the province (75% of respondents), directly to farmers (average of eight farmers) or traders (average of five traders) and nurseries (average of three nurseries).
Average survival rate during nursing is low, (46% in treatment and 56% in control groups) and could be improved. Reported mortality rates are low (2 percent on average), but average time/distance between hatcheries and nurseries is significant (5 to 6 hours), indicating a need for improved transportation practices and technologies, and for better organization between local hatcheries and nurseries and producers. Handling practices and transport in both hatcheries and nursery can be improved. Transport in plastic bags without oxygen is relatively common (36% of cases) with an average 22 hours stopped-feeding before transport, which for the latter corresponds to recommended practice. On average, nursing of fingerlings lasts for a period of 27 and 30 days for treatment and control provinces, respectively.

CAST Baseline Evaluation Report| 33
Figure 9: Number of fingerlings sold by hatcheries and nurseries in treatment provinces in 2018 (see ANNEX F: ADDITIONAL RESULTS TO ANSWER BASELINE RESEARCH QUESTIONS, Table I)
4.4. Fish farm production systems Producers operate an average 1.6 ponds and 1.4 cages. The median area of pond is 625
m2 and 45m3 for cages. The average pond size is skewed due to a few very large farms (> 6 ha of ponds). Large-scale producers represent 29% of the ponds and only 11% of the cages (Figure 10). Similar distribution is found in the control group. The dominance of large-scale farms validates our sampling approach to target commercial farms. However, overall, production surface area and volume is limited (median of 625 m2). This clearly illustrates the limited number of larger size aquaculture business units currently operating in Cambodia. We found differences in distribution of farm size across provinces. For example, Phnom Penh municipality has a large proportion of large scale cages (89% of the cage farm surveyed in that administrative unit), while small-scale cage farms are dominant in Pursat (65% of cage farm surveyed are small-scale) and Siem Reap (58% of the cage farm surveyed are small-scale). Large scale pond-based farms are dominant in Phnom Penh municipality, Pursat , Battambang and Kampong Cham Provinces, representing 92%, 63%, 60% and 54% of the farm surveyed, respectively.
In the control group, Takeo Province has a homoegenous distribution of pond-based farms across the three categories, while large scale pond-based farms are dominant in Banteay Meanchey (65%), while in Kampong Chhnang large scale pond and cage based farms are dominant. Detailed distribution of farm size per province is found in ANNEX F: ADDITIONAL RESULTS TO ANSWER BASELINE RESEARCH QUESTIONS, Table R.
Seventeen percent of the pond-based farms are rainfed, with river and stream identified as the main water sources. Thirty-two percent of farmers have a well (average depth 22 meters), but only 10% consider groundwater as the main source of water for their ponds. Highest concentrations of wells are found in Kandal and Kampong Cham Provinces. The control provinces have a lower proportion of aquaculture farms equipped with wells (ANNEX F: ADDITIONAL RESULTS TO ANSWER BASELINE RESEARCH QUESTIONS, Table O). Sixty-three percent of producers own, and ten percent rent, one or two pumps and only four percent of ponds and cages are equipped with aerators.

CAST Baseline Evaluation Report| 34
Figure 10: Distribution of pond and cage fish farm by class size in control and treatment provinces
The average producer currently operates at sub-optimal levels, implementing only three out of 15 improved practices prompted during the interviews (ANNEX F: ADDITIONAL RESULTS TO ANSWER BASELINE RESEARCH QUESTIONS, Table G). Basic aquaculture practices, such as using lime and fertilizer or controlling predators, are not common. Water quality monitoring is practiced by less than 10% of producers. Stocking density of snakehead and giant snakehead in ponds and cages are high, leading to high mortality rates and reduced economic results (Figure 11).
We found that feeding practices vary between provinces (Figure 11: Average stocking density in ponds (fish/m2) and cages (fish/m3) of the three most common aquaculture species
Figure 12). Trash fish feeding is only dominant in Kandal, Kampong Thom, and Siem Reap Provinces, while other provinces use a combination of mixed feed. We hypothesize that the dominance of trash-fish as fish feed in those provinces is due to the production of giant snakehead and the proximity of fish landing sites. According to key informant interviews ,seasonality of trash fish price explains the feeding regime choice, with low trash fish price during the peak fishing season (December to March). During the closed season, trash fish price will increase, making pellet feed price more competitive.

CAST Baseline Evaluation Report| 35
Figure 11: Average stocking density in ponds (fish/m2) and cages (fish/m3) of the three most common aquaculture species
Figure 12: Feeding practices of producers in the different treatment and control provinces.
The majority of farmers use a combination of feed, with <10% of the farmers relying solely on pellet feed (varying between provinces) (Figure 12). Co-variate analysis shows that pellet-use frequency is higher in control provinces than in treatment provinces. In Takeo and Banteay Meanchey Provinces production systems are less oriented toward carnivorous fish, such as snakehead and giant snakehead, and therefore use less trash fish. In those provinces, carp and tilapia production system are more popular, thus pellet feed is more commonly used. In addition, access to loans and past involvement in aquaculture development projects, significantly increases the adoption and use by producers of pellet feed.
The number of production cycles per year varied between 0.84-1.23 for cages, and 0.7-1.4 for ponds (0.89 and 0.85 cycles in cage and pond, respectively, in the control group). Producers raising walking catfish may achieve three cycles in cages and ponds. Other common commercial fish (e.g., snakehead or Pangasius), have a longer grow-out stage, and a single cycle per year is normal. Cambodian aquaculture has a high market demand for fish

CAST Baseline Evaluation Report| 36
sold alive, requiring daily harvest. Otherwise, for all respondents, 32% record harvest intervals longer than 5 days, with 12% longer than 20 days. In general, longer harvest periods have detrimental impacts on fish quality, increasing stress and probability of diseases, and increasing feeding cost.
Only 13% of the producers received training in aquaculture techniques. Producers have the highest level of participation in previous development projects (e.g., FAIEX-JICA Phase 2 and USAID HARVEST in Siem Reap, Battambang and Pursat Provinces). Training received from past projects is not significantly correlated with volume, value or yield achieved by producers, although there is evidence that training has led to greater adoption of pellet feed and better pond management. Conversely, former project beneficiaries have significantly less contracts/agreements with buyers (ANNEX G: COVARIATES ANALYSIS).
Figure 13: Type of information received by aquaculture producers
Access to information is the next feature to be analyzed. Access to market prices was rated as relatively high (67%), while information regarding inputs (fingerling and feed) was rated as average (50%). Access to information regarding techniques (11%) and quality standards (5%) was low amongst producers (Figure 13). The main sources of information for aquaculture techniques are development projects and Fisheries Administration, while for market and regulations (standards), the sources are fish buyers and development projects, respectively (Annex F, Table M). In control groups, access to market information was found to be similar, with 78% of producers, 75% of collectors, and 88% of processors, accessing this information. Hatcheries represent an outlier, with only 8% stating they access market information.
In summary, aquaculture production in Cambodia consists of both pond and cage systems. Feeding practices are often influenced by the location of farms and accessibility to trash fish, as well as availability of trash fish during the culture cycle. Training received from past projects in certain areas has had a positive influence on feeding practices. However, management of ponds and cages remains basic, with limited access to technology and high-quality inputs. Integration in the value chain for marketing is based on personal relationships and there are no quality standards being followed by producers.

CAST Baseline Evaluation Report| 37
4.5. Post-harvest (collectors, wholesalers and processors) Collectors and wholesalers purchase fish directly from producers. Around 14% of
wholesalers report they are also involved with processing. Processors purchase their fish from either collectors or directly from the producers’ farms.
The aquaculture post-harvest segment is dominated by live fish trade, representing more than 80% of the volume traded by collectors and wholesalers. The respondents sourced more than 50% of their fish from Cambodian aquaculture (65%, 79% and 88% for collectors, wholesalers and processors in the control group) (Figure 14). Within our sample, wholesalers sourced approximately 30% of their fish from Vietnam or Thailand (25% in control group). This ratio is reduced to 18% for collectors (only 3% in the control group).
The main fish traded by collectors and wholesalers are snakehead, walking catfish, and Pangasius, while processors rank giant snakehead as their main traded species. For the latter, dry salted giant snakehead is the main product sold. There is no filleting process. Differences between provinces are significant, with wholesalers in Battambang and Pursat trading larger volumes and/or value. Collectors have higher traded volumes in Kampong Cham, and Pursat has greater value traded (Annex F, Table L). However, the sample size is limited26 and might not be representative.
Figure 14: Collectors, wholesalers, processors volume and origin of fish purchased in 2018 in treatment provinces
According to respondents, the average spoilage rate is low (below 5% on average in treatment group and 7 % and 18% for collectors and wholesalers of the control group). This reported figure is even more surprising given the lack of cold chain assets and low-level hygiene practices reported during this survey. Thus, these figures should be taken with caution. It might also reflect the specificity of the value chain where a significant amount of fish is sold alive. As mentioned previously, none of the respondents are applying any standard hygiene or phyto-sanitary practices in both control and treatment provinces. Use of ice should be mandatory, due to the important trade in live fish. Only a limited number of respondents reported using gloves, masks, or practices such as cleaning hands before and after handling
26 For collectors, the sample size is n=22 and n=16 in treatment and control provinces, respectively, note that in Kampon Cham (n=1) and Pursat (n=5).
CAST Baseline Evaluation Report| 38
the products. Sub-standard hygiene practices such as having raw material in direct contact with the floor is still common in 30 to 40% of the sample. In control provinces, reported spoilage is higher (up to 18% of volume traded for wholesalers), but hygiene practices applied are similarly poor. Labelling of products also does not exist.
4.6. Support system
4.6.1. Access to loans Producers and wholesalers represent the highest percentage of loan takers across the
sample, with 66% of them having a loan in cash or in-kind (Figure 15). This percentage is lower down to 45% and 25% in the control group for producers and wholesalers respectively. Other respondents also report relatively high access to loans and one feed mill reports having a loan with a banking institution to support its activities. The average size of these loans is $26,607 with a high interest rate of 1.33% per month or 13.2% per year in treatment province and 13.05% per year in average in control provinces.
Figure 15: Percentage of respondent using loans in the treatment and control groups
Twenty-four percent of producers take out loans from MFI in both treatment and control groups with an average size of $10,800 ($ 6,350 in control group) for a duration of seven months (13 months in control group) and an interest rate of 1.5% per month. Buying fish feed is the main purpose of the loans, accounting for 68% of producers borrowing money from MFI. A similar pattern is observed in the control group, with 54% of the loan contracted to purchase feed.
Purchasing inputs (feed and seeds) was the most common reason for producers,
hatcheries and nurseries to take loans (

CAST Baseline Evaluation Report| 39
Table 7, ANNEX F: ADDITIONAL RESULTS TO ANSWER BASELINE RESEARCH QUESTIONS Table B and C). Twenty-three percent of feed distributors reported providing feed as in-kind loan to farmers, charging KHR 100 to 500 per kilogram of feed in addition to the cost of feed, corresponding to an interest rate of 4-14% per production cycle. Other distributors reported providing feed in advance without interest charged to producers. These feed distributors provide between 10 and 60% of the aquaculture feed volume to farmers as in-kind loans.
According to the 17 MFIs interviewed, the limited number of aquaculture loans is a result of low demand (47% of answers). Only one respondent mentioned lack of collateral, and another cited high risk associated with aquaculture business. When considering the credit profile of the sector, it should be noted that self-reported information on debts is notoriously unreliable.

CAST Baseline Evaluation Report| 40
Table 7: Access to loan by different type of respondents
Note: feed distributors gave only a single reason to contract a loan.
4.6.2. Access to knowledge and information Support systems for the aquaculture value chain are known to have a limited capacity (FiA,
2017). This fact is confirmed by the results of the survey. For example, only 13% of the producers received training in aquaculture technique in treatment group and 16% in the control group (Figure 16). Overall, only 17% of the entire survey sample across all respondent groups have ever received aquaculture training and the year when they attended their last training ranged from 1998 to 2019 (Figure 17; ANNEX F: ADDITIONAL RESULTS TO ANSWER BASELINE RESEARCH QUESTIONS, Table MError! Reference source not found.).
Training has a significant influence on adoption of improved feed practices, as well as the most frequently adopted improved management practices (Annex G). Although our sample is small, we found that nurseries, and especially hatcheries, in both control and treatment groups, have a relatively easy access to trainings. However, despite these trainings, we have seen that adoption of management and hygiene practices remains low, indicating that access to knowledge is not the only factor of adoption. Other factors, such as market demand for quality and premium prices could be significant drivers of adoption.
Feed manufacturers provide technical support to the feed distributor and producers in 41% of cases in treatment provinces, supplying on average 1-2 technicians. In control provinces the frequency of feed distributor providing support is higher, perhaps due to higher proportion of producers using feed pellet only. As a result, the average number of producers supported by a technician is 13.4 and 31 in treatment and control provinces respectively.
Very few of the feed distributors provided support to farmers, who also received training from the feed company, and only a few received training from development projects (3) or FiA (2). However, we found that in treatment provinces, only 41% of the feed distributors know how to use a feed table and only 30% provide those tables to farmers. This proportion is higher in control provinces (71% of feed distributors know how to use feed tables and 57% provide those tables to farmers), showing that level of knowledge and practices in those control provinces is perhaps higher when it comes to feeding practices.
Respondents Top two reasons for the loan Hatcheries 1) land; 2) fish feed Nurseries 1) fish feed; 2) fingerlings Producers 1) fish feed; 2) fingerlings Collectors 1) equipment; 2) vehicle Wholesalers 1) equipment; 2) vehicle Processors 1) raw material; 2) land,
warehouse Feed distributors 1) fish feed*
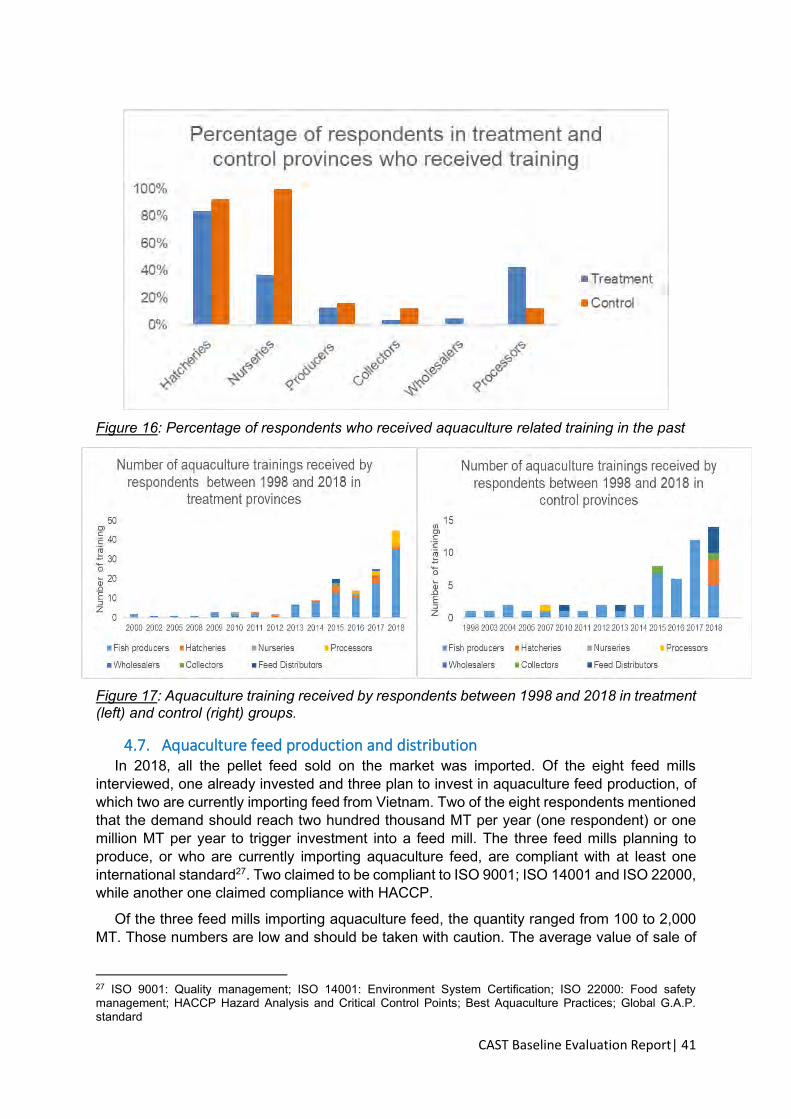
CAST Baseline Evaluation Report| 41
Figure 16: Percentage of respondents who received aquaculture related training in the past
Figure 17: Aquaculture training received by respondents between 1998 and 2018 in treatment (left) and control (right) groups.
4.7. Aquaculture feed production and distribution In 2018, all the pellet feed sold on the market was imported. Of the eight feed mills
interviewed, one already invested and three plan to invest in aquaculture feed production, of which two are currently importing feed from Vietnam. Two of the eight respondents mentioned that the demand should reach two hundred thousand MT per year (one respondent) or one million MT per year to trigger investment into a feed mill. The three feed mills planning to produce, or who are currently importing aquaculture feed, are compliant with at least one international standard27. Two claimed to be compliant to ISO 9001; ISO 14001 and ISO 22000, while another one claimed compliance with HACCP.
Of the three feed mills importing aquaculture feed, the quantity ranged from 100 to 2,000 MT. Those numbers are low and should be taken with caution. The average value of sale of
27 ISO 9001: Quality management; ISO 14001: Environment System Certification; ISO 22000: Food safety management; HACCP Hazard Analysis and Critical Control Points; Best Aquaculture Practices; Global G.A.P. standard

CAST Baseline Evaluation Report| 42
US $79,000. This figure is relatively low, and may also be under-reported. However, respondents estimate that reaching a production cost of US 50 cents for 1kg of Pangasius feed will make the feed competitive on the market. The feed mills reach their customer-base via their feed distributors at the district and provincial level, but also work directly with farmers, based on word of mouth. Only one feed mill reported having six technicians or more providing direct advice to farmers.
According to feed distributors, the best-selling feed in the treatment provinces is for Pangasius, followed by walking catfish. The price ranged between $0.61 and $0.87/kg for those different products in 2018. Green Feed company products are the most popular due to their competitive price. Among all the products, quality is ranked second as the main reason for success, indicating that farmers based their choice on price before quality. A similar pattern is observed in control provinces, although there is no clear brand domination. Forty-five percent of feed distributors had contract with one feed manufacturer, 8% with two, with an average contracted volume of sales of 5 to 300 MT per year. Those contracts include a minimum sales volume between 1 and 20 MT per month in 3% of the cases. Fifty respondents claimed that the feed manufacturers provide the feed in advance. For marketing, feed distributors enter into verbal contracts with farmers (35% of respondents in treatment provinces and 14% of respondent in control provinces), with contract volume varying from 250 kg to 2.5 MT per production cycle. Only one respondent reported a contract of 1 MT per production cycle in control provinces.
Access to pellet feed can be considered as good, with several brands and products available per province. However, the price for major fish species remains relatively high and hinders competitiveness of local producers with imported fish. Feed distributors have a very limited knowledge of the feed and feeding practices and do not necessarily support farmers.
4.8. Climate change adaptation Extreme drought and flood events affect aquaculture production in Cambodia. Climate
change studies (ICEM, 2013) identified those extreme events as key constraints to aquaculture in Cambodia. Participants in the USAID HARVEST program ranked drought and access to water, as the most significant factors for discontinuance of aquaculture (Richardson et al. 2018). Twenty-five percent of producers claimed to be affected by drought in the past 5 years, with the largest proportion in Kampong Cham (33%), Battambang (40%) and Pursat (44%) (Figure 18). Those provinces also have the highest proportion of farms equipped with wells. In control provinces, producers in Takeo report similar frequency (46%) of drought events (ANNEX F: ADDITIONAL RESULTS TO ANSWER BASELINE RESEARCH QUESTIONS, Table O). Cage producers can also face drought and low water levels. As a result, 45% of cage producers migrate their grow-out cages to deeper sections of the Tonle Sap lake or river when drought conditions exist. In control provinces, Kampong Chhnang and Banteay Meanchey present high vulnerability to drought, with 41% and 22% of the farms affected by a drought event in the past 5 years.
Twenty-eight percent of pond producers were affected by flood in the last five years. The largest proportion are found in Kandal (44%) and Kampong Cham (52%) Provinces (Annex F, Table P). When considering only ponds, the proportion increased to 89% (Pursat), 63% in Kandal and 55% in Kampong Cham. Of the producers affected by flood, only 43% fenced their pond, with proportion as low as 13 and 14% in Kampong Thom and Siem Reap. Forty-one percent of hatcheries and twenty-one percent of nurseries are affected by flood, and only 42 and 21% of those affected farms having fenced ponds, respectively. In control provinces, flooding is a constraint for producers in Banteay Meanchey (27% of producers) and Kampong Chhnang (32%), but not in Takeo (5% only).

CAST Baseline Evaluation Report| 43
Figure 18: Percentage of producers affected by drought and flood and equipped with a well in treatment and control provinces
4.9. Spatial distribution of farmer clusters and processing hubs Figure 19Error! Reference source not found. shows the clusters of producers in the
treatment provinces, and also potential sources of fingerlings. In ANNEX F: ADDITIONAL RESULTS TO ANSWER BASELINE RESEARCH QUESTIONS, Figure B, we identified potential farmer leaders28 and top 5 communes of producers in each province (see ANNEX F: ADDITIONAL RESULTS TO ANSWER BASELINE RESEARCH QUESTIONS, Table Q).
Co-variate analysis shows that Phnom Penh producers have significantly higher production and value of sales, due to larger pond area. No significant difference was observed for pond and cage yield across provinces, although cage producers in Battambang and Kampong Thom present average yield above 65kg/m3. Siem Reap, Phnom Penh and Kandal pond producers record yield above 8 kg/m2.
Observations made during the scoping mission and field survey identified several clusters of producers in the surveyed provinces. In Kampong Cham Province, aquaculture pond producers, focusing on giant snakehead and Pangasius culture were identified in Batheay, Prey Chhor, Kampong Siem, and Cheung Prey Districts. Stuong and Kampong Svay Districts in Kampong Thom Province have several clusters of pond or cage aquaculture farmers, focusing on giant snakehead and/or Pangasius. A similar pattern was found in Siem Reap Province in Soutr Nikom, Siem Reap, Chi Kraeng, and Puk Districts. In those three provinces, Vietnam is the main source of fingerlings and fish is sold to the urban centers and for export to other provinces. Some of those clusters include farmers from Kinh ethnic group from Vietnam. Clusters of giant snakehead farmers are found in Krakor, Pursat, Kandeang and Bakan Districts within Pursat Province. Those clusters operate with trash fish based feed and floating pellets. Fingerlings are sourced from nurseries (importers) in Preak Pnov, near Phnom Penh or directly imported from Vietnam. Farmers are from Khmer or Kinh ethnic groups from Vietnam.
Clusters in Battambang Province (Sangker and Aek Phnom Districts) are dominated by snakehead culture, but with some culture of tilapia, Pangasius and walking catfish. Fingerlings
28 We selected the top 15 fish producers in terms of volume produced per year in each province

CAST Baseline Evaluation Report| 44
are sourced from Vietnam, but also from nurseries located in Battambang, and the feeding regime is based on trash fish and homemade feed.
Figure 19: Cluster of producers (number of farms within 5 km radius), hatcheries and nurseries surveyed in treatment provinces. * The circle symbol shows the center of each cluster and is scaled to the number of aquaculture farms falling within the cluster.
Clusters of producers are found in Preak Pnov District in Phnom Penh, and Phonhea Leu and Kien Svay Districts in Kandal Province. In both provinces, Pangasius, snakehead species are dominant with some tilapia culture and red tail catfish culture. Those farms are operated by Khmer, Cham or Kinh ethnic group members. Phnom Penh markets, and major landing sites in Chraing Chamres and Prek Phnov Districts, are the main the destination of this production.
Within the treatment provinces, we identified seven major landing sites where aquaculture fish are traded (Table 8). Local and imported aquaculture products, as well as capture fisheries products, are traded on those sites before re-distribution to retailers.
Table 8: List of major landing site for aquaculture products
Name Province Commune Landing site: Kampong Kleang Siem Reap Kampong Kleang Landing site: Chhong Kneas Siem Reap Siem Reap Individual landing site/market (Hok Kean)
Kampong Chham Krong Kampong Cham
Raing Til Pursat Raing Til Kdol Tahaen Battambang Kdol Tahaen Chraing Chamres Phnom Penh Phnom Penh Prek Phnov Phnom Penh Phnom Penh
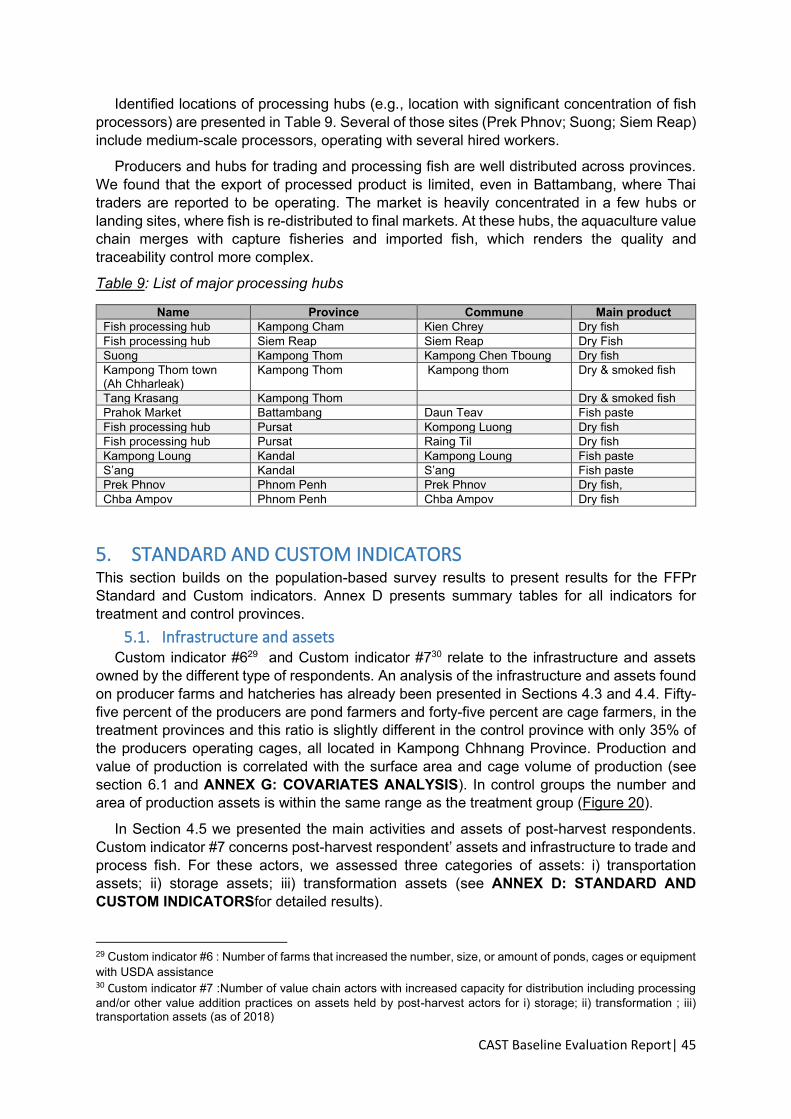
CAST Baseline Evaluation Report| 45
Identified locations of processing hubs (e.g., location with significant concentration of fish processors) are presented in Table 9. Several of those sites (Prek Phnov; Suong; Siem Reap) include medium-scale processors, operating with several hired workers.
Producers and hubs for trading and processing fish are well distributed across provinces. We found that the export of processed product is limited, even in Battambang, where Thai traders are reported to be operating. The market is heavily concentrated in a few hubs or landing sites, where fish is re-distributed to final markets. At these hubs, the aquaculture value chain merges with capture fisheries and imported fish, which renders the quality and traceability control more complex.
Table 9: List of major processing hubs
Name Province Commune Main product Fish processing hub Kampong Cham Kien Chrey Dry fish Fish processing hub Siem Reap Siem Reap Dry Fish Suong Kampong Thom Kampong Chen Tboung Dry fish Kampong Thom town (Ah Chharleak)
Kampong Thom Kampong thom Dry & smoked fish
Tang Krasang Kampong Thom Dry & smoked fish Prahok Market Battambang Daun Teav Fish paste Fish processing hub Pursat Kompong Luong Dry fish Fish processing hub Pursat Raing Til Dry fish Kampong Loung Kandal Kampong Loung Fish paste S’ang Kandal S’ang Fish paste Prek Phnov Phnom Penh Prek Phnov Dry fish, Chba Ampov Phnom Penh Chba Ampov Dry fish
5. STANDARD AND CUSTOM INDICATORS This section builds on the population-based survey results to present results for the FFPr Standard and Custom indicators. Annex D presents summary tables for all indicators for treatment and control provinces.
5.1. Infrastructure and assets Custom indicator #629 and Custom indicator #730 relate to the infrastructure and assets
owned by the different type of respondents. An analysis of the infrastructure and assets found on producer farms and hatcheries has already been presented in Sections 4.3 and 4.4. Fifty-five percent of the producers are pond farmers and forty-five percent are cage farmers, in the treatment provinces and this ratio is slightly different in the control province with only 35% of the producers operating cages, all located in Kampong Chhnang Province. Production and value of production is correlated with the surface area and cage volume of production (see section 6.1 and ANNEX G: COVARIATES ANALYSIS). In control groups the number and area of production assets is within the same range as the treatment group (Figure 20).
In Section 4.5 we presented the main activities and assets of post-harvest respondents. Custom indicator #7 concerns post-harvest respondent’ assets and infrastructure to trade and process fish. For these actors, we assessed three categories of assets: i) transportation assets; ii) storage assets; iii) transformation assets (see ANNEX D: STANDARD AND CUSTOM INDICATORSfor detailed results).
29 Custom indicator #6 : Number of farms that increased the number, size, or amount of ponds, cages or equipment with USDA assistance 30 Custom indicator #7 :Number of value chain actors with increased capacity for distribution including processing and/or other value addition practices on assets held by post-harvest actors for i) storage; ii) transformation ; iii) transportation assets (as of 2018)

CAST Baseline Evaluation Report| 46
Figure 20: Average number of production assets of fish farmers and hatcheries
Figure 21: Average number of transportation assets31 of collectors, wholesalers and processors in control and treatment provinces
Twenty percent of the collectors and twelve percent of wholesalers operate directly from their households and do not have a specific warehouse. Average storage capacity is 38 MT for collectors, 49 MT for wholesalers to 92 MT for processors. On average, wholesalers have more transport tanks than collectors (mean of 18 vs 12, respectively). Only seven respondents, or 10% own refrigerators in the treatment group, and 6% in the control group. Eighty three percent of processors own solar dryers, with an average area of 26 m2. Stoves are rarer, being owned by only four processors (15% of treatment group) and only one processor (12%) in the control group. The number of transportation assets is similar across actors, with varying types. Wholesalers have higher capacity transportation, with an average
31 Transportation assets include: i) motorcycles; ii) carts; iii) cars; iv) motorized boats; v) mini-vans; vi) small trucks (4 wheels); vii) large trucks (6 or more wheels).

CAST Baseline Evaluation Report| 47
1.6 large transportation assets (car, truck or mini-van), compare to collectors (<1 per collector) (Figure 21).
Within our sample there were no respondents with assets and infrastructure to process fish at an industrial level, such as fileting. Cold chain is limited and storage assets concern fish sold alive, and dead fish on ice. Meanwhile, the different respondents have transportation assets, according to their scale. Processing equipment is also limited to family- or small-scale activities.
5.2. Production and value of aquaculture products This section concerns Standard indicator #132, Standard indicator #1833 and Standard
indicator #1934. Average yield is not significantly different between treatment and control provinces (ANNEX G: COVARIATES ANALYSIS, see section 3.1). In terms of volume, Pangasius is the main species produced (4,675 MT, or 57% of the total aquaculture production) and ranks first in five of the seven treatment provinces (Annex F, Table E). Phnom Penh has higher production volume and value of sales than other provinces, due to larger area and volume of production.
Figure 22: Total value (Million US$) and volume (thousand metric ton) Cambodian product sold by producers, collectors, wholesalers and processors in treatment provinces.
Within commonly produced species, the most valuable is red-tail catfish (Hemibagrus wyckioides), with an average selling price of $3.02/kg and mostly produced in Phnom Penh and Kampong Chhnang Provinces. Interestingly, differences are seen in the selling price between pond and cage production for the same species (e.g., giant snakehead $1.94/kg for cage vs $2.26/kg for pond). Silver barb also achieved a higher market price (> $2/kg). However, the data collected does not allows an analysis of the price difference between live and dead fish. We found that price are on average four to 10% lower in control provinces for the Pangasius and giant snakehead.
TError! Reference source not found.he 2018 value and volume of Cambodian aquaculture product sales for treatment provinces by producers, collectors wholesalers and
32 Standard indicator #1: Yield of targeted agricultural commodities among program participants with USDA assistance 33 Standard indicator #18: Volume of commodities (metric tons) sold by farms and firms receiving USDA assistance 34 Standard indicator #19: Value of annual sales of farms and firms receiving USDA assistance

CAST Baseline Evaluation Report| 48
processors, are presented in Figure 22. Collectors and wholesalers makeup the largest share, in terms of value, as the products can be double counted, as they may be re-sold from collectors to wholesalers. The volume and value of processors appears low due to their limited processing capacity. Also, the volume data corresponds to the volume of product sold, after processing. Moisture content of dry and smoked fish is significantly lower than live fish or dead fish on ice. The proportion of aquaculture fish sourced from Cambodia by wholesalers and processors is 68% and 64%, respectively (ANNEX F: ADDITIONAL RESULTS TO ANSWER BASELINE RESEARCH QUESTIONS, Table J). The proportion of imported aquaculture fish remains significant, representing 19% and 30% of the total volume of collectors and wholesalers respectively. More than 80% of the aquaculture fish traded are live fish – representing a higher value niche. A similar pattern was recorded in control provinces, but with less fish sold alive (60% and 36% for collector and wholesalers, respectively), but a higher share of raw material is sourced from Cambodian aquaculture.
5.3. Management practices of producers and input suppliers Standard indicator #235 , Standard indicator #336 , Standard indicator #437, Custom indicator
#338 and Custom indicator #1139 are presented in this section. Management practices of producers and suppliers have been described in Sections 4.3, 4.4, and 4.5. The indicators that report improved management practices are constructed based on several sub-indicators, reflecting an array of technology and practices (see section 2.1.8). From our evaluation, 155 farms, 14 hatcheries and four nurseries operators employed improved management practices (Standard indicator #4) from at least one of the following sub-types: aquaculture management practices, adaptation to climate change, other (marketing, post-harvest handling and business management) (Figure 23). This corresponds to 41 hectares (ha), or only 17% of the producers, leaving the vast majority of respondents operating with low level practices (Standard indicator #3). In the control group, 34 producers (11%) of the sample), seven hatcheries (53% of the sample) and one nursery employed improved management practices, corresponding to an area of 20 hectares.
There is a logical relation between low-level practice and the absence of quality inputs, with no hatcheries, nurseries or feed mill producing international quality standard products (Custom indicator #3). Area already under climate change adaption is estimated at 44.3 ha in the treatment provinces, and 13.8 ha in control provinces (Standard indicator #2). Most of the producers operating ponds in flooded areas have fenced ponds, meanwhile drought is still a concern to farmers, and ground water use is not well developed (Section 4.8). In control provinces, access to ground water is variable across provinces, as well as fencing ponds in flooded areas.
35 Standard indicator #2: Number of hectares under improved management practices or technologies that promote improved climate risk reduction and/or natural resources management with USDA assistance 36 Standard indicator #3: Number of hectares under improved management practices or technologies with USDA assistance 37 Standard indicator #4: Number of individuals in the agriculture system who have applied improved management practices or technologies with USDA assistance 38 Custom indicator #3: Number of hatcheries or feed mills that are supplying seed or feed that meets improved quality standards 39 Custom indicator #11: Number of business plans developed that include marketing and distribution strategies

CAST Baseline Evaluation Report| 49
Figure 23: Distribution of adoption of improvement management practices in treatment and control groups of producers
Only 94 respondents (or 9%) are considered to have a “business plan”. A similar ratio is observed in the control group (8.5%). As a result, only one hatchery is considered as having a business plan in the treatment group and three in the control group (Custom indicator #11). One positive characteristic found was a tendency for producers, hatcheries, nurseries, to record their sales, but less so, their inputs. As a result, those respondents do not know their production cost. Nursery and hatchery operators have a network of clients with trusted relationships in different provinces, but 68% of them do not have any sort of contract with buyers. This type of practice is also common in the control group (50% of hatcheries and nurseries).
Feed mills, currently producing animal feed, do apply several of the marketing and distribution and other practices we monitored but none are considered as having a business plan. Although they have established agreements with buyers, they have limited distribution tools, such as on-line tools for ordering products.
5.4. Post-harvest related indicators This section present Standard indicator #440, Custom indicator #541, Custom indicator #1042
and Custom indicator #1143. Processors purchase their fish from either collectors or directly from the farm-gate. For collectors, processors and wholesalers, marketing and distribution is based on verbal contract, without indication of date or volume. Marketing and trading are based on personal relationships/networks and forecasting volume needs and economic return from fish trading or processing activities is not common. None of the post-harvest actors can be considered as having a business plan based on their response (Custom indicator #11) (Table 10).
40 Standard indicator #4: Number of individuals in the agriculture system who have applied improved management practices or technologies with USDA assistance 41 Custom indicator #5: Number of market actors who are compliant with standard SPS best practices and/or are using an independent quality seal to market their products 42 Custom indicator #11: Number of business plans developed that include marketing and distribution strategies 43 Custom#11 indicator: Number of business plans developed that include marketing and distribution strategies

CAST Baseline Evaluation Report| 50
Figure 24: Distribution of adoption of improvement management practices of collectors, wholesalers and processors in treatment (T) and control group (C)
The number of improved management practices already deployed by post-harvest respondents in both control and treatment provinces is shown in Figure 24. Hygiene and quality standards in fish trading and processing are central to CAST activities. No respondents were found to follow any standard procedures when processing or trading fish. In general, quality and hygiene standards are low or non-existent (e.g., the low use of refrigerators) (two respondents only in treatment group, one in the control group) or refrigerated trucks (two respondents only, one in the treatment group, one in the control group). Ice is used when storing and transporting fish, but the quality of the ice is unknown, as 97% of the participants do not perform a quality check (100% in the control group) (Annex F, Table K). The key hygiene practices44 monitored are only followed by 20-45% of processors and wholesalers in both control and treatment groups. No firm in both treatment and control groups, is compliant with SPS or other standard for fisheries products in Cambodia (Custom indicator #5 ), and no private-sector retailers (such as AEON Mall, Chip Mong supermarket or Natural Garden grocery store) demand their own standards for fisheries products. Recording the origin of the product is not a common practice, nor is labeling the product with clear identification of the manufacturer, date of manufacture, or expiration date.
During the scoping mission, WorldFish observed that, although processors are aware of hygiene standards, they are reluctant to implement them due to the high costs involved, and lack of premium return for higher quality. On the positive side, several processors and retailers mentioned that marketing fish produce in Cambodia is getting easier, and they see the emergence of a market demand for quality products, as consumers are becoming more willing to pay higher prices.
44 use of safe ice; using gloves and mask; employee washing hands; fish not in contact with floor; using detergent to clean equipment; using specific containers to store waste from processing.
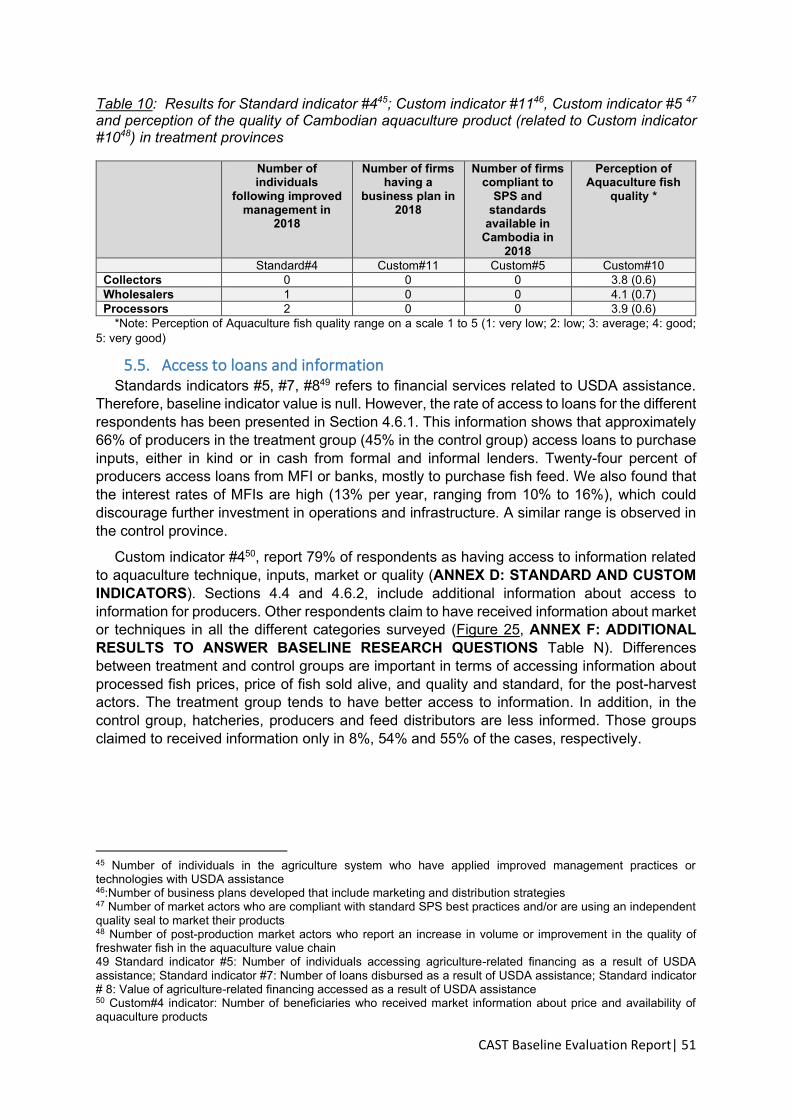
CAST Baseline Evaluation Report| 51
Table 10: Results for Standard indicator #445; Custom indicator #1146, Custom indicator #5 47 and perception of the quality of Cambodian aquaculture product (related to Custom indicator #1048) in treatment provinces
Number of individuals
following improved management in
2018
Number of firms having a
business plan in 2018
Number of firms compliant to
SPS and standards
available in Cambodia in
2018
Perception of Aquaculture fish
quality *
Standard#4 Custom#11 Custom#5 Custom#10 Collectors 0 0 0 3.8 (0.6) Wholesalers 1 0 0 4.1 (0.7) Processors 2 0 0 3.9 (0.6)
*Note: Perception of Aquaculture fish quality range on a scale 1 to 5 (1: very low; 2: low; 3: average; 4: good; 5: very good)
5.5. Access to loans and information Standards indicators #5, #7, #849 refers to financial services related to USDA assistance.
Therefore, baseline indicator value is null. However, the rate of access to loans for the different respondents has been presented in Section 4.6.1. This information shows that approximately 66% of producers in the treatment group (45% in the control group) access loans to purchase inputs, either in kind or in cash from formal and informal lenders. Twenty-four percent of producers access loans from MFI or banks, mostly to purchase fish feed. We also found that the interest rates of MFIs are high (13% per year, ranging from 10% to 16%), which could discourage further investment in operations and infrastructure. A similar range is observed in the control province.
Custom indicator #450, report 79% of respondents as having access to information related to aquaculture technique, inputs, market or quality (ANNEX D: STANDARD AND CUSTOM INDICATORS). Sections 4.4 and 4.6.2, include additional information about access to information for producers. Other respondents claim to have received information about market or techniques in all the different categories surveyed (Figure 25, ANNEX F: ADDITIONAL RESULTS TO ANSWER BASELINE RESEARCH QUESTIONS Table N). Differences between treatment and control groups are important in terms of accessing information about processed fish prices, price of fish sold alive, and quality and standard, for the post-harvest actors. The treatment group tends to have better access to information. In addition, in the control group, hatcheries, producers and feed distributors are less informed. Those groups claimed to received information only in 8%, 54% and 55% of the cases, respectively.
45 Number of individuals in the agriculture system who have applied improved management practices or technologies with USDA assistance 46:Number of business plans developed that include marketing and distribution strategies 47 Number of market actors who are compliant with standard SPS best practices and/or are using an independent quality seal to market their products 48 Number of post-production market actors who report an increase in volume or improvement in the quality of freshwater fish in the aquaculture value chain 49 Standard indicator #5: Number of individuals accessing agriculture-related financing as a result of USDA assistance; Standard indicator #7: Number of loans disbursed as a result of USDA assistance; Standard indicator # 8: Value of agriculture-related financing accessed as a result of USDA assistance 50 Custom#4 indicator: Number of beneficiaries who received market information about price and availability of aquaculture products

CAST Baseline Evaluation Report| 52
Figure 25: Percentage of wholesalers and processors that claimed to receive market information about i) processed fish price; 2) live and dead on ice fish price; 3) fish quality and standard.
Access to technical information and knowledge about fish farming remains limited in terms of diversity and exposure. Information regarding standard and quality of fish is also very limited, even in the post-harvest segments of the value chain. Access to fish prices is frequent, but the main source (usually the buyer) cannot be considered as independent. Extension and access to knowledge and market information is limited. There is no common platform at provincial or national level to facilitate access and sharing of information related to aquaculture inputs and products. As analyzed by Richardson et al. 2017, access to knowledge and training is limited to project support, while capacity of extension services to provide such support is low.
6. COVARIATE AND CONFOUNDER ANALYSIS AND PROPENSITY SCORE
MATCHING
6.1. Covariate analysis We conducted covariate analysis for key variables (volume, value, yield, pellet feed use,
top species produced, top aquaculture management practice, top post-harvest business practice) using potential covariates (province, age, gender, past project participation, loan recipient, control v. treatment, and production type as appropriate; see Section 2.1.9). We conducted analysis of production volume, value, and yield variables by pond area and cage size to provide greater understanding of the covariate analysis results. However, pond area and cage size should not be considered covariates as they are potential target variables of the project. Detailed tables of results can be found in ANNEX G: COVARIATES ANALYSIS of this report.
Importantly, 2018 farm yield (for ponds, kg of fish produced per m2; for cages, kg of fish produced per m3) was not influenced by any of the potential covariates. Based on these findings, project interventions that focus on improving yield are likely to influence farms without significant covariation. Pond and cage yields had slight negative correlations with area of pond and volume of cage (respectively), indicating that smaller farm units are slightly more productive. Based on this finding, it may be more effective to increase number of farms, rather

CAST Baseline Evaluation Report| 53
than size of farms, to enhance total productivity of the aquaculture sector in the treatment provinces.
Sales volume and value from aquaculture production and trade varied only by province as a covariate. For producers, volume and value of fish produced in the Phnom Penh municipality was significantly higher than the mean of the total sample of all provinces/municipalities. The main factor contributing to this difference is larger pond area of those farms. We found this matched the overall trend, that pond area and cage volume were positively and significantly correlated with the volume and value of sale of the farms, as logical inference would predict. Because yield had slight negative correlations with pond area and cage volume, we caution against the conclusion that bigger farms will most effectively enhance aquaculture production in the treatment provinces. The findings on yield, volume, and value altogether suggest that while per farm volume and value certainly increase with pond area and cage volume, interventions to improve pond and cage yield and an increase in the number of small farms are likely the most production-efficient means of improving aquaculture sales volume and value in the treatment provinces.
Use of pellet feed was not influenced by age or gender of producer, but was influenced by province, access to loans, participation in a past aquaculture project, production type, and control vs. treatment. Of particular note, past project participation most positively influenced pellet feed use. We suggest that a pellet feed intervention is likely to be taken up and maintained by beneficiaries.
Volume and value of aquaculture products in the post-harvest segment differed significantly between provinces. For collectors, traded fish volume was significantly high in Phnom Penh and Kampong Cham, while traded fish value was significantly high in Pursat. For wholesalers, traded fish volume was significantly high in Battambang; traded fish value was significantly high in both Battambang and Banteay Meanchey. For processors, fish volume was significantly high in Kampong Chnang; fish value was significantly high in Pursat. Due to small numbers of collector, wholesaler, and processor respondents, it is difficult to determine the reasons for the province differences of these actors. However, we suggest the project account for these provincial differences by targeting the high trade volume and value provinces of Pursat, Kampong Chnang and Battambang Provinces for their post-harvest activities, in addition to the main urban markets (Phnom Penh and Siem Reap).
No significant difference was found between the value or volume of fingerlings traded by hatcheries or nurseries. However, some provinces do not have hatcheries or nurseries (no hatchery in Phnom Penh, no nursery in Pursat or Kampong Chnang, and neither hatcheries nor nurseries in Banteay Meanchey). As previous project participation and access to loans did influence the production and value generated by hatcheries and nurseries, we hypothesize that access to knowledge and technology to increase production in these facilities can be achieved through a variety of means, not only through projects and loans.
Province, age, gender of aquaculture farmer, and access to loans, were found to be significant covariates for the main species raised by farmers. The main species by province differs and CAST project should adapt to that specificity and propose different technical packages and business model tailored to the most common species. Key findings included the stocking of Pangasius more often in control provinces and farmers more frequently use feed pellets, compared to treatment provinces.
When exploring covariates that explain differences in adoption of the top aquaculture management practices by producer, province and participation in past aquaculture projects were found to be significant. Similar analysis for post-harvest and business management practices shows that province, age, gender, beneficiary of past project, recipient of a loan, all

CAST Baseline Evaluation Report| 54
have significant influence on having a contract agreement with buyer (top post-harvest and business management practices). Of particular note, more producers in treatment provinces have contracts/agreements with buyers than producers in the control provinces (Annex G).
Overall, control and treatment groups are comparable and aquaculture farmers operate at the same performance level in many instances, other than for the most frequently raised species and the business management practices. Those two variables should be taken into account when analyzing the impact of the project, particularly regarding Standard #3, Standard #4 and Custom #11 indicators. For volume and value of fish product traded, there is no significant difference between control and treatment provinces.
6.2. Confounder variables In this section, we present possible confounder variables, or variables operating outside of
the causal pathway but that might influence the project outcomes..
Table 11: Potential confounder variables influencing CAST outcomes
Dimension Confounder variable Environmental • Change in rainfall pattern and extreme drought or flood events in part or all
provinces may affect on-farm production and management practices. • Increase in temperature may affect on-farm yield and post-harvest losses. • Change in availability and quality of water from lakes, rivers, and reservoirs
may affect production especially in dry season. Social • Land consolidation and sales may affect size and location of farm
operations, especially in Phnom Penh municipality and Kandal Province where rapid urban development is taking place51.
• Planned resettlement of floating villages currently operating cage farming on the Tonle Sap Lake and River may affect the number of beneficiaries, production and yield in both treatment and control provinces.
• Predatory loans and debt defaults may affect land holdings of target beneficiaries and/or participation to the project.
Economic • Growth in other economic sectors (such as construction and manufacturing) may continue to remove labor force away from agriculture sector in general, including aquaculture.
• Changes in financial market conditions may influence lending schemes of MFIs.
Political and institutional
• Ongoing revision of the Law on Fisheries may create new opportunities and/or barriers for aquaculture sector in general.
• Changes in cross border trade regulations may affect import of aquaculture inputs and products and price of fish and inputs.
• Other donor or private sector investments in aquaculture development in control and treatment provinces (e.g., EU-funded CAPFish Aquaculture) may influence technical support and services available to beneficiaries.
• Changes in trade regulations to major export market for fish products (China, E.U) may affect entire value chains.
Infrastructure • Ongoing expansion of road networks will influence access to markets,
services, products, and affect location of farmer clusters and value chains. • Ongoing expansion of irrigation water storage and distribution infrastructure
will influence water availability and quality for aquaculture production systems and its feasibility in various geographic areas.
51 https://www.phnompenhpost.com/post-property/land-prices-three-capital-districts-see-sharp-increase

CAST Baseline Evaluation Report| 55
Detailed statistics and data at sub-national levels are not readily available for environmental, social, political and institutional, geographic and infrastructure, and economic factors in Cambodia, and thus we are not able to conduct systematic, quantitative confounder analysis. Instead, we provide a list of factors that potentially influence CAST project intervention during the implementation period (Table 11). This assessment is based on WorldFish staff knowledge and experience from working in Cambodia over the last 20 years.
6.3. Propensity Score Matching (PSM) analysis We conducted a PSM analysis using the following variables to match individuals from
control groups with individuals from treatment groups for aquaculture producers only. The matching was done at the farm level, which means many parcel-, individual- and crop-level characteristics are converted into farm-level variables. Details of observable attributes incorporated in the score calculation include demographic conditions and other farm characteristics. We planned to use 11 variables to perform PSM. However, after multiple tests, we excluded the “main source of water”, and “province” variables, reducing the number of variables to nine. Those variables were excluded due to insufficient sample sizes for PSM performance.
As a result, the PSM analysis included the following variables: 1) age and 2) gender of farmer, 3) recipient of a loan, 4) type of production system (cage or pond), 5) the number of cages and ponds, 6) total farm size, 7) pond area, 8) household labor (by gender and class ages), and 9) long-term employment status; 10) years of aquaculture production. A common rulein PSM analysis is to include variables that return a standardized mean bias below 3% or 5% after matching. The PSM structure proposed in this analysis passes this balancing score, as the mean bias of some variables (production type or farm size) exceeds the 5% threshold. However, the balancing score is still within an acceptable range. Further improvement of the structure would be needed when conducting the project's final impact evaluation, in order to capture a high accuracy. Usually, this task would be performed only in the mid-term or end-line study. The method used for calculating the propensity score is described in Section 2.1.9.
We then matched potential beneficiaries and non-beneficiaries (which are on common support) across treatment and control provinces, based on the estimated score. This process reduced the number of potential beneficiaries from 918 to 873 – indicating that the matching has to some extent reduced the difference between the potential beneficiaries and non-beneficiaries as shown in ANNEX G: COVARIATES ANALYSIS, Figure C. We provide the list of un-matched households in ANNEX G: COVARIATES ANALYSIS, Table S and the results of the standardized mean bias of the variable used in the PSM in Table U
7. QUALITATIVE STUDY This section presents quantitative and qualitative information and analysis of the KIIs in
relation to three areas:
• The aquaculture industry
• Project implementation
• Relationship building.
Forty-six interviews were conducted with a range of relevant actors in the Cambodian aquaculture sector, including development partners, government representatives, Microfinance Institutions (MFIs), Hotels, Restaurants and Caterers (HORECA), producers, nurseries, hatcheries and post-harvest actors.

CAST Baseline Evaluation Report| 56
7.1. Aquaculture industry
7.1.1. Constraints and opportunities to development of commercial aquaculture sector Numerous constraints to the development of commercial aquaculture sector were identified
during the interviews. Of these, limited access to quality inputs, such as feed and fingerlings, was considered as the most important constraint to productivity improvement. A producer mentioned that:
“In the aquaculture sector, the cost of raising fish is higher than the cost of selling fish on the market”.
Another constraint is the low market price of imported fish from neighboring countries, competing against Cambodian products in the market and reducing the profit margins for Cambodian producers. Market prices are uncertain and fluctuate depending on the availability of imported products. A producer said:
“... the price is not stable, it declines when the imported fish from Vietnam enters the market. Because whenever it enters the market, our fish prices decrease.”
This relates to an inadequate institutional framework and capacity to regulate cross border trade to control imports of aquaculture products.
The respondents described the level of technology and adoption of new technology as low because of the limited capacity of extension services, and the limited knowledge and reluctance of farmers to adopt new technologies. Water shortages in dry season and contamination of water resources caused by agriculture and industry were also a major concern to the respondents. The months of April and May are difficult for fish farmers, as they often do not have access to sufficient water, or water is polluted from agriculture. A producer mentioned:
“… we cannot pump water from our stream. Why so? Because the Chinese spray chemical substances on cassava and rice which flow into the stream. If we are not careful with that water, our fish would die ”
The main opportunity for the sector is the positive perception of Cambodian consumers about Cambodian aquaculture fish. There is a common belief that Cambodian-farmed fish is of high quality because it is raised using less chemicals compared to imported fish. Consumer preferences (and market prices reflecting these) rank Cambodian aquaculture fish second, behind wild fish. Cambodian consumers also prefer farmed fish sold alive as an indicator of freshness. A wholesaler mentioned:
“Even though we sell our local fish at a higher price, people still buy our fish. Even though imported fish is sold at cheap prices, buyers would not buy it if they knew it was imported”.
Another opportunity is the perception by producers and market actors about high growth potential of Pangasius production. This species is considered to be easy to raise, and is popular among farmers. In addition, suitable pellet feed is already available on the market. The fish is versatile and can be processed and sold as a variety of products in addition to sold alive. A wholesaler mentioned:
“Do you know why fish retailers love selling Pangasius? Because when they cannot sell all of them, they can process them into various products. They can process Pangasius into fish paste and salted dried [fish]. They only need to dry them in the sun for a while before they can sell those processed fish. They can process it to fermented Pangasius.”

CAST Baseline Evaluation Report| 57
Pangasius is seen as a key species that can become a model for the development of commercial fish farming and for industrial processing and export. A feed mill manager explained:
”… the market demand for processed Pangasius is pretty high. So, in the next five years we may see more competition on both quality and price of the fish feed in our aquaculture market and I think we may see larger farms in our country”.
7.1.2. Constraints and opportunities to developing a traceability and quality control
system for aquaculture products Two constraints emerged from the interviews. First, there is no established regulatory
framework to implement sanitary and phytosanitary (SPS) standards and traceability system in the fisheries post-harvest. Second, aquaculture actors generally lack awareness and technical capacity to implement necessary measures even if the standards are enforced. In the post-harvest sector, the fish collectors and wholesalers are not interested in SPS, as it wo uld require them to change the way they operate but would not necessarily results in higher price as reward. The criteria currently applied for assessing fish quality was described by a wholesaler as below:
“…they buy based on the size. Live fish means that fish is good quality. No one questions about fish quality; as long as fish are alive, fat and available in the market, those fish are good”
It appears that a traceability pilot system was initiated in 2010 by FiA and failed due to limited ability of FiA to coordinate different actors of the value chain. SPS guidelines were also drafted but never finalized due to lack of budget and support from development partners, according to a government official. Overlapping roles and responsibilities for monitoring and controlling imported fish products among various government departments added another layer of complication to this challenge.
On the other hand, there is clear needs for an SPS system to facilitate the marketing of aquaculture products for both domestic and international markets. Development partners, government officials, feed distributors, and hotel and restaurant representatives all seemed to share this vision. Several HORECA and supermarket managers stressed the need to have a quality control system and that consumers (middle and upper class Cambodians and foreigners) are more aware of food safety issues, and have own system of checking the quality of the aquaculture products they purchase.
Several respondents considered the inability to distinguish between local and imported products as causing missed business opportunity for producers to access markets and gain higher selling prices. A donor representative mentioned QR code technology used in food sector in other countries as a possible solution for improving traceability of the products.
7.2. Program implementation
7.2.1. Barriers to program implementation For producers, main barriers identified were limited access to water and high cost and/or
low quality of inputs. Limited access to sufficient and clean water is a major concern to hatcheries and nurseries for producing quality fingerings. A nursery operator mentioned:
“Another constraint is the irregular rain that makes fish become sick or die […] it will make the fish die”.

CAST Baseline Evaluation Report| 58
Fingerling quality is limited due to low quality broodfish available in Cambodia. Nurseries or fingerling traders noted that they do not have sufficient skills to assess fingerling quality, or certification scheme assuring the quality and origin of fingerings.
Pellet feed quality is also uncertain, price tends to be high and local homemade feed used to raise Pangasius is of variable quality. A producer explained that:
“In the past there were abundant supplies of fish, but now it has decreased, so if we raise more [fish], the interest rate which applies when we buy trash fish become more expensive. We don’t make much profit from doing that.”
Because of high prices of feed producers limit the use of feed, resulting in low quality of the final product. A wholesaler reports:
“Some producers cannot afford to feed their fish, so the fish become so skinny”
Raising snakehead or Pangasius to commercial size requires a long growing period, even longer than one year, which therefore requires a large investment in feed. Many farmers cannot wait for that long and sell their fish before the fish reaches market size. Access to formal bank loans is limited for commercial farms, nurseries and hatcheries, as it requires collateral. In alternative producers borrow money from informal money lenders and/or input providers, to whom they have to sell their produce at below market prices.
Encouraging investment in on-farm infrastructure will be difficult if the farm does not own a secure land title. Producers renting land are reluctant to invest in hard infrastructure, such as a deep well. In addition, program implementation, at producer level and also within post-harvest segment, will face strong competition from cheap imported fish popular amongst the rural population because of its affordability. A fish farmer said:
“The problem is that a lot of Pangasius [I raised] remains [unsold] since there are a lot of imported fishes from Vietnam. A lot of imported fish from Vietnam entered [Cambodia] recently, so the local fish prices declined.”
Limited access to water limit flexibility in cropping calendar and local fish farmers often sell their product at the same time as others do, saturating local supply and thus reducing market prices. This also mean that there are seasonal gaps in the availability of locally produced fish, which have to be filled with imported fish. Wild fish, as the first choice of local consumers, also compete on the same market albeit in much higher price range than farmed fish. In addition, local producers and processors are not able to meet the quality and volumes required for export markets. The procedures required to export fish products are perceived to be very complicated and unclear by the respondents.
7.2.2. Facilitators to program implementation Currently producer and value chain networks are informal and based on personal
relationships. A more formal information-sharing network can be facilitated by digital technology, as some actors already access on-line information. A feed distributor said:
“I think that I have enough, since I can access a smart phone and the internet. I can search for all the information that I need such as prices and sources of products. I can also call suppliers and customers from my phone if I need to.”
FiA officers recognize that the extension services provided by the government are inadequate, and that the government needs private sector, producer associations, and NGOs to fill these gaps. Some input suppliers have already been providing technical support to producers as a strategy to attract more clients. A feed distributor – hatchery mentioned:
CAST Baseline Evaluation Report| 59
“I would bring the complete set (technical support, fish health, and fish feed) along with fingerlings to producers.”
Some farmers and hatcheries also show willingness to try new approaches and thus have high potential for becoming model farmers. They have acquired technical skills through trial and error, without external assistance. A hatchery owner mentioned:
“…I still wonder how they [Vietnamese fish farmers] can raise the fish to grow well but we can’t? So I had to try it by myself. Passion has pushed me to raise more fish.”
A nursery operator mentioned:’
“For everything, if we take good care of it, it won’t fail. Like my husband and I, when we started to [produce fish] for the first time, a lot of fingerlings died. But I sought strategies which can save fingerings and reduce the fingerlings’ mortality rate.”
7.3. Services and support needed for beneficiaries’ success A common theme that emerged was the need for formal training and extension services. A
majority of interviewees who derive livelihoods from aquaculture responded that they have never received any formal training and/or support from donor or government projects at all. The producers responded:
“I want to have frequent training and want them [CAST project] to show me which medicine to treat fish, teach me to diagnose fish and provide medicine that can treat our fish.”
Another common theme was the need for better coordination and access to information and knowledge for different actors of the value chain. It was suggested that CAST support an association or platform to support more transparent information exchange within a sector, which has remained rather secretive so far. A platform or association could help in facilitating discussion with the government to request regulation on import of fish and facilitate the diffusion of improved management practices. A potential CAST partner suggested that the project support the development of a niche market for quality fish, stimulating the demand for higher value fish:
“If we convince the restaurants and the hotels to really purchase those good quality (fish) compare to the normal one, I think it might be also an option that we can increase the demand for the producers, specifically those who adopt specific good practices”
Another identified theme is the need to access loans at lower interest rates. Fish farmers, especially those who live in floating villages, take loans from private money-lenders because they have no other option. A producer said:
“Right now, we can take loans from certain clients. For example, we may be able to take a loan for a sum of USD 2,000 to 3,000; but when harvesting and selling the fish, we have to pay it back. The total interest is more than the principal that we borrowed.”
The respondents expressed needs for services and support similar to the constraints described earlier emphasizing the need to access quality inputs and loans, and for improved market governance and competitiveness of local product as well as coordination along the value chain.
7.4. Relationship building We identified two main themes related to relationship building: i) the need for an
aquaculture association and; ii) the need for improved trust and connection between actors.
Thanks to various donor projects supporting aquaculture development in the past, there are informal networks currently operating at national and provincial level, none of them

CAST Baseline Evaluation Report| 60
formalized. As mentioned in the previous section, actors highlighted the need to have a formal platform to share information among the various actors of the value chain. Feed mills and distributors, hatcheries, nurseries and hotels and restaurants, all expressed interest in the development of an association because it will facilitate transparency in information sharing among all stakeholders. Fish producers are also keen to see an association providing both technical guidelines on aquaculture production and information about market demand and updated market prices, sources of quality seed, feed and medicine. Restaurant owners see the association as a “control” system related to quality standard:
“When they [producers] join the association, they will gain more knowledge on how to raise the fish properly, so it won’t affect the health of the customer. If they are not under control of the association, they can do whatever they want with the fish by feeding it with chemical substance to make it grow abnormally.”
Trusted relationships can take different forms: providing technical recommendations when inputs are sold (feed, fingerlings), a technical follow-up of a client’s production. Trusted relationships also exist in the form of ‘business partnerships’ between feed suppliers and fish producers, producers and fish collectors, and feed mills and feed distributors. A producer explained:
“I trust the middleman. We do business together for almost two decades. For example: when the truck arrives, the middleman called me, they told me the fingerlings for this time are good quality. I go and collect that fingerlings from them and share with my fellow farmers here.”
A hatchery owner explained his relationship with clients as below:
“I’ve been doing fingerling business for 15 years in here. For the old customers who take the fingerlings from me, they don’t run off although my price of fingerlings is a bit expensive, they still buy fingerlings from me because they trust me that I never cheat them.”
Those relationships are based on many years of working together but can be jeopardized easily. Distrust of inputs suppliers can hinder adoption of new technologies or practices. For instance, some producers did not receive good quality fingerlings from fingerling traders or nurseries as they were promised, as illustrated in a statement of a fish producer:
“In Phnom Penh, there are some places that sell fingerlings too, but those places might cheat the farmers.”
Building trusted relationships and improving connections between actors is essential to developing and expanding commercial aquaculture in Cambodia. More open information-sharing on price and economic return, including the use of on-line tools, and facilitating interaction among actors, can increase transparency and trust in the value chain. This also applies to MFIs and their need to better understand the sector.

CAST Baseline Evaluation Report| 61
8. KEY FINDINGS This section summarizes the key findings of the CAST baseline evaluation and provides
recommendations for project design, implementation, and the monitoring and evaluation system.
8.1. Aquaculture production and quality The baseline survey results show that both ponds and cage aquaculture are dominant
forms of commercial aquaculture production in Cambodia. Productivity performances are sub-optimal for the area cultivated due to low stocking density and the absence of aeration or proper water management practices. Productivity is hindered by low qualityinputs, specifically fingerlings of un-known origin. Production systems found in the surveyed provinces are not diverse, with Pangasius and giant snakehead being the most commonly farmed fish in all the main producer clusters, using similar management practices.
The consequences of these combined constraints on productivity cannot be overstated. As a stark comparison, the average productivity in pond culture of Pangasius in Cambodia achieves less than 25% of a similar system in Vietnam52, in terms of kg/m2.
There are significant differences in terms of production systems, volume, and level of management practices across provinces in Cambodia. This indicates that the current low productivity and lack of diversification is a function of limited input supply and knowledge gaps, rather than the production capacity of the farms themselves. Thus, the potential for increasing both the quantity and quality of fish from existing aquaculture producers is high.
The productivity of the aquaculture producers has not reached its potential because they do not have access to quality fingerlings, reasonably-priced feed, or technical knowledge to improve management practices. Hatcheries operate at low performance levels, and nurseries operate as traders of imported fingerlings, rather than acting as intermediaries between domestic hatcheries and producers in Cambodia. The competition with cheap imported fingerlings is the biggest challenge the hatcheries in Cambodia face, and discourages these operators from investing in better infrastructure and management practices to improve productivity. However, with relatively simple improvements in the handling of fish and business management, hatcheries can improve their performance significantly. For the local hatcheries to become competitive in the market, major long-term investments in the sector’s development, such as the introduction of improved strains of farmed fish and domestication of local high-value fish species, need to be considered.
Commercial fish feed production in Cambodia is still at a developmental stage, and is likely to take a few years before it can be fully operationalized. Thus, the feed supply will continue to rely on imported products for the foreseeable future. However, the feed producers that are conducting their own experiments into fish feed need technical and financial assistance to develop new product lines that can eventually enter the market. The feed producers are already using soybeans from various sources, including the U.S., as animal feed ingredients. It is unclear whether they make deliberate choices in terms of the source of imported soybeans. To encourage the use of soybeans from the U.S., it is important to understand the local demand, likely influenced by prices, timing and availability, and procurement process. CAST may consider facilitating direct business relation between local feed mills and U.S. exporters and traders to facilitate mutual understanding of the needs of local feed mills and logistical and administrative requirements.
52 http://www.fao.org/fishery/culturedspecies/Pangasius_hypophthalmus/en

CAST Baseline Evaluation Report| 62
Formal loans from micro-finance institutions have high interest rates that are prohibitive to small and medium-scale operators with limited profit margins. Consequently, producers often subscribe to in-kind loans from input suppliers in the form of farm inputs, which may have resulted in insufficient use of inputs for boosting farm productivity. The study results show a higher rate of commercial pellet feed is associated with access to loans and/or training from previous donor/NGO projects. With improved access to financial and technical assistance, the producers may gain more confidence to invest in improved feed and feeding regimes.
The CAST Activities #1, #2, #3, #4, and #1053 will address these challenges by upgrading extension services and access to knowledge to the producers and input suppliers, and demonstrating improved management practices through model farms. In implementing these activities, we recommend CAST to:
• Focus the project interventions initially on existing producer clusters in selected locations and key species, i.e. Pangasius and snakehead, and use an “incremental innovation approach” to gradually upgrade management practices of producers, particularly feeding. For example, providing alternative feed for snakehead producers when the supply of trash fish is low would give an opportunity for the producers to test pellet feed and encourage them to reduce the unsustainable use of trash fish.
• Focus its technical intervention initially to support a large number of pond-based producers who can improve productivity through relatively simple changes in water management and pond preparation. These elements of the aquaculture practices can be easily improved (using lime, fertilizer) without significant investment cost and support an increase in productivity. This type of technological package needs to go in parallel with an improvement in feeding regimes.
• Develop Best Aquaculture Management Practices (BAqMP), guidelines54, that can later inform the future national BAqMP to be developed by the Fisheries Administration. A general Pangasius55 BAqMP already exists but needs to be adapted to the local context. BAqMP for snakehead and giant snakehead species currently do not exist; developing a progressive BAqMP for two commonly-farmed snakehead species would enable quality improvements in Cambodia, and could become the basis for a future national snakehead BAqMP.
• Develop model farms, including both ponds and cages, to demonstrate improved production techniques as well as effective business models. A wide range of technologies and practices need to be demonstrated, including feeding practices, fingerling selection, water management, and fish disease control. The demonstration farms need to be nested within existing hatcheries and nurseries networks where the role of feed distributors, hatcheries, and nurseries as private extension services can also be enhanced and serve as a model for replication in other locations.
• Apply an integrated approach to address financial and technical obstacles simultaneously throughout the production and post-harvest value chain. For example, packages of support, combining upgrades in production techniques with an improved business model and marketing strategy, can result in higher profit margins and a more
53 Activity #1: Capacity Building: Agricultural extension agents/services; Activity #2: Inputs: Develop agro-dealers and/or other input suppliers; Activity #3: Training: Improved farm management; Activity #4: Training: Demonstration plots; Activity #10: Financial Services: Provide SME finance, technical assistance loans and grants 54 Best Aquaculture Management Practices (BAqMP) are recommended practices by the industry and/or institution such as Food and Agriculture Organization, National Oceanic and Atmospheric Administration (NOAA) or ASEAN community. A multitude of guidelines and manual exist detailed at the species level. 55https://www.asc-aqua.org/wp-content/uploads/2017/07/ASC-Pangasius-Better-Management-Practices_v1.01.pdf

CAST Baseline Evaluation Report| 63
rapid recovery rate of the investment cost. In this approach, the emphasis should be on improving the quality and market value of farmed fish, rather than simply increasing production volume.
• Support MFI and insurance companies to gain an improved understanding of aquaculture-related businesses and assess their financial performance and lending risks. Supporting the aquaculture producers to develop good business plans can increase the confidence level of financial institutions sufficiently to offer lower interest rates through specialized lending programs.
• Support climate change adaptation by identifying key communes and districts where access to water is a constraint and/or ponds are frequently affected by flooding. The adoption of short cycle species is not yet common in Cambodia. In these specific areas the project should develop a “climate smart business model” based on short cycle species.
8.2. Value chain efficiency Demand for quality aquaculture fish produced in Cambodia is high and increasing, but the
current production level and the capacity of local producers is too low to meet this demand. Aquaculture fish produced in Cambodia currently represents 54% of the volume traded by the collectors and wholesalers surveyed by the study, while capture fisheries and imported aquaculture fish make up the rest. Consumer preferences in Cambodia rank capture fish the highest, aquaculture fish from Cambodia the second, and imported aquaculture fish the lowest; however, there is no system to clearly distinguish the origin and assure the quality of these products when it reaches the consumer market. Reliable mechanisms for improving traceability and quality standard such as third party certification, or “block-chain” mechanisms involving digital technology need to be established and can create premium prices for products that meet certain consumer preferences and market niches. Aquaculture fish can fetch the highest prices when sold alive. Thus, hygienic standards and fish handling/transportation technologies of post-harvest operators need to be improved as a priority, through the provision of suitable equipment and procedures.
Fish buyers and traders are often the only source of market information for producers, and thus have a distinct advantage in the value chain, over the producers. There is no information sharing mechanisms at provincial or national levels to facilitate access to reliable and up-to-date information on aquaculture inputs and product prices. Many producers are also tied to particular buyers through debt. Breaking the cycle of these patron-client relationships, which are very common in Cambodia and are often built on long-term personal relationships, is challenging. However, improved access to other financial services and alternative models of trading and marketing can improve the negotiating position and profit of producers in the value chain.
9. RECOMMENDATIONS
9.1. Aquaculture production and quality The CAST Activities #1, #2, #3, #4, and #10 will address challenges related to aquaculture
production and quality presented in section 8.1, by upgrading extension services and access to knowledge for producers and input suppliers, and demonstrating improved management practices through model farms. In implementing these activities, we recommend CAST to:

CAST Baseline Evaluation Report| 64
• Focus the project interventions initially on existing producer clusters in selected locations and key species, i.e. Pangasius and snakehead, and use an “incremental innovation approach” to gradually upgrade management practices of producers, particularly feeding. For example, providing alternative feed for snakehead producers when the supply of trash fish is low would give an opportunity for the producers to test pellet feed and encourage them to reduce the unsustainable use of trash fish.
• Focus its technical intervention initially to support a large number of pond-based producers who can improve productivity through relatively simple changes in water management and pond preparation. These elements of the aquaculture practices can be easily improved (using lime, fertilizer) without significant investment cost and support an increase in productivity. This type of technological package needs to go in parallel with improvements in feeding regimes.
• Develop own Best Aquaculture Management Practices (BAqMP) guidelines, that can later inform the future national BAqMP to be developed by the Fisheries Administration. A general Pangasius BAqMP already exists but needs to be adapted to the local context. BAqMP for snakehead and giant snakehead species currently do not exist; developing a progressive BAqMP for two commonly-farmed snakehead species would enable quality improvements in Cambodia, and would become the basis for a future national snakehead BAqMP.
• Develop model farms, including both ponds and cages, to demonstrate improved production techniques as well as effective business models. A wide range of technologies and practices need to be demonstrated, including feeding practices, fingerling selection, water management, and fish disease control. The demonstration farms need to be nested within existing hatcheries and nurseries networks where the role of feed distributors, hatcheries, and nurseries as private extension services can also be enhanced and serve as a model for replication in other locations.
• Apply an integrated approach to address financial and technical obstacles simultaneously throughout the production and post-harvest value chain. For example, packages of support, combining upgrades in production techniques with an improved business model and marketing strategy, can result in higher profit margins and a more rapid recovery rate of the investment cost. In this approach, the emphasis should be on improving the quality and market value of farmed fish, rather than simply increasing production volume.
• Support MFI and insurance companies to gain an improved understanding of aquaculture-related businesses and assess their financial performance and lending risks. Support the aquaculture producers to develop good business plans can increase the confidence level of financial institutions sufficiently to offer lower interest rates through specialized lending programs.
Support climate change adaptation by identifying key communes and districts where access to water is a constraint and/or ponds are frequently affected by flooding. The adoption of short cycle species is not yet common in Cambodia. In these specific areas the project should develop a “climate smart business model” based on short cycle species.

CAST Baseline Evaluation Report| 65
9.2. Value Chain efficiency The CAST Actvitiy #5, #6, #7, #8 and #9 will provide training and capacity building to
beneficiaries operating in the post-harvest value chain to upgrade value chain efficiency challenges identified in section 8.2. In implementing these activities, we recommend to:
• Enhance and expand existing network of hatcheries/nurseries and producer clusters to include post-harvest operators, improve the quality and flow of new knowledge and technology, and market information to the producers, and demonstrate a more transparent and equitable value chain.
• Improve business management practices at an individual farm and business operator level to promote self-sufficiency, and avoid overreliance on external subsidies. The project should develop locally adapted tools and training material to increase the adoption of basic business management practices such as recording inputs and sales, but also develop business plans such as identifying market in advance.
• Hygiene practice is low for a large number of value chain actors. Training and raising awareness of hygiene practices will not lead to sustained behavior change without clear financial benefit for the wholesalers, collectors and processors. Therefore, the project should already identify markets for higher quality fish and fish products, before engaging training. This way, the newly identified buyers of the higher quality produce, can be a part of the new value chain arrangements, including the training needs. Training for higher hygiene and quality, as well as traceability systems (see below) should be demand driven.
• Improved post-harvest and marketing practices should focus on key species (Pangasius and snakehead) and product (dry and smoked fish) and also include fish sold alive fish which represent a large volume of the production. For the latter, current practices are not well known and identification to improve performance and quality of this sub-value chain should be a priority.
• Alternative contractual arrangements are facilitated between producers and buyers, such as group contracts, and pricing systems, such as collective marketing and/or auctioning of farmed fish. Auctioning can contribute to the development of price premium for locally produced fish. These will also require behavioral changes regarding some traditional business habits such as contracting some days before harvest. Buyers can also benefit by reducing their business risk through securing supply volume and timing through group contracts.
• Adoption of improved management practices at the producer level, which requires a higher investment, will be effective and sustainable if driven by market demand and requirement of the buyers. Therefore, the project should focus activities and interventions in the identified processing “hubs” to create demand for higher quality products and link those with farmer clusters.
• Support on traceability and SPS mechanisms should initially focus on a limited number of commodities or products as a pilot, that are already linked with a relatively well-organized value chain, to major consumer markets in urban areas. Pangasius or giant snakehead are good examples. Using the pilot product value chain, an awareness campaign could be developed in urban centers to build demand for high quality, locally raised fish. Subsequent stimulation of demand for locally-raised, high quality fish can catalyze the demand for other fish and fish products, generate premium prices for these products, as well as incentives for producers and post-harvest actors to improve management practices.
• Develop an SPS scheme for CAST, in line with existing SPS in the aquaculture industry in Southeast Asia, and start testing the implementation in collaboration with the Cambodian
CAST Baseline Evaluation Report| 66
government and private sector. By so doing, CAST can contribute to the development of SPS system by the Cambodian government which will likely begin during the life of the project.
• Some value chain actors have limited access to formal finance investment loans in infrastructure, due to lack of collateral (e.g., land title). Providing support to these beneficiaries to develop robust business models and plans can facilitate improved access to formal loans.
9.3. Design of Monitoring and Evaluation system for CAST Two types of M&E activities are to be expected: 1) generation of Standard and Custom
indicator values to be reported to USDA at required frequency and scope (IPTT); and 2) activity tracking and progress monitoring for the CAST management. It is impractical to replicate the entire suite of baseline surveys on a yearly basis. We recommend that only a subset of surveys are replicated on a yearly basis (or 6 monthly, depending on required frequency) to generate indicator figures, using purposive sampling.
The number of Standard and Custom indicators in CAST IPTT, and the level of disaggregation seems quite ambitious for a project of this size and scope. Setting realistic annual targets for all the indicators (with proposed disaggregation) would require substantial effort and additional research to develop assumptions and growth scenarios. For the purpose of reporting to USDA our suggestion to CAST is to prioritize a smaller number of key indicators that best represent high level outcomes that CAST aims to achieve within the life of the project.
Simplification of some Standard Indicators, by reducing the level of disaggregation, can also be considered to enable annual reporting based on the scope and geographic coverage of actual project interventions each year. Annually assessing the yields of several different types of production systems, such as pond and cage systems, and several species of fish, through population-based surveys will be time consuming, and difficult to compare the project impact on an annual basis. To develop a practical M&E system we suggest a smaller, purposive sample size to monitor production system performance of the beneficiaries who received assistance in a given year more precisely. For example, Standard indicator #1: Yield of targeted agricultural commodities among program participants with USDA assistance, can focus on selected fish or products in the geographic areas where the project activities are actually implemented. Reporting incremental increases in the volume of production and sales can also be simplified by focusing on specific time of the year, with bulk of harvest taking place within a few-months period in a year, rather than reporting annual total volume. Similarly, stocking of fish should be concentrated within a few months. Resources affected by track and monitor activities should acknowledge those peak periods.
The tracking and progress monitoring activity needs to follow up on direct beneficiaries who receiveproject support in a given year. Detailed monitoring will be useful for model units on individual farms that have more than one production unit (pond or cage), to capture seasonality, with additional performance indicators of production system such as feed conversion rate (FCR) that requires detailed information from individual farmers. In order to inform project activities and develop locally sustainable business models for producers and other beneficiaries, financial and activity logbooks should be kept, at least for fish producers to: i) estimate net income gain; and ii) assess feasibility for production upgrade. This level of monitoring, ideally, should be supported for all individual farms that receive project assistance, for the purpose of project management.

CAST Baseline Evaluation Report| 67
Some Custom indicators require determination of “improvements” in management practices and technologies, or quality standard, applied by the project beneficiaries, and reported as a number of individuals/firms or hectares/square meters. These indicators may be more suited for progress monitoring through activity tracking, than population-based survey. Similarly, reporting on Standard indicator #2: Number of hectares under improved management practices or technologies that promote improved climate risk reduction and/or natural resources management with USDA assistance and Standard indicator #3: Number of hectares under improved management practices or technologies with USDA assistance, can be done more effectively through activity tracking and record keeping conducted by field staff of CAST, rather than survey.
We recommend CAST to conduct case studies with a selected number of beneficiaries to assess individual farmers’ progress against some of the variables that constitute the index of “improved management practices” related to Standard #3, Standard #4 and Custom #2 indicators.
10. CONCLUSION Findings of the CAST Baseline Evaluation were consistent with other recent review and
value chain studies of the sector (VCA4D; NSPAD 2017). The sector is dependent on imports for inputs, the practices and performance of the sector are sub-optimal. The value chains are inefficient, neither vertically nor horizontally integrated, and are characterized by limited contracting practices, marketing and market channels based on personal networks, and lack of transparent information sharing.
Therefore, various CAST sub-activities need to be implemented in a coordinated manner to achieve performance improvements in productivity and quality of producers at the same time as the improvements in access to market and profitability. Higher profitability and a more secure market can trigger changes in the behavior of producers towards the adoption of improved production and business practices.

CAST Baseline Evaluation Report| 68
REFERENCES
ICEM 2013. USAID Mekong ARCC Climate Change Impact and Adaptation: Main Report. Prepared for the United States Agency for International Development by ICEM - International Centre for Environmental Management
FiA. 2017. Official Fisheries Statistics. Fisheries Administration, Cambodia.
Kusakabe, K., 2016. Women Fish Processors in Cambodia: Challenges for Collective Business Goals. In N., M.J. Williams, M. Porter and K. Kusakabe. 2016. Gender in Aquaculture and Fisheries: The Long Journey to Equality. Asian Fisheries Science (Special Issue) 29S. pp. 93–110.
Richardson, R., Suvedi, M., M.K. and S.M., 2017. Cambodia HARVEST Aquaculture Program Evaluation. In Feed the Future – Cambodia Impact Evaluation and Strengthening of Local Capacity to Monitor and Evaluate Food Security Programs Evaluation case study reports.
VCA4D, 2018. Aquaculture value chain analysis in Cambodia. Brief N 9. November 2018. 6pp.
ANNEXES
A. Request for proposals (RFP) to conduct a baseline evaluation for ASA/WISHH’s Food
for Progress (FFPr) Program in Cambodia
B. Sampling Framework
C. Questionnaires & Survey Tools
D: Standard and custom indicators (summary tables)
E: List of key informants
F: Additional result tables for baseline research question and key findings
G: Co-variates analysis
H: List of consulted documents
I: Additional results from the qualitative study

CAST Baseline Evaluation Report| 69
ANNEX A: REQUEST FOR PROPOSALS (RFP) TO CONDUCT A BASELINE
EVALUATION FOR ASA/WISHH’S FOOD FOR PROGRESS (FFPR) PROGRAM IN
CAMBODIA

CAST Baseline Evaluation Report| 70
Commercialization of Aquaculture for Sustainable Trade (CAST) Cambodia Request for Proposals (RFP) to Conduct a Baseline Evaluation for ASA/WISHH’s Food for Progress (FFPr) Program in Cambodia
Overview RFP NUMBER: FFPR18-RFP-01-2018 RFP ISSUANCE DATE: January 14th, 2019 QUESTIONS DUE: January 25th, 2019 – 5:00 PM CST PROPOSALS DUE: February 11th, 2019 – 5:00 PM CST
The American Soybean Association’s (ASA) World Initiative for Soy in Human Health (WISHH) program is posting this Request for Proposals (RFP) for a consultant to conduct the Baseline Evaluation, hereafter referred to as the Baseline Study, under the Food for Progress (FFPr) 2018 Project funded by the United States Department for Agriculture (USDA) and Implemented by the Commercialization of Aquaculture for Sustainable Trade (CAST) project in Cambodia.
ASA/WISHH invites proposals to be submitted electronically on or before the date and time specified above. Submissions should be sent via email to James Bernhardt at [email protected] (cc: [email protected]).
All submissions should identify the RFP number: FFPR18-RFP-01-2018 and the name of your organization in the subject line.
CAST Baseline Evaluation Report| 71
RFP Conditions
Award: This RFP does not commit the ASA/WISHH to award a contract or to pay any costs incurred in the preparations or submission of proposals, or costs incurred in making necessary studies for the preparation thereof or to procure or contract for services or supplies. The ASA/WISHH reserves the right to reject any or all proposals received in response to this RFP and to negotiate with any of the vendors or other firms in any manner deemed to be in the best interest of the ASA/WISHH. The ASA/WISHH reserves the right to negotiate and award only a portion of the requirements; to negotiate and award separate or multiple contracts for the elements covered by this RFP in any combination it may deem appropriate, at its sole discretion to add new considerations, information or requirements at any stage of the procurement process, including during negotiations with vendors; and reject proposal of any vendor that has previously failed to perform properly or in a timely manner contracts of a similar nature, or of a vendor that, in the opinion of the ASA/WISHH, is not in a position, or is not sufficiently qualified, to perform the contract.
This RFP contains no contractual proposal of any kind, any proposal submitted will be regarded as a proposal by the vendor and not as an acceptance by the vendor of any proposal by the ASA/WISHH. No contractual relationship will exist except pursuant to a written contract document signed by the authorized procurement official of the ASA/WISHH and by the successful vendor(s) chosen by the ASA/WISHH.
Submission of Questions: All questions regarding the preparation of proposals must be submitted in writing (by e-mail) to James Bernhardt at [email protected] (cc: [email protected]) no later than
5pm CST on Friday, January 25th, 2019. A copy of all written questions and responses will be provided to all interested organizations by email request on or shortly after Monday, January 28th, 2019. No questions will be answered over the phone or in person; all questions must be in writing and sent via email.
Guiding Principles: Consultants must conduct all activities for the Baseline Study in an ethical manner. Evaluation activities should appropriately balance the desired creation of evidence with the protection of human subjects, including safeguarding the dignity, rights, safety, and privacy of participants. Evaluators are responsible for applying ethical principles in all stages of the Baseline Study, and for raising and clarifying ethical matters with stakeholders during the course of the Baseline Study.
Conflict of Interest: All team members must provide a signed statement attesting to a lack of conflict of interest, or disclosing any real or potential conflicts of interest.
Non-Discrimination Statement: ASA/WISHH prohibits discrimination against its customers, employees, and applicants for employment on the basis of race, color, national origin, age, disability, sex, gender identity, religion, reprisal, and where applicable, political beliefs, marital status, familial or parental status, sexual orientation or all or part of an individual’s income is derived from any public assistance program or activity conducted.

CAST Baseline Evaluation Report| 72
Table of Contents Table of Contents ............................................................................................................................................................... 3 Acronyms and Abbreviations ............................................................................................................................................ 4
List of Figures .................................................................................................................................................................... 4 List of Tables ..................................................................................................................................................................... 4
Section 1: Supplies or Services and Prices/Costs ................................................................................................................ 5 1.1 Purpose .............................................................................................................................................................. 5
1.2 Period of Performance ....................................................................................................................................... 5 Section 2: Background ....................................................................................................................................................... 5
2.1 About the Organization ....................................................................................................................................................................................... 5 2.2 Project Description ............................................................................................................................................. 6
2.3 Relevant Program Documents .......................................................................................................................... 10 Section 3: Statement of Work .......................................................................................................................................... 10
3.1 Baseline Study Objectives ................................................................................................................................ 10 3.2 Baseline Study Questions ................................................................................................................................ 11
3.3 Approach and Methodology ............................................................................................................................. 12 3.4 Deliverables ..................................................................................................................................................... 12
Implementation Plan and Schedule .......................................................................................................................... 12 Data Analysis Plan ................................................................................................................................................... 13
Baseline Study Report and Baseline Data ................................................................................................................ 13 3.5 Research Team ................................................................................................................................................. 15
Attachment A: Proposal Guidelines and Selection Criteria ............................................................................................. 17
Attachment B: Abbreviated Version of PMP with Standards .......................................................................................... 18
Attachment C: Abbreviated Version of IPTT with Customs ........................................................................................... 27 Attachment D: Project-Level Results Framework(s) ....................................................................................................... 28
Attachment E: Project Implementation Map.................................................................................................................... 29

CAST Baseline Evaluation Report| 73
Acronyms and Abbreviations ASA American Soybean Association CAST Commercialization of Aquaculture for Sustainable Trade CE SAIN Center of Excellence for Sustainable Agricultural Intensification and Nutrition FAS Foreign Agricultural Service FFPr Food for Progress IPTT Indicator Performance Tracking Table KII Key informant interview KSU Kansas State University LOP Life of project M&E Monitoring and Evaluation MAFF Ministry of Agriculture, Forestry and Fisheries MES Monitoring and Evaluation Staff PMP Project Monitoring Plan PSM Propensity score matching QDA Qualitative data analysis RFP Request for Proposals SME Small- to medium-sized enterprises SPS Sanitary-phytosanitary TBD To be determined TOR Terms of reference USAID United States Agency for International Development USDA United States Department of Agriculture USG United States Government WISHH World Initiative for Soy in Human Health
List of Figures
Figure 1: USDA Results Framework with CAST Activities (SO1) Figure 2: USDA Results Framework with CAST Activities (SO2) Figure 3: Map of CAST-targeted geographies
List of Tables
Table 1: Timeline for Baseline Study Table 2: Final Report Requirements Table 3: Criteria for Scoring Proposals Table 4: Overview of Standard Indicators Table 5: Overview of Custom Indicators

CAST Baseline Evaluation Report| 74
Section 1: Supplies or Services and Prices/Costs
1.1 Purpose The purpose of this RFP is to solicit applications from companies and/or individuals to conduct a Baseline Study for ASA/WISHH’s CAST project in Cambodia. CAST is a five-year USDA-funded project that was awarded in September 2018. The Baseline Study will collect quantitative and qualitative baseline data to be included in the project’s Performance Monitoring Plan (PMP) and Indicator Performance and Tracking Table (IPTT). Additionally, this exercise will allow ASA/WISHH to eventually assess the extent to which project objectives were met or unmet over the life cycle of the project.
The Baseline Study team will be comprised of the lead consultant and his/her assistants, and shall work in cooperation with USDA’s Monitoring and Evaluation Staff (MES) in Washington, D.C., ASA/WISHH’s M&E Officer based in St. Louis, Missouri, CAST’s Chief of Party and M&E Manager based in Cambodia, and CAST’s implementing partners in Cambodia.
1.2 Period of Performance The Period of Performance of this contract is expected to fall between March and August 2019. The anticipated award date for this contract is March 1st, 2019. The final report should be submitted to ASA/WISHH on or before August 5th, 2019. Please see Table #1 for more details about the proposed timeline for the Baseline Study.
Section 2: Background
2.1 Aboutthe Organization The American Soybean Association (ASA) was founded in 1920 by soybean farmers and extension workers to promote soy for high protein applications in developmental settings. Overseas activities initiated in the mid-1950s and to date ASA has worked in over 80 countries. The World Initiative for Soy in Human Health (WISHH) was founded in 2000 to expand the work of the American Soybean Association (ASA) in developing emerging markets to improve health, nutrition and food security—building the groundwork for future markets of soy. WISHH provides services in food technology, business development, nutrition services, and program and proposal development. WISHH expertise extends its network into additional areas, such as aquaculture and animal feed. ASA/WISHH connects trade and development to strengthen agricultural value chains in emerging markets, creating trade and long-term demand for U.S. soy. Trade can improve lives worldwide for both farmers and consumers. U.S. soy trade in emerging markets is pivotal to improve accessibility, affordability, and acceptability of high-quality plant and animal-sourced proteins in developing economies. Rising incomes in emerging economies generate further opportunity for trade. ASA/WISHH builds opportunity for long-term trade by improving agricultural value chains, human and animal nutrition, and farmer net incomes. ASA/WISHH initiatives broadly fit in two arenas: (1) trade-building long-term, early-stage market development, and, (2) trade-building international agriculture and economic development. The St. Louis-based Program operates in sub-Saharan Africa, Asia and Central America.

CAST Baseline Evaluation Report| 75
ASA/WISHH has supported market and economic development activities in the human food sector since its inception in 2000 and works to increase the use of quality soy protein ingredients and products in food for human consumption through commercial development and nutrition programming. ASA/WISHH offers over six years of proven feed sector capacity and decades of accumulated knowledge from ASA programs. Principal approaches include market and economic assessments, technical assistance and capacity building, food and feed trials and demonstrations, farmer field days, youth mentorship programs, food and feed value chain development, and market linkages.
ASA/WISHH achieves its mission by working in close partnership with: (1) the public sector (e.g., USDA, USAID, U.S. land grant universities, and host country governments), (2) the private sector (e.g., trade associations: Qualified State Soybean Boards and U.S. Soybean Export Council), and (3) private voluntary organizations. The Program draws upon the resources and experience of these partners and the services of a cadre of ASA/WISHH consultants with technical expertise in agricultural, international and commercial development spheres. ASA/WISHH relies on decades of experience in food commercial development and agricultural development programming. The Program takes pride in its growing portfolio of success with U.S. government-funded projects, including USDA (Food for Progress, McGovern-Dole, Global Broad-Based Initiative, Foreign Market Development, Market Access Program, Emerging Markets Program, and Quality Samples Program) and USAID funding in both prime and sub- recipient capacities. ASA/WISHH has also attracted both private sector and other complementary funding sources from various donors to build on and leverage core funding from Qualified State Soybean Boards.
2.2 Project Description CAST Cambodia is a five-year program financed by the USDA and implemented by ASA/WISHH signed by both parties on September 27th, 2018. CAST’s operational budget consists of $15.55 million in monetization proceeds plus $1.62 million in CCC funds. The M&E budget for this program is $2.08 million or 12.1% of the total project budget. The project supports the USDA FFPr objectives of increased agricultural production and trade by increasing the use of improved agricultural techniques and technologies among target populations and improving linkages between buyers and sellers.
The two main objectives of CAST Cambodia are:
1. Increase agricultural productivity in the freshwater aquaculture industry through improved inputs and practices; and
2. Increase trade in Cambodian aquaculture, by volume and value.
These objectives will be supported by the following activities:
Activity #1: Capacity Building: Agricultural extension agents/services
ASA/WISHH will build the capacity of Cambodian aquaculture education and extension systems through the transfer of U.S. agricultural research and extension methodologies. ASA/WISHH will

CAST Baseline Evaluation Report| 76
conduct needs assessments with stakeholder groups to determine technology gaps, and develop training agendas for conducting capacity building activities. ASA/WISHH will also support the establishment of an aquaculture professional course and certification for university students and professionals, and will institute an internship/mentorship program to pair aquaculture students with industry professionals.
Furthermore, ASA/WISHH will support the Center of Excellence for Sustainable Agricultural Intensification and Nutrition (CE SAIN) to establish aquaculture training and feed demonstration facilities.
Activity #2: Inputs: Develop agrodealers and/or other input suppliers
ASA/WISHH will increase supply and improved access to quality, domestically-produced aquaculture inputs by providing targeted technical assistance to private hatcheries. ASA/WISHH will work to develop aquaculture small to medium-sized enterprises (SME), including seed, feed, and veterinary supplies. ASA/WISHH will conduct an assessment of the seed value chain to assess technical needs, supply chain challenges, and barriers to capacity extension. Through this assessment, ASA/WISHH will provide technical assistance to private hatcheries and feed mills, develop a local aquaculture feed database, and support the development of aquaculture feed formulations. Furthermore, ASA/WISHH will work on the development of aquaculture feed standards in collaboration with the Ministry of Agriculture, Forestry and Fisheries, and support participation of freshwater aquaculture actors in local trade promotional events.
Activity #3: Training: Improved farm management
ASA/WISHH will work with large and medium-sized intensified pond and cage operations in order to increase their productivity and profitability by addressing issues related to technical knowledge and access to quality inputs, including feed, seed and fertilizer, and aquaculture infrastructure. ASA/WISHH will provide technical assistance to SME aquaculture producers and link input supplies to potential buyers.
Activity #4: Training: Demonstration plots
ASA/WISHH will establish model aquaculture and training hubs. This research demonstration site will serve as a hub for expertise on freshwater aquaculture information, training and applied research in aquaculture. ASA/WISHH will work with key stakeholders to develop a technology park’s facilities into a primary location for showcasing proven aquaculture research and training.
Activity #5: Training: Sanitary and phytosanitary standards (SPS)
ASA/WISHH will support private sector actors to develop voluntary standards based on the Government of Cambodia’s proposed sanitary-phytosanitary (SPS) framework and will help

CAST Baseline Evaluation Report| 77
facilitate the transition to the government’s final standards. ASA/WISHH will engage with the Government of Cambodia to facilitate standards and measures adopted by the private sector. ASA/WISHH will develop a communications campaign among value chain actors and consumers to disseminate the benefits of SPS standards to the public. ASA/WISHH will engage with the Department of Fisheries Post-Harvest Technologies and Quality Control to train private sector actors on voluntary industry SPS standards.
Activity #6: Capacity Building
ASA/WISHH will strengthen the business management capacity of aquaculture enterprises, input and service providers, and other value chain stakeholders. ASA/WISHH will provide technical assistance and support identified stakeholders to develop and implement business plans. ASA/WISHH will provide financial support through cost-sharing capital investments to improve market position. Furthermore, ASA/WISHH will establish a technical assistance loan facility to provide revolving loans to SMEs seeking technical assistance.
Activity #7: Capacity Building: Producer groups/cooperatives
ASA/WISHH will organize aquaculture stakeholders, including producers, aggregators, wholesalers, and input suppliers at local and national levels to address issues of common interest, including public policy, development of voluntary standards, information sharing, and general promotion of Cambodian aquaculture to consumers.
ASA/WISHH will facilitate the creation of a Cambodian national aquaculture association. ASA/WISHH will conduct outreach to promote the association, solicit feedback on association services, and identify potential members. ASA/WISHH will facilitate the selection of association leadership and support members to develop the association mission, services, and sustainability strategies. Once formed, ASA/WISHH will facilitate recruitment via member outreach and promotion, and support participation from project stakeholders. Furthermore, ASA/WISHH will train association leadership and staff in marketing and advocacy strategies, and policy analysis.
Activity #8: Training: Improved marketing and branding
ASH/WISHH will raise consumer awareness of high-quality, Cambodian-grown, freshwater aquaculture fish and strengthen buyer-seller linkages along the value chain. ASA/WISHH will organize and launch a consumer awareness and branding campaign targeting consumers, consumer facing companies, and exporters. ASA/WISHH will conduct a market survey on consumers’ current perceptions, preferences, purchasing considerations, and identify media contact points. ASA/WISHH will facilitate the identification and prioritization of consumer perceptions, development of behavior change messaging, identification and selection of media, and design of a marketing and branding strategy.

CAST Baseline Evaluation Report| 78
ASA/WISHH will support producers, wholesalers, distributors, and retailers to build a sustainable supply chain for locally-sourced quality Cambodian fish. ASA/WISHH will promote value-chain linkages and branding techniques for advocating locally produced fish. ASA/WISHH will link high-volume domestic buyers and industries with local producers. ASA/WISHH will also identify
regional market opportunities for export and assist exporters in finding reliable supply chains of quality fish. ASA/WISHH will facilitate marketing events, including trade shows and discussion panels to support buyer-seller relationships and promote local aquaculture.
Activity #9: Market Access: Facilitate a traceability system for domestic aquaculture
ASA/WISHH will support selected distributors and export companies to pilot a traceability system to support compliance with production and sanitary and phytosanitary standards. ASA/WISHH will identify a cost-effective technology platform and support industry stakeholders to establish effective, business-friendly protocols to be integrated into a traceability software program. Once protocols are established, ASA/WISHH will train stakeholders on traceability protocols and the use of software and equipment. ASA/WISHH will ensure that marketing materials, consumer awareness/branding campaigns, and export promotion initiatives incorporate information about the benefits of traceability to ensure sanitary and phytosanitary standard compliance. ASA/WISHH will co-invest in the operational costs of the traceability system, and train selected participants on operations management and reporting requirements.
Activity #10: Financial Services: Provide SME finance, technical assistance loans and grants
ASA/WISHH will commission and publish a study outlining the business environment, growth potential, and market opportunities in the aquaculture sector, as well as recommendations for financial institutions, the private sector, and other stakeholders and aquaculture initiatives. ASA/WISHH will conduct project seminars, farmer-field days, agricultural exhibitions and other project activities with representatives from key agricultural financing institutions to build relationships with sector stakeholders and leaders.
ASA/WISHH will provide co-investment opportunities in promising aquaculture value chain enterprises. ASA/WISHH will identify a local financial institution to manage co-investment capital, including joint development of investment criteria, return-on-investment hurdles, and sub- sector prioritization. ASA/WISHH will also establish a separate no-interest revolving technical assistance loan fund. Technical assistance loans will enable the provision of technical and business development services needed to grow and expand SMEs.
ASA/WISHH will support a private agricultural insurance provider to collect quality data related to pond and cage production. Additionally, ASA/WISHH will facilitate the insurance product’s introduction to the aquaculture value chain via farm visits, access to information including production models, and meetings with stakeholders. ASA/WISHH will work with the private sector to test new insurance products via simulations with a representative sample of producers to improve the design and reach a final product that can be taken to market. By the end of the project period, it

CAST Baseline Evaluation Report| 79
is expected that ASA/WISHH will have facilitated the first underwritten insurance policies for the aquaculture farmers in Cambodia, which will lay the groundwork for expansion and growth to further reduce the risk in commercial aquaculture. The program will be focusing on specific geographic areas. The provinces targeted by the program include: Siem Reap, Battambang, Pursat, Kampong Thom, Kampong Cham, Kandal, and Phnom Penh. These locations were selected not only for their high production potential and opportunity to support expansion of high productivity systems, but also for their proximity to major markets with strong potential to capture future price premiums.
2.3 Relevant Program Documents The Consultant will be expected to utilize available documents applicable to CAST Cambodia and display a good understanding for USDA’s M&E Policy and Indicator Handbook.
Section 3: Statement of Work
3.1 Baseline Study Objectives ASA/WISHH is seeking the services of a third-party consultant or team of consultants to carry out a Baseline Study for CAST Cambodia in accordance with the terms of reference (TOR) herein. ASA/WISHH anticipates that this study will take place in the provinces mentioned above and that the Consultants will collect control data from other geographically similar provinces (e.g., Kampong Chhnang, Kampong Speu, Takéo).
The Baseline Study is meant to serve the following purposes:
1. To provide baseline data for the PMP and serve as the basis for updating the yearly and life
of project (LOP) targets described in the IPTT, and 2. To provide the benchmark for the project’s midterm and final evaluations. 3. To provide information to validate and inform the project’s interventions.
The Baseline Study must also provide reliable background information and analysis related to the current conditions and realities in the aquaculture sector and overall economic situation in the targeted six provinces and Phnom Penh, with a specific focus on SMEs.
This will necessitate a quasi-experimental design that uses both quantitative and qualitative methods for collecting baseline data. ASA/WISHH expects that the Consultant will collect data from the following partners, stakeholders, and beneficiaries:
• World Vision, Kansas State University (KSU)’s Sustainable Intensification Innovation
Laboratory, Auburn University, Foreign Agricultural Service (FAS) • Ministry of Agriculture, Forestry and Fisheries (MAFF), and the various Cambodian
Government offices working in Aquaculture as well as members of EU-CAPFISH led aquaculture sub-working group.
• Feed mills (e.g., AgriMaster/Medivet), aquaculture producers, hatcheries and nurseries, fish processors and buyers, financial institutions

CAST Baseline Evaluation Report| 80
• Middlemen/services providers, retailers/supermarkets, transporters, distributors
While designing the study and creating the methodology for data collection, the Consultant should consider CAST’s Project-Level Results Framework described in Attachment D.
3.2 Baseline Study Questions The Consultant should propose a detailed and reproducible strategy for answering the following research questions:
1. To what extent did the project have an impact on the productivity of feed mills, aquaculture
producers, and hatcheries and nurseries? 2. To what extent did the project have an impact on international soy protein trade and the
agricultural and fish product trade in Cambodia? 3. To what extent did the project have an impact on the quantity and quality of feed and seed
produced for aquaculture producers and its availability and accessibility? 4. To what extent did the project have an impact on the supply of premium quality Cambodian
grown freshwater fish (e.g., snakehead, clarias catfish, red tilapia) to the local market? 5. To what extent did the project have an impact on beneficiaries’ ability to access finance that
is needed for business growth and development?
It is also expected that the Consultant will work with ASA/WISHH staff to further develop these questions. The Baseline Study should also collect baseline data for all applicable indicators included in the PMP. An abbreviated version of this file can be found in Attachment B. Table #4 includes all of the project’s 19 standard indicators.
The following are an amended list of standard indicators the project will need reliable baseline data for prior to delivering services to program beneficiaries:
• Number of hectares under improved management practices or technologies that promote
improved climate risk reduction and/or natural resources management; • Number of hectares under improved management practices or technologies; • Number of individuals in the agriculture system who have applied improved management
practices or technologies; • Yield of targeted agricultural commodities; • Value of annual sales of farms and firms; • Volume of commodities (metric tons) sold by farms and firms.
The project also has 11 custom indicators that can be found in Attachment C. The following is a preliminary list of custom indicators the project will need reliable baseline data for prior to delivering services to program beneficiaries:
• Area of ponds under improved management practices or technologies; • Number of hatcheries or feed mills providing seed or feed that meets international quality
standards; • Number of market actors selling fish who are compliant with national SPS standards or are
CAST Baseline Evaluation Report| 81
using an independent quality seal;
This information will also help the project to conduct proper and accurate monitoring of the program performance and results. Where applicable, the standard and customs indicators should be disaggregated as specified in CAST’s PMP.
3.3 Approach and Methodology Generally, this study should comprise a mix of quantitative and qualitative methods and tools appropriate to the study’s research questions. It is expected that both quantitative and qualitative data is provided to support the study’s findings. Additionally, even if/when secondary data are available for the Consultant to build on, attempts should be made to obtain primary data with reliable methods to ensure data integrity.
The methods and tools used in the study should include a combination of the following:
Document review: The Consultant will find it useful to reference a broad range of background documents related to the aquaculture sector in Cambodia apart from project documents provided by ASA/WISHH.
Population-based Survey(s): The Consultant will develop and administer one or more population-based surveys to establish baseline values for a number of performance indicators. These surveys will be administered to beneficiaries in each of the project’s intervention provinces and a select number of control provinces. A representative sample of beneficiaries should be selected for each of our subgroups and the appropriate survey should be administered to these beneficiaries in person. The Consultant will be responsible for hiring and training enumerators, managing the logistics of field visits, ensuring that the data collected is accurate, and that beneficiary information is safe and secure.
Key Informant Interviews (KIIs): The Consultant is expected to facilitate a limited number of KIIs with key stakeholders, including U.S. and field-based USDA staff, ASA/WISHH staff and associated consultants, implementing partners and staff, and program stakeholders and beneficiaries (e.g., producers, feed mills, hatcheries and nurseries). The purpose of these interviews is to learn more about barriers and facilitators to project implementation and develop a better understanding about the conditions under which CAST will be enacted. The Consultant will need to develop a semi-structured interview guide and propose a strategy for determining which beneficiaries will be asked to participate in these interviews.
If requested, ASA/WISHH will assist in making appointments with partners, community members, government officials and other stakeholders.
3.4 Deliverables The Consultant is expected to provide the following deliverables to ASA/WISHH:
Implementation Plan and Schedule
The Consultant will submit a draft of their implementation plan on or before the 18th of March.

CAST Baseline Evaluation Report| 82
This document should include the evaluation approach, methods for data collection, overview about data processing and analysis, list of team members’ roles and responsibilities, and planned schedule of activities. The final implementation plan should be submitted on or before the 1st of April and include a step-by-step account of how data will be collected and managed during this exercise. This document should also include a detailed schedule of activities and data collection instruments, tools, and guidelines. It is expected that data collection will commence on or around April 15th and be completed within six weeks or by May 27th. The Consultant will complete a desktop review of all data and share a descriptive report with ASA/WISHH on or before June 10th. Data analysis should be completed by June 24th and a first draft of the Baseline Study Report should be submitted to ASA/WISHH on or before July 8th. ASA/WISHH will review this report and provide feedback to the Consultant within two weeks. The Consultant will be expected to review these comments and submit a final copy of this report by August 5th, 2019.
The following table includes important dates for the Baseline Study:
Table 1: Timeline for Baseline Study
Item Deadline
First draft of implementation plan Monday, March 18th, 2019
Final implementation plan with schedule of activities and data collection instruments, tools, and guidelines
Monday, April 1st, 2019
Data Analysis Plan Monday, April 8th, 2019 Data Collection Phase Monday, April 15th – Monday, May 27th, 2019 Conduct desktop review and complete descriptive report
Monday, June 10th, 2019
Complete data analysis Monday, June 24th, 2019 First draft of Baseline Study Report Monday, July 8th, 2019 Final Baseline Study Report Monday, August 5th, 2019
Data Analysis Plan
The Consultant will submit a Data Analysis Plan that clearly describes the sampling strategy to be used for the Baseline Study and which includes an overview of how data will be analyzed. The Consultant will also be expected to summarize the methods followed to determine the sample size needed for the intervention and control groups. This document should be submitted to ASA/WISHH on or before April 8th. The Data Analysis Plan should describe what procedures will be used to analyze quantitative data and how the Baseline Study will integrate qualitative data from KIIs with quantitative data from the population-based household surveys. The Consultant will be expected to conduct a theme analysis on this data using approved qualitative data analysis (QDA) software. Each data collection, analysis, and/or presentation tool, including the specific instruments, needs to be approved by ASA/WISHH prior to the start of data collection. The Consultant will administer population-based survey(s) in intervention and control provinces and utilize propensity score matching (PSM) where appropriate. Control data should be collected from producers, feed millers, and other value chain actors who will not receive services in Year 2. This

CAST Baseline Evaluation Report| 83
will allow the project to utilize a stepwise design for a subset of beneficiaries and compare outcomes both within and between clusters of beneficiaries. The Consultant should provide a list of suggested covariates to be collected during this exercise and conduct a confounder analysis if and where possible.
Baseline Study Report and Baseline Data
The Baseline Study Report, not to exceed 30 pages (not including annexes), should be concise and to the point, utilizing charts, graphs and diagrams where appropriate. The Consultant will be
required to describe methods used for data collection in enough detail so that the results reported are reproducible. This document should make clear linkages between the data collected and analyzed to key findings reported in the results section of the report. As described, the Consultant will be expected to solicit and incorporate feedback from ASA/WISHH before submitting their final report.
The following table displays requirements for the final report:
Table 2: Final Report Requirements
Language ENGLISH Report Length Maximum of 30 pages, excluding the Table of Contents and Annexes
Executive Summary
Include a 2-3 page Executive Summary that provides a brief overview of the study’s purpose, project background, methods, findings, and lessons learned from the study.
Methods • Explain study methodology in detail. • Disclose limitations, especially those associated with the
methodology (e.g. selection bias, recall bias). NOTE: A summary of methodology can be included in the body of the report, with the full description provided as an annex.
General overview and Baseline Study Questions
Provide a general overview and analysis of the current status in the aquaculture sector in the target areas. Provide answers to the research questions.
Findings and baseline data
Present findings and baseline data as analyzed facts, evidence and supported by strong quantitative or qualitative evidence and not anecdotes, hearsay or peoples’ opinions.
Recommendations If available, provide recommendations for the project’s M&E staff on effective data collection and monitoring of the program, lessons learned through the study, best tools and methodologies to be applied.

CAST Baseline Evaluation Report| 84
Annexes Include the following as annexes, at minimum: • Terms of Reference. • Full description of Baseline Study methods. • All Baseline Study tools (e.g., questionnaires, checklists,
discussion guides, surveys). • A l i s t of s o u r c e s of i n f o r m a t i o n ( e.g., key i n f o r m a n t s ,
d o c u m e n t s reviewed, other data sources). • Access to all primary data collected for the Baseline Study. • Performance indicator table with updated baseline data.
Only if applicable, include as an annex Statement(s) of Differences regarding any significant unresolved differences of opinion on the part of funders, implementers, and/or members of the research team.
The Consultant will be expected to provide ASA/WISHH with access to all primary data collected for the Baseline Study. 3.5 Research Team The Consultant must have a team comprised of individuals with strong technical skills, experience in quantitative and qualitative research, study design, data collection and analysis, and technical competence in key project activities. In particular, the lead Consultants(s) will have the following qualifications:
• At least ten years of demonstrated experience conducting baseline studies and/or
evaluations of agricultural development programs (required) and hold a graduate degree in agriculture, monitoring and evaluation, statistics, economics, or other related field (preferred).
• Experience conducting similar studies in Southeast Asia (required) and within Cambodia’s aquaculture industry (preferred).
o Consultants who do not have experience evaluating aquaculture programs in Cambodia are strongly encouraged to sub-contract with a technical expert(s) based in country to collect data for the Baseline Study.
• Experience conducting baseline studies for USDA, United States Agency for International Development (USAID), or other United States Government (USG) projects (required). Preference will be given to those who demonstrate experience with USDA and/or USAID indicators.
• Experience in quantitative data collection, statistics/econometrics such as quasi- experimental design, propensity score matching, regression, design effects, and questionnaire development.
• Experience designing tools for focus group discussions and key informant interviews and facilitating these sessions
• Demonstrable knowledge of participatory methods and commitment to best practices. • Experience and capability in producing survey reports. • Experience in study design and data collection and analysis of quantitative and
qualitative data and supervisory capabilities of each of these areas.

CAST Baseline Evaluation Report| 85
• Fluent in written and spoken English; proficient in written and spoken Khmer (preferred).
The assessment will be independent and conducted by a third party. Specifically the regulations specify that the third party conducting the assessment:
• Is financially and legally separate from the participant’s organization; • Has staff with demonstrated knowledge, analytical capability, language skills and
experience in conducting assessments of development programs involving agriculture, education, and nutrition;
• Uses acceptable analytical frameworks such as comparison with non-project areas, surveys, involvement of stakeholders in the assessment, and statistical analyses
• Uses local consultants, as appropriate, to conduct portions of the assessment; and, • Provides a detailed outline of the evaluation, major tasks, and specific schedules prior
to initiating the evaluation. The Consultant is expected to:
• Develop a comprehensive study and data collection methodology (e.g., sample size and sampling methods).
• Conduct/coordinate and supervise quantitative and qualitative data collection. • Communicate directly and frequently with ASA/WISHH staff (e.g., weekly updates,
monthly progress reports) and invite stakeholders to participate in KIIs. • Conduct data analysis and generate summary of findings. • Draft the final report.
ASA/WISHH staff and implementing partners will be available to answer technical questions about program structure and implementation, and to provide guidance/advice on logistics, meeting arrangements, and other matters.
Attachment A: Proposal Guidelines and Selection Criteria
The candidate shall submit a full proposal to ASA/WISHH via an electronic submission to James Bernhardt at [email protected] (cc: [email protected]) no later than Monday,
February 11th, 2019 at 5pm CST with the following:
• Curriculum Vitae(s) of the lead consultant and assistants. • References of similar work conducted by the applicant and recommendations if
available. • A technical proposal not to exceed 10 pages (not including annexes) that includes a
clear description of the study’s objectives and demonstrating a good understanding of the scope of work, the methodology, and a plan for data collection and analysis.
o The methodology should include a detailed data collection plan, describing the data collection technique(s) to be used, related data collection sources, and a rationale for reasons the data collection was chosen.
• A line item budget including staff, travel, equipment, supplies, and professional
CAST Baseline Evaluation Report| 86
services, if applicable. • A detailed work plan showing the resources needed, the time anticipated, and
the outcomes/deliverables to be reached that includes a timeline of deliverables.

CAST Baseline Evaluation Report| 87
Proposals and associated documents must be submitted in English.
The following criteria will be used to review and score candidate proposals:
Table 3: Criteria for Scoring Proposals
Criteria Scoring (out of 100)
Soundness of proposed methodology 40 points Skills and Past Experience 30 points Past aquaculture experience in Cambodia 10 points Quality control methods 10 points Financial Competitiveness 10 points Total: 100 points

CAST Baseline Evaluation Report| 88
Attachment B: Abbreviated Version of PMP with Standard Indicators
Table 4: Overview of Standard Indicators
Indicator
Number
Performance
Indicator
Indicator Definition and Unit
of Measurement
Data Source Method/Approach of
Data Collection or
Calculation 1 Standard #10:
Number of individuals who have received USDA-supported degree-granting non-nutrition- related food security trainings
Definition: This indicator measures the number of people who are currently enrolled in or have graduated during the reporting year from a degree- granting technical, vocational, associate, bachelor, master, or Ph.D. program.
Disaggregate by sex (i.e., Male, Female) and duration (i.e., New, Continuing)
Unit of measurement: Number of individuals
Course registration and completion records
Attendance sheets and activity reports
List of training topics covered under each activity (e.g., agronomy, plant pathology, anthropology)
Data to be captured electronically when possible
Verification task to be performed at the end of each fiscal year
Routine monitoring activities
Baseline is zero
2 Standard #12: Number of organizations with increased performance with USDA assistance
Definition: This indicator measures whether USDA-funded capacity development efforts have led to improved organizational performance in organizations receiving organizational performance improvement support.
Disaggregate by type of organization: • Research and educational • Private sector firms • Producer associations • Extension organizations • Government agencies • Non-governmental and not-for- profit organizations • Women's groups • Trade and business associations • Water users associations • Other
Unit of measurement: Number of organizations
Adapted version of the Organizational Performance Index (OPI), balanced scorecard, or similar
List of organizations receiving organizational performance improvement support
Documented plans to assess outputs and outcomes and measure performance gaps
Data will be collected electronically from organizations that received training during Years 2, 3, and 4 of the project
Verification task to be performed at the end of each fiscal year
Routine monitoring activities
Baseline is zero

CAST Baseline Evaluation Report| 89
3 Standard #9: Number of technologies, practices, and approaches under various phases of
Definition: This indicator tracks the progression of new or significantly improved technologies, practices, and approaches through research and development (R&D) to the
List of technologies, practices, and approaches
Monthly or
Documentation of R&D strategies and phase of research
Verification task to be performed at the end of
research, development, and uptakes as a result of USDA assistance
demonstrated uptake by public or private sector stakeholders.
Disaggregate by category of research: • Plant and Animal Improvement Research • Production Systems Research • Social Science Research Within each category disaggregate by phase of development: • Under research as a result of USDA assistance • Under field testing as a result of USDA assistance • Made available for uptake as a result of USDA assistance • Demonstrated uptake by the public and/or private sector with USDA assistance
quarterly progress reports
Beneficiary records
each fiscal year
Routine monitoring activities
Baseline is zero
Unit of measurement: Number of technologies, practices, and approaches
5 Standard #13: Number of public- private partnerships formed as a result of USDA assistance
Definition: The number of public- private partnerships in agriculture or nutrition formed during the reporting year due to USDA intervention (i.e., agricultural or nutrition activity, as described below). See USDA's indicator handbook for further information.
Disaggregation by type of partnership (refer to the primary focus of the partnership if applicable): • Agricultural production • Agricultural post-harvest transformation • Nutrition • Multi-focus (use this if there are several components of the above sectors in the partnership) • Other (do not use this for multi- focus partnerships)
Beneficiaries to be provided with a mechanism to report any new private-public partnerships
Clear agreement and/or documentation of cash or in- kind contribution
Self-reported by beneficiaries
Verification task to be performed at the end of each quarter
Data to be captured electronically when possible
Baseline is zero

CAST Baseline Evaluation Report| 90
Unit of measurement: Number of partnerships
6 Standard #21: Number of individuals who have received short-term agricultural sector
Definition: The number of individuals to whom significant knowledge or skills have been imparted through interactions that are intentional, structured, and purposed for imparting
Attendance sheets or other to be completed for all trainings and capacity
Attendees to sign in before the training or other capacity building activity begins
Data to be captured
productivity or food security training as a result of USDA assistance
knowledge or skills should be counted as received training, through formal or informal means
Disaggregations by gender (i.e., male/female) and new/continuing are required and disaggregation by type of individual to be included if applicable. See USDA's indicator handbook for further information.
building activities
Check list of topics covered during these exercises to be completed by facilitators
electronically when possible
Verification task to be performed at the end of each quarter
Baseline is zero
Unit of measurement: Number of individuals
7 Standard #2: Number of hectares under improved management practices or technologies that promote improved climate risk reduction and/or natural resources management with USDA assistance
Definition: This indicator measures the area in hectares where USDA-promoted management practices or improved technologies that reduce climate risk and improve land, marine, and other natural resources management were applied during the reporting year to areas managed or cultivated by producers participating in a USDA-funded activity.
Beneficiary records and output for Standard #3
Monthly or quarterly site visits and/or phone calls
Baseline is the area under improved management practices and technologies that support improved climate risk reduction and/or natural resources management before October 2019
Routine monitoring activities
No disaggregation is required.
Unit of measurement: Number of hectares
8 Standard #3: Number of hectares under improved management practices or technologies with USDA assistance
Definition: This indicator measures the area in hectares where USDA-promoted management practices or improved technologies were applied during the reporting year to areas managed or cultivated by producers participating in a USDA-funded activity.
Beneficiary records and output for Standard #4
Monthly or quarterly site visits and/or phone calls
Baseline is the area under improved management practices and technologies before October 2019
Routine monitoring activities
No disaggregation is required.
Unit of measurement: Number of hectares

CAST Baseline Evaluation Report| 91
10 Standard #4: Number of individuals in the agriculture system who have applied improved management practices or technologies with USDA assistance
Definition: This indicator measures the total number of agriculture system actors participating in USDA-funded activities who have applied improved management practices and/or technologies promoted by USDA anywhere within the food and agriculture system during the reporting year.
Beneficiary records and output for Standard #21
Monthly or quarterly site visits and/or phone calls
Data
Baseline is the number of beneficiaries applying improved management or technologies at the start of the activity
Site vistis to speak with beneficiaries about improved management practices and technologies applied
Disaggregate by value chain actor type (e.g., smallholder producers, people in government, other), sex (i.e., male, female), age (i.e., 15- 29, 30+), management practice or technology type (e.g., crop genetics, cultural practices, livestock management), and commodity (i.e., type of crop, type of animal or animal product, or type of fish - freshwater or marine).
Unit of measurement: Number of individuals
verification task to occur bi-annually
Data to be captured electronically when possible
11 Standard #22: Number of individuals participating in USDA food security programs
Definition: This is an output indicator measuring the number of individuals directly participating in USDA‐funded interventions, including those we reach directly, those reached as part of a deliberate service strategy, and those participating in the markets we strengthen. See USDA's indicator handbook for further information.
Disaggregate by sex (i.e., male/female), age category (i.e., 15-29, 30+), and type of individual (e.g., people in government, people in civil society, producers). Double- counting is not allowed for sex or age category but is allowed for type of individual. See USDA's indicator handbook for further information.
Unit of measurement: Number of individuals
Program records such as attendance sheets
ODK Collect and project database
Number of direct beneficiaries to be calculated following migration and cleaning of other activity specific data
Cross tabulation of select activity level output indicators
Baseline is zero

CAST Baseline Evaluation Report| 92
12 Standard #23: Number of individuals benefiting indirectly as a result of USDA assistance
Definition: This is an output indicator measuring the number of individuals indirectly benefitting from USDA-funded interventions. The individuals will not be directly engaged with a project activity or come into direct contact with a set of interventions (goods or services) provided by the project. See USDA's indicator handbook for further information.
No disaggregation is required.
Unit of measurement: Number of
Activity specific records and output for Standard #22
ODK Collect and project database
Monthly or quarterly site visits and/or phone calls
Self-reported by beneficiaries
Number of indirect beneficiaries to be calculated following the verification of data described for Standard #22
Routine monitoring activities
Baseline is zero
individuals
13 Standard #1: Yield of targeted agricultural commodities among program participants with USDA assistance
Definition: Yield is a measure of the total output of production of an agricultural commodity (crop, fish, milk, eggs, live animal offtake) divided by the total number of units in production (hectares planted of crops, area in hectares for pond aquaculture, cubic meters of cage for cage aquaculture, maximum number of animals in the herd/flock during the reporting year for live animals, maximum number of producing cows or hens during the reporting year for dairy or eggs). Yield per hectare, per animal and per cubic meter of cage is a measure of productivity from that farm, fisheries, or livestock activity from USDA- assisted producers.
Subset of target population to be surveyed during the baseline evaluation
Records of sales shared by farms and firms
Results of value chain assessment
Self-reported by beneficiaries
Baseline data to reflect the yield of targeted commodities in the year prior to programming
For aquaculture, disaggregate by commodity (i.e., type of fish - freshwater or marine), sex (i.e., Male, Female), and age (i.e., 15- 29, 30+)
Unit of measurement: • Total production (TP) for pond and cage aquaculture: kilograms (kg) • Total units of production (UP) for pond aquaculture: hectare of surface area • Total units of production (UP) for cage aquaculture: cubic meter of cage

CAST Baseline Evaluation Report| 93
14 Standard #18: Value of annual sales of farms and firms receiving USDA assistance
Definition: This indicator measures the value in U.S. dollars of the total amount of sales of products and services by USDA- assisted farms and firms during the reporting year within USDA- supported agricultural commodity value chains or markets. See USDA's indicator handbook for further information.
Disaggregate by type of product or service (e.g., agricultural commodities, post-harvest storage and processing equipment, business services, production support services), type of
Beneficiaries who reported volume of commodities (metric tons) sold during the baseline evaluation
Records of sales shared by farms and firms
Results of value chain assessment
Self-reported by beneficiaries
To utilize baseline data collected for Standard #19
Self-reported and to be verified in October of 2020, 2021, and 2022
Routine monitoring activities
producer/firm (e.g., producer - smallholder, firm - microenterprise, firm - large enterprise or corporation), sex of producer or proprietor(s) (i.e., male, female, mixed), and age (i.e., 15-29, 30+, mixed). See USDA's indicator handbook for further information.
Unit of measurement: U.S. Dollar
Beneficiary records and output for Standard #1
15 Standard #19: Volume of commodities (metric tons) sold by farms and firms receiving USDA assistance
Definition: This indicator will collect the volume (as calculated in gross metric tons (MT)) of sales of targeted commodities by farms and firms receiving USDA assistance. This includes the volume of all sales of targeted commodity(ies), not just the volume of farm-gate sales.
Disaggregate by commodity type (i.e., type of crop, type of animal or animal product, type of fish - freshwater or marine). The overall "horticulture" commodity disaggregate can be used if desired.
Subset of target population to be surveyed during the baseline evaluation
Records of sales shared by farms and firms
Results of value chain assessment
Baseline survey to be administered during Year 1 of the project and to capture volume of agricultural commodities reported
Routine monitoring activities
Unit of measurement: Metric Tons
Beneficiary records and output for Standard #18
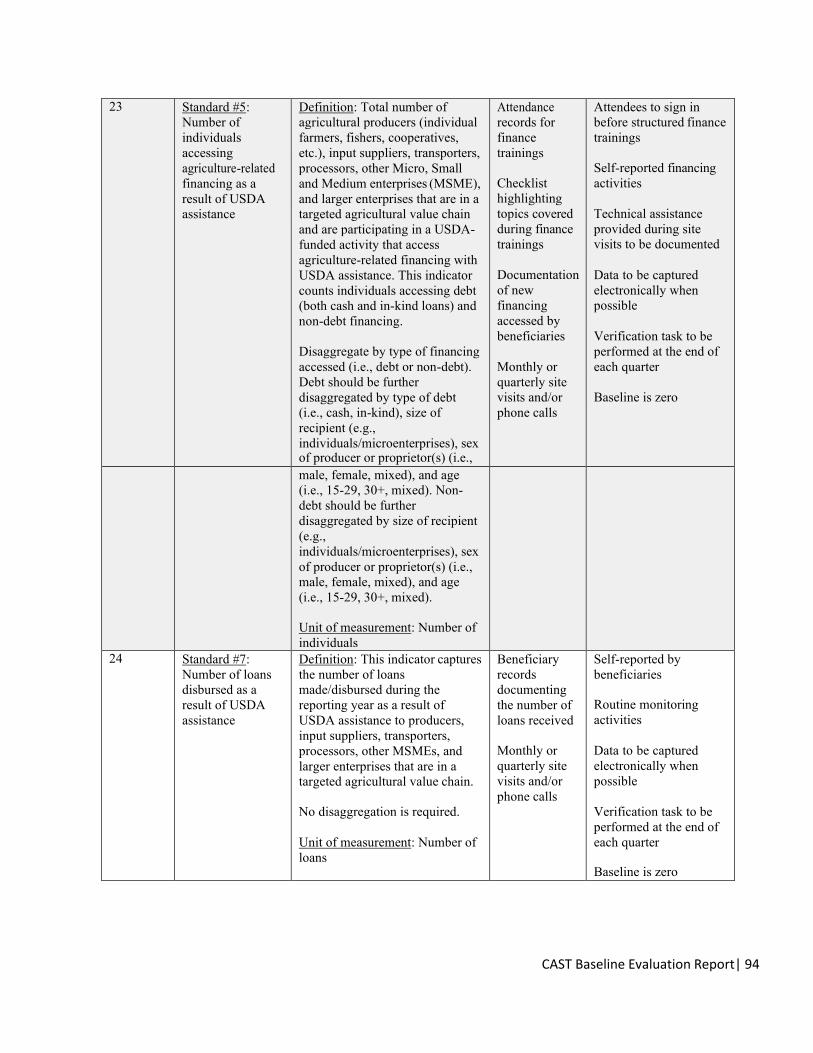
CAST Baseline Evaluation Report| 94
23 Standard #5: Number of individuals accessing agriculture-related financing as a result of USDA assistance
Definition: Total number of agricultural producers (individual farmers, fishers, cooperatives, etc.), input suppliers, transporters, processors, other Micro, Small and Medium enterprises (MSME), and larger enterprises that are in a targeted agricultural value chain and are participating in a USDA- funded activity that access agriculture-related financing with USDA assistance. This indicator counts individuals accessing debt (both cash and in-kind loans) and non-debt financing.
Disaggregate by type of financing accessed (i.e., debt or non-debt). Debt should be further disaggregated by type of debt (i.e., cash, in-kind), size of recipient (e.g., individuals/microenterprises), sex of producer or proprietor(s) (i.e.,
Attendance records for finance trainings
Checklist highlighting topics covered during finance trainings
Documentation of new financing accessed by beneficiaries
Monthly or quarterly site visits and/or phone calls
Attendees to sign in before structured finance trainings
Self-reported financing activities
Technical assistance provided during site visits to be documented
Data to be captured electronically when possible
Verification task to be performed at the end of each quarter
Baseline is zero
male, female, mixed), and age (i.e., 15-29, 30+, mixed). Non- debt should be further disaggregated by size of recipient (e.g., individuals/microenterprises), sex of producer or proprietor(s) (i.e., male, female, mixed), and age (i.e., 15-29, 30+, mixed).
Unit of measurement: Number of individuals
24 Standard #7: Number of loans disbursed as a result of USDA assistance
Definition: This indicator captures the number of loans made/disbursed during the reporting year as a result of USDA assistance to producers, input suppliers, transporters, processors, other MSMEs, and larger enterprises that are in a targeted agricultural value chain.
No disaggregation is required.
Unit of measurement: Number of loans
Beneficiary records documenting the number of loans received
Monthly or quarterly site visits and/or phone calls
Self-reported by beneficiaries
Routine monitoring activities
Data to be captured electronically when possible
Verification task to be performed at the end of each quarter
Baseline is zero

CAST Baseline Evaluation Report| 95
25 Standard #8: Value of agriculture-related financing accessed as a result of USDA assistance
Definition: This indicator sums the total U.S. dollar value of debt (both cash and in-kind loans) and non-debt financing, such as equity financing, disbursed during the reporting year as a result of USDA- assistance to producers (individual farmers, fishers, cooperatives, etc.), input suppliers, transporters, processors, other MSMEs, and larger enterprises that are in a targeted agricultural value chain. The indicator counts the value of non- debt financing and both cash and non-cash lending disbursed to the participant, not financing merely committed (e.g., loans in process, but not yet available to the participant). See USDA's indicator handbook for further information.
Disaggregate by type of financing accessed (i.e., debt or non-debt). Debt should be further disaggregated by type of debt (i.e., cash, in-kind), size of recipient (e.g.,
Beneficiary records documenting the amount of loans received
Monthly or quarterly site visits and/or phone calls
Self-reported by beneficiaries
Routine monitoring activities
Data to be captured electronically when possible
Verification task to be performed at the end of each quarter
Baseline is zero
individuals/microenterprises), sex of producer or proprietor(s) (i.e., male, female, mixed), and age (i.e., 15-29, 30+, mixed). Non- debt should be further disaggregated by size of recipient (e.g., individuals/microenterprises), sex of producer or proprietor(s) (i.e., male, female, mixed), and age (i.e., 15-29, 30+, mixed).
Unit of measurement: U.S. Dollar

CAST Baseline Evaluation Report| 96
27 Standard #17: Number of policies, regulations and/or administrative procedures in each of the following stages of development as a result of USDA assistance
Definition: Number of agricultural enabling environment policies/regulations/administrative procedures in the areas of agricultural resource, food, market standards & regulation, public investment, natural resource or water management, and climate change adaptation/mitigation as it relates to agriculture. See USDA's indicator handbook for further information.
Disaggegation by stage (i.e., 1-5, other) is required.
Unit of measurement: Number of policies, regulations, and/or administrative procedures and supplementary narrative(s)
Policies, regulations, and administrative procedures enacted to be captured in a questionnaire
Quantitative and qualitative items to determine stage of progress
Document the implementation of a new policy, regulation, or administartive procedure
Interview key informants with specialized knowledge about this topic
Baseline is zero
29 Standard #14: Value of new USG commitments and new public and private sector investment leveraged by USDA to support food security and nutrition
Definition: Investment is defined as any use of public or private sector resources intended to increase future production output or income, to improve the sustainable use of agricultural- related natural resources (soil, water, etc.), or to improve water or land management anywhere along the food, feed and fiber system and natural resources management.
Disaggregation by type of investment (i.e., host government, other public sector, private, new USG commitment) is required.
Unit of measurement: U.S. Dollar
Beneficiary records
Clear agreement and/or documentation of cash or in- kind contribution
Self-reported by beneficiaries
Verification task to be performed at the end of each quarter
Baseline is zero
30 Standard #11: Number of host government or
Definition: The indicator tracks the performance of activities working with national
Documentation of plans to identify risks
Routine monitoring activities

CAST Baseline Evaluation Report| 97
community- derived risk management plans formally proposed, adopted, implemented or institutionalized with USDA assistance
governments, regional and/or local governments and/or communities to develop, implement, and institutionalize risk management plans.
Disaggregate by type (i.e., Government, Community) and phase of development (i.e., Proposed, Adopted, Implemented, Institutionalized)
Unit of measurement: Number of risk management plans
and their likelihood of occurrence
Beneficiary records
Checklist highlighting steps taken to develop, implement, and institutionalize risk management plans
Data to be captured electronically when possible
Verification task to be performed at the end of each fiscal year
Baseline is zero

CAST Baseline Evaluation Report| 98
Attachment C: Abbreviated Version of IPTT with Custom Indicators
Table #5: Overview of Custom Indicators
Indicator
Number
Performance Indicator
4 Custom #1: Number of private enterprises, producers organizations, water user associations, women’s groups, trade and business associations, and community-based organizations (CBOs) who received short- term agricultural sector productivity, food security or other training as a result of USDA assistance
9 Custom #2: Area of ponds (cubic meters) under improved management practices or techniques with USDA assistance
16 Custom #3: Number of hatcheries or feed mills providing seed or feed that meets international quality standards
17 Custom #4: Number of beneficiaries who subscribe to receive market information about price and availability of aquaculture products
18 Custom #5: Number of market actors selling fish who are compliant with national SPS standards or are using an independent quality seal
19 Custom #6: Number of farms that increased the number, size, or amount of ponds, cages, or equipment with USDA assistance
20 Custom #7: Number of value chain actors with increased capacity and utilization of cold chain assets 21 Custom #8: Number of production contracts created between wholesalers and aquaculture producers 22 Custom #9: Number of individuals who visited the CE SAIN research technology parks in Battambang
and Kampong Thom 26 Custom #10: Number of wholesalers who report an increase in volume or improvement in quality of
specific fish varieties available in the aquaculture value chain 28 Custom #11: Number of business plans developed that include marketing and distribution strategies

CAST Baseline Evaluation Report| 99
Attachment D: Project-Level Results Framework(s)
Figure 1: USDA Results Framework with CAST Activities (SO1)
Figure 2: USDA results framework with CAST activities (SO2)

CAST Baseline Evaluation Report| 100
Attachment E: Project Implementation Map
The map below shows the geographic area in Cambodia to be covered by the program. The program will be focusing on specific geographic areas. The provinces targeted by the program include: Siem Reap, Battambang, Pursat, Kampong Thom, Kampong Cham, Kandal, and Phnom Penh.
Figure 3: Map of CAST-targeted geographies

CAST Baseline Evaluation Report| 101
ANNEX B: SAMPLING FRAMEWORK
Sampling Methodology
The sampling methodology comprises three main stages:
1) sampling proposal;
2) sampling finalization;
3) sample selection.
As a result, a target sample size of 1,422 respondents in nine categories – aquaculture farmer, feed mill, hatchery, nursery, aquaculture fish processor, wholesaler, financial institution, collector, and feed distributor – was determined (Table A). A random selection method is used to select respondents in the aquaculture farmer category, whereas a purposive selection is employed to select respondents in the other eight categories. Details of the sampling methodology are subsequently discussed as follows.
Table A: Summary of target sample size by category and location
Nº Location
Aquaculture farmer Other value chain actors
All
(I +
II)
Trea
tmen
t
Con
trol
Tota
l (I)
Feed
mills
Hat
cher
ies
Nur
serie
s
Proc
esso
rs
Who
lesa
lers
Col
lect
ors
Feed
di
strib
utor
s
Fina
ncia
l in
stitu
tions
Tota
l (II)
1 Battambang 97 0 97 0 9 2 4 3 3 3 3 27 124
2 Kampong Cham 138 0 138 1 0 1 2 3 3 3 3 16 154
3 Kampong Thom 95 0 95 0 3 1 7 3 5 3 3 25 120
4 Kandal 77 0 77 1 3 2 2 2 6 3 3 22 99
5 Pursat 260 0 260 0 5 0 3 3 5 3 3 22 282
6 Siem Reap 152 0 152 0 6 1 5 3 3 3 3 24 176
7 Phnom Penh 75 0 75 8 0 3 2 4 5 3 3 28 103
8 Banteay Meanchey 0 34 34 0 0 0 2 2 4 3 3 14 48
9 Kampong Chhnang 0 126 126 0 2 0 4 4 6 3 3 22 148
10 Takeo 0 140 140 0 12 0 2 3 5 3 3 28 168
Total 894 300 1,194 10 40 10 33 30 45 30 30 228 1,422

CAST Baseline Evaluation Report| 102
Sampling proposal
To allow for an impact evaluation of the project, both treatment and control groups have been proposed. Sample sizes of these two groups and their locations at provincial level have been proposed and discussed at the pre-inception phase of this study, i.e. during the proposal bidding stage. There are seven locations for the treatment group, including Phnom Penh, Kandal, Kampong Cham, Pursat, Battambang, Kampong Thom, and Siem Reap; and three locations for the control group, comprising Takeo, Kampong Chhnang and Banteay Meanchey. Kampong Chhnang has been selected to capture aquaculture production using cage technology, whereas Takeo and Banteay Meanchey are to represent pond technology.
Based on the sample size calculating formula56, with a margin of error of 3% and a confidence interval of 95%, the population of aquaculture farmers that the study team received at that time was used to determine the target sample size for aquaculture farmers.
For the treatment group, the sample size of 894 aquaculture farmers was determined, given a population of 5,500 aquaculture farmers. For the control group, the sample size was determined at 260 aquaculture farmers (Table B).
Table B: List of population of aquaculture farmers by provinces
Nº Location Proposed Sample (Initial)
Treatment group 894 1. Battambang 54 2. Kampong Cham 138 3. Kampong Thom 124 4. Kandal 243 5. Pursat 51 6. Siem Reap 71 7. Phnom Penh 213
Control group 260 8. Banteay Meanchey 122 9. Kampong Chhnang 103 10. Takeo 35
Total 1,154
For other value chain actors of the aquaculture sector, which are composed of eight categories, several assumptions were made to determine their sample sizes, as explained in Table C. These assumptions were mainly based on the experience of experts in the study team, particularly the World Fish team, who have extensive knowledge of the aquaculture sector in Cambodia. The number of respondents for these eight categories has been proposed to be 228 people.
56 Formula calculating sample size:
n =
z2r(1 − r)e2
1 +z2r(1 − r)
e2N
Where, n = Sample size; z = z-score (following the normal distribution); N = Population size; r = Response distribution, assumed at 50%.

CAST Baseline Evaluation Report| 103
Table C: List of proposed target sample in other sample categories (purposive selection)
Sample group Number of respondents
Total Notes
Treatment Control 1. Feed mill (Not applicable) 10 1 aquaculture feed mill, 9 animal feed mills 2. Hatchery 26 14 40 Hatcheries producing at least 100,000 fingerlings
per year 3. Nursery (Not applicable) 10 ▪ Nursing (short period) or trading fish fingerlings.
Most of them are importing fingerlings from Vietnam
▪ Treatment and control will be assigned after validation of “active” nurseries
4. Aquaculture fish processor
25 8 33 ▪ Fish processor sourcing at least 20% of their raw material from Cambodian aquaculture farms. Some can have a wholesaler’s activities but will be considered as Fish processors for the survey.
5. Wholesaler 21 9 30 ▪ Buying and selling fish and sourcing at least 20% of their material from aquaculture farms in Cambodia. They can purchase directly at the farm or from collectors. Their trade volume per transaction is larger than that of Collectors and transportation is by truck or car.
▪ Top three per province in volume, with a selection criteria: 20 % of their trade volume are sourced from aquaculture
6. Financial institution
21 9 30 3 per province
7. Collector 30 15 45 ▪ Buying and selling fish directly at the farm. Re-selling directly to retailers, wholesalers or processors. Their trade volume per transaction is limited (<1 ton) and transportation is by motorbike and rarely by car.
▪ 5 collectors operating in the clusters of producer surveyed. No collector in Phnom Penh, due to proximity to markets
8. Feed distributor
21 9 30 3 per province
Total Sample 148* 63* 228 Note: *Excluding feed mill and nursery categories.

CAST Baseline Evaluation Report| 104
Sampling finalization
A listing process was implemented to collect information of respondents in the nine categories proposed above. As a result, 1,209 potential respondents in the aquaculture farmer category and 406 respondents in the other categories, except for financial institutions, have been listed as summarized in Table D. The aquaculture farmers have been selected for the following criteria: pond area above 200m2 or cage volume above 30m3 and marketing more than 80% of their production. Two criteria were additionally applied in the listing to capture more commercial-scale aquaculture farmers with pond size of 300m2 or above, and with cage volume of 40m3 or above. Those farmers are considered as more “commercial” and to be a priority target for the project, and were included in the sampling framework.
Table D: Listing resulting by location and sample category
Nº Location
Aqu
acul
ture
Fa
rmer
Feed
mill
Hat
cher
y
Nur
sery
Proc
esso
r
Who
lesa
ler
Col
lect
or
Feed
di
strib
utor
All
1 Battambang 130 0 9 5 10 5 5 11 175 2 Kampong Cham 188 1 0 2 5 8 4 7 215 3 Kampong Thom 129 0 3 1 17 4 8 10 172 4 Kandal 118 1 3 2 4 2 9 4 143 5 Pursat 337 0 5 0 8 8 7 10 375 6 Siem Reap 205 0 6 2 12 21 4 10 260 7 Phnom Penh 102 8 0 4 5 17 8 4 148 8 Banteay
Meanchey 46 0 0 0 5 4 6 4 65
9 Kampong Chhnang
535 0 2 0 17 27 10 5 596
10 Takeo 218 0 12 0 9 8 9 9 265 Total 2,008 10 40 16 92 104 70 74 2,414
Source: Listing activity performed by World Fish team in March-April 2019.
Aquaculture farmer, treatment group. Using the listing results, the proposed sample size at the provincial level has been adjusted accordingly, especially for the aquaculture farmer category (Table E). At this stage, a non-response rate of 30%57 has been taken into the calculation process. This means that achieving a sample target of 894 respondents in the treatment group would require reaching 1,277 potential respondents in the survey. Since this number exceeds the listed number of 1,209, all the listed respondents will be approached for interviews. These respondents are distributed into 200 villages of 117 communes in 39 districts of seven provinces.
57 This is based on experience of previous survey projects that Nuppun team has implemented.
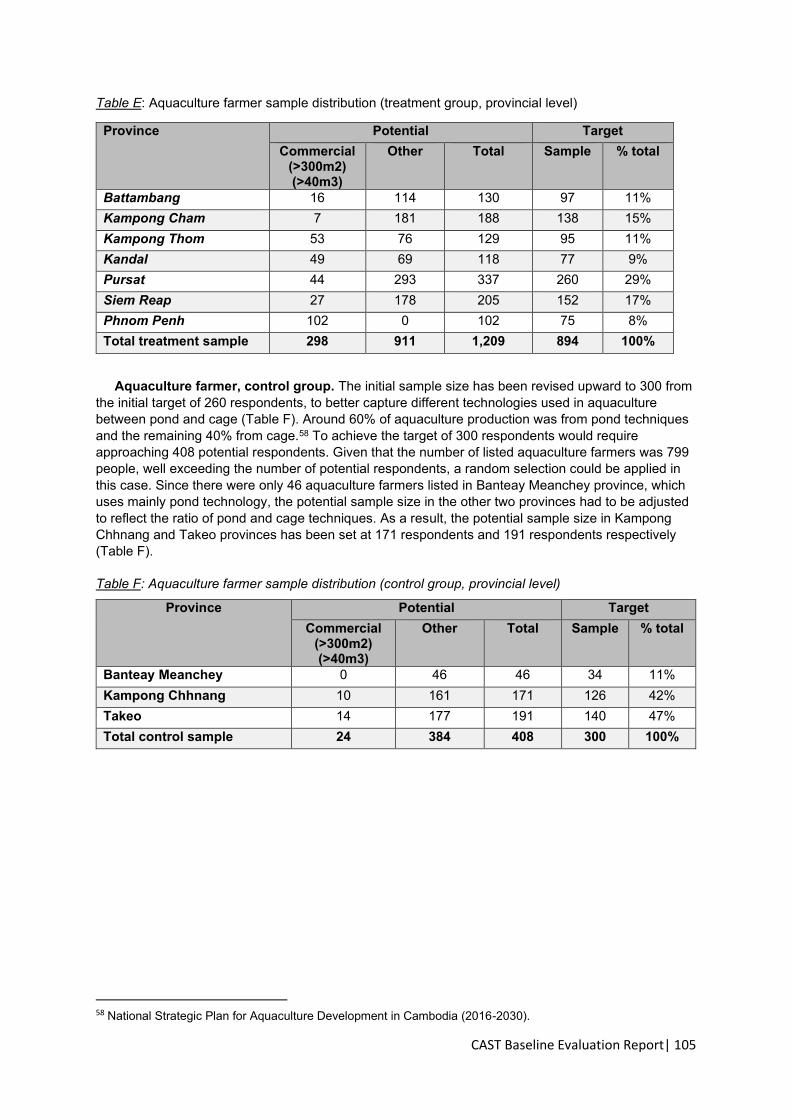
CAST Baseline Evaluation Report| 105
Table E: Aquaculture farmer sample distribution (treatment group, provincial level)
Province Potential Target Commercial
(>300m2) (>40m3)
Other Total Sample % total
Battambang 16 114 130 97 11% Kampong Cham 7 181 188 138 15% Kampong Thom 53 76 129 95 11% Kandal 49 69 118 77 9% Pursat 44 293 337 260 29% Siem Reap 27 178 205 152 17% Phnom Penh 102 0 102 75 8% Total treatment sample 298 911 1,209 894 100%
Aquaculture farmer, control group. The initial sample size has been revised upward to 300 from the initial target of 260 respondents, to better capture different technologies used in aquaculture between pond and cage (Table F). Around 60% of aquaculture production was from pond techniques and the remaining 40% from cage.58 To achieve the target of 300 respondents would require approaching 408 potential respondents. Given that the number of listed aquaculture farmers was 799 people, well exceeding the number of potential respondents, a random selection could be applied in this case. Since there were only 46 aquaculture farmers listed in Banteay Meanchey province, which uses mainly pond technology, the potential sample size in the other two provinces had to be adjusted to reflect the ratio of pond and cage techniques. As a result, the potential sample size in Kampong Chhnang and Takeo provinces has been set at 171 respondents and 191 respondents respectively (Table F).
Table F: Aquaculture farmer sample distribution (control group, provincial level)
Province Potential Target Commercial
(>300m2) (>40m3)
Other Total Sample % total
Banteay Meanchey 0 46 46 34 11% Kampong Chhnang 10 161 171 126 42% Takeo 14 177 191 140 47% Total control sample 24 384 408 300 100%
58 National Strategic Plan for Aquaculture Development in Cambodia (2016-2030).

CAST Baseline Evaluation Report| 106
Additional Tables
Table G: Aquaculture farmer sample distribution (treatment group, district level)
Province/District Potential Target Battambang 130 97
Aek Phnum 55 41 Bavel 7 5 Moung Ruessei 13 10 Sangkae 23 17 Thma Koul 32 24
Kampong Cham 188 138 Batheay 52 38 Cheung Prey 45 33 Kampong Siem 48 35 Kang Meas 31 23 Prey Chhor 12 9
Kampong Thom 129 95 Baray 6 4 Kampong Svay 8 6 Santuk 6 4 Stoung 13 10 Stueng Sen 29 21 Stuong 67 50
Kandal 104 77 Kaoh Thum 4 3 Kien Svay 16 12 Leuk Daek 25 18 Mukh Kampul 23 17 Popnhea Lueu 36 27
Pursat 351 260 S'ang 14 10 Bakan 156 115 Kandieng 44 33 Krakor 116 86 Krong Pursat 21 16
Siem Reap 205 152 Chi Kraeng 30 22 Kra Lanh 21 16 Krong Siem Reap 28 21 Pork 6 4 Prasat Bakong 2 2 Puk 29 21 Soutr Nikom 89 66
Phnom Penh 102 75 chbar Ampov 6 4 Chroy Chnagva 3 2 Mean Chey 5 4 Prek Phnov 65 48 Reu Sey Kao 22 16 Sen Sok 1 1
Total treatment sample 1,209 894

CAST Baseline Evaluation Report| 107
Table H: Aquaculture farmer sample distribution (control group, district level)
District Potential Target Banteay Meanchey 46 34
Krong Serei Saophoan 8 6 Malai 3 2 Mongkol Borei 17 13 Ou Chrov 11 8 Preah Netr Preah 2 1 Thma Puok 5 4
Kampong Chhnang 171 126 Baribour 44 32 Chol Kiri 15 11 Kampong Leaeng 28 21 Kampong Tralach 50 37 Krong Kampong Chhnang 17 13 Rolea B'ier 6 4 Sameakki Mean Chey 6 4 Tuek Phos 5 4
Takeo 191 140 Angkor Borei 9 7 Bati 46 33 Kiri Vong 9 7 Koh Andet 7 5 Krong Doun Kaev 4 3 Samraong 36 26 Tram Kak 79 58 Tram Kak 1 1
Total 408 300

CAST Baseline Evaluation Report| 108
Table I: Aquaculture farmer sample distribution (treatment group, commune level, potential)
District/Commune Battambang Kampong Cham
Kampong Thom
Kandal Pursat Siem Reap
Phnom Penh
Total
Aek Phnum 55
55 Kaoh Chiveang 21
21
Peam Aek 6
6 Prey Chas 28
28
Bavel 7
7 Bavel 2
2
Khnach Romeas 2
2 Prey Khpos 3
3
Moung Ruessei 13
13 Chrey 2
2
Kear 3
3 Robas Mongkol 7
7
Ta Loas 1
1 Sangkae 23
23
Kampong Pring 16
16 Norea 6
6
Ou Dambang Muoy
1
1
Thma Koul 32
32 Anlong Run 8
8
Bansay Traeng 9
9 Chrouy Sdau 1
1
Ou Ta Ki 1
1 Ta Meun 13
13
Batheay
52
52 Chbar Ampov
11
11
Chea Lea
6
6 Tang Krang
35
35
Cheung Prey
45
45 Prey Char
6
6
Sdaeung Chey
4
4 Soutip
35
35
Kampong Siem
48
48 Kien Chrey
48
48
Kang Meas
31
31 Preaek Koy
11
11
Preaek Krabau
11
11 Sdau
9
9
Prey Chhor
12
12 Boeng Nay
3
3
Chrey Vien
5
5 Prey Chhor
4
4
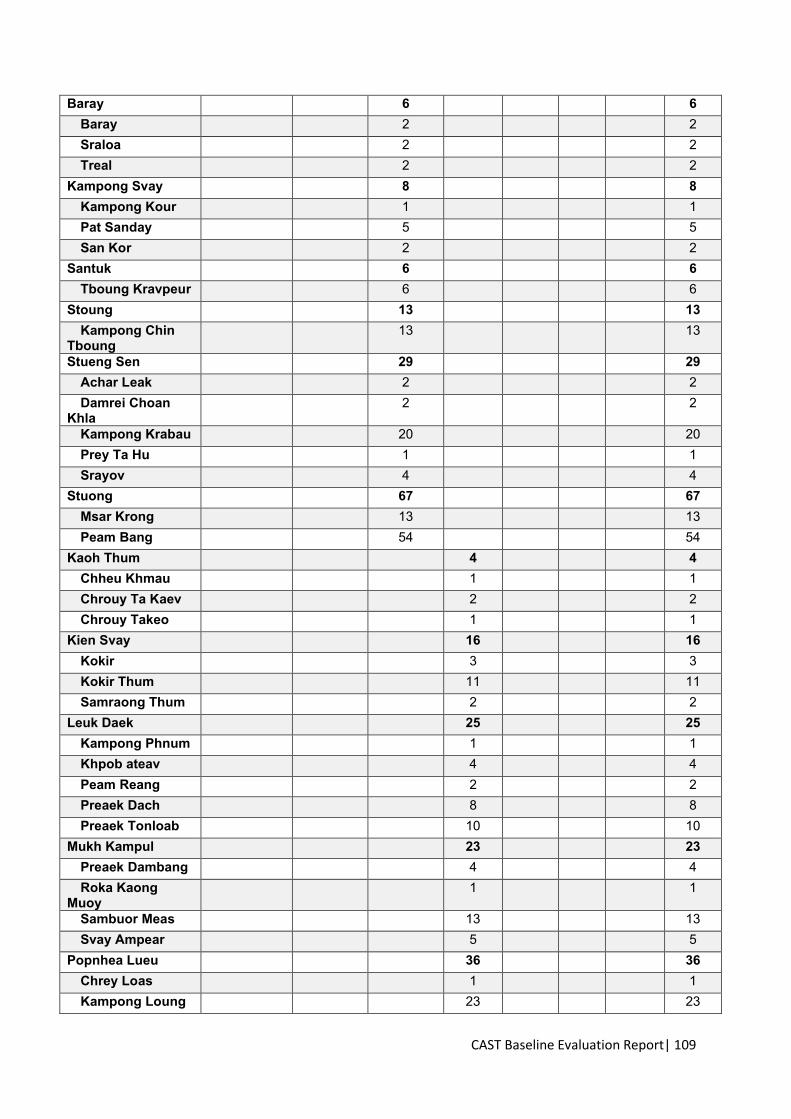
CAST Baseline Evaluation Report| 109
Baray
6
6 Baray
2
2
Sraloa
2
2 Treal
2
2
Kampong Svay
8
8 Kampong Kour
1
1
Pat Sanday
5
5 San Kor
2
2
Santuk
6
6 Tboung Kravpeur
6
6
Stoung
13
13 Kampong Chin
Tboung
13
13
Stueng Sen
29
29 Achar Leak
2
2
Damrei Choan Khla
2
2
Kampong Krabau
20
20 Prey Ta Hu
1
1
Srayov
4
4 Stuong
67
67
Msar Krong
13
13 Peam Bang
54
54
Kaoh Thum
4
4 Chheu Khmau
1
1
Chrouy Ta Kaev
2
2 Chrouy Takeo
1
1
Kien Svay
16
16 Kokir
3
3
Kokir Thum
11
11 Samraong Thum
2
2
Leuk Daek
25
25 Kampong Phnum
1
1
Khpob ateav
4
4 Peam Reang
2
2
Preaek Dach
8
8 Preaek Tonloab
10
10
Mukh Kampul
23
23 Preaek Dambang
4
4
Roka Kaong Muoy
1
1
Sambuor Meas
13
13 Svay Ampear
5
5
Popnhea Lueu
36
36 Chrey Loas
1
1
Kampong Loung
23
23

CAST Baseline Evaluation Report| 110
Kampong Luong
1
1 Kaoh Chen
2
2
Ponhea Lueu
1
1 Preaek Ta Teaen
7
7
Vihear Luong
1
1 S'ang
14
14
Kraing Yov
1
1 Krang Yov
8
8
Prasat
2
2 Roka Khpos
1
1
Svay Prateal
1
1 Talon
1
1
Bakan
156
156 Me Tuek
141
141
Rumlech
9
9 Snam Preah
6
6
Kandieng
44
44 Reang Til
44
44
Krakor
116
116 Anlong Tnaot
11
11
Kampong Luong
70
70 Kbal Trach
15
15
Sna Ansa
20
20 Krong Pursat
21
21
Roleab
21
21 Chi Kraeng
30
30
Anlong Samnor
29
29 Resey Lork
1
1
Kra Lanh
21
21 Kra Lanh
10
10
Sra Nal
11
11 Krong Siem Reap
28
28
Chhreav
2
2 Chong Kneas
3
3
Sala Kamreuk
1
1 Savy Dangkoum
4
4
Siem Reap
15
15 Slor Kroum
2
2
Sombuor
1
1 Pork
6
6
Prey Chhrouk
6
6 Prasat Bakong
2
2
Bar Lang
1
1 Mean Chhey
1
1
Puk
29
29

CAST Baseline Evaluation Report| 111
Koa Por
29
29 Soutr Nikom
89
89
Dan Run
8
8 Dom Dek
2
2
Kampong Kleang
74
74 Khchass
5
5
Chbar Ampov
6 6 Prek Eng
2 2
Prek Pra
4 4 Chroy Chnagva
3 3
Chroy Chnagva
1 1 Prek Takong
2 2
Mean Chey
5 5 Chak Angre Krom
5 5
Prek Phnov
65 65 Kok Rokar
1 1
Ponhea Porn
4 4 Prek Phnov
37 37
Samrong
22 22 Sarong
1 1
Reu Sey Kao
22 22 Chrang Chamres
1
11 11
Chrang Chamres 2
2 2
Kilomet 6
3 3 KM 6
1 1
Svay Pak
5 5 Sen Sok
1 1
Khmournh
1 1 Total 130 188 129 118 337 205 102 1,209

CAST Baseline Evaluation Report| 112
Table J: Aquaculture farmer sample distribution (control group, commune level, potential)
District/Commune Banteay Meanchey Kampong Chhnang Takeo Total Krong Serei Saophoan 8
8
Phniet 6
6 Tuek Thla 2
2
Malai 3
3 Tuol Pongro 3
3
Mongkol Borei 17
17 Banteay Neang 3
3
Chamnaom 2
2 Koy Maeng 6
6
Paoy Char 2
2 Rohat Tuek 2
2
Ta Lam 2
2 Ou Chrov 11
11
Koub 1
1 Kuttasat 6
6
Samraong 4
4 Preah Netr Preah 2
2
Preah Netr Preah 1
1 Tuek Chour 1
1
Thma Puok 5
5 Kumru 1
1
Phum Thmei 4
4 Baribour
44
44
Chhnok Tru
37
37 Khon Rang
6
6
Trapeang Chan
1
1 Chol Kiri
15
15
Peam Chhkaok
15
15 Kampong Leaeng
28
28
Phlov Tuk
10
10 Pralay Meas
4
4
Samraong Saen
12
12 Svay Rumpea
2
2
Kampong Tralach
50
50 Ampil Tuek
14
14
Kampong Tralach
21
21 Saeb
9
9
Ta Ches
6
6 Krong Kampong Chhnang
17
17
Phsar Chhnang
17
17 Rolea B'ier
6
6
Rolea B'ier
5
5 Svay Chrum
1
1

CAST Baseline Evaluation Report| 113
Sameakki Mean Chey
6
6 Sedthei
6
6
Tuek Phos
5
5 Akphivoadth
2
2
Tang Krasang
2
2 Khlong Popok
1
1
Angkor Borei
9 9 Angkor Borei
2 2
Ba Srae
3 3 Prey Phkoam
3 3
Ponley
1 1 Bati
46 46
Chambak
1 1 Komar Reachea
11 11
Krang Leav
29 29 Trapeang Krasang
5 5
Kiri Vong
9 9 Angk Prasat
2 2
Preah Bat Choan Chum
6 6 Soum
1 1
Koh Andet
7 7 Rominh Choeurng
7 7
Krong Doun Kaev
4 4 Roka Knong
4 4
Samraong
36 36 Boeng Tranh Khang Tboung
4 4
Chumreah Pen
17 17 Khvav
5 5
Rovieng
7 7 Samraong
2 2
Soeng
1 1 Tram Kak
79 79
Angk Ta Saom
5 5 Cheang Tong
9 9
Kus
3 3 Leay Bour
2 2
Nhaeng Nhang
1 1 Otdam Souriya
3 3
Ou Saray
11 11 Popel
4 4
Ta Phem
6 6 Trapeang Kranhung
13 13
Trapeang Thum Khang Cheung
14 14 Trapeang Thum Khang Tboung
8 8
Samrong
1 1

CAST Baseline Evaluation Report| 114
Lum Chang
1 1 Total 46 171 191 408
Sampling framework after survey completion
Table K: Treatment provinces (Note:* new selected district)
Province District Potential Target Realized Battambang 130 97 96 Aek Phnum 55 41 48 Bavel 7 5 4 Moung Ruessei 13 10 7 Sangkae 23 17 25 Thma Koul 32 24 8 Battambang*
1
Rukhak Kiri*
3 Kampong Cham 188 138 137 Batheay 52 38 54 Cheung Prey 45 33 25 Kampong Siem 48 35 35 Kang Meas 31 23 17 Prey Chhor 12 9 6 Kampong Thom 129 95 109 Baray 6 4 3 Kampong Svay 8 6 13 Santuk 6 4 3 Stueng Sen 29 21 16 Stuong 80 60 73 Kandal 118 87 99 Kaoh Thum 4 3 3 Kien Svay 16 12 19 Leuk Daek 25 18 16 Mukh Kampul 23 17 19 Popnhea Lueu 36 27 22 S'ang 14 10 20 Pursat 337 250 245
Bakan 156 115 115 Kandieng 44 33 39 Krakor 116 86 73 Krong Pursat 21 16 18
Siem Reap 205 152 162 Chi Kraeng 30 22 24 Kra Lanh 21 16 14 Krong Siem Reap 28 21 19 Prasat Bakong 2 2 3 Puk 35 25 27

CAST Baseline Evaluation Report| 115
Soutr Nikom 89 66 75 Phnom Penh 102 75 70
chbar Ampov 6 4 6 Chroy Chnagva 3 2 1 Mean Chey 5 4 2 Prek Phnov 65 48 47 Reu Sey Kao 22 16 14 Sen Sok 1 1 0
TOTAL TREATMENT 1209 894 918
Table L: Control provinces
Province District Potential Target Realized Banteay Meanchey 46 34 34
Krong Serei Saophoan 8 6 0 Malai 3 2 0 Mongkol Borei 17 13 18 Ou Chrov 11 8 11 Preah Netr Preah 2 1 0 Thma Puok 5 4 5
Kampong Chhnang 171 126 146 Baribour 44 32 45 Chol Kiri 15 11 13 Kampong Leaeng 28 21 20 Kampong Tralach 50 37 46 Krong Kampong Chhnang 17 13 15 Rolea B'ier 6 4 4 Sameakki Mean Chey 6 4 0 Tuek Phos 5 4 3
Takeo 191 140 106 Angkor Borei 9 7 09 Bati 46 33 11 Bourei Cholsar 1 Kiri Vong 9 7 16 Koh Andet 7 5 13 Krong Doun Kaev 4 3 2 Prey Kabas 3 Samraong 36 26 14 Tram Kak 80 59 25 Treang 12
TOTAL CONTROL
408 300 286

CAST Baseline Evaluation Report| 116
Table M: Percentage of farm replaced in the sample compared to planned sampling
Type Farm identified during scoping and interviewed
% Farm identified during scoping and interviewed
Newly selected
farms
% of Newly selected
farms
Total
Treatmen
t
392 46% 459 54% 851
Control
86 30% 203 70% 289
Total 478 42% 662 58% 1,140
Replacement of farmer identified during the scoping exercise happen because of:
• Listing was not accurate- famer name or location was incorrect • Farmer listed already stopped fish farming activities • Farmers listed did not responded to the selection criteria and were excluded • Identified farmer refused to join the survey
Farmer were replaced by other farmers within the same commune or district.

CAST Baseline Evaluation Report| 117
Table N: Change made in the survey methodology during implementation
Content area Original plan Change made Rationale Sampling approach and strategy
Random selection of respondents based on data collecting during scoping exercise
No longer random, but purposive. Adjustment of rules due to: - logistic issues by substituting and replacing farmers in remote area by farmers located near other sampled farmers - low accuracy of listing of aquaculture producers. Replacement by other farmers in the same commune
The analysis will be influenced by the proportion of replacement versus the original plan. If exceeding 15%, then it will not be a randomized sample but a purposive selection. However, the sample was exhaustive in the different district visited and correspond to more than 95% of the existing aquaculture producers in district where aquaculture is happening. We therefore consider this approach being close of a census and representative of the entire aquaculture population.
Data collection for purposive sample
A select number of respondents to be interviewed in person by Nuppun Research & Consulting
10 MFI and one feed mill, interviews were conducted over the phone.
To ensure accuracy of administrative data as respondent need to check his/her record to answer the question(s). Limit transport cost and time to provinces
Key Informant Interview selected within the Purposive sample
Select another respondent for KII or purposive sample selection due to survey fatigue (3 cases)
Survey fatigue of respondent having to respond to two survey within 1 month increased non-response rate
Approach to MFI Approaching MFI directly at provincial level
Approaching MFI at Headquarter in Phnom to get access to information in province
MFI office in province were reluctant to respond to our survey

CAST Baseline Evaluation Report| 118
Table O: Planned and Realized Purposive Sample
Location Plan Realize Plan Realize Plan Realize Plan Realize Plan Realize Plan Realize Plan Realize Plan Realize
Feed
mill
Feed
mill
Hat
cher
y
Hat
cher
y
Nur
sery
Nur
sery
Proc
esso
r
Proc
esso
r
Who
lesa
ler
Who
lesa
ler
Col
lect
or
Col
lect
or
Feed
dis
trib
utor
Feed
dis
trib
utor
Fina
ncia
l in
stitu
tion
Fina
ncia
l in
stitu
tion
Phnom Penh
8 6 0 0 3 1 2 3 4 4 5 3 3 1 3 1
Kandal 1 1 3 2 2 1 2 2 2 2 6 3 3 0 3 1 Kampong Cham
1 1 0 3 1 2 2 2 3 4 3 1 3 2 3 1
Kampong Thom
0 0 3 1 1 1 7 8 3 3 5 5 3 3 3 1
Siem Reap 0 0 6 3 1 1 5 5 3 3 3 3 3 3 3 3 Battambang 0 0 9 5 2 2 4 4 3 2 3 4 3 5 3 2 Pursat 0 0 5 3 0 0 3 2 3 3 5 5 3 3 3 2 Takeo 0 0 12 12 0 1 2 2 3 3 5 5 3 3 3 3 Kampong Chhnang
0 0 2 1 0 0 4 4 4 4 6 6 3 3 3 2
Banteay Meanchey
0 0 0 0 0 0 2 2 2 1 4 5 3 1 3 1
Total 10 8 40 30 10 9 33 34 30 29 45 40 30 24 30 17

CAST Baseline Survey | Page 119
ANNEX C: QUESTIONNAIRES & SURVEY TOOLS
Introductory statement
This survey is being conducted by Nuppun Research & Consulting together with WorldFish to assess the current status of the aquaculture sector in Cambodia. The results of this survey will help to design a USDA-funded project called Commercialization of Aquaculture for Sustainable Trade (CAST) Cambodia which will support the development of aquaculture in Cambodia for the next four years. The project intends to develop the commercial aquaculture industry by linking different actors within the value chain while also improving the technical and managerial practices of numerous value chain actors.
We will use data collected in this survey to assess how producers, hatcheries, fish buyers, wholesalers, processors, aquaculture feed producers and retailers are operating, and to identify the main constraints, if any, that are limiting their performance.
Participation in this survey is completely voluntary, and you may choose not to take part in this survey. If you decide to take part in this survey, you may stop participating at any time. If you decide not to take part in this survey, or if you stop participating at any time, you will not be penalized or lose any program benefits for which you would otherwise qualify.
We encourage you to answer questions honestly and hope that you will answer all of our questions. However, you may skip any questions that you do not wish to answer. I will read each question aloud to you. Please let me know if the meaning of a question is not clear so that I can provide you with additional guidance.
The questionnaire will take about 90 minutes to complete. We will ask you questions about the infrastructure and equipment on your farm or within your business, and about the production and trade of fish from your property. We will also ask you questions about the techniques you use and about the farm management practices that you follow. The survey also includes questions about your ability to obtain financing for your farm or business, and about how you access additional information about fish production, processing and trade.
Do you have any questions? If not, are you willing to participate in the survey?

CAST Baseline Survey | Page 120
MODULE A. BENEFICIARY REGISTRATION NOTE: I am now going to ask you a number of questions about the persons working on your farm or for your company.
Interviewer Name:__________ Date :__________ Start time :___________ End time:
1: Interview ID:_(Beneficiaries Type code-1Digit + ID- 4 Digits)
2. Name of the respondent:___________________________
3. Age of respondent:________
4. Gender of respondent (1 = Male/2 = Female): |__|
5. Name of the manager/ head of household if different than Q2:___________________________
8. Age of manager/ head of household if different than Q2 ________
9. Gender of manager/ head of household (1 = Male/2 = Female): |__|
10. Telephone contact of manager/ head of household:_______________
11. Alternative contact of manager/ head of household:____________________
12. Province:_______( 1 = Phnom Penh; 2 = Kandal; 3 =Kampong Cham; 4 = Kampong Thom; 5= Siem Reap; 6 =Battambang; 7= Pursat; 8= Takeo; 9 = Kampong Chhnang; 10= Beantay Meanchey)
13. District: __________(drop down list)
14. Commune:___________(drop down list)
15. Village: ___________(drop down list)
16. GPS ________________
17: What is the primary activity of the Beneficiary: 1: HATCHERY; 2: NURSERY; 3: FISH PRODUCER; 4: COLLECTOR; 5: WHOLESALER; 6: PROCESSOR; 7 FEED MILL; 8: Micro-finance and finance institution; 9: FEED DISTRIBUTOR: _______________

CAST Baseline Survey | Page 121
18 .When did you/your firm start your/its main activity (YYYY):____________
If Q17 is 1 or 2, >>Q19; If NO>>MODULE B
Q19: Are you a government hatchery (1=YES 2= NO): |____|
Q19.1: Besides producing fingerlings, do you also produce farmed fish for selling (1= YES; 2 =NO): |__|
If Q17 is 5 or 6, >>Q20; If NO>>MODULE B
Q20: In 2018, were you and your business involved in: 1= FISH WHOLESALE ONLY; 2= FISH PROCESSING ONLY; 3= BOTH WHOLESALE AND PROCESSING: |__|
If Q17 is 7 or 8 or 9, >>Q21; If NO>>MODULE B
21. Name of company _____________________________
22. Position of respondent in company:_ |__|
o 1. Chair/Director/Owner o 2. Vice-Chair/Vice-Director o 3. Employee o 4. Treasurer o 5. Secretary o 6. Head of department o 99. Other (specify)___________

CAST Baseline Survey | Page 122
MODULE B: COMPANY HUMAN RESOURCES
IF Q17 is 1,2,3,4,5,6,9 then >>Q23
If Q17 is 7 or 8 >> Ask only Q27 NOTE: I am now going to ask you a number of questions about the persons living in your household and working at your farm. Please note that we are interested in the current situation, not past experiences or future plans.
B1. HOUSEHOLD LABOR
23 24 25 26 CODE How many male family
members and non-family members are currently living in the
household?
How many male family members and non-family
members living in the household are currently involved in aquaculture,
trading, and/or processing activities for your farm?
How many female family members and
non-family members are currently living
in the household?
How many female family members and non-family members living in the
household are currently involved in aquaculture, trading, and/or processing
activities for your farm?
Number Number Number Number Children 0-14 years 1 Age 15 – 29 2 Age >=30 3

CAST Baseline Survey | Page 123
B2. LONG TERM EMPLOYEE STATUS
NOTE: I am now going to ask you a number of questions about the persons who have been working for a long period of time on your farm. Please note that we are only interested in those who worked on your farm in 2018.
27. How many long-term (more than 3 months) employees or casual laborers did you employ during 2018?
__ __ __ persons If NO >> Module B3
28 29 30 31 32
CODE
Gender 1=female 2=male
Age 1=15-29 years
2= over 30 years
Types of labor 1=full time 2=part time
How many days did they work on your farms in 2018?
(days)
1 2 3 4
IF Q17 is FEED MILL (7) >> MODULE M
If Q17 is MFI (8) >>> MODULE N
IF Q17 is 1,2,3,4,5,6,9 >>> MODULE B3

CAST Baseline Survey | Page 124
B3. HIRED CASUAL LABOR
NOTE: I am now going to ask you a number of questions about the type and number of persons working for short-term periods on your farm or at your business. Please note that we are only interested in those who worked on your farm in 2018.
32.1. How many short-term male workers (casual labor) did you hire in 2018? |__|
32.2. How many short-term male workers over 30 years old?
33. How many days in 2018 did you employ one or more short-term male workers to perform casual labor? Please make your best estimate. |__|
34.1. How many short-term female workers (casual labor) did you hire in 2018? |__|
34.2. How many short-term female workers over 30 years old?
35. On average, how many days in 2018 did you employ one or more short-term female workers to perform casual labor? |__|
Note for the enumerator: On fish farms, nurseries, and hatcheries – or at collectors, processors, and wholesalers – hired labor can be for pond or cage construction or repair. Examples of this include, but are not limited to, a) buying fish seed or stocking fish seed into the pond or cage; b) buying, transporting, or hauling fish feed to the farm; c) breeding, feeding, or harvesting fish; and/or d) loading, unloading, bagging, transport, filleting, drying, or icing fish.

CAST Baseline Survey | Page 125
NOTE: I am now going to ask you a number of questions about the activities of the different types of employees on your farm or business. As discussed, the types of employees identified for this survey include household members, long-term employees, and short-term hired laborers. Please answer all questions openly and honestly. Do you have any questions?
What activities are household members, long-term employees, and short-term hired laborers involved in?
36 37
Code Family members and
long-term employees
Short-term hired laborers
1= Yes 2= No
1= Yes 2= No
Loading/ unloading/ bagging/ transport/ other (materials) 1
Pond/ cage construction or repair 2
Buying fish seed or stocking fish seed into the pond/cage 3
Buying/ transporting/ hauling fish feed to the farm 4
Breeding (for hatcheries and nurseries only) 5
Feeding fish 6
Guarding ponds/ cage 7
Harvesting fish/ hauling from farm/ transporting to market 8
Pond/ cage management 9
Other (specify) _________ 99
Other (specify)_________ 99
Other (specify)_________

CAST Baseline Survey | Page 126
MODULE C: FARM ASSETS ANSWER THIS ONLY IF Q17 is 1 (HATCHERY), 2 (NURSERY) or 3 (PRODUCER).
IF Q17 is 4, 5, 6, 9>> MODULE D
NOTE: I am now going to ask you a number of questions about the type and quantity of equipment currently available on this farm. Please note that we are interested in your current situation, not past experiences or future plans.
C1. POND-CAGE ROSTER
38. Total area of the farm (m2):__________________ (including buildings for hatcheries, nurseries)
39: What is the area (m2) of buildings and other above-ground structures currently being used for hatcheries and/or nurseries? ______________m2
INSTRUCTION TO ENUMERATORS
Ask the farmer, with the help of enumerator, to draw a diagram of all the ponds and cages in their holdings. Draw ponds that have been in operation since 2018. Each pond and cage should be numbered, and the main pond or cage should be identified as no1.
Ask the farmer, with the help of enumerator, to note the length, width, and depth of each pond and all cages on the diagram. Proceed unit per unit, indicating the dimensions on the diagram, in meters. Indicate the area (m2) or volume (m3) on each unit – you will need it later in Module G
If there are too many units, draw one unit for each type of pond or cage of similar size and indicate the number of similar unit. Identify the main cage or pond on the map by a “1”. By main cage/pond refers the cage/pond that provides the highest revenue in the farm.. Number the different units (pond or cage), starting from 2. DRAW AND TAKE A PHOTO OF THE DIAGRAM
40. From 2018 until now, have you used cages, ponds or both to raise fish? (1= cage; 2= pond; 3= both): |__|
41: How many cages have you operated from 2018 until now?: |______|
42: How many pond have you operated from 2018 until now?: |______|

CAST Baseline Survey | Page 127
NOTE: For each type of pond or cage, detail the size of the unit, and ask how many similar units the farmer operates
43 49 44 45 46 47 48
Pond or cage number
Type of pond/cage (operating in 2018)
1= Grow-out pond
2= Nursery pond
3= Grow-out cage
4= Nursery cage
5= Broodfish pond (if Q17 is 1)
How many units of the same size do you
operate?
What is the length of the pond/cage?
(m)
What is the width of the pond/cage?
(m)
What is the depth of the pond/cage?
(m)
Main fish species that have already
been harvested (last production cycle) between 2018 and now If Q43= 1 or
Q43= 3
1= Pangasius 2= Clarias/walking 3= catfish 4= Red Tilapia 5= Nile Tilapia 6= Channa striata 7=Channa micropeltes 8= Annabas 9= Snakeskin 10= Gourami 11= Red Tail catfish Silver barb Carp species 99= Other (specify)
In what year was this
pond/cage constructed?
If Q43=1 or Q43= 3
1
2

CAST Baseline Survey | Page 128
3
4
5
6
7
50. (If Q17=1) How many tanks did you operate in 2018? |______| (if Q50=0 >> Q58)
NOTE: List the different types and sizes of operational tanks that the farmer owns. For each type and size of tank, (rectangular or circular), ask how many similar units the farmer owns and detail the size of the unit.
51 52 53 54 55 57 Tank number
Type of tank
1= square or rectangular tank 2= circular tank
How many unit of the same size do
you operate
What is the length or diameter (if circular)
of the tank? (m)
What is the width of the
tank? (m)
If 2 in Q51 >>55
What is the depth of the tank?
(m)
In what year was the latest
tank constructed or bought?
Number YYYY
1
2
3
4
5
6
7
8
9
10
11
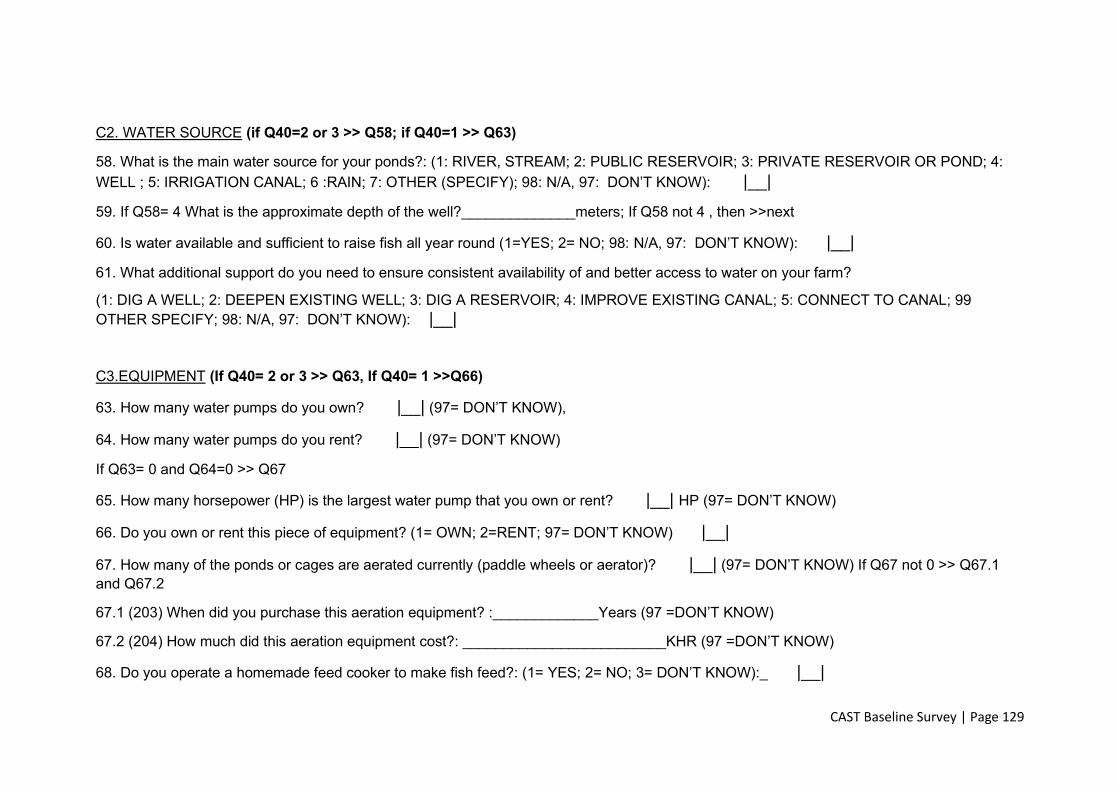
CAST Baseline Survey | Page 129
C2. WATER SOURCE (if Q40=2 or 3 >> Q58; if Q40=1 >> Q63)
58. What is the main water source for your ponds?: (1: RIVER, STREAM; 2: PUBLIC RESERVOIR; 3: PRIVATE RESERVOIR OR POND; 4: WELL ; 5: IRRIGATION CANAL; 6 :RAIN; 7: OTHER (SPECIFY); 98: N/A, 97: DON’T KNOW): |__|
59. If Q58= 4 What is the approximate depth of the well?______________meters; If Q58 not 4 , then >>next
60. Is water available and sufficient to raise fish all year round (1=YES; 2= NO; 98: N/A, 97: DON’T KNOW): |__|
61. What additional support do you need to ensure consistent availability of and better access to water on your farm?
(1: DIG A WELL; 2: DEEPEN EXISTING WELL; 3: DIG A RESERVOIR; 4: IMPROVE EXISTING CANAL; 5: CONNECT TO CANAL; 99 OTHER SPECIFY; 98: N/A, 97: DON’T KNOW): |__|
C3.EQUIPMENT (If Q40= 2 or 3 >> Q63, If Q40= 1 >>Q66)
63. How many water pumps do you own? |__| (97= DON’T KNOW),
64. How many water pumps do you rent? |__| (97= DON’T KNOW)
If Q63= 0 and Q64=0 >> Q67
65. How many horsepower (HP) is the largest water pump that you own or rent? |__| HP (97= DON’T KNOW)
66. Do you own or rent this piece of equipment? (1= OWN; 2=RENT; 97= DON’T KNOW) |__|
67. How many of the ponds or cages are aerated currently (paddle wheels or aerator)? |__| (97= DON’T KNOW) If Q67 not 0 >> Q67.1 and Q67.2
67.1 (203) When did you purchase this aeration equipment? :_____________Years (97 =DON’T KNOW)
67.2 (204) How much did this aeration equipment cost?: _________________________KHR (97 =DON’T KNOW)
68. Do you operate a homemade feed cooker to make fish feed?: (1= YES; 2= NO; 3= DON’T KNOW):_ |__|

CAST Baseline Survey | Page 130
If Q17 is 1 (Hatchery) or 2 (Nursery), then Q69 ;
NO>> MODULE D 69. Please list down equipment that is currently owned and functional
CODE Tick boxes Equipment 1 Oxygen Tank 2 Larval rearing cones 3 Tank 4 Refrigerator (for hormones) 5 Scale 6 Grader 7 Hauling tanks with oxygen 8 Hapa 9 Seine net for harvest 10 Secchi disk 11 Dip net 99 None

CAST Baseline Survey | Page 131
MODULE D. EQUIPMENT, ASSETS AND DISTRIBUTION CAPACITY IN POST HARVEST
If Q17 is 4 (Collector), 5 (Wholesaler) or 6 (Processors) or 9 (Feed distributor), >>> Q72
NO >> MODULE E NOTE: I am now going to ask you a number of questions about the type and quantity of equipment currently available to this business. Please note that we are interested in the current situation, not past or future plans for equipment use.
72. How many buildings used as warehouses (for storage and/or processing) or shops do you own? |__|
CODE 73. What is the surface of the building (m2)? 1 2 3 4 5

CAST Baseline Survey | Page 132
IF Q17 is 9 >> Q82
[Skip if Q17=9 (Feed distributor)]
Do you have the following equipment for your wholesale, trading or processing activities?
CODE 79 80 Number
of units
Size of 1 unit (indicate the largest one if
different dimensions)
(Skip if Q79=0) 97: DON’T KNOW, 98: N/A 1 Refrigerator (m3) 2 Generator (HP) 3 Ice crusher (Skip Q80) 4 Tanks for live fish & transportation with
aeration (m3)
5 Tanks for live fish & transportation - no aeration (m3)
6 Tanks for transporting chilled/dead fish (m3)
7 Cool box/insulated box (m3) 8 Baskets (bamboo or plastic) (m3) 9 Solar dryer (m2) 10 Stove to smoke fish (m3) 11 Other (specify) 12 Other (specify) 13 Other (specify) 14 Other (specify)

CAST Baseline Survey | Page 133
84. Do you have the following means of transportation for your wholesale, trading or processing activities?
Number of units 1 Motorcycle (‘moto’) 2 Cart/trailer (attached to moto) 3 Car (sedan) 4 Boat (motorized) 5 Mini-van (e.g. Ssanyong) 6 Small truck & pickup (4 wheels) 7 Large truck (6 wheels and more) 8 Other (specify) 9 Other (specify) 10 Other (specify)

CAST Baseline Survey | Page 134
MODULE E. HATCHERIES PRODUCTION If Q17 is 1 (HATCHERY) then >>Q85-Q105
If ≠ >> MODULE F
NOTE: I am now going to ask you a number of questions about the inputs used by the hatchery, and the production of the hatchery. Please note that we are interested in the 2018 production cycle. Our questions concern the activities of the whole hatchery, and do not concern only a specific pond.
In 2018: 85. When did the peak spawning period start?
85.1 MM (1 JANUARY; 2 FEBRUARY; 3 MARCH; 4 APRIL; 5 MAY; 6 JUNE; 7 JULY; 8 AUGUST; 9 SEPTEMBER; 10 OCTOBER; 11 NOVEMBER; 12 DECEMBER; 97= DON’T KNOW) |____|
85.2 WW (1 WEEK 1; 2 WEEK 2; 3 WEEK 3; 4 WEEK 4; 97= DON’T KNOW) |____|
86. When did the peak spawning period end?
86.1 MM (1 JANUARY; 2 FEBRUARY; 3 MARCH; 4 APRIL; 5 MAY; 6 JUNE; 7 JULY; 8 AUGUST; 9 SEPTEMBER; 10 OCTOBER; 11 NOVEMBER; 12 DECEMBER; 97= DON’T KNOW) |____|
86.2 WW (1 WEEK 1; 2 WEEK 2; 3 WEEK 3; 4 WEEK 4; 97= DON’T KNOW) |____|
87. When does the peak selling period start?
87.1 MM (1 JANUARY; 2 FEBRUARY;3 MARCH; 4 APRIL; 5 MAY; 6 JUNE; 7 JULY; 8 AUGUST; 9 SEPTEMBER; 10 OCTOBER; 11 NOVEMBER; 12 DECEMBER; 97= DON’T KNOW) |____|
87.2 WW (1 WEEK 1; 2 WEEK 2; 3 WEEK 3; 4 WEEK 4; 97= DON’T KNOW) |____|

CAST Baseline Survey | Page 135
88. When does the peak selling period end?
88.1 MM (1 JANUARY; 2 FEBRUARY; 3 MARCH; 4 APRIL; 5 MAY; 6 JUNE; 7 JULY; 8 AUGUST; 9 SEPTEMBER; 10 OCTOBER; 11 NOVEMBER; 12 DECEMBER; 97= DON’T KNOW) |____|
88.2 WW (1 WEEK 1; 2 WEEK 2; 3 WEEK 3; 4 WEEK 4; 97= DON’T KNOW) |____|
89. Are you able to meet demand for your product(s) during the peak season? (1:YES; 2= NO; 97= DON’T KNOW): |____|
90. When was the first time you started to sell fingerlings in 2018? Month |____| 1 JANUARY; 2 FEBRUARY; 3 MARCH; 4 APRIL; 5 MAY; 6 JUNE; 7 JULY; 8 AUGUST; 9 SEPTEMBER; 10 OCTOBER; 11 NOVEMBER; 12 DECEMBER; 97= DON’T KNOW)
91. When was the last time you sold fingerlings from your hatcheries in 2018? Month |____| 1 JANUARY; 2 FEBRUARY; 3 MARCH; 4 APRIL; 5 MAY; 6 JUNE; 7 JULY; 8 AUGUST; 9 SEPTEMBER; 10 OCTOBER; 11 NOVEMBER; 12 DECEMBER; 97= DON’T KNOW)

CAST Baseline Survey | Page 136
E1: Production NOTE: The following questions concern the 2018 production cycle, and concern the activities of the whole hatchery and not only of a specific pond
92 93 94 95 96 98 98.1 What was the
total quantity of [..species..] produced in
2018?
How many breeding cycles did you
perform per species in 2018?
What was the total quantity of
[..species..] sold in 2018?
What was the average price sold for [..species..] in
2018?
Size of fingerlings sold
Unit
number number number KHR/ind 1= cm/ind 2= g/ind CODE If 0 >> NEXT ITEM
Pangasius 1
Clarias/walking catfish 2 Red tilapia 3 Nile tilapia 4 Channa striata 5 Channa micropeltes 6 Annabas 7 Snakeskin gourami 8 Redtail catfish 9 Silver barb 10 Carp species 11 Other (specify) 99 Other (specify) 99 Other (specify) 99
100. What is the average survival rate during nursing (for hatchery)? ____________% (97= DON’T KNOW) (Rule: between 0 and 100)
101. Where is the main destination of the production from your hatchery? (1: THIS VILLAGE; 2: THIS COMMUNE; 3: NEIGHBORING COMMUNE; 4: OTHER DISTRICT IN THE PROVINCE; 5: OTHER PROVINCE; 99: OTHER SPECIFY): |____|

CAST Baseline Survey | Page 137
E2: SALES
NOTE: I am now going to ask you a number of questions about the value of sales from your hatchery. Please note that we are only interested in the 2018 production cycle. Our questions concern the activities of the whole hatchery, and not only of a specific pond
103 104 105
Did you sell fingerlings to the following type of
buyer?
How many different types of buyers did you sell to during 2018?
How often did you receive cash advance from this type of buyer in 2018?
Code 1= YES NUMBER 1= NEVER 2= NO 2= SOMETIMES If no >>> 3= ALWAYS NEXT ITEM
Fish farmer 1
Fingerling traders 2
Nurseries 3
Other (specify) 99

CAST Baseline Survey | Page 138
MODULE F: NURSERIES
If Q17 is 2 (Nursery), then >>Q106-Q130
If ≠>> MODULE G
NOTE: I am now going to ask you a number of questions about the production and sales of the nursery. Please note that we are interested in the 2018 production cycle. Our questions concern the activities of the whole nursery
In 2018: 106. When did the peak stocking period start?
106.1 MM (1 JANUARY; 2 FEBRUARY; 3 MARCH; 4 APRIL; 5 MAY; 6 JUNE; 7 JULY; 8 AUGUST; 9 SEPTEMBER; 10 OCTOBER; 11 NOVEMBER; 12 DECEMBER; 97= DON’T KNOW) |____|
106.2 WW (1 WEEK 1; 2 WEEK 2; 3 WEEK 3; 4 WEEK 4) |____|
107. When did the peak stocking period end?
107.1 MM (1 JANUARY; 2 FEBRUARY; 3 MARCH; 4 APRIL; 5 MAY; 6 JUNE; 7 JULY; 8 AUGUST; 9 SEPTEMBER; 10 OCTOBER; 11 NOVEMBER; 12 DECEMBER; 97= DON’T KNOW) |____|
107.2 WW (1 WEEK 1; 2 WEEK 2; 3 WEEK 3; 4 WEEK 4) |____|
108. When did the peak selling period start?
108.1 MM (1 JANUARY; 2 FEBRUARY; 3 MARCH; 4 APRIL; 5 MAY; 6 JUNE; 7 JULY; 8 AUGUST; 9 SEPTEMBER; 10 OCTOBER; 11 NOVEMBER; 12 DECEMBER; 97= DON’T KNOW) |____|
108.2 WW (1 WEEK 1; 2 WEEK 2; 3 WEEK 3 ; 4 WEEK 4) |____|

CAST Baseline Survey | Page 139
109. When did the peak selling period end?
109.1 MM (1 JANUARY; 2 FEBRUARY; 3 MARCH; 4 APRIL; 5 MAY; 6 JUNE; 7 JULY; 8 AUGUST; 9 SEPTEMBER; 10 OCTOBER; 11 NOVEMBER; 12 DECEMBER; 97= DON’T KNOW) |____|
109.2 WW (1 WEEK 1; 2 WEEK 2; 3 WEEK 3; 4 WEEK 4) |____|
110. When was the first time you stocked your nursery in 2018? MONTH |____| (1 JANUARY; 2 FEBRUARY; 3 MARCH; 4 APRIL; 5 MAY; 6 JUNE; 7 JULY; 8 AUGUST; 9 SEPTEMBER; 10 OCTOBER; 11 NOVEMBER; 12 DECEMBER; 97= DON’T KNOW; 98=N/A)
113. When was the last time you harvested and sold fish from your nursery in 2018? MONTH |____| (1 JANUARY; 2 FEBRUARY; 3 MARCH; 4 APRIL; 5 MAY; 6 JUNE; 7 JULY; 8 AUGUST; 9 SEPTEMBER; 10 OCTOBER; 11 NOVEMBER; 12 DECEMBER; 97= DON’T KNOW; 98=N/A)

CAST Baseline Survey | Page 140
F1. STOCKING
NOTE: The following questions concern the 2018 production cycle and concern the activities of the whole nursery, and not only of a specific pond.
115 116 116.1 117 Did you stock [..species..] during
2018? Quantity of [..species..]
stocked in 2018 Unit Unit price
CODE 1 YES NUMBER 1 IND KHR/Unit 2 NO 97: DON’T KNOW 2. KG 97: DON’T KNOW >> NEXT ITEM Pangasius 1
Clarias/walking catfish 2
Red tilapia 3
Nile tilapia 4
Channa striata 5
Channa micropeltes 6 Annabas 7 Snakeskin gourami 8 Redtail catfish 9 Silver barb 10 Carp species 11 Other (specify) 99 Other (specify) 99 Other (specify) 99

CAST Baseline Survey | Page 141
118. In general, from whom did you obtain your fingerlings in 2018: 1: PRIVATE HATCHERY; 2: FINGERLING TRADER SOURCING MATERIAL FROM CAMBODIA; 3: FIA HATCHERY; 4: CAUGHT FROM RIVER; 5: NGO; 6: FINGERLINGS TRADER SOURCING MATERIAL FROM VIETNAM OR THAILAND; 99 OTHER (SPECIFY): |__|
119. What was the average number of days between purchase and re-sell (i.e., nursing period)? |__| days (97= DON’T KNOW) (Rule: not more than 120 days)
120: How many fingerlings per square meter do you typically stock? |__| ind/m2 (97= DON’T KNOW)
121. What is the average survival rate during nursing (for nursery)?____________% (97= DON’T KNOW) (Rule: between 0 and 100)
122. How many nursing cycles were completed in 2018? |___| (97= DON’T KNOW)

CAST Baseline Survey | Page 142
F2. DISTRIBUTION
NOTE: I am now going to ask you a number of questions about the sales of the nursery. Please note that we are interested in 2018 sales activities. Our questions concern the activities of the whole nursery and not only a specific pond.
124 125 125.1 126 127 128 128.1
Did you sell any of [..species..] in
2018?
What was the total quantity of [..species..] sold
in 2018?
Unit What was the average price sold for [..species..]?
What was the total sales value in 2018
?
What was the average size of
fingerlings when sold?
Unit
CODE 1 YES NUMBER 1 IND KHR/Unit KHR 1 HATCHLING 1= g 2 NO 97: DON’T KNOW 2: KG 97: DON’T KNOW 97: DON’T KNOW 2. <1 2= cm >> NEXT ITEM 3. 1-3
4. 3-5
5. 5-7 6. 7-10
7. >10
Pangasius 1 Clarias/walking catfish
2
Red tilapia 3 Nile tilapia 4 Channa striata 5 Channa micropeltes
6
Annabas 7 Snakeskin gourami 8 Redtail catfish 9 Silver barb 10 Carp species 11 Other (specify) 99 Other (specify) 99

CAST Baseline Survey | Page 143
129. Which type of buyer purchases the majority of your fingerlings? 1: OTHER NURSERIES; 2: FINGERLING TRADER(S); 3: SMALL GROW-OUT FARM(S) (LESS THAN 200 M2 POND- 30 M3 CAGE); 4: MEDIUM/ LARGE GROW-OUT FARM; 99: OTHER SPECIFY): |__|
130. Are you responsible for the transportation of your fingerlings to the buyer(s)? (1= NEVER; 2= SOMETIMES; 3= ALWAYS): |__|

CAST Baseline Survey | Page 144
MODULE G: PRODUCERS
IF Q17 is 3 (Producers) ONLY, then>>Q131
IF Q17 is 1, 2 AND Q19 is 1 (YES) (HATCHERY or NURSERY ALSO RAISING FISH FOR MARKET),then >>Q131
IF NO to Q19 or Q17 is ≠ 3 >> MODULE H
NOTE: I am now going to ask you a number of questions about the stocking and production of the farm. Please note that we are interested in the last year – i.e. activities in 2018. To identify the production cycles and production calendar, we will ask you question about stocking and harvesting since 2017.
• Talk to the informant to identify the beginning and end of the last complete production cycle and the different production cycles starting from May 2017 up to April 2019. Identify the stocking and harvesting calendar(s) for the main pond or cage of the farm. Use the map of the farm ponds and cages (Module C) where the main pond or cage is identified.
• A production cycle finishes when all of the main species in the pond have been harvested. • A production cycle begins when the pond is restocked after the main species in the pond have been harvested.
ON a HARDCOPY - Ask in which months the main pond or cage (i.e. the cage/pond that provides the highest revenue for the farm) was stocked (indicate with 'S'), and in which month the main pond was harvested (indicate with 'H') within the last 24 months.
JUN
E
JULY
AUG
UST
SEPT
EMBE
R
OC
TOBE
R
NO
VEM
BER
DEC
EMBE
R
JAN
UAR
Y
FEBR
UAR
Y
MAR
CH
APR
IL
MAY
JUN
E
JULY
AUG
UST
SEPT
EMBE
R
OC
TOBE
R
NO
VEM
BER
DEC
EMBE
R
JAN
UAR
Y
FEBR
UAR
Y
MAR
CH
APR
IL
MAY
Month 6 7 8 9 10 11 12 1 2 3 4 5 6 7 8 9 10 11 12 1 2 3 4 5 Year 17 17 17 17 17 17 17 18 18 18 18 18 18 18 18 18 18 18 18 19 19 19 19 19
Stocked
Harvested

CAST Baseline Survey | Page 145
Using the table above, count:
131. How many production cycles were completed in the past 24 months? |____|
132. How many production cycles were completed in the past 12 months (since 1 June 2018)? |____|
133. How many production cycles were completed in 2018? |____|
134.1. When did the last complete production cycle begin? YEAR |____| (1= 2017; 2= 2018; 3= 2019)
134.2. MONTH |____| (1 JANUARY; 2 FEBRUARY; 3 MARCH; 4 APRIL; 5 MAY; 6 JUNE; 7 JULY; 8 AUGUST; 9 SEPTEMBER; 10 OCTOBER; 11 NOVEMBER; 12 DECEMBER)
135.1. When did the last complete production cycle end? YEAR |____| (1= 2017; 2= 2018; 3= 2019)
135.2. MONTH |____| (1 JANUARY; 2 FEBRUARY; 3 MARCH; 4 APRIL; 5 MAY; 6 JUNE; 7 JULY; 8 AUGUST; 9 SEPTEMBER; 10 OCTOBER; 11 NOVEMBER; 12 DECEMBER)
G1. STOCKING (Reference to Q47.1 above)
NOTE: All questions in this module relate to the whole farm and concern the last complete production cycle. Use the diagram made in POND/CAGE ROSTER (Module C) to identify which pond is stocked with which species.

CAST Baseline Survey | Page 146
136 137 143 143_unit 145 145_unit 146
Species stocked
Did you stock [..species..] during in
last completed cycle?
Quantity of [..species..] stocked
per cycle
Average size at stocking
Unit price (of Q143)
CODE 1 YES NUMBER UNIT Size Unit 1= g 2= cm
KHR
2 NO 1= IND 1. HATCHLING 2= KG 2. <1 3. 1-3 4. 3-5
5. 5-7
6. 7-10 7. >10 Pangasius 1
Clarias/walking catfish 2
Red tilapia 3
Nile tilapia 4
Channa striata 5
Channa micropeltes 6
Annabas 7 Snakeskin gourami 8
Redtail catfish 9 Silver barb 10 Carp species 11 Other (specify) 99

CAST Baseline Survey | Page 147
147. Were all fingerlings of a very similar size? (1: YES; 2= NO; 97= DON’T KNOW): |____|
148. What is the main source of fingerlings: 1.FINGERLING TRADER CAMBODIA; 2.OWN NURSERY POND; 3. PRIVATE NURSERY; 4. OWN HATCHERY; 5. FIA HATCHERY ; 6. PRIVATE HATCHERY CAMBODIA; 7. WILD CAUGHT; 8. NGO; 9: NEIGHBORS; 10: FINGERLING TRADER OR NURSERY SOURCING FROM VIETNAM OR THAILAND; 99 OTHER (SPECIFY) : |____|

CAST Baseline Survey | Page 148
G2. GROWOUT - FEED INPUTS (Focus on the main the volume of fish species for last completed production cycle for all ponds/cages)
IF Q17 is 3 (Producers) ONLY, >>Q149
If ≠>>MODULE G3
NOTE: I am now going to ask you a number of questions about your use of feed during the last complete production cycle. NOTE: Remind the informant: all questions in this module relate to the last complete production cycle.

CAST Baseline Survey | Page 149
149 150 151 151_unit 152 152_unit 153 154 155 156 157
Input used
Did you use
[..input..] during the
last completed production
cycle?
What was the total quantity of [..feed..] used at the farm during
the last completed production
cycle?
What was the average price per
unit of [..feed..]?
(KHR)
Protein content
of comme
rcial feed
From what source did you obtain [..feed..]?
Did you receive
any [..feed..] on credit or as in-kind from
this supplier?
If YES in 155 How much
feed did you receive on credit? % of total Quantity
(Q145)
If YES in 155 Were you
obligated to sell harvested fish to this supplier,
or a trader linked to this
supplier?
CODE
1 YES
AMOUNT UNIT AMOUNT PER..
97:DON’T KNOW
1 FEED DEALER (MANUFACTOR)
1 YES
IF NO>> 1 YES
2 NO 1 KG 1 KG % 2 TRASH Fish TRADER 2 NO >> NEXT ITEM 2 NO
>> NEXT 2 M TONS 2 M TONS 3 OTHER FARMER
ITEM 3 BAG 3 BAG 4 FISHERMEN
99 OTHER
99 OTHER
5. OWN PRODUCTION
(SPECIFY)
(SPECIFY)
6. RICE MILL
97. DON’T KNOW
98 N/A 99. OTHER (SPECIFY)
Sinking feed (pellet) 1
Floating feed (pellet) 2
Trash fish only 3 Homemade feed with trash fish (processed) 4
Homemade feed without trash fish 5
Other (specify) 99
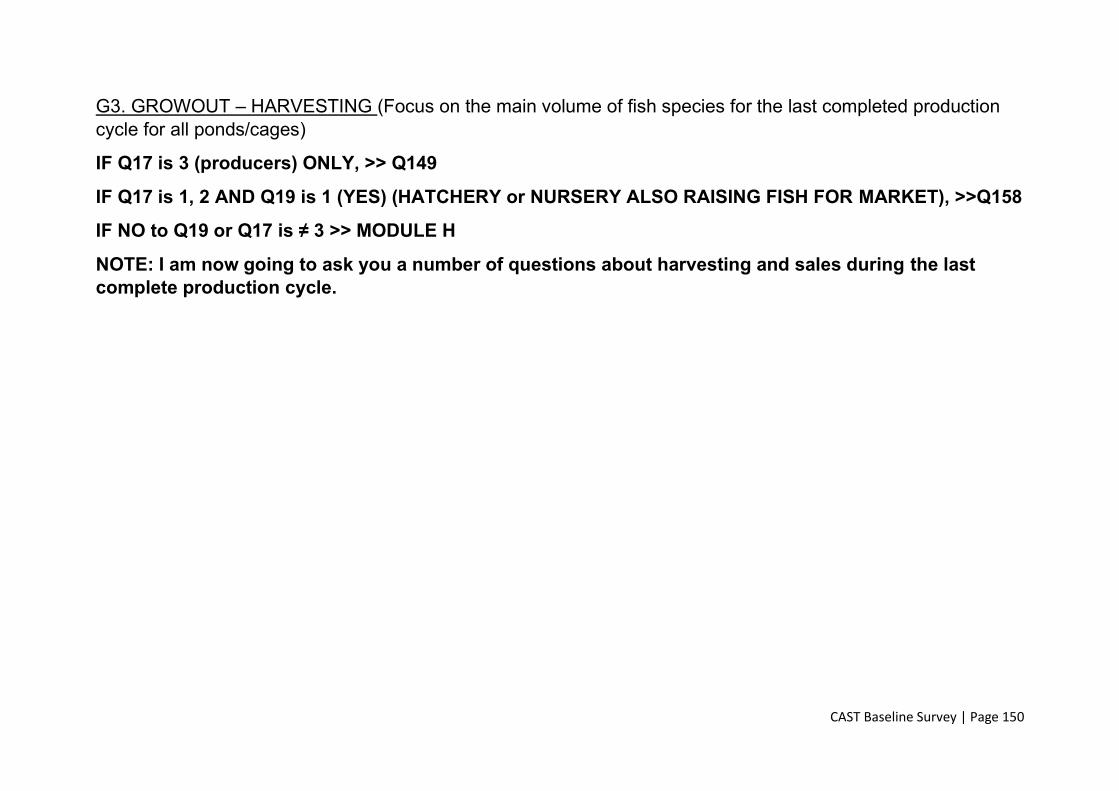
CAST Baseline Survey | Page 150
G3. GROWOUT – HARVESTING (Focus on the main volume of fish species for the last completed production cycle for all ponds/cages)
IF Q17 is 3 (producers) ONLY, >> Q149
IF Q17 is 1, 2 AND Q19 is 1 (YES) (HATCHERY or NURSERY ALSO RAISING FISH FOR MARKET), >>Q158
IF NO to Q19 or Q17 is ≠ 3 >> MODULE H
NOTE: I am now going to ask you a number of questions about harvesting and sales during the last complete production cycle.

CAST Baseline Survey | Page 151
160 162 164 165 Species harvested during the last
completed cycle What was the total
quantity of [..species..] during the last completed production cycle?
What was the average price
received per kg for [..species..] during the last completed production cycle?
Sold as (main product in term of volume)
Over how many days did you harvest the fish?
97: DON’T KNOW 97: DON’T KNOW 1= WHOLE FISH (LIVE) 2=WHOLE FISH DEAD
1= 1 DAY
CODE KG
KHR/KG
3= BE-HEADED & GUTTED
4= DRIED/SMOKED/SALTED
FISH 5= FERMENTED FISH
2= 2 TO 5 DAYS
3= 6 TO 9 DAYS 4= 10 TO 20 DAYS
5= >20 DAYS
Pangasius 1
Clarias/walking catfish 2 Red tilapia 3 Nile tilapia 4 Channa striata 5 Channa micropeltes 6 Annabas 7 Snakeskin gourami 8 Redtail catfish 9 Silver barb 10 Carp species 11 Other (specify) 99 Other (specify) 99 Other (specify) 99
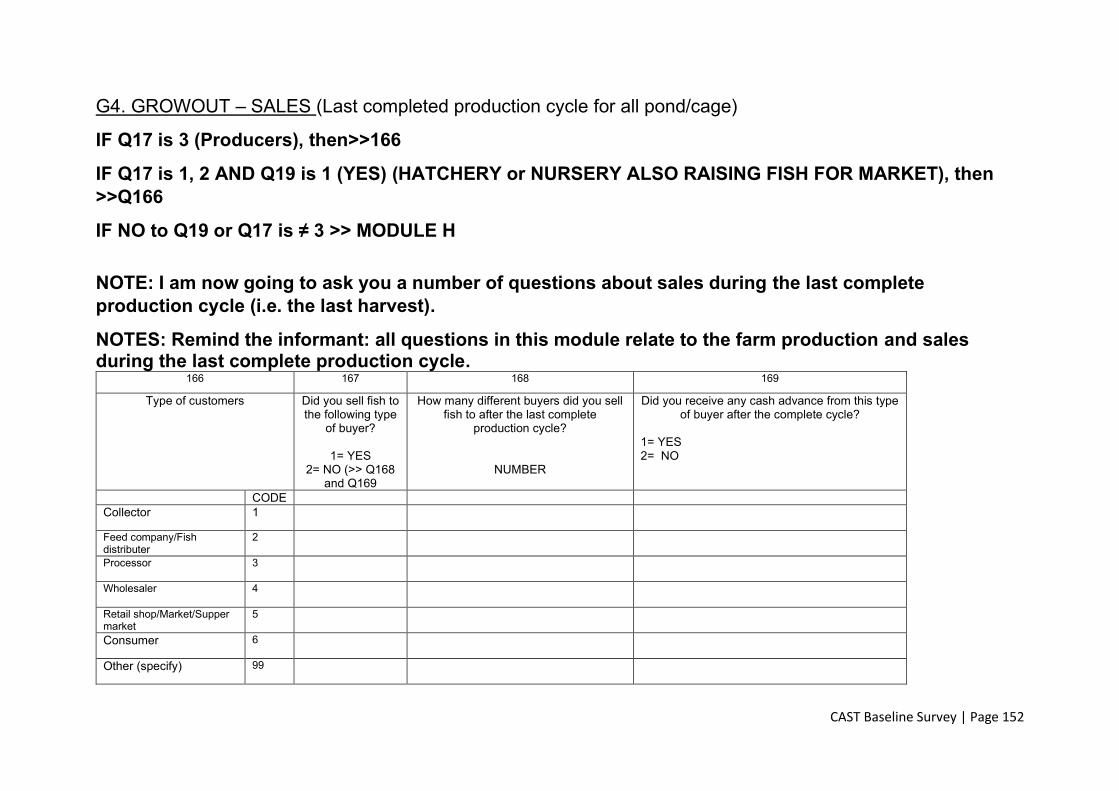
CAST Baseline Survey | Page 152
G4. GROWOUT – SALES (Last completed production cycle for all pond/cage)
IF Q17 is 3 (Producers), then>>166
IF Q17 is 1, 2 AND Q19 is 1 (YES) (HATCHERY or NURSERY ALSO RAISING FISH FOR MARKET), then >>Q166
IF NO to Q19 or Q17 is ≠ 3 >> MODULE H NOTE: I am now going to ask you a number of questions about sales during the last complete production cycle (i.e. the last harvest).
NOTES: Remind the informant: all questions in this module relate to the farm production and sales during the last complete production cycle.
166 167 168 169
Type of customers Did you sell fish to the following type
of buyer?
1= YES 2= NO (>> Q168
and Q169
How many different buyers did you sell fish to after the last complete
production cycle?
NUMBER
Did you receive any cash advance from this type of buyer after the complete cycle?
1= YES 2= NO
CODE
Collector 1
Feed company/Fish distributer
2
Processor 3
Wholesaler 4
Retail shop/Market/Supper market
5
Consumer 6
Other (specify) 99

CAST Baseline Survey | Page 153
NOTE: At this point, we are at the halfway to the end of the interview. You can have a short break before we continue
H. MANAGEMENT PRACTICES
IF Q17 is 1 (Hatchery) >> MODULE H1-H2-H3-H4-H5-H9.1-H10
IF Q17 is 2 (Nursery) >> MODULE H3-H4-H5-H9.1-H10
IF Q17 is 3 (Producer) >> MODULE H5
IF Q17 is 4,5,6 (Collector, Wholesaler, Processor) >> MODULE H9
NOTE: I am now going to ask you a number of questions about your current management techniques in your hatchery.
H1.BROODSTOCK MANAGEMENT
IF Q17 is 1 (Hatchery) 171. Do you know how to estimate the number of fry to transfer to a nursing pond (1=YES; 2= NO; 3= NOT SURE): |____|
172. Do you know the fecundity (number of eggs per fish) of your broodfish (1=YES; 2= NO; 3= NOT SURE): |____|

CAST Baseline Survey | Page 154
174 (Reference from Q93) Origin of broodfish
For species produced in 2018 1= WILD
CODE 2 = PRIVATE CAMBODIAN HATCHERY 3= FIA HATCHERY 4 = OWN SELECTION 5= OUTSIDE OF CAMBODIA 99= OTHER SPECIFY Pangasius 1 Clarias/walking catfish 2 Red tilapia 3 Nile tilapia 4 Channa striata 5 Channa micropeltes 6 Annabas 7 Snakeskin gourami 8 Redtail catfish 9 Silver barb 10 Carp species 11 Other (specify) 99 Other (specify) 99 Other (specify) 99
175. During how many years have you used the same broodfish for breeding? |____| Years (97= DON’T’ KNOW)
176. Are your fingerlings certified or do they have a quality seal? (1= YES; 2= NO):_____________ IF NO>>> Q178 & If 176 is YES>> Q177
177. What certification or quality seal did they receive?_____________________ (97: DON’T’ KNOW)
178. What is the MAIN type of feed you are using for broodfish: (1: FLOATING PELLET; 2: SINKING PELLET; 3: TRASH FISH ONLY; 4: HOMEMADE FEED WITH TRASH FISH (PROCESSED) 5: HOMEMADE FEED WITHOUT TRASH FISH; 6: COMMERCIAL FEED MIXED WITH HOMEMADE FEED WITH OR WITHOUT TRASH FISH; 97: DON’T’ KNOW; 98: N/A; 99: OTHER (SPECIFY)): |____|

CAST Baseline Survey | Page 155
If Q178 is 1 or 2 >>Q179; otherwise >> Module H2
179 What is the percent of protein in the commercial diet? |____| (97 = DON’T’ KNOW)
180. What is the amount of feed given per day in terms of the percent of fish body weight? |____| % of fish body weight (97 = DON’T’ KNOW)
H2. BIOSECURITY MEASURES
IF Q17 is 1 (Hatchery)
NOTE: I am now going to ask you a number of questions about your current biosecurity measures in your hatchery or nursery. 181. For newly-purchased broodfish, do you apply a quarantine period in a separate pond from your current broodfish? (1: YES; 2= NO): |____|
182. Do you check for parasites on broodfish? (1: YES; 2= NO): |____|
183. How often do you clean your hatchery equipment? (1= never; 2= once a year; 3= after every use; 99= other –specify) |____|
184. What do you use to clean nets and/or tanks? (1: soap- detergent; 2: bleach; 3 water only; 99 other –specify) |____|

CAST Baseline Survey | Page 156
H3. NURSING
If Q17 is 1 (Hatchery) or 2 (Nursery)
NOTE: I am now going to ask you a number of questions about your current nursing techniques in your hatchery or nursery. 185. In nursing ponds, how often do you use burned lime or chemicals to control predators? (1= NEVER; 2= SOMETIMES; 3= ALWAYS): |____|
186. What is the stocking density in the nursing pond or tank?_______________ (UNIT: FRY/M2; 97 =DON’T KNOW )
187. How often do you grade the fingerlings before selling? (1= NEVER; 2= SOMETIMES; 3= ALWAYS): |____| If NEVER in 187>> Q189
188. How do you grade the fingerlings? (1: VISUAL CHECK; 2: USING GRADER; 3: BOTH; 99 OTHER SPECIFY) |____|
189. What is the MAIN type of feed you are using for fingerlings? (1: FLOATING PELLET; 2: SINKING PELLET; 3: TRASH FISH ONLY; 4: HOMEMADE FEED WITH TRASH FISH (PROCESSED) 5: HOMEMADE FEED WITHOUT TRASH FISH; 6: COMMERCIAL FEED MIXED WITH HOMEMADE FEED WITH OR WITHOUT TRASH FISH; 7: MANUFACTURED POWDER OR CRUMBLE; 97 =DON’T KNOW; 99:OTHER (SPECIFY )):________________________
H4. TRANSPORT
If Q17 is 1 (Hatchery) or 2 (Nursery) 190. Do you transport fingerlings in (Tick boxes – multiple choice possible):
1: Plastic bags with oxygen: 1 = YES 2 = NO: |____|
2: Plastic bag with air: 1 = YES 2 = NO |____|
3: Hauling tanks with aeration or oxygen: 1 = YES 2 = NO: |____|
4: Car trunk or small dump truck with plastic liner: 1 = YES 2 = NO: |____|

CAST Baseline Survey | Page 157
99: Other (specify):_________
191. Do you stop feeding fingerlings before transporting them? (1=YES; 2= NO): |____| If NO>>Q193
IF 191 is YES >>Q192
192 How many hours before transporting the fingerlings do you stop feeding them? |____| Hours (97 =DON’T KNOW)
Note to enumerators: Enumerators need to enter the answer in number of HOURS. If respondent answers in numbers of days: 1 day = 24 hours. In general, transport of fingerlings is less than 24 hours.
193 Are you in charge of transporting fingerlings? (1= NEVER; 2= SOMETIMES; 3= ALWAYS): |____| if Sometimes or Always>>Q195
IF YES to 193 >>Q194
194 Average mortality rate during transport (%) |____| (97 =DON’T KNOW)
195. On average, how many hours does it take to transport the fingerlings from your nursery pond(s) to their final destination? |____| hours (97 =DON’T KNOW)
Note to enumerators: Enumerators need to enter the answer in number of HOURS. If respondent answers in numbers of days: 1 day = 24 hours. In general, transport of fingerlings is less than 24 hours.
H5. CLIMATE CHANGE
If Q17 is 1 (Hatchery), 2 (Nursery) or 3 (Producers), then>>196
IF Q17 ≠ 1, 2,3 >> MODULE H9
NOTE: I am now going to ask you a number of questions about your management techniques in your farm, regarding flooding, drought and access to water 196. How many times in the last 5 years were your pond(s) or cage(s) affected by flooding? By affected by flooding, we mean that flood waters caused your pond(s) to overflow or damaged your cage(s), resulting in fish escaping. |____| time(s) (97 =DON’T KNOW)

CAST Baseline Survey | Page 158
197. Are your pond(s) fenced? (1=YES/2= NO) |____|
198. How many times in the last 5 years were your pond(s) or cage(s) affected by drought? By affected by drought, we mean that the water level was so low that fish started dying, and fish had to be harvested earlier than the expected harvest date. |____| time (97 =DON’T KNOW)
199. Did you invest in well(s) to supply water? (1=YES; 2= NO): |____| if YES>>201
If 199 is NO>> 200:
200. Why did you NOT invest in a well: |____| (1: LACK OF FUNDS; 2: DO NOT KNOW SOMEONE WHO CAN DIG THE WELL; 3: ARSENIC POLLUTION IN GROUNDWATER; 4: WATER TABLE IS TOO DEEP; 99: OTHER SPECIFY)
If Q17 is 3 (Producers) ONLY, >>201
IF Q17 ≠ 3 >> MODULE H9 201: Do you grow short-cycle fish species? (3 months or less) (1= NEVER; 2= SOMETIMES; 3= ALWAYS): |____|
202: Do you target small harvest sizes (150 grams per fish) to shorten the production cycle? (1= NEVER; 2= SOMETIMES; 3= ALWAYS) |____|
205 Do you move the cage during the dry season? (1=YES; 2= NO;): |____|

CAST Baseline Survey | Page 159
H6. STOCKING AND POND PREPARATION
If Q17 is 3 (Producers) ONLY, then>>Q206
IF Q17 ≠ 3 >> MODULE H9
NOTE: I am now going to ask you a number of questions about the pond preparation and stocking management techniques you currently use on your farm. 206. Do you dry out the pond between production cycles? (1= NEVER; 2= SOMETIMES; 3= ALWAYS): |____|
207. Do you use burned lime or chemicals to control predators? (1= NEVER; 2= SOMETIMES; 3= ALWAYS):_ |____|
208. What is your average mortality rate during transport between hatchery/nursery and your pond? (%) |____| (97 =DON’T KNOW) (Rule: between 0 and 100)
209. Do you stock fingerlings in hapas for nursing? (1= NEVER; 2= SOMETIMES; 3= ALWAYS): |____| _
210. Are your fingerlings certified, or do they have a quality seal? (1= NEVER; 2= SOMETIMES; 3= ALWAYS): |____| if Q210= 2 or3 >>Q211
If 210 is 2-SOMETIMES or 3 ALWAYS >> Q211
211. What certification have your fingerlings received or which quality seal do they have?:______________
H7 WATER MANAGEMENT
If Q17 is 3 (Producers) ONLY, then>> 212
IF Q17 ≠ 3 >> MODULE H9 212: Do you use a Secchi disk to measure water turbidity? (1= NEVER; 2= SOMETIMES; 3= ALWAYS): |____|
213: Do you use a D.O. meter? (1= NEVER; 2= SOMETIMES; 3= ALWAYS): |____|

CAST Baseline Survey | Page 160
214: Do you use a Water quality test kit? (1= NEVER; 2= SOMETIMES; 3= ALWAYS): |____|
215. Do you use agricultural lime or dolomite during pond preparation and/or while fish are being grown? (1= NEVER; 2= SOMETIMES; 3= ALWAYS): |____|
216. Do you use inorganic fertilizer (DAP, TSP, Urea, NPK) to improve water quality during pond preparation and while fish are being grown? (1= NEVER; 2= SOMETIMES; 3= ALWAYS): |____|
217. Do you use organic fertilizer (manure, compost) to improve water quality during pond preparation and while fish are being grown? (1= NEVER; 2= SOMETIMES; 3= ALWAYS): |____|
H8. FEED MANAGEMENT
If Q17 is 3 (Producers) ONLY, then>> 218
IF Q17 ≠ 3 >> MODULE H9 219 Do you use a feed table to estimate how much feed per day you should give to the fish? (1=YES; 2= NO; 97= DON’T KNOW): |____|
220: For the main fish species you raise in your farm, how many different pellet sizes are you are using during a production cycle? |____| Number of pellet size (Rules between 1 and 8) (97= DON’T KNOW)
220.1: Do you know when the commercial feed was manufactured? (1=YES; 2= NO): |____|
221: Do you have dry storage for the commercial feed (1=YES; 2= NO): |____|
222: What is the name of the feed manufacturer you use? (select only one answer) (1: OCIALIS; 2 LY HONG CHOY; 3 AGRI-MASTER; 4 DOLLAR; 5: GREEN FEED 6: CP; 99: OTHER (SPECIFY:_________) 97: DON’T KNOW):__________
223: Are you satisfied with the quality and price of the feed? (1=YES; 2= NO): |____|

CAST Baseline Survey | Page 161
H9. SPS and Standards
H9.1. SPS and Standards for Hatchery and Nursery
If Q17 is 1 (Hatchery), 2 (Nursery), then>>224
NOTE: I am now going to ask you a number of questions about the management techniques you currently use in your hatchery or nursery. It concerns the techniques that affect the quality of your production, and the hygiene standards you currently apply in your hatchery or nursery.
224: Do you follow any technical quality recommendations or do you have a quality seal for your fingerlings? (1=YES; 2= NO; 97= DON’T KNOW): |____| IF NO>>224 MODULE H10
If 224 is “YES”>>Q225
225: specify the name of the recommendation they follow or the quality seal they received:________________
If 224 is “YES” >>Q226
226: From whom did you learn about this recommendation or receive this quality seal? (1= NGO- PROJECT; 2= FIA; 3= BUYER; 97= DON’T KNOW; 99 : OTHER – SPECIFY):________________
227: Do you know the strain of the broodfish you purchased? (1=YES; 2= NO) |____| IF NO>>H10
If YES in 227>> Q228
228: Please specify the name of the strain ____________________

CAST Baseline Survey | Page 162
H9.2. SPS and Standards for Producer
If Q17 is 3 (Producers) ONLY, then>> 229
NOTE: I am now going to ask you a number of questions about the management techniques you currently use in your farm. It concerns the techniques that affect the quality of your production, and the hygiene standards you currently apply in your farm. 229. What do you do with dead fish from the pond? (1: PROCESS AND FEED TO OTHER FISH; 2: SELL; 3: CONSUME; 4: GIVE TO OTHER ANIMALS –DOG, CAT, SWINE ETC…; 5: BURY OR BURN; 99: OTHER SPECIFY): |____|
230. Do you feed fish with waste from your harvest (head, guts etc…)? (1= NEVER; 2= SOMETIMES; 3= ALWAYS): |____|
231: Do you follow any technical quality recommendations or have you received any quality seal for fish production? (1=YES; 2= NO; 97: DON’T KNOW): |____| IF NO>> Q232, Q233
232. specify:___________
233. From whom did you learn about this recommendation or receive this quality seal? (1: NGO- PROJECT; 2: FIA; 3: BUYER; 97= DON’T KNOW; 99: OTHER (SPECIFY) ):________________

CAST Baseline Survey | Page 163
H9.3. SPS and Standards for Collectors, Wholesalers and Processors
If Q17 is 4 (Collector), 5 (Wholesaler); 6 (Processor)
NOTE: I am now going to ask you a number of questions about the management techniques that you currently apply in your company. It concerns the quality of your production, and the hygiene standards that you currently apply in your farm.
234. Do you follow or apply any standard procedures when handling or processing fish? (1=YES ; 2=NO; 97= DON’T KNOW) |_____| If 2NO or 97 DON’T KNOW>>>Q237
If YES in 234 >>Q235
235. Specify the name of the standard procedure ________________
If YES in 234>>Q236
236. Who supports this procedure? (1 GOVERNMENT; 2 PRIVATE COMPANY; 3 NGO; 4: OTHER (SPECIFY); 97: DON’T KNOW) :_____________
237. Do you know any Sanitary and Phyto-Sanitary practices? (1=YES ; 2=NO) |_____|
238. Do you use ice when storing dead fish? (1=YES; 2=NO; 98= N/A) |_____|
239. Do you use ice when transporting dead fish? (1=YES; 2=NO; 98= N/A):_____________ IF NO or 97 in 238 or 239>> Q242
240. During the peak season of the aquaculture fish trade, how many kilograms of ice do you use PER DAY? ______________KG/day (97= DON’T KNOW)
If YES in 238 or 239>>Q241;
241. Do you know if your ice is tested for chemical and microbial contaminants? (1=YES; 2=NO) |_____|
242. Do you use refrigerated trucks for transporting dead fish? (1=YES; 2=NO; 98= N/A):_____________
243. Do you use a refrigerator for chilling and processing fish for storage? (1=YES; 2=NO; 98= N/A ):_____________ if NO or 97 in 243 >>245

CAST Baseline Survey | Page 164
If YES in 243>> Q244
244: How long on average are the fish kept in the refrigerators? ___________________DAYS (97= DON’T KNOW)
245. Do you record (in a book or on a computer) the origin of the fish you purchased? (1=YES; 2=NO; 97= DON’T KNOW) |_____|
H9.4. SPS and Standards for Wholesalers and Processors
If Q17 is 5 (Wholesaler); 6 (Processor) 246. How often do you and your employees wear gloves and masks when handling or processing fish? (1= NEVER; 2= SOMETIMES; 3= ALWAYS) |_____|
247. How often do you and your employees wash and disinfect your hands each time prior to starting their work? (1= NEVER; 2= SOMETIMES; 3= ALWAYS) |_____|
248. Do you have a constant supply of potable water? (1=YES; 2=NO; 97= DON’T KNOW) |_____|
249. Are raw products (e.g. fish) ever in direct contact with the floor? (1=YES; 2=NO; 97= DON’T KNOW) |_____|
250. How many times per week are the facilities and equipment cleaned? |____| times (97: DON’T KNOW)
251. What do you use to clean equipment? (1: SOAP- DETERGENT; 2: BLEACH; 3 WATER ONLY; 99 OTHER (SPECIFY)) ________________
252. Do you have specific containers for storing the waste from processing fish? (1=YES; 2=NO; 97= DON’T KNOW) |_____| If Q252 is NO or 97>>Q254
If Q252 is YES>>Q253
253. Are those containers disinfected after each use? (1=YES; 2=NO; 97= DON’T KNOW) |_____|
254. Do you label your product with identification? (address, name of your business) (1=YES; 2=NO; 98= N/A)? |_____|
If NO>>Q258- Module H10 & If YES in Q254>> Q255
255. Do you add a manufacturing date on the product label? (1=YES; 2=NO) |_____|

CAST Baseline Survey | Page 165
256. Do you add an expiration date on the product label? (1=YES; 2=NO) |_____|
257. Do you add the origin of the fish on the product label? (1=YES; 2=NO) |_____|
H10. BUSINESS SKILLS
For beneficiaries: if Q17 is 1 Hatchery, 2 Nursery, 3 Producers, 4 Collectors, 5 Wholesalers, 6 Processors>> 259
NOTE: I am now going to ask you a number of questions about the business management techniques you currently use in your company or farm. It concerns how you plan your investment and finance.
260. Do you record the volume and costs of your inputs in a logbook? (1= YES; 2= NO) |____|
261. Do you record your sales? (1=YES; 2=NO) |____|
If Q17 is 1 (Hatcheries); 2 (Nurseries); 3 (Producers), >>262
If ≠ >>270 262 Do you know how much it costs to produce your fingerlings or fish? (1=YES; 2= NO): |____| if Q262 NO>>264
If 262 is YES>> Q263
263. How much (KHR/ fish):____________ unit on average? (for producer)
263.1. How much (KHR/ fish):____________ unit on average? (for hatchery/nursery)
264. When you start the crop, do you have a target date to have fingerlings or fish ready? (1= NEVER; 2= SOMETIMES; 3= ALWAYS) |____|

CAST Baseline Survey | Page 166
265. What type of contract/agreement do you have with buyers? (1= WRITTEN; 2= ORAL; 3= NO CONTRACT) |_____| if Q265 is 3, >>>Q266-Q269
266. How many contracts/agreements were you able to fill in 2018? |____| (97: DON’T KNOW)
267. What was the average volume of each contract/agreement (for producers) in 2018? |____| (KG OF FISH PER CONTRACT)
267.1. What was the average volume of each contract/agreement (for hatchery/nursery) in 2018? |____| (# OF FINGERLINGS PER CONTRACT)
268. Did these contracts/agreements (in 2018) include delivery dates ? (1= NEVER; 2= SOMETIMES; 3= ALWAYS) |_____|
269. Did these contracts/agreements (in 2018) include the size or weight of fingerlings/fish? (1= NEVER; 2= SOMETIMES; 3= ALWAYS) |_____|
270. In 2018 did you limit your production because you could not sell all of your fingerlings/fish? (1= NEVER; 2= SOMETIMES; 3= ALWAYS) |_____|
If Q17 is 3 (Producers), >>271
If≠>>273
271: Do you have issues in reaching the minimum amount the buyer is requesting? (1= NEVER; 2= SOMETIMES; 3= ALWAYS) |_____|
272: What is the minimum volume for one transaction when you sell in bulk? |____| kg/transaction (97= DON’T KNOW)
If Q17 is 4 (Collector), 5 (Wholesaler); 6 (Processor), then> Q273-Q290
If ≠>> MODULE I 273: Do you know in advance how much raw material (fish) you need to purchase for the month to come?
(1= NEVER; 2= SOMETIMES; 3= ALWAYS) |____|
274: Do you know in advance the cash return of your activity for the month to come? (1= NEVER; 2= SOMETIMES; 3= ALWAYS) |____|

CAST Baseline Survey | Page 167
275: Do you know the person or company that will purchase your product (fish or processed) before even sourcing the product?
(1= NEVER; 2= SOMETIMES; 3= ALWAYS): |____|
Sourcing the material for trade and processing
NOTE: I am now going to ask you a number of questions about your current management techniques regarding buying fish from farmers or collectors.
276. How many fish farmers do you work with directly (buying directly from their farm)? |____| ( 97= DON’T KNOW; 98= N/A)
277. How many fish buyers/collectors do you work with? |____| ( 97= DON’T KNOW; 98= N/A )
278. How many fish importers do you work with? |____| (97= DON’T KNOW; 98= N/A )
279. Do you loan cash or in-kind materials (feed, fingerlings) to fish farmers at the beginning of the cycle preceding the sales? (1= NEVER; 2= SOMETIMES; 3= ALWAYS) |____| If NEVER or 97 to Q279>>281
If ALWAYS or SOMETIMES in 279 >> Q280
280. Is the loan in: 1= CASH; 2=KIND; 3=BOTH? |____|
Selling fish & processed fish
NOTE: I am now going to ask you a number of questions about your current management techniques regarding sales and trade of fish. I will ask about live fish, chilled (dead on ice) fish and processed fish. The following questions concern live, chilled (dead on ice) and processed fish

CAST Baseline Survey | Page 168
281. To how many regular buyers do you re-sell aquaculture fish or processed fish? |____| (97: DON’T KNOW)
282. Do you have a contract/agreement with buyers (e.g. retailers, distributors) to sell them certain quantities of fish at certain times and for certain prices? (1= NEVER; 2= SOMETIMES; 3= ALWAYS) |____| IF 282 NEVER >> Q288
If 282 is ALWAYS or SOMETIMES >> Q283
283. What type of contract/agreement do you have with buyers? (1WRITTEN; 2 ORAL; 3 NO CONTRACT) |_____| If 283=3, Skip 284-286
284. How many contracts/agreements did you fill in 2018? |____| (97= DON’T KNOW)
285. What was the average volume of fish sold per contract/agreement? (KG OF FISH PER CONTRACT): |____| (98=N/A)
285.1. What was the average volume of processed fish sold per contract/agreement (KG OF PROCESSED FISH PER CONTRACT): |____| (98=N/A)
286. Do the contracts/agreements include delivery dates? |_____| (1-YES 2-NO 97= DON’T KNOW)
287: Do you receive a loan from buyers at the beginning of the cycle preceding the sales? (1= NEVER; 2= SOMETIMES; 3= ALWAYS) |_____|
288: Do you limit your trade because you cannot source enough aquaculture fish? (1= NEVER; 2= SOMETIMES; 3= ALWAYS): |____|
(If NEVER>>MODULE I) & If SOMETIMES/ALWAYS in Q288 >> 289
289: In which month of 2018 did the shortage of aquaculture fish start? |____| MM (1 JANUARY; 2 FEBRUARY; 3 MARCH; 4 APRIL; 5 MAY; 6 JUNE; 7 JULY; 8 AUGUST; 9 SEPTEMBER; 10 OCTOBER; 11 NOVEMBER; 12 DECEMBER)
290: In which month of 2018 did the shortage of aquaculture fish end? |____| MM (1 JANUARY; 2 FEBRUARY; 3 MARCH; 4 APRIL; 5 MAY; 6 JUNE; 7 JULY; 8 AUGUST; 9 SEPTEMBER; 10 OCTOBER; 11 NOVEMBER; 12 DECEMBER)

CAST Baseline Survey | Page 169
MODULE I. TRADE OF NON-PROCESSED & PROCESSED FISH
If Q17 is 4 (Collector) or 5 (Wholesaler), >> I1 (Q291)
NOTE: I am now going to ask you a number of questions about your fish trade in 2018 only. The following questions concern ONLY chilled (dead on ice) and live fish from aquaculture. We are talking about 2018 only and about aquaculture FISH only.
291.0. IF Q17 is 6 (Processor), >> Are you also buying and selling wet or chilled fish? 1-YES 2-NO |_____|, if YES the I1-Q291, if NO>>> I3
FOR chilled (dead on ice) and live fish from aquaculture ONLY (not processed fish)
I1 CALENDAR
291: When did the peak season for Cambodian aquaculture fish trading start in 2018? |____| MM (1 JANUARY; 2 FEBRUARY; 3 MARCH; 4 APRIL; 5 MAY; 6 JUNE; 7 JULY; 8 AUGUST; 9 SEPTEMBER; 10 OCTOBER; 11 NOVEMBER; 12 DECEMBER 97-DON’T KNOW; 98= N/A)
292: When did the peak season for Cambodian aquaculture fish trading end in 2018? |____| MM (1 JANUARY; 2 FEBRUARY; 3 MARCH; 4 APRIL; 5 MAY; 6 JUNE; 7 JULY; 8 AUGUST; 9 SEPTEMBER; 10 OCTOBER; 11 NOVEMBER; 12 DECEMBER 97-DON’T KNOW; 98= N/A)
293: Rank the top THREE Aquaculture fish species in volume for wet or chilled market in 2018 (1 PANGASIUS; 2 WALKING CATFISH- CLARIAS; 3 TILAPIA; 4 CARP SPECIES; 5 SILVER BARB; 6 CHANNA STRIATA; 7 CHANNA MICROPELTES; 97 DON’T KNOW; 99 OTHER SPECIFY):
293.1. 1st rank: ______________
293.2. 2nd rank: ___________
293.3. 3rd rank: ____________
294: What was your maximum storage capacity in tons in 2018? |_________| tons

CAST Baseline Survey | Page 170
I2. COLLECTOR AND WHOLESALER BUYING AND SELLING ACTIVITIES
NOTE: The following questions concern last year – 2018. They concern buying and wholesale activities of chilled and live fish.
296 297 298 299 300 301 302
What was the total quantity of fish
purchased in 2018 (both wild and
aquaculture, local and imports)? (Metric tons)
From the total volume of fish
purchased (Q296), how much comes
from Cambodian
Aquaculture in 2018?
What was the total the
quantity of fish sold in 2018? (Metric tons)
What was the MINIMUM
price sold per kg in 2018?
What was the
MAXIMUM price sold per kg in
2018
What was the total
value of fish sold in 2018
Where is the main destination of the production
(1: THIS VILLAGE; 2: THIS COMMUNE; 3: NEIGHBORING
COMMUNE; 4: PHNOM PENH; 5: OTHER DISTRICT IN THE
PROVINCE; 6: OTHER PROVINCE; 7: EXPORT; 97:DON’T KNOW)
METRIC TONS METRIC TONS NUMBER KHR/KG KHR/KG KHR CODE 97:DON’T KNOW 97:DON’T
KNOW 97:DON’T
KNOW
ALL FISH live or chilled (dead on ice) 1
Pre-processed (gutted, head removed) 2
Other (specify) 99
303: Of the total volume of chilled (dead on ice) and live (wet) aquaculture fish you sold: what was the percentage of live fish:__________% (97=DON’T KNOW)
304: Of the total chilled (dead on ice) and live (wet) aquaculture fish you purchased: what was the percentage of fish permanently lost between procurement and sale due to spoilage/ rotting or similar __________% (97=DON’T KNOW)
305: Of the total chilled (dead on ice) and live aquaculture fish you purchased: what was the percentage imported from Vietnam or Thailand:_____________% (97=DON’T KNOW)
306. How often do you pre-process your fish before re-selling (1= NEVER; 2= SOMETIMES; 3= ALWAYS) |_____|, If Q306 is 1 NEVER or 97>>> MODULE I3 & If Q306 is 2 or 3 SOMETIMES OR ALWAYS >>307

CAST Baseline Survey | Page 171
307. What type of pre-processing do you do? (1= GUTTING; 2= REMOVING HEAD; 3= BOTH; 99 = OTHER SPECIFY):______________
308. In 2018, were you able to source enough aquaculture fish from Cambodian producers? (1= YES; 2= NO; 98= N/A) |_____|
309. What is your minimum threshold volume for one transaction to buy fish? _________________Kg/transaction (97-DON’T KNOW; 98 N/A)
I3. PROCESSING ACTVITY
If Q17 is 6 (Processor), then >> I3
If Q17 is 5 (Wholesaler), and Q20 =3 >> >> MODULE I3 , if Q20 = 1 >> MODULE J
If Q17 is 4 (Collector) >> Module J
NOTE: I am now going to ask you a number of questions about your fish processing activities in 2018 using AQUACULTURE FISH only. The following questions concern ONLY processing of fish from aquaculture (pond or cage).
NOTE: The following questions concern processing of fish from aquaculture during the year 2018 only 310: When did the peak season for aquaculture fish processing start in 2018? |____| (MM) (1 JANUARY; 2 FEBRUARY; 3 MARCH; 4 APRIL; 5 MAY; 6 JUNE; 7 JULY; 8 AUGUST; 9 SEPTEMBER; 10 OCTOBER; 11 NOVEMBER; 12 DECEMBER; 97-DON’T KNOW; 98= N/A)
311: When did the peak season for aquaculture fish processing end in 2018? |____| (MM) (1 JANUARY; 2 FEBRUARY; 3 MARCH; 4 APRIL; 5 MAY; 6 JUNE; 7 JULY; 8 AUGUST; 9 SEPTEMBER; 10 OCTOBER; 11 NOVEMBER; 12 DECEMBER; 97-DON’T KNOW; 98= N/A)
312: What was your maximum storage capacity in tons in 2018? |_________| tons

CAST Baseline Survey | Page 172
Rank the top two aquaculture fish processed products (in volume) for the processed fish market. Please also note the main species used.
313 314.1 315.1 Products Code RANK the most important (i.e. 1st) product in terms
of volume produced in 2018 (1= FIRST; 98= N/A)
Applies to which fish species – select the one main species per product in terms of volume (1st product)
(1 PANGASIUS; 2 WALKING CATFISH/CLARIAS; 3 TILAPIA; 4 CARP SPECIES; 5 SILVER BARB; 6 CHANNA STRIATA; 7 CHANNA
MICROPELTES; 99 OTHER SPECIFY; 97 DON’T KNOW) Salted/ dried 1 Fillets 2 Fermented Pangasius 3 Smoked 4 Fish paste/Prahoc 5 Mam 6 Other (specify) 99
314.2 315.2 Products Code RANK the second most important (i.e. 2nd) product
in terms of volume produced in 2018 (2= SECOND; 98= N/A)
Applies to which fish species – select the one main species per product in terms of volume (2nd product)
(1 PANGASIUS; 2 WALKING CATFISH/CLARIAS; 3 TILAPIA; 4 CARP SPECIES; 5 SILVER BARB; 6 CHANNA STRIATA; 7 CHANNA
MICROPELTES; 99 OTHER SPECIFY; 97 DON’T KNOW) Salted / dried 1 Fillets 2 Fermented Pangasius 3 Smoked 4 Fish paste/Prahoc 5 Mam 6 Other (specify) 99

CAST Baseline Survey | Page 173
For the total volume of fish you processed:
317 318 319 320 321 322 323
What was the total
quantity of fish (raw material)
purchased in 2018?
Of this purchased fish, how much
came from Cambodian
Aquaculture in 2018
What was the total
quantity of processed fish (final
product) sold in 2018?
What was the average
MINIMUM price sold per kg in
2018?
What was the average
MAXIMUM price sold per
kg in 2018
What was the total value of
fish sold in 2018
Where is the main destination of the production
(1: THIS VILLAGE; 2: THIS COMMUNE; 3: NEIGHBORING
COMMUNE; 4: PHNOM PENH; 5: OTHER DISTRICT IN THE
PROVINCE; 6: OTHER PROVINCE; 7: EXPORT; 97:DON’T KNOW)
Metric tons Metric tons Metric tons KHR/KG KHR/KG KHR 97:DON’T
KNOW 97:DON’T KNOW 97:DON’T
KNOW
324: Of the total aquaculture fish you purchased for processing, what was the percentage of fish permanently lost between procurement and sale due to spoilage or similar? __________%

CAST Baseline Survey | Page 174
MODULE J: QUALITY POST HARVEST
If Q17 is 4 (Collector), 5 (Wholesaler); 6 (Processor), then Q325
If Q17 is ≠ >> MODULE K
NOTE: I am now going to ask you a number of questions about the quality of the fish and the criteria used to evaluate its quality. The following questions concern aquaculture FISH ONLY.
J1. QUALITY OF FISH PURCHASED
326 327 What are the quality criteria
used when purchasing aquaculture fish? (MULTIPLE)
To what extent are those criteria met? If YES in Q326
Code (1: NEVER; 2: SOMETIMES; 3: AVERAGE; 4: OFTEN; 5:ALWAYS)
Minimum weight of the fish 1 Homogeneous size of the fish 2 Survival rate of live fish 3 White flesh 4 Absence of chemical use in pond 5 Absence of trash fish use as feed 6 No criteria 7
328. Based on your experience or the above criteria, how would you rate the quality of the CAMBODIAN PRODUCED AQUACULTURE FISH you usually purchase? (1: VERY LOW; 2: LOW; 3: AVERAGE; 4: GOOD; 5: VERY GOOD; 97 DON’T KNOW): |______|

CAST Baseline Survey | Page 175
J2. QUALITY OF RAW OR PROCESSED FISH – SELLING FISH
NOTE: For the main fish products you sell, what are the main quality criteria applied by the buyers and consumers? 329. What was the main raw and processed fish product you sold in 2018? (1= LIVE FISH; 2= CHILLED/DEAD FISH; 3= SALTED / DRIED; 4= SMOKED; 5= FISH PASTE; 6= MAM; 7= PRAHOC ; 8= FILLETS; 9= FERMENTED PANGASIUS; 99= OTHER SPECIFY): |______|
If 329 is 1 or 2>>330
330: Is minimum size & minimum weight a criteria? (1=YES; 2= NO; 97= DON’T KNOW) |_____|
If 329is 2>>332
332: Is freshness (Eyes – Gill color and form) a criteria? (1=YES; 2= NO; 97= DON’T KNOW) |_____|
If 329 is 3-9 or 99>> Q334
335. What are the quality criteria for the product (MULTIPLE)
Characteristics of the processed product
Code
Absence of chemical use during processing
1
No bones 2 No scales 3 Khmer labelling 4 Individual package 5

CAST Baseline Survey | Page 176
K. KNOWLEDGE AND TRAINING
If Q17 is 1 (Hatcheries), 2 (Nurseries), 3(Producers), 4 (Collectors), 5 (Wholesalers), 6 (Processors); 9 (Feed distributors) >>Q336
If Q17 is ≠ >> MODULE L
NOTE: I am now going to ask you a number of questions about the trainings you received in aquaculture and fish handling and processing. I will also ask you question about your different sources of information about aquaculture and fish handling and processing.
K1. TRAINING 336. When was your last training on aquaculture or fish marketing or processing? YEAR_________(97 DON’T KNOW, 98 N/A) IF 98, >> Q338
337. What was the topic of the last training on aquaculture that you attended? (select only one answer): (1 POND MANAGEMENT; 2 FEED MANAGEMENT; 3: BUSINESS AND MARKETING; 4: HATCHERIES, NURSERIES TECHNIQUES, 5: PROCESSING, 6: HYGIENE AND STANDARD; 7: TRANSPORT AND STOCKING; 8: ACCESS TO FINANCIAL INSTITUTION; 97: DON’T KNOW; 99: OTHER (SPECIFY): |______|
338. Who delivered the training? (1= HARVEST, 2= FAIEX –JICA; 3=WORLDFISH; 4= HKI; 5= FIA; 6= PADEK; 7= CONSERVATION INTERNATIONAL; 8= IFAD; 97= DON’T KNOW; 99= OTHER SPECIFY) |______| ________________
339. In the past or currently, were you the beneficiary of any aquaculture project? (1=YES; 2= NO):_________ If NO in 339>>Q341
340. If so, in what year did/will the project end? ______________
341. What was the name of the implementer/NAME of project? (1= HARVEST, 2= FAIEX –JICA; 3=WORLDFISH; 4= HKI; 97 DON’T KNOW; 99 OTHER SPECIFY) |______| ________________

CAST Baseline Survey | Page 177
K2: INFORMATION SOURCE
NOTE: I am now going to ask you a number of questions about your different sources of information related to aquaculture, fish trading and processing. This is about where you learn new techniques, where you access price and market information, and where you learn about new rules and regulations related to aquaculture fish trading and processing.
342 343 344 345 Have you ever received information
about the following? Which is your MAIN source of information?
When did you most recently receive information
1= YES 1.INPUT COMPANY OR RETAILER 1 EVERY DAY/ON-DEMAND 2 = NO 2. HATCHERY AND NURSERIES 2 THIS WEEK 3. FIA 3 THIS MONTH >> NEXT 4. NGOS/PROJECT 4 LAST 1-6 MONTHS ITEM 5. YOU TUBE 5 LAST 6-12 MONTHS 6. FACEBOOK AND SOCIAL MEDIA 97 DON’T KNOW 7. TV 8. RADIO 9. FISH BUYERS, WHOLESALERS,
PROCESSORS
10. SMS SERVICE 11. DEMONSTRATION FARM 12. OTHER FARMER CODE 99. OTHER SPECIFY Fingerling quality and prices 1 Input availability and prices 2 Fish farming techniques (feed, water management)
3
Fish prices (live and dead on ice fish market)
4
Processed fish prices 5 Fish quality and standard 6 Technical support (training) 7

CAST Baseline Survey | Page 178
L. FINANCE
If Q17 is 1 (Hatcheries),2 (Nurseries), 3(Producers), 4 (Collectors), 5 (Wholesalers), 6 (Processors), 9 (Feed distributors) then>>Q346
If Q17 is ≠ >>MODULE M
NOTE: I am now going to ask you a number of questions about loans and access to finance for investing in your aquaculture and fish trading and processing activities. 346. Did the Company or the farm receive any credit in the last 5 years to invest in aquaculture activities, wholesale or processing fish? 1=YES; 2= NO |______| (if NO, >>Q347-Q355).
346.1. Did you or your company or your farm receive any credit in 2018 to invest in aquaculture activities, wholesale or processing fish? 1=YES; 2= NO |______|(if NO, >>Q347-Q355).
NOTE: Please note that loans can be in cash or in–kind. Examples of in-kind loans are: feed, fingerlings or fuel.

CAST Baseline Survey | Page 179
347 348 349 350 351 352 353
Loan No
Source Purpose of the loan Amount Interest rate
Duration of loan How must this loan be repaid?
Amount Unit % Unit Number Unit 1 = MFI / BANK 1= BUYING FISH FEED 97:
DON’T KNOW
97: DON’T KNOW
97: DON’T KNOW
1= IN CASH
2 = HATCHERIES – NURSERIES
2= BUYING FISH SEED 1= KHR 1 = PER MONTH
1= MONTH 2= IN KIND
3= FEED DEALER 3= BUYING LAND FOR POND, WAREHOUSE OR BUYING CAGE
2 = KG 2= PER YEAR
2= YEARS 3 = CASH & IN KIND
4 = FISH COLLECTOR 4= REPAIRING POND/CAGE
3 = M TONS
5 = FISH PROCESSOR/WHOLESALER
5 = BUYING EQUIPMENT 4 = THOUSAND FINGERLINGS
6 = AGRICULTURAL INPUT SUPPLIERS
6 = RENTING LABOUR 99= OTHER (SPECIFY)
7= PRIVATE MONEYLENDER
7= BUYING VEHICLE (incl. boat)
8= RELATIVES/FRIENDS 8 = DIGGING A WELL
99 = OTHER (SPECIFY) _____
9= BUYING RAW MATERIAL FOR PROCESSING
99= OTHER AQUACULTURE-RELATED EXPENSE
1
2
3
4
5
354: Did you use the loans for the intended purpose, or was the loan invested somewhere else?
(1=YES; 2= NO; 97= DON’T KNOW): |____|
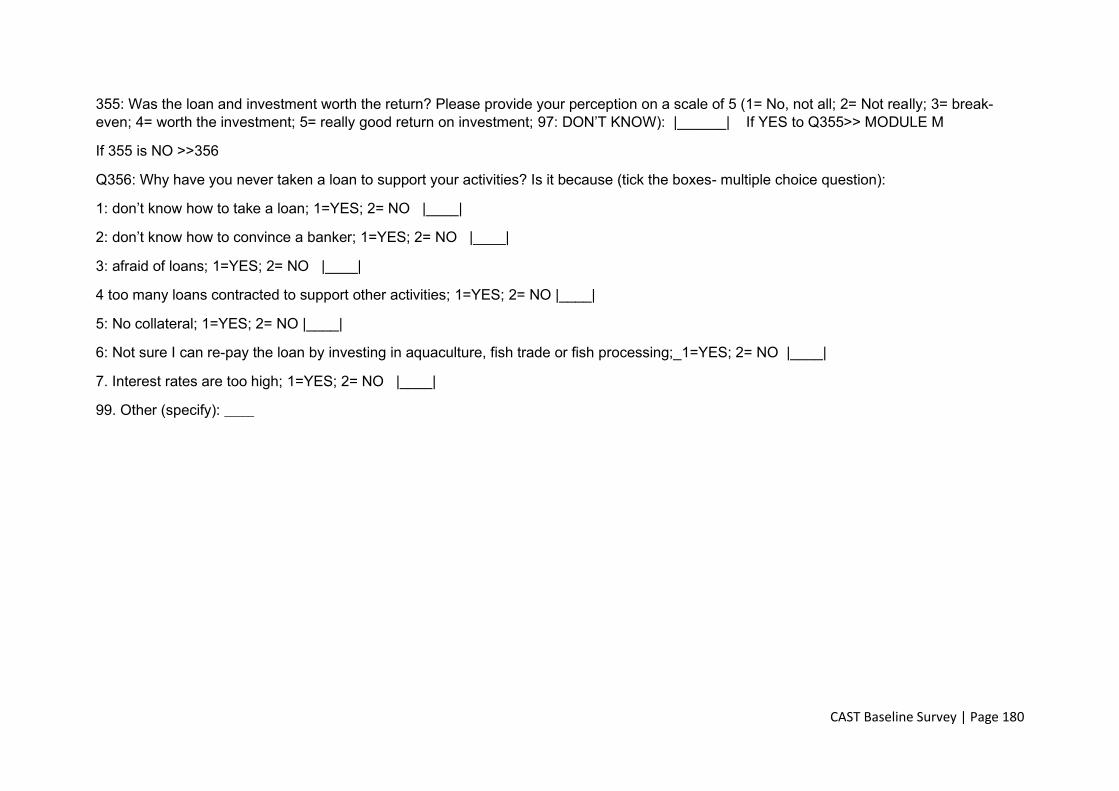
CAST Baseline Survey | Page 180
355: Was the loan and investment worth the return? Please provide your perception on a scale of 5 (1= No, not all; 2= Not really; 3= break-even; 4= worth the investment; 5= really good return on investment; 97: DON’T KNOW): |______| If YES to Q355>> MODULE M
If 355 is NO >>356
Q356: Why have you never taken a loan to support your activities? Is it because (tick the boxes- multiple choice question):
1: don’t know how to take a loan; 1=YES; 2= NO |____|
2: don’t know how to convince a banker; 1=YES; 2= NO |____|
3: afraid of loans; 1=YES; 2= NO |____|
4 too many loans contracted to support other activities; 1=YES; 2= NO |____|
5: No collateral; 1=YES; 2= NO |____|
6: Not sure I can re-pay the loan by investing in aquaculture, fish trade or fish processing;_1=YES; 2= NO |____|
7. Interest rates are too high; 1=YES; 2= NO |____|
99. Other (specify): _____

CAST Baseline Survey | Page 181
MODULE M: FEED MILLS
If Q17 is 7 (FEED MILL), >>Q357
NOTE: I am now going to ask you a number of questions about your feed manufacturing and aquaculture feed import activities. This is only for the year 2018, and only for activities in Cambodia.
357. Are you producing aquaculture feed in Cambodia? (1=YES; 2= NO) |_____| If NO to Q357 >>Q358-Q361
If YES in 357>>Q362
358. Do you plan to invest in an aquaculture feed mill in Cambodia in the next 5 years (1=YES; 2= NO; 3=MAYBE; 97= DON’T KNOW) |_____|
359. How high should be the demand for aquaculture feed in Cambodia (in thousand metric tons per year) to make you decide to invest in an aquaculture feed mill? ____________Thousand metric tons per year? (97=DON’T KNOW; 98=N/A)
360. Did you import aquaculture feed to Cambodia in 2018? (1=YES; 2= NO) |_____| If NO>>363
If YES in Q360>> Q361
361. From where did you import this aquaculture feed in 2018? (1=VIETNAM; 2=THAILAND; 3=OTHER (specify)) |_____|
362. How many aquaculture feed mills did you operate in 2018? |_____| (number)
363. Are you producing poultry or pig feed in Cambodia? (1=YES; 2= NO) |_____| If NO>>Q365
If YES in Q363>> Q364
364. How many poultry and pig feed mills did you operate in 2018? |_____|

CAST Baseline Survey | Page 182
M1: IMPROVED MANAGEMENT PRACTICES
IF YES in Q357 or YES in Q360 >>Q365
If NO in Q357 AND NO in Q360 >>MODULE M5
NOTE: I am now going to ask you a number of questions about your marketing, distribution and labelling of aquaculture feed. This is only for the year 2018, and only for activities in Cambodia. M1.1.Marketing and distribution
365. Can your customers place orders online (WebApp)? (1=YES; 2= NO) |_____|
M2.2.Value-added processing
- 366. Are the feed bags and instructions on the feed bag labelled in Khmer language (1=YES; 2= NO; 97= DON’T KNOW) |_____| - 367. Do the feed bags indicate the manufacturing date (1=YES; 2= NO; 97= DON’T KNOW) |_____| - 368. Do you indicate on the bag the recommended ration or feeding guide in percentage of fish biomass (fish weigh) (i.e. if fish is 100 g
– the daily amount of feed per day is Z% of the fish weight) (1=YES; 2= NO; 97= DON’T KNOW) |_____| M2.3. Other
- 369. Do you implement pest controls in the manufacture and storage places of the raw and finished products (1=YES; 2= NO; 97= DON’T KNOW) |_____|

CAST Baseline Survey | Page 183
M2. AQUAFEED QUALITY
IF YES in Q357 or YES in Q360 >>Q371
If NO in Q357 AND NO in Q360 >>MODULE M5
NOTE: I am now going to ask you a number of questions about the characteristics of your aquaculture feed.
370 371 372 373 374 375 Do you sell
pellets for [species]?
Type How many different sizes of pellets for the same species
Max crude protein content
Lowest crude protein
Moisture content
CODE 1= YES 2= NO >> NEXT
1 FLOATING 2 SINKING 97 DON’T KNOW
Number (max 8)
% 97 DON’T KNOW
% 97 DON’T KNOW
% 97 DON’T KNOW
Tilapia 1 Pangasius 2 Snakehead 3 Walking catfish 4 Carps 5
376. In 2018, what was your major source of soymeal in volume? (1: USA; 2: ARGENTINA; 3: BRAZIL; 97 DON’T KNOW; 98 N/A; 99: OTHER (SPECIFY)): |_____| __________________
377. In 2018, what was your major source of fishmeal in volume? (1: PERU; 2: THAILAND; 3 SPAIN; 97 DON’T KNOW; 98 N/A; 99: OTHER (SPECIFY)): |_____| _______________

CAST Baseline Survey | Page 184
M3. INTERNATIONAL Standards
IF YES in Q357 or YES in Q360 >>Q378
If NO in Q357 AND NO in Q360 >>MODULE M5
NOTE: I am now going to ask you a number of questions about international standards followed by your company when producing aquaculture feed. 378. Is the aquaculture feed you import or produce compliant and certified with any of the following standards (tick the box – multiple choices)
1. ISO 9001: Quality management: 1=YES; 2= NO |_____| 2. ISO 14001: Environment System Certification: 1=YES; 2= NO |_____| 3. ISO 22000: Food safety management: 1=YES; 2= NO |_____| 4. HACCP Hazard Analysis and Critical Control Points: 1=YES; 2= NO |_____| 5. Best Aquaculture Practices: 1=YES; 2= NO |_____| 6. Global G.A.P. standard1=YES; 2= NO |_____| 7. None

CAST Baseline Survey | Page 185
M4. VOLUME AND VALUE OF SALES OF FIRM
IF YES in Q357 or YES in Q360 >>Q380
If NO in Q357 AND NO in Q360 >>MODULE M5
NOTE: I am now going to ask you a number of questions about your aquaculture feed trade and sales in 2018.
380 381 382 383
What was the total quantity of produced or imported aquafeed in 2018?
What was total quantity sold in 2018?
What was the average price sold per metric ton in 2018?
Total value of sales
Metric tons Metric tons KHR/ M tons Million KHR 97 DON’T KNOW 97 DON’T KNOW 97 DON’T KNOW
M5. MARKET INFORMATION
NOTE: I am now going to ask you a number of questions about how you market animal feed (including aquafeed). 384. How do you inform your customers about animal feed (including aquafeed) price information?

CAST Baseline Survey | Page 186
Rank the two main communication channels that you use to inform customers about animal feed price. What are the most- and second most-important communication channels?
385.1 385.2 What is the 1st main communication channel? What is the 2nd main communication channel? 1.DISTRIBUTORS AT PROVINCE-DISTRICT LEVEL
1.DISTRIBUTORS AT PROVINCE-DISTRICT LEVEL
2. HATCHERY AND NURSERIES 2. HATCHERY AND NURSERIES 6. FACEBOOK AND SOCIAL MEDIA 6. FACEBOOK AND SOCIAL MEDIA 7. TV 7. TV 8. RADIO 8. RADIO 9. FISH BUYER, WHOLESALER 9. FISH BUYER, WHOLESALER 11. SMS SERVICE 11. SMS SERVICE 12. DEMONSTRATION FARM/FAIR 12. DEMONSTRATION FARM/FAIR 97: DON’T KNOW 97: DON’T KNOW 98: N/A 98: N/A 99: OTHER SPECIFY 99: OTHER SPECIFY
385.1: 1st Communication channel:_______
385.2: 2nd Communication channel:_______

CAST Baseline Survey | Page 187
M6. BUSINESS PLAN
IF YES in Q357 or YES in Q360 >>Q386
If NO in Q357 AND NO in Q360 >> MODULE M7
NOTE: I am now going to ask you a number of questions about business management practices, and about how you plan your investment. We would also like to know your opinion about the demand for aquaculture feed in Cambodia.
Note: Questions below concern ONLY AQUAFEED 386. What is your estimation of the local demand for aqua-feed by volume at the country level (Cambodia) in 2018? (97= DON’T KNOW ) |__________| Thousand metric tons/ year
387. To be competitive in Cambodian markets, how much do you estimate should be the production cost of 1 kg of feed for pangasius?
(97= DON’T KNOW) |_____| KHR/kg
388. How many retailers/distributors in Cambodia did you work with to sell aquaculture feed in 2018? (97= DON’T KNOW) |_____|
389. How many farmers & hatcheries in Cambodia did you work with directly in 2018? (97= DON’T KNOW) |_____|
390. In 2018, how many WRITTEN contracts/ agreements with retailers/distributors and farmers were you able to fill? (97= DON’T KNOW) |_____|
391. In 2018, how many ORAL contracts/ agreements with retailers/distributors and farmers were you able to fill? (97= DON’T KNOW) |_____|
392. Do you provide loans in-kind (feed) to retailers/distributors or farmers? (1= NEVER; 2= SOMETIMES; 3= ALWAYS) |_____|
393. Do you provide technical assistance to fish farmers, with your technician directly going to the farm? (1= NEVER; 2= SOMETIMES; 3= ALWAYS) |_____| If ALWAYS/SOMETIMES in Q393>>>Q395-Q396 & If NEVER in Q393>>>Q394
394. Are you interested to do so in the future? (1=YES; 2= NO; 97= DON’T KNOW) |_____|
395. How many technicians did you have with the ability to provide support to farmers in 2018? (97= DON’T KNOW) |_____| number of technicians

CAST Baseline Survey | Page 188
396. How many farmers were supported by those technicians in 2018? (97= DON’T KNOW) |_____| number of farmers supported
M7. FINANCE 397. Have you contracted or do you currently contract loans to produce feed (aquaculture, pig, poultry) in Cambodia? (1=YES; 2= NO; 97= DON’T KNOW) |_____|
If NO or Don’t Know >> End of Survey
If YES in 397>>Q398
398. Is it a loan from? (1= BANKING INSTITUTION; 2= NON-BANKING INSTITUTION; 3 BOTH) |_____|
END OF SURVEY FOR FEED MILLS

CAST Baseline Survey | Page 189
MODULE N: MICRO-FINANCE AND FINANCE INSTITUTIONS
If Q17 is 8 (Micro-Finance and Banking), then Q399
NOTE: I am now going to ask you a number of questions about loan and banking activities that support aquaculture in Cambodia.
NOTE: These questions are related to the activities of your organization/bank at the provincial level in 2018
400 401 402_min 402_max 403 404 405 406 407
Aquaculture activities
Code Have you disbursed loans to support
aquaculture activities in
2018?
How many loans were distributed
that supported Cambodian
aquaculture?
What is the minimum amount?
KHR/ loan
What is the maximum amount?
KHR/ loan
What is the average amount?
KHR/ loan
What is average
interest rate?
Unit of interest rate
What is the average
duration of those loans?
(month)
Of the disbursed
loans, what is the percentage
of loans re-paid on time?
1= YES NUMBER KHR KHR KHR % 1. PER MONTH Month % 2= NO 97: DON’T
KNOW 97: DON’T
KNOW 97: DON’T
KNOW 97: DON’T
KNOW 97: DON’T
KNOW 2. PER YEAR 97: DON’T
KNOW 97: DON’T
KNOW 2 >>NEXT
Line
Fish farmers 1
Hatcheries and nurseries
2
Fish buyers and wholesalers
3
Fish processors
4
Feed distributors
5
408: What is the main limitation for you to disburse loans to hatcheries/nurseries? (1 HIGH RISK OF NO REPAYMENT: NOT PROFITABLE ENOUGH; 2 LIMITED COLLATERAL; 3 AGAINST INTERNAL POLICY (NO LOAN TO HACTCHERIES/NURSERIES); 4 NO DEMAND; 97: DON’T KNOW; 99 OTHERS – SPECIFY)) |___________|

CAST Baseline Survey | Page 190
409: What is the main limitation for you to disburse loans to fish farmers? (1 HIGH RISK OF NO REPAYMENT: NOT PROFITABLE ENOUGH; 2 LIMITED COLLATERAL; 3 AGAINST INTERNAL POLICY (NO LOAN TO FISH FARMER); 4 NO DEMAND; 97: DON’T KNOW; 99 OTHERS (SPECIFY)) |_____| _________________
410: What is the main limitation for you to disburse loans to wholesalers/collectors? (1 HIGH RISK OF NO REPAYMENT: NOT PROFITABLE ENOUGH; 2 LIMITED COLLATERAL; 3 AGAINST INTERNAL POLICY (NO LOAN TO FISH WHOLESALERS/COLLECTORS); 4 NO DEMAND; 97: DON’T KNOW; 99 OTHERS (SPECIFY)) |_____| _________________
411: What is the main limitation for you to disburse loans to fish processors? (1 HIGH RISK OF NO REPAYMENT: NOT PROFITABLE ENOUGH; 2 LIMITED COLLATERAL; 3 AGAINST INTERNAL POLICY (NO LOAN TO FISH PROCESSORS); 4 NO DEMAND; 97: DON’T KNOW; 99 OTHERS (SPECIFY)) |_____| _________________
412: What is the main limitation for you to disburse loans to aquafeed distributors? (1 HIGH RISK OF NO REPAYMENT: NOT PROFITABLE ENOUGH; 2 LIMITED COLLATERAL; 3 AGAINST INTERNAL POLICY (NO LOAN TO AQUAFEED DISTRIBUTOR); 4 NO DEMAND; 97: DON’T KNOW; 99 OTHERS(SPECIFY)) |_____| _________________
END OF SURVEY MICRO _FINANCE AND FINANCE INSTITUTIONS

CAST Baseline Survey | Page 191
MODULE O: FEED DISTRIBUTORS
If Q17 is 9 (Feed distributors), then >>Q413
NOTE: I am now going to ask you a number of questions about your aquaculture feed retailing activities.
MODULE O.1. Type of aquaculture feed
NOTE: I am now going to ask you a number of questions about the product you sell. We will focus in particular on aquaculture feed.
413. Are you selling the following products (tick the boxes; multiple choices are possible):
Code Feed for pigs 1 Medicine for pigs 2 Feed for chicken 3 Medicine for chicken 4 Feed for fish 5 Antibiotics for fish 6 Pro-biotics and additives for fish feed 7 Fertilizer such DAP (Di amino Phosphate) or Triple Super Phosphate (TSP) 8 Agricultural lime (Ca Co3) or Dolomite 9 Burned lime (CaCo) 10

CAST Baseline Survey | Page 192
NOTE: I am now going to ask you a number of questions about the aquaculture feed you sell.
414. When did you start selling aquaculture feed? |____| (YYYY)_YEARS
415. How many brands of aquaculture feed are you selling? |____|
416. What are the brands (tick the boxes; multiple choice possible)
1. Ocialis 1=YES; 2= NO |_____| 2. CP 1=YES; 2= NO |_____| 3. Ly Hong Choy 1=YES; 2= NO |_____| 4. Agri-Master 1=YES; 2= NO |_____| 5. Dollar 1=YES; 2= NO |_____| 6. Green Feed 1=YES; 2= NO |_____| 7. Doctor Nupak 1=YES; 2= NO |_____| 8. Other (specify):___________

CAST Baseline Survey | Page 193
Can you tell us more about the aquaculture feed you are selling? For each type of aquaculture feed, can you tell us:
417 418 419 420 421 422 423 424 Do you sell feeds for [species]?
CODE Type How many different sizes of pellets for the same species
Max crude protein content
Lowest crude protein
Moisture content
Most preferred brand for each
species
Main reason of success and preference of
farmers for this brand
1= YES 2= NO >> NEXT
Number % % %
1 FLOATING 97 DON’T KNOW
97 DON’T KNOW
97 DON’T KNOW
1.OCIALIS 1. AVAILABILITY
2 SINKING 97 DON’T KNOW
98 N/A 98 N/A 98 N/A 2. CP 2. QUALITY
97 DON’T KNOW 3. LY HONG CHOY 3. COMPETITIVE PRICE 98: N/A 4. AGRIMASTER 4. IN KIND LOANS 5. DOLLAR 99. OTHER (SPECIFY) 6. GREEN FEED 7. Doctor Nupak 99. OTHER
(SPECIFY)
Tilapia 1 Pangasius 2 Snakehead 3 Walking catfish/clarias 4 Carps 5 425.1. Can you rank the best/highest selling in terms of volume of feed? Is it feed for: 1: TILAPIA FEED; 2. PANGASIUS FEED; 3. SNAKEHEAD FEED; 4. CLARIAS- CATFISH FEED; 5. CARP FEED; 98. N/A; 99. OTHER SPECIFY_______):__________
425.2. Can you rank the 2nd best/highest selling in terms of volume of feed? Is it feed for: 1: TILAPIA FEED; 2. PANGASIUS FEED; 3. SNAKEHEAD FEED; 4. CLARIAS- CATFISH FEED; 5. CARP FEED; 98. N/A; 99. OTHER SPECIFY_______):_________
425.3. Can you rank the 3rd best/highest selling in terms of volume of feed? Is it feed for: 1: TILAPIA FEED; 2. PANGASIUS FEED; 3. SNAKEHEAD FEED; 4. CLARIAS- CATFISH FEED; 5. CARP FEED; 98. N/A; 99. OTHER SPECIFY_______):_________

CAST Baseline Survey | Page 194
MODULE O2. Seasonality and volume
NOTE: I am now going to ask you a number of questions about your trade and sales of aquaculture feed in 2018. 426. In which month did the peak season for selling aquaculture feed start in 2018?_ |____| (MM) (1 JANUARY; 2 FEBRUARY; 3 MARCH; 4 APRIL; 5 MAY; 6 JUNE; 7 JULY; 8 AUGUST; 9 SEPTEMBER; 10 OCTOBER; 11 NOVEMBER; 12 DECEMBER; 97-DON’T KNOW; 98= N/A) 427. When did the peak season for selling aquaculture feed end in 2018? |____| _(MM) (1 JANUARY; 2 FEBRUARY; 3 MARCH; 4 APRIL; 5 MAY; 6 JUNE; 7 JULY; 8 AUGUST; 9 SEPTEMBER; 10 OCTOBER; 11 NOVEMBER; 12 DECEMBER; 97-DON’T KNOW; 98= N/A) 428. What was the total quantity of aquaculture feed sold during the peak season in 2018? (tons) |____| _tons 97-DON’T KNOW 429. What was the total quantity of aquaculture-feed sold during the low season in 2018? (tons) |____| _tons 97-DON’T KNOW 430. Compared to 2015, how was the volume of sales of aquaculture in 2018 (1= MUCH HIGHER, MORE THAN DOUBLE; 2= HIGHER: BETWEEN 1.5 TIMES TO DOUBLE; 3= SIMILAR VOLUME; 4= LOWER: IT DECREASED TO HALF THE VOLUME; 5= SIGNIFICANTLY LOWER WITH LESS THAN HALF; 97: DON’T KNOW): |____| 431.How do you explain this trend? (Multiple choice):
1. More farmers 1=YES; 2= NO |_____| 2. Less farmers 1=YES; 2= NO |_____| 3. Farmers are using more feed now 1=YES; 2= NO |_____| 4. Farmer are using less feed 1=YES; 2= NO |_____| 5. Feed is more available than before 1=YES; 2= NO |_____| 6. Feed is less available than before 1=YES; 2= NO |_____| 7. More feed sellers going to the farm directly 1=YES; 2= NO |_____| 8. Less feed sellers going to the farm directly 1=YES; 2= NO |_____| 9. Price of feed is cheaper 1=YES; 2= NO |_____| 10. Price of feed is higher 1=YES; 2= NO |_____| 11. Don’t know – cannot explain 1=YES; 2= NO |_____|

CAST Baseline Survey | Page 195
432. What was the average selling price of aquaculture feed pellets in KHR per kilogram in 2018?_ |________| _KHR/kg (97= DON’T KNOW)
433. What was the highest price of aquaculture feed in KHR per kilogram in 2018?_ |_______| KHR/kg (97= DON’T KNOW)
434. What was the lowest price of aquaculture feed in KHR per kilogram in 2018? |____| KHR/kg (97= DON’T KNOW)
435. What was the total value of aquaculture feed sales in 2018 (KHR)? |____| KHR (97= DON’T KNOW)
MODULE O3: Quality and standards
NOTE: I am now going to ask you a number of questions about the international standards of the feed you sell 436. Is at least one of the brands of aquaculture feed you sell compliant and certified with any of the following standards? (tick the box – multiple choice)
1. ISO 9001: Quality management: 1=YES; 2= NO; 97= DON’T KNOW |_____| 2. ISO 14001: Environment System Certification: 1=YES; 2= NO; 97= DON’T KNOW |_____| 3. ISO 22000 Food safety management: 1=YES; 2= NO; 97= DON’T KNOW |_____| 4. HACCP Hazard Analysis and Critical Control Points: 1=YES; 2= NO; 97= DON’T KNOW |_____| 5. Best Aquaculture Practices: 1=YES; 2= NO; 97= DON’T KNOW |_____| 6. Global G.A.P. standard: 1=YES; 2= NO; 97= DON’T KNOW |_____| 7. None
437. Are the feed bags stored on the floor directly (1=YES; 2= NO; 97= DON’T KNOW) |_____| 438. Are the feed bags in contact with the wall (1=YES; 2= NO; 97= DON’T KNOW) |_____| 439. How often do you check the manufacturing date of the aquaculture feed you sell? (1=NEVER; 2= SOMETIMES; 3= ALWAYS) |_____| MODULE O4: Market information and knowledge sharing

CAST Baseline Survey | Page 196
NOTE: I am now going to ask you a number of questions about your knowledge of aquaculture. I will also ask about how you share this knowledge with the fish farmers purchasing feed in your shop. 440. Did you have technician(s) to support the farmers in 2018? (1=YES; 2= NO) |_____| If NO>>> Q443 If YES >> Q441 441. How many technicians were working with you in 2018? |_____| Number of technicians
442. In total, how many farmers were supported by those technicians in 2018? (97-DON’T KNOW) |____| Number of farmers
443. Did you yourself provide technical support to farmers in 2018? (1=YES; 2= NO) |____| if NO>> Q448
If YES to 443 >>Q444 444. Did you provide technical advice at the shop in 2018? (1=YES; 2= NO) |_____| 445. Did you provide technical advice at the farm in 2018? (1=YES; 2= NO) |_____| if NO in Q445>> Q448 If YES to 445 >>Q446
446. How many farmers did you support at the farm directly in 2018? |____| Number of farmers
If YES in Q440 or YES in Q443 >> Q447 IF NO in Q440 or YES in Q443>>Q448 447. If you or technician(s) are providing technical support, from whom did you acquire the knowledge? (multiple choice)
1. Feed company training 1=YES; 2= NO |_____| 2. FiA training 1=YES; 2= NO |_____| 3. NGO or project training 1=YES; 2= NO |_____| 4. Learning by yourself (through experience) 1=YES; 2= NO |_____| 5. Media (internet, radio, TV) 1=YES; 2= NO |_____|
99. Other specify __________ 448. (If NO in Q440 & Q443) Are you interested to do so in the future? (1=YES; 2= NO; 97= DON’T KNOW) |_____|
449. When was your last training on aquaculture techniques? YEAR_________(97 DON’T KNOW, 98 N/A)

CAST Baseline Survey | Page 197
450. Who delivered the training? (1= HARVEST, 2= FAIEX –JICA; 3=WORLDFISH; 4= HKI; 5= FIA; 6: PADEK; 7: CONSERVATION INTERNATIONAL; 8: IFAD; 97 DON’T KNOW 99: OTHER SPECIFY) |_____|
451. Do you know how to use a feed table to know how much feed per day the farmer should give to the fish? (1=YES; 2= NO; 97= DON’T KNOW) |_____|
452. Do you provide feed tables to the farmers? (1=YES; 2= NO; 97= DON’T KNOW) |_____|
453. How many different pellet sizes are you recommending farmers to use during one production cycle?______________ number of pellet sizes (Rules between 1 and 8) (97= DON’T KNOW)
Module O5. Business management
NOTE: I am now going to ask you a number of questions about the way you manage your shop. I will also ask you about the types of contracts you have with aquaculture feed buyers and feed companies.
455. How often do you record the volumes and costs of your inputs in a log book? (1=NEVER; 2=SOMETIMES; 3=ALWAYS; 97= DON’T KNOW) |_____|
456. How often do you record your sales? (1=NEVER; 2=SOMETIMES; 3=ALWAYS; 97= DON’T KNOW) |_____|
NOTE: I am now going to ask you a number of questions about the way you manage your shop, and about the types of contracts you have with aquaculture feed buyers. 457. What type of contract/agreement do you have with fish farmers: 1 WRITTEN; 2 ORAL; 3 NO CONTRACT |_____|
458. What type of contract/agreement do you have with smaller distributors: 1 WRITTEN; 2 ORAL; 3 NO CONTRACT |_____| IF 3 in Q457 and Q458 >> Q461
IF 1 or 2 in in Q457 or Q458 >> Q459

CAST Baseline Survey | Page 198
459. How many contracts/agreements were you able to fill in 2018? ____________ (97: DON’T KNOW)
460. What is the average volume of each contract/agreement in 2018? |_____| Kg
461. How often do you give a cash advance or in kind (feed) at the beginning of the cycle preceding the sales? (1=NEVER; 2=SOMETIMES; 3=ALWAYS; 97= DON’T KNOW) |_____| IF NEVER or 97 in Q461 >> Q467
If SOMETIMES/ALWAYS in Q461>>>Q462
462. How frequently is the loan repaid in full at harvest? (1= NEVER; 2= SOMETIMES; 3= ALWAYS) |_____|
463. How frequently is the loan repaid in installments? (1= NEVER; 2= SOMETIMES; 3= ALWAYS) |_____|
464. What is the difference in the price of 1 kg of feed when paying cash versus asking for a loan in kind? : _________KHR/kg
465. When contracting a loan in kind, do the fish farmers need to sell the harvest to you or the feed company? (1= NEVER; 2= SOMETIMES; 3= ALWAYS) |_____|
466. In 2018, what percent of your total sales (in volume) of aquaculture feed is subject to in-kind loans?_____________% (97= DON’T KNOW; 98 =N/A)

CAST Baseline Survey | Page 199
NOTE: I am now going to ask you a number of questions about the way you manage your shop, and about the types of contracts you have with feed mills and feed companies
467. How many firms (feed brands) were you in contract with in 2018? |_____| number of firms
468. Are the contracts exclusive with a single firm? (1=YES; 2= NO; 98 N/A) |_____|
469. What type of contract/agreement do you have with feed firms? (1 WRITTEN; 2 ORAL; 3 NO CONTRACT) |_____| if 3 NO >>>Q474
470. What is the average volume of each contract/agreement per year? |_____| (Unit: Tons of aquaculture feed per year; 97= DON’T KNOW; 98=N/A)
471. Does the contract/agreement stipulate a minimum volume of aquaculture feed to sell? (1=YES; 2= NO; 98= N/A) |_____| IF 2 or 98 in Q471 >> Q474
If YES 1 in Q471>>>Q472
472. What was the minimum sales target per month during the peak sales period in 2018? |__________| tons per month (97: DON’T KNOW)
473. Did you face any issues to achieving the minimum sales target in the peak period in 2018? (1=YES; 2= NO; 98= N/A) |_____|
474. Does the company give you the feed in advance, and you pay the company back, depending on your sales? (1=YES; 2= NO ) |_____|
476. How often does the company provide technical support to you and your customers? (1= NEVER; 2= SOMETIMES; 3= ALWAYS) |_____|
477. Do you know in advance how much fish feed you need for the month to come? (1=YES; 2= NO) |_____|
478. Do you know in advance the cash return of your activity for the month to come? (1= NEVER; 2= SOMETIMES; 3= ALWAYS) |_____|
END OF SURVEY

CAST Baseline Survey | Page 200
Key Informant Questionnaires Introduction to use before starting the Interview
Hello, everyone. My name is <state name> and I work with WorldFish. We have been contracted by the American Soybean Association’s (ASA) World Initiative for Soy in Human Health (WISHH) program to conduct research into the Cambodian aquaculture sector for a newly funded project called Commercialization of Aquaculture for Sustainable Trade – Cambodia, or CAST. CAST is a 5-year project funded by the United States Department of Agriculture (USDA) that will provide targeted support to the commercial aquaculture development sector in Cambodia. The project plans to build the industry by linking different actors within the value chain while also improving the technical and managerial practices of numerous value chain actors.
The information we gather from you today will help CAST to better understand the barriers and facilitators to producing and selling fish in Cambodia. Your feedback will help project leadership to adjust programming to meet the needs of the sector and adjust to realities on the ground. We value your perspective and are thankful for your willingness to speak with us about these important topics. Before we begin I would like to go over a few basic ground rules for our discussion.
• This session is being audiotaped to help with note taking. Please speak in a voice as loud as mine, so
that the microphone can pick up what you are saying. • Your answers will be kept confidential. Your name will not be connected to any of your responses and
the information collected will only be used for the purposes of this study. • You may decline to answer any question or end our conversation at any time.
Do you have any questions before we get started?

CAST Baseline Survey | Page 201
CAST PARTNERS, DEVELOPMENT PARTNERS, UNIVERSITIES AND GOVERNMENT
Topic 1. Aquaculture Industry
Constraints and opportunities to develop commercial aquaculture in Cambodia
Let’s talk about your vision of the aquaculture sector in Cambodia and what you believe are the constraints and opportunities for developing the commercial aquaculture in this country. Based on your understanding of the sector and past experiences:
1. What changes should be made the aquaculture system in Cambodia to increase the profitability of producers and hatcheries?
o Prompt for59: technical improvement; market access; introduction of high quality genetic strains.
2. Please share your thoughts about the current level of communication and information sharing between actors within the Cambodian value chain. Provide 1-2 examples.
o Prompt for: information and communication regarding price, quality requirements, and access to new technologies (or lack thereof)
o What should be done to improve communication and information sharing within the Cambodian aquaculture industry?
3. What do you think about the quality of fingerlings and aquaculture feed currently available in Cambodia? o What needs to happen to increase access to these commodities?
4. What do you think about the performance of the extension service and private support systems in the
Cambodian aquaculture sector? o What steps should be taken improve the performance of these services and/or systems?
5. What, if anything, should to be done to help producers, hatcheries but also processors and post-harvest
actors access financial services in Cambodia?
6. What opportunities currently exist for improvements in the production, transport, and processing of fish within the aquaculture value chain?
o What is needed to improve the performance of fish processing and/or the post-harvest storage and handling of Cambodian-sourced fish?
▪ Prompt for: issues related to certain forms of processing (e.g., fermented, smoked, dried, filleted, skinned) and storage capacity and quality control
7. From your point of view, what are the aquaculture processed products that have the highest potential for growth in Cambodia? Please explain.
Constraints and opportunities to develop a traceability and quality control system, such as sanitary and phytosanitary standards (SPS), for aquaculture products.
Let’s talk about SPS and quality control system and what you believe are the constraints and opportunities to develop and enforce a quality control and traceability system in the aquaculture sector. Based on your understanding of the sector and past experiences:
8. What regulations should be put in place to ensure that quality inputs are available throughout the aquaculture value chain?
o Prompt for: feed produced in Cambodia or imported and/or quality control/biosecurity measures
9. What should be done to improve the regulation of quality standards for aquaculture products with the aquaculture value chain?
59 Prompts should only be used if the respondent has a hard time articulating what, in the case, should be done to improve the profitability of the aquaculture system

CAST Baseline Survey | Page 202
o Prompt for: standards for the different processed products and fish on ice or frozen o Based on your experience with other sectors (e.g., vegetables), what, if any, additional regulations
should be developed for the aquaculture industry in Cambodia?
10. We are also interested in your opinion about current regulations about farm management practices throughout the aquaculture value chain.
o What is the current status of regulations about farm management practices and what, if anything, do you think should be improved?
▪ Prompt for: the use of chemicals and/or antibiotics and the release of water into the environment
11. What do you think are the main constraints to developing a traceability system for aquaculture products in
Cambodia?
12. What do you think are the main opportunities to developing a traceability system for aquaculture products in Cambodia (e.g., species, consumer group target, existing experiences)?
• Which existing value chain actors should we involve in the conversation about developing a traceability system for this purpose?
• What new or addition value chain actors should we involve in this discussion?
Topic 2: Project implementation
Let’s talk now about CAST project and other project in the aquaculture sector.
Support services needed & awareness
13. What are other initiatives or development projects that are currently supporting the aquaculture industry in Cambodia?
o What do you think CAST should do to create positive synergy with these other projects? o What, if any, additional services or activities do you think would be of value to the different
beneficiaries of the project?

CAST Baseline Survey | Page 203
PROJECT BENEFICIARIES
1. HATCHERIES & NURSERIES Topic 2. Program Implementation
Let’s talk about the CAST project and what you believe are the barriers and facilitators to implementing the project. Based on your understanding of the sector and past experiences:
Barrier and facilitators to program implementation
1. What are the main barriers to increasing the quantity and improving the quality of fingerlings produced on your farm each year?
• Prompt for: at least 1-2 barriers to increasing the quantity of fingerlings and 1-2 barriers to improving the quality of fingerlings
2. What are the main barriers that you face when trying to market your fingerlings?
• Prompt for: access to marketing information, access to customer, transportation capacity, competitive price
3. What, if any, recommendations do you have for potential solutions to these barriers? o Prompt for: capacity building (e.g. training), coordination with other actors of the value chain (e.g.,
communication and exchange), infrastructure (e.g., access to road, electricity), and investment capacity (e.g., access to loan and financial mechanism)
o Why do you think these barriers have not been addressed in the past?
4. What, if any, facilitators currently exist that could help you to produce and market your fingerlings? • Prompt for: access to quality seed/clean water, help from neighbors or family members, returning
customers/word of mouth, proximity to road/transportation
5. [Question for hatcheries only] Would it be possible for you to become a hatchery that only sells directly to nurseries?
• If YES, what would you do to accomplish this? [collect information about facilitators] • If NO, what would prohibit you from doing so? [collect information about barriers]
6. [Question for hatcheries only] We are interested in learning more about a) your interest in transforming
your hatchery into a nursery and b) what you would need to do to make this transformation possible. • On a scale of 1-10, how interested are you in operating as a nursery only? • What, if any, facilitators currently exist that could help you transform your nursery into a hatchery? • What, if any, barriers would you likely encounter if you tried to transform your hatchery into a
nursery? Assumption: a number of hatcheries will have some ponds reserved for fingerlings that they do not sell, so they will already be operating in some capacity as nurseries
Support services needed & awareness
Let’s talk about the CAST project and what type of service and support the project can provide.
7. Do you currently receive or have you in the past received support services from any other aquaculture projects?
a. If YES, please describe the type of services you received and the duration for which you received these services (e.g., one day, two months, three years)
i. What kind of support services have you found most and least useful for your business? b. If NO, please describe the type of services that you think would most benefit your business (e.g.,

CAST Baseline Survey | Page 204
technical training, access to quality inputs and genetic material such as brood fish; connection with customers, access to market information).
i. What, if any, barriers do you think have prevented you from receiving these services from other aquaculture projects?
8. [Question for hatcheries only] What support services do you think CAST should provide to hatcheries operating in Cambodia? Please explain. [Respondent should answer this question first before interviewer asks the following three questions about additional support]
a) What, if any, additional support is needed to improve the quality of your seed? b) What, if any, additional support is needed to increase volume of production? c) What, if any, additional support is needed to improve marketing and access to market?
9. [Question for nurseries only] What support services do you think CAST should provide to nurseries operating
in Cambodia? Please explain. [Respondent should answer this question first before interviewer asks the following three questions about additional support]
a) What, if any, additional support is needed to improve the quality of fingerlings? b) What, if any, additional support is needed to increase volume of production? c) What, if any, additional support is needed to improve marketing and access to market?
10. [Question for nurseries only] What support services do you think CAST should offer to Cambodian feed mills
and hatcheries to help improve the quality of their feed and seed? a. How do you think that these interventions would increase the quantity and improve the quality of
fingerlings produced on your farm?
Topic 3. Relationship building
Let’s talk about access to knowledge and how you interact with other actors of the aquaculture sector.
11. How and from where do you get information about the market for fingerlings in Cambodia? • Do you currently have enough information about the market for Cambodian fingerlings?
o If YES, what has enabled you to have this information? [collect information about opportunities] o If NO, what has prohibited you from accessing this information? [collect information about
constraints]
12. What steps do you think should be taken to ensure that hatcheries and nurseries have up-to-date information about the current market for fingerlings in Cambodia?
13. Please describe your current relationship with your customers. [Provide the respondent with 1-2 minutes to
describe their consumer base and current relationships with their customers] o Would you say that you have a good working relationship with individual consumers and local
businesses? ▪ If YES, why? [collect information about opportunities] ▪ If NO, why not? [collect information about constraints]
o In what areas do you think that your relationship with individual consumers and businesses could be improved?
14. Do you have strong relationships with other hatcheries and nurseries in Cambodia?
o If YES, who do you have these relationships with and what has helped you to build these relationships? [collect information about opportunities]
o If NO, what has prohibited you from forming strong relationships with other hatcheries and nurseries? [collect information about constraints]
15. What, if anything, do you think could be done to improve your relationship with other hatcheries and nurseries?
16. Would you join and participate in an Aquaculture Association or a similar social network to improve

CAST Baseline Survey | Page 205
linkages and collaboration between value chain actors? o If YES, why? [collect information about opportunities] o If NO, why not? [collect information about constraints]
17. From your point of view, what should be the overall goal(s) of this Association?

CAST Baseline Survey | Page 206
1. PRODUCERS Topic 2. Program Implementation
Let’s talk about the CAST project and what you believe are the barriers and facilitators to implementing the project. Based on your understanding of the sector and past experiences:
Barrier and facilitators to program implementation
1. What are the main barriers to increasing the quantity and improving the quality of fish produced on your farm each year?
• Prompt for: at least 1-2 barriers to increasing the quantity of fish and 1-2 barriers for improving the quality of fish
2. What are the main barriers that you face when trying to market your fish?
• Prompt for: access to marketing information, access to customers, transportation capacity, competitive prices.
3. What, if any, recommendations do you have for potential solutions to these barriers? o Prompt for: capacity building (e.g. training), coordination with other actors of the value chain (e.g.,
communication and exchange), infrastructure (e.g., access to road, electricity), and investment capacity (e.g., access to loan and financial mechanism)
o Why do you think these barriers have not been addressed in the past?
4. What, if any, facilitators currently exist that help you to produce and market your fish? • Prompt for: access to quality fingerlings/clean water, help from neighbors or family members,
returning customers/word of mouth, proximity to road/transportation Support services needed & awareness
Let’s talk about the CAST project and what type of service and support the project can provide.
5. Do you currently receive or have you in the past received support services from any other aquaculture projects?
a. If YES, please describe the type of services you received and the duration for which you received these services (e.g., one day, two months, three years)
i. What kind of support services have you found most and least useful for your business? b. If NO, please describe the type of services that you think would most benefit your business (e.g.,
access to market information; technical training on feeding, pond preparation, business management training).
ii. What, if any, barriers do you think have prevented you from receiving these services from other aquaculture projects?
6. What support services do you think CAST should offer to aquaculture producers operating in Cambodia? Please explain. [Respondent should answer this question first before interviewer asks the following three questions about additional support]
a) What, if any, additional support is needed to improve the quality of fish? b) What, if any, additional support is needed to increase volume of production? c) What, if any, additional support is needed to improve marketing and access to market?
7. What support services do think CAST should offer to Cambodian hatcheries and nurseries to help improve
the quality of their products? • How do you think that these interventions would increase the quantity and improve the quality of
fish produced from your farm?
Topic 3. Relationship building
Let’s talk about access to knowledge and how you interact with other actors of the aquaculture sector.
8. How and from where do you get information about the market for fish in Cambodia?

CAST Baseline Survey | Page 207
• Do you currently have enough information about the market for Cambodian fish? o If YES, what has enabled you to have this information? [collect information about opportunities] o If NO, what has prohibited you from accessing this information? [collect information about
constraints]
9. What steps do you think should be taken to ensure that aquaculture producers have up-to-date information about the current market for fish in Cambodia?
10. Please describe your current relationship with your customers. [Provide the respondent with 1-2 minutes to
describe their consumer base and current relationships with their customers] o Would you say that you have a good working relationship with individual consumers and local
businesses? ▪ If YES, why? [collect information about opportunities] ▪ If NO, why not? [collect information about constraints]
o In what areas do you think that your relationship with individual consumers and businesses could be improved?
11. Do you have strong relationships with other aquaculture producers in Cambodia?
o If YES, who do you have these relationships with and what has helped you to build these relationships? [collect information about opportunities]
o If NO, what has prohibited you from forming strong relationships with other hatcheries and nurseries? [collect information about constraints]
12. What, if anything, do you think could be done to improve your relationship with other aquaculture producers?
13. Would you join and participate in an Aquaculture Association or a similar social network to improve linkages and collaboration between value chain actors?
o If YES, why? [collect information about opportunities] o If NO, why not? [collect information about constraints]
14. From your point of view, what should be the overall goal(s) of this Association?

CAST Baseline Survey | Page 208
2. COLLECTORS (WHOLESALERS & PROCESSORS) Topic 1. Aquaculture Industry
Let’s talk about your vision of the aquaculture sector in Cambodia and what you believe are the constraints and opportunities to develop the commercial aquaculture in this country. Based on your understanding of the sector and past experiences:
Constraints and opportunities to develop commercial aquaculture in Cambodia
1. Are you satisfied with the quality and availability of fish from Cambodian-based aquaculture producers? o If YES, what has led you to form this conclusion? [collect information about opportunities] o If NO, what are the main issues and how could it they improved? [collect information about
constraints]
2. Please describe the quality requirements for buying and selling fish in Cambodia. [Provide the respondent with 1-2 minutes to describe any current quality requirements]
o Is it more difficult to meet market requirements for certain species? ▪ If YES, why? [collect information about opportunities] ▪ If NO, why not? [collect information about constraints]
3. What current practices do you follow to ensure good hygiene and sanitation in the trading and processing
of your fish? • Where did you learn these practices? [ask for specific details] • Is it important to practice good hygiene and sanitation to access the market? [ask for specific
details]
4. From your point of view, what processed fish products will be in high demand in the coming years? Please explain.
Topic 2. Program Implementation
Barrier and facilitators to program implementation
Let’s talk about the CAST project and what you believe are the barriers and facilitators to implementing the project. Based on your understanding of the sector and past experiences:
5. What are the main barriers to increasing the quantity and improving the quality of fish available to you each year?
• Prompt for: at least 1-2 barriers to increasing the quantity of fish and 1-2 barriers for improving the quality of fish
6. What are the main barriers that you face when trying to market your fish? • Prompt for: access to marketing information, access to customer, transportation capacity,
competitive price [prompt for 2-3 barriers for marketing]
7. What, if any, recommendations do you have for potential solutions to these barriers? • Prompt for: capacity (e.g., training on processing technique), coordination with other value chain
actors (e.g., communication and exchange), infrastructure (e.g., access to roads and electricity), investment capacity (e.g., access to loans)
o Why do you think these barriers have not been addressed in the past?
8. What, if any, facilitators currently exist that help you to trade and process fish?

CAST Baseline Survey | Page 209
• Prompt for :specific demand from urban areas or export; new markets, new technique, improved road and transportation
Support services needed & awareness
Let’s talk about the CAST project and what type of service and support the project can provide.
9. Do you currently receive or have you in the past received support services from any other aquaculture projects?
a. If YES, please describe the type of services you received and the duration for which you received these services (e.g., one day, two months, three years)
iii. What kind of support services have you found most and least useful for your business? b. If NO, please describe the type of services that you think would most benefit your business (e.g.,
technology for storage, training for SPS and quality improvement). iv. What, if any, barriers do you think have prevented you from receiving these services from
other aquaculture projects?
10. What support services do you think CAST should offer to wholesalers/processors operating in Cambodia? Please explain. [Respondent should answer this question first before interviewer asks the following three questions about additional support]
a) What, if any, additional support is needed to improve the quality of fish? b) What, if any, additional support is needed to increase volume of production? c) What, if any, additional support is needed to improve marketing and access to market?
11. What support services do think CAST should offer to Cambodian hatcheries, nurseries, and aquaculture
producers to help improve the quality of their products? • How do you think that these interventions would increase the quantity and improve the quality of
fish traded and processed by your business?
Topic 3. Relationship building
Let’s talk about access to knowledge and how you interact with other actors of the aquaculture sector.
12. How and from where do you get information about the market for fish in Cambodia? • Do you currently have enough information about the market for Cambodian fish?
o If YES, what has enabled you to have this information? [collect information about opportunities] o If NO, what has prohibited you from accessing this information? [collect information about
constraints]
13. What steps do you think should be taken to ensure that aquaculture producers have up-to-date information about the current market for fish in Cambodia?
14. Please describe your current relationship with your customers. [Provide the respondent with 1-2 minutes to
describe their consumer base and current relationships with their customers] o Would you say that you have a good working relationship with individual consumers and local
businesses? ▪ If YES, why? [collect information about opportunities] ▪ If NO, why not? [collect information about constraints]
o In what areas do you think that your relationship with individual consumers and businesses could be improved?
15. Do you have strong relationships with other aquaculture producers in Cambodia?
o If YES, who do you have these relationships with and what has helped you to build these relationships? [collect information about opportunities]

CAST Baseline Survey | Page 210
o If NO, what has prohibited you from forming strong relationships with other hatcheries and nurseries? [collect information about constraints]
16. What, if anything, do you think could be done to improve your relationship with other aquaculture producers?
17. Would you join and participate in an Aquaculture Association or a similar social network to improve linkages and collaboration between value chain actors?
o If YES, why? [collect information about opportunities] o If NO, why not? [collect information about constraints]
18. From your point of view, what should be the overall goal(s) of this Association?

CAST Baseline Survey | Page 211
HORECA and SUPERMARKET
Topic 1. Aquaculture Industry
Constraints and opportunities to develop commercial aquaculture in Cambodia
Let’s talk about your vision of the aquaculture sector and the constraints and opportunities to develop commercial aquaculture in Cambodia. Based on your understanding of the sector:
1. Are you currently satisfied with the availability and quality of fish being purchased by your business? [Provide the respondent with 1-2 minutes to describe their level of satisfaction and provide examples to support their answer]
o Prompt for: seasonality and traceability
2. What requirements does your business have in place to ensure that you are buying and selling quality fish to customers?
o Prompt for: information about size, species, and quantity
3. Are these requirements reliably met by fish sourced from the Cambodian aquaculture industry? o If YES, what do you think value chain actors are doing to help ensure a high quality product?
[collect information about opportunities] o If NO, why not and what improvement do you think need to be made? [collect information about
constraints]
4. Please share your thoughts about the current level of communication and information sharing between actors within the Cambodian value chain. Provide 1-2 examples.
o Prompt for: information and communication regarding price, quality requirement, and access to new technology (or lack thereof)
o What should be done to improve communication and information sharing within the Cambodian aquaculture industry?
5. What opportunities currently exist for improvements in the production, transport, and processing of fish within the aquaculture value chain?
o What is needed to improve the performance of fish processing and/or the post-harvest storage and handling of Cambodian-sourced fish?
▪ Prompt for: issues related to certain forms of processing (e.g., fermented, smoked, dried, filleted, skinned) and storage capacity and quality control
6. From your point of view, what are the aquaculture processed products that have the highest potential for growth in Cambodia? Please explain.

CAST Baseline Survey | Page 212
Constraints and opportunities to develop a traceability and quality control system for aquaculture product
Let’s talk about SPS and quality control system and what you believe are the constraints and opportunities to develop and enforce a quality control and traceability system in the aquaculture sector. Based on your understanding of the sector and past experiences:
7. What regulations should be put in place to ensure that quality inputs are available throughout the aquaculture value chain?
o Prompt for: feed produced in Cambodia or imported and/or quality control/biosecurity measures
8. What should be done to improve the regulation of quality standards for aquaculture products within the aquaculture value chain?
o Prompt for: standards for the different processed products and fish on ice or frozen o Based on your experience with other sectors (e.g., vegetable), what, if any, additional regulations
should be developed for the aquaculture industry in Cambodia?
9. What do you think are the main constraints to developing a traceability system for aquaculture products in Cambodia?
10. What do you think are the main opportunities to developing a traceability system for aquaculture products in Cambodia (e.g., species, consumer group target, existing experiences)?
• Which existing value chain actors should we involve in the conversation about developing a traceability system for this purpose?
• What new or addition value chain actors should we involve in this discussion?
Topic 3. Relationship building
Let’s talk about access to knowledge and how you interact with other actors of the aquaculture sector.
11. How and from where do you get information about the market for fish in Cambodia? • Do you currently have enough information about the market for Cambodian fish?
o If YES, what has enabled you to have this information? [collect information about opportunities] o If NO, what has prohibited you from accessing this information? [collect information about
constraints]
12. What steps do you think should be taken to ensure that hatcheries and nurseries have up-to-date information about the current market for fingerlings in Cambodia?
13. Please describe your current relationship with your customers. [Provide the respondent with 1-2 minutes to
describe their consumer base and current relationships with their customers] o Would you say that you have a good working relationship with individual consumers and local
businesses? ▪ If YES, why? [collect information about opportunities] ▪ If NO, why not? [collect information about constraints]
o In what areas do you think that your relationship with individual consumers and businesses could be improved?
15. Would you join and participate in an Aquaculture Association or a similar social network to improve
linkages and collaboration between value chain actors? o If YES, why? [collect information about opportunities] o If NO, why not? [collect information about constraints]
From your point of view, what should be the overall goal(s) of this Association?

CAST Baseline Survey | Page 213
FEED MILLS AND IMPORTERS
Topic 1. Aquaculture Industry
Let’s talk about your vision of the aquaculture sector in Cambodia and what you believe are the constraints and opportunities to develop the commercial aquaculture in this country. Based on your understanding of the sector and past experiences:
Constraints and opportunities to develop commercial aquaculture in Cambodia
1. How many metric tons of aquaculture feed do you think are required to sustain the Cambodian aquaculture sector each year? Please explain.
2. What do you think the Cambodian aquaculture feed market will look like in five years? • What are the main drivers of growth within the sector and how they evolved over the past 10 years?
3. What species of fish do you primarily target with your aquaculture feed? Why have you chosen to target
these species?
4. What parts of the country do you typically target for the sale and distribution of your aquaculture feed? Why have you chosen to focus your efforts in these areas?
5. [Question for feed mills only] If you do not have a feed mill currently producing aquaculture feed – do you plan to invest in one in the next 3-5 years?
a) If YES, why? [collect information about opportunities] b) If NO, why not? [collect information about constraints]
6. Please describe your current distribution strategy/system?
a) Who are you currently selling your feed to and where are their farms? b) What type of contact to you currently have with feed distributors? c) What do you think could be improved about the current distribution strategy/system?
Topic 2. Program implementation
Let’s talk about the CAST project and what you believe are the barriers and facilitators to implement the project. Based on your understanding of the sector and past experiences:
Barriers and facilitators to program implementation
7. What are the main barriers to increasing the quantity and improving the quality of aquaculture feed available to the Cambodian aquaculture sector each year?
• Prompt for: at least 1-2 barriers to increasing the quantity of feed and 1-2 barriers for improving the quality of feed
8. What are the main barriers that you face when trying to market your feed?
• Prompt for: access to marketing information, access to customer, transportation capacity, competitive price [prompt for 2-3 barriers for marketing]
9. What, if any, recommendations do you have for potential solutions to these barriers? • Prompt for: capacity (e.g., training on processing technique), coordination with other value chain
actors (e.g., communication and exchange), infrastructure (e.g., access to roads and electricity), investment capacity (e.g., access to loans)
o Why do you think these barriers have not been addressed in the past?

CAST Baseline Survey | Page 214
10. What, if any, facilitators currently exist that help you market and sell your aquaculture feed? • Prompt for: access to customers; technical supports to customers
Topic 3: Relationship building
Let’s talk about access to knowledge and how you interact with other actors of the aquaculture sector.
11. What role should feed companies and feed importers play in supporting hatcheries, nurseries, and aquaculture producers in Cambodia?
• Prompt for: ability and interest in providing technical support
12. Please describe your current relationship with your customers. [Provide the respondent with 1-2 minutes to describe their consumer base and current relationships with their customers]
o Would you say that you have a good working relationship with individual consumers and local businesses?
▪ If YES, why? [collect information about opportunities] ▪ If NO, why not? [collect information about constraints]
o In what areas do you think that your relationship with individual consumers and businesses could be improved?
13. Do you have strong relationships with other feed distributors in Cambodia? o If YES, who do you have these relationships with and what has helped you to build these
relationships? [collect information about opportunities] o If NO, what has prohibited you from forming strong relationships with other feed distributors?
[collect information about constraints]
14. What, if anything, do you think could be done to improve your relationship with other hatcheries and nurseries?
15. Would you join and participate in an Aquaculture Association or a similar social network to improve
linkages and collaboration between value chain actors? o If YES, why? [collect information about opportunities] o If NO, why not? [collect information about constraints]
16. From your point of view, what should be the overall goal(s) of this Association?

CAST Baseline Survey | Page 215
FEED DISTRIBUTORS
Topic 1. Aquaculture Industry
Let’s talk about your vision of the aquaculture sector in Cambodia and what you believe are the constraints and opportunities to develop the commercial aquaculture in this country. Based on your understanding of the sector and past experiences:
Constraints and opportunities to develop Commercial aquaculture in Cambodia
1. How many metric tons of aquaculture feed do you think are required to sustain the Cambodian aquaculture sector each year? Please explain.
2. In the past two years: a) Has your volume of commodities (i.e., size of your inventory) and value of sales increased, decreased,
or stayed the same? o Why do you think that these changed occurred?
b) Has your total number of customers increased, decreased, or stayed the same?
3. Are customers buying more or less feed today than they were two years ago? a. What, if anything, do you think is responsible for this change in purchasing behavior?
4. What are your main target species of fish? Why have you chosen these species?
5. Please describe your current distribution strategy/system?
a) How many hatcheries, nurseries, and/or aquaculture producers are currently purchasing feed directly from you each month?
b) How many other feed distributors are you currently working with? c) Do you provide customer with the feed before they make a payment?
o If yes, why? [collect information about opportunities] ▪ What are the rules that govern these agreements?
o If no, why not? [collect information about constraints]
Topic 2. Program Implementation
Let’s talk about the CAST project and what you believe are the barriers and facilitators to implementing the project. Based on your understanding of the sector and past experiences:
Barrier and facilitators to program implementation
6. What are the main barriers to increasing the quantity and improving the quality of aquaculture feed available to the Cambodian aquaculture sector each year?
• Prompt for: at least 1-2 barriers to increasing the quantity of feed and 1-2 barriers for improving the quality of feed
7. What are the main barriers that you face when trying to market your feed?
• Prompt for: access to marketing information, access to customer, transportation capacity, competitive price [prompt for 2-3 barriers for marketing]
8. What, if any, recommendations do you have for potential solutions to these barriers? • Prompt for: capacity (e.g., training on processing technique), coordination with other value chain
actors (e.g., communication and exchange), infrastructure (e.g., access to roads and electricity), investment capacity (e.g., access to loans)
o Why do you think these barriers have not been addressed in the past?
9. What, if any, facilitators currently exist that help you market aquaculture feed?

CAST Baseline Survey | Page 216
• Prompt for: access to customers; technical supports to customers
Support services needed & awareness
Let’s talk about the CAST project and what type of service and support the project can provides.
10. What support services, if any, do you currently provide to Cambodian hatcheries, nurseries, or aquaculture producers?
• Prompt for: technical support, financial support as loan in kind • If you are not providing support service, why aren’t you doing so?
o Prompt for: lack of knowledge, limited staff, no demand o What would need to change for you to provide technical support to your customers in the
future?
11. What type of support services would help you increase the amount aquaculture feed sales in the future? • Prompt for: technical training, business training, more connection with farmers, and education
material to distribute to farmers
Topic 3: Relationship building
Let’s talk about access to knowledge and how you interact with other actors of the aquaculture sector.
12. How and from where do you get information about best practices for aquaculture techniques and up-to-date information about aqua-feed technologies? • Do you currently have enough information about aquaculture techniques and aqua-feed technologies?
o If YES, what has enabled you to have this information? [collect information about opportunities] o If NO, what has prohibited you from accessing this information? [collect information about
constraints]
13. What steps do you think should be taken to ensure that aquaculture producers have up-to-date information about the current market for fish in Cambodia?
14. Please describe your current relationship with your customers. [Provide the respondent with 1-2 minutes to describe their consumer base and current relationships with their customers]
o Would you say that you have a good working relationship with individual consumers and local businesses?
▪ If YES, why? [collect information about opportunities] ▪ If NO, why not? [collect information about constraints]
o In what areas do you think that your relationship with individual consumers and businesses could be improved?
15. Do you have strong relationships with other feed distributors in Cambodia?
o If YES, who do you have these relationships with and what has helped you to build these relationships? [collect information about opportunities]
o If NO, what has prohibited you from forming strong relationships with other feed distributors? [collect information about constraints]
16. What, if anything, do you think could be done to improve your relationship with other feed distributors?

CAST Baseline Survey | Page 217
MICRO FINANCE INSTITUTION AND INSURANCE
Topic 1. Aquaculture Industry
Let’s talk about your vision of the aquaculture sector in Cambodia and what you believe are the constraints and opportunities to develop the commercial aquaculture in this country. Based on your understanding of the sector and past experiences:
Constraints and opportunities to develop commercial aquaculture in Cambodia
1. What is your general impression about the aquaculture industry in Cambodia? Please share 2-3 examples that support your thoughts about this topic. • Prompt for: trend and opportunities for MFI and Insurance Cie
2. What changes should be made the aquaculture system in Cambodia to increase the profitability of
producers and hatcheries? a. Prompt for: technical improvement; market access; introduction of high quality genetic strains,
trend, opportunities for MFI and Insurance Cie
3. Is your bank or enterprise currently engaged in the Cambodian aquaculture industry? a. If YES, in what ways are you involved with this sector? [collect information about opportunities]
i. Please describe 2-3 lessons learned about the industry through this engagement/involvement.
b. If NO, why not? [collect information about constraints] i. Prompt for: risk, knowledge of the sector, market
4. What, if anything, should to be done to help hatcheries, nurseries, and aquaculture producers and feed
mills access financial services in Cambodia?
5. Please describe the different types of risks associated with your business getting involved with the aquaculture sector. a) What, if anything, can CAST do to help mitigate this risk?
Topic 2. Program Implementation
Let’s talk about CAST project and what you believe are the barriers and facilitators to implement the project. Based on your understanding of the sector and past experiences:
Barrier and facilitators to program implementation
6. What are the main barriers to providing financial services to hatcheries, nurseries, and aquaculture producers?
• Prompt for: at least 1-2 barriers to providing these services to these beneficiaries
7. What are the main barriers that you face when trying to provide financial services to community members and businesses?
• Prompt for: low return, no collaterals, limited market
8. What, if any, recommendations do you have for potential solutions to these barriers? o Prompt for: capacity building (e.g. training), coordination with other actors of the value chain (e.g.,
communication and exchange), infrastructure (e.g., access to road, electricity), and investment capacity (e.g., access to loan and financial mechanism)
o Why do you think these barriers have not been addressed in the past?
9. What, if any, facilitators currently exist that help you to provide financial services to community members

CAST Baseline Survey | Page 218
and businesses? • Prompt for: access to quality fingerlings/clean water, help from neighbors or family members,
returning customers/word of mouth, proximity to road/transportation
Topic 3: Relationship building
Let’s talk about access to knowledge and how you interact with other actors of the aquaculture sector.
10. What type of information, knowledge, skills and partners would you require to get actively involved in the Cambodian aquaculture sector?
11. Do you have enough connection with fish farmers and other actors of the value chain? • Prompt for: what is existing and what is missing • How can CAST help to foster these relationships?
12. Please describe your current relationship with your customers. [Provide the respondent with 1-2 minutes to describe their consumer base and current relationships with their customers]
o Would you say that you have a good working relationship with individual consumers and local businesses?
▪ If YES, why? [collect information about opportunities] ▪ If NO, why not? [collect information about constraints]
o In what areas do you think that your relationship with individual consumers and businesses could be improved?

CAST Baseline Survey | Page 219
ANNEX D: STANDARD AND CUSTOM INDICATORS
Standard Indicator# 1: Yield of targeted agricultural commodities among program participants with USDA assistance Yield per square meter of pond or per cubic meter of cage is a measure of productivity. Yield is a measure of the total output of production of fish, divided by the total number of units in production square meter for pond, cubic meters of cage for cage aquaculture.
Indicator value
95% CI Lower bound
95% CI Upper bound
Number of records
Standard Error
Standard Deviation
TREATMENT Aquaculture pond Indicator value (kg/m2) 4.77 4.48 5.06 507 0.15 3.34
Age 15-29 4.93 2.93 6.92 15 0.93 3.60 Age 30+ 4.77 4.47 5.06 492 0.15 3.33
Male 4.81 4.50 5.13 443 0.16 3.38 Female 4.46 3.71 5.22 64 0.38 3.03
Aquaculture cage Indicator value (kg/m3) 44.00 41.58 46.18 402 1.17 23.43
Age 15-29 48.48 40.00 56.96 25 4.11 20.55 Age 30+ 43.58 41.18 45.97 377 1.22 23.60
Male 44.32 41.87 46.77 364 1.25 23.76 Female 39.66 33.13 46.18 38 3.22 19.85
CONTROL Aquaculture pond Indicator value (kg/m2) 2.11 1.88 2.34 183 0.12 1.60
Age 15-29 1.95 -3.43 7.32 3 1.25 2.16 Age 30+ 2.11 1.88 2.35 180 0.12 1.59
Male 2.10 1.84 2.36 157 0.13 1.64 Female 2.17 1.62 2.72 26 0.26 1.35
Aquaculture cage Indicator value (kg/m3) 32.00 29.31 34.92 103 1.41 14.35
Age 15-29 27.99 12.02 43.96 6 6.21 15.22 Age 30+ 32.37 29.48 35.26 97 1.46 14.34
Male 32.54 29.70 35.38 100 1.43 14.33 Female 17.90 4.47 31.33 3 3.12 5.41
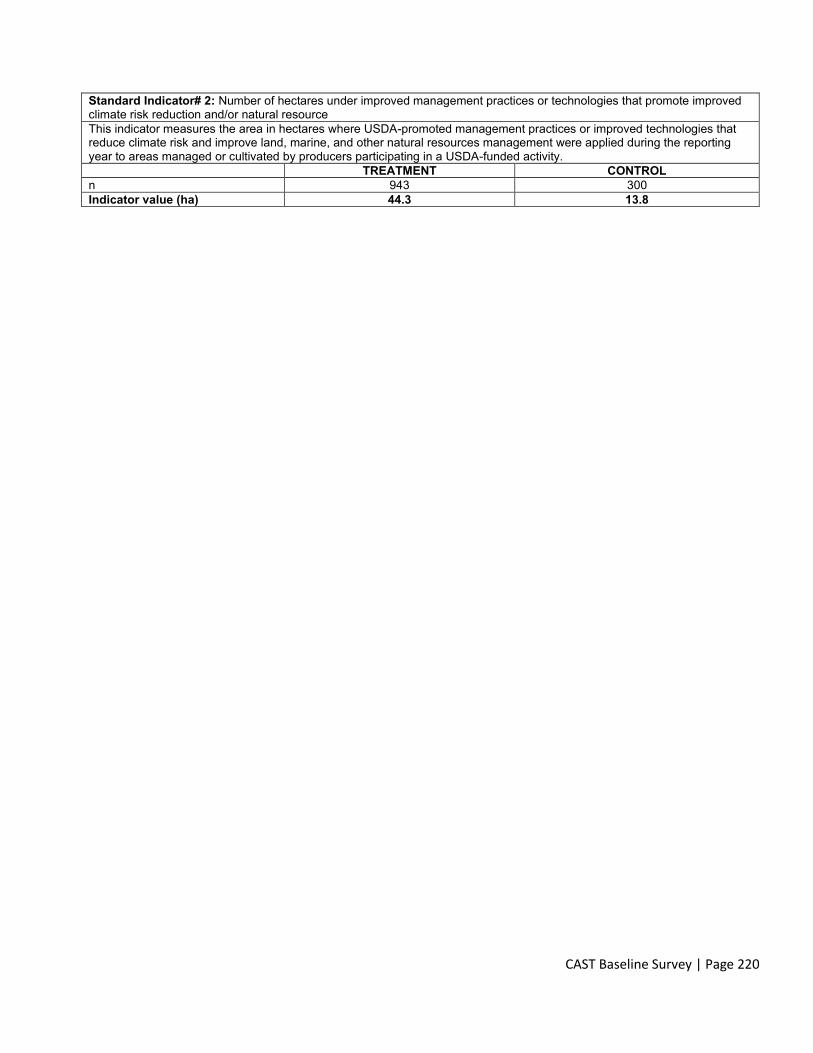
CAST Baseline Survey | Page 220
Standard Indicator# 2: Number of hectares under improved management practices or technologies that promote improved climate risk reduction and/or natural resource This indicator measures the area in hectares where USDA-promoted management practices or improved technologies that reduce climate risk and improve land, marine, and other natural resources management were applied during the reporting year to areas managed or cultivated by producers participating in a USDA-funded activity. TREATMENT CONTROL n 943 300 Indicator value (ha) 44.3 13.8

CAST Baseline Survey | Page 221
Standard Indicator# 3: Number of hectares under improved management practices or technologies with USDA assistance This indicator measures the area in hectares where USDA-promoted management practices or improved technologies were applied during the reporting year to areas managed or cultivated by producers participating in a USDA-funded activity. This indicator measures adoption of i) aquaculture management practices and technology; ii) climate adaptation practices and technology; iii) other practices and technology (post-harvest, marketing and business management) hatcheries, nurseries, producers. TREATMENT CONTROL n 943 300 Indicator value (ha) 61.2 20.05
Aquaculture Management 19.59 1.75 Climate Adaptation 20.25 10.07
Other 48.60 17.66 Age 15-29 2.93 0.00
Age 30+ 58.30 20.48 Male 58.58 20.08
Female 2.66 0.40
Standard Indicator# 4: Number of individuals in the agriculture system who have applied improved management practices or technologies with USDA assistance This indicator measures the total number of agriculture system actors participating in USDA-funded activities who have applied improved management practices and/or technologies promoted by USDA anywhere within the food and agriculture system during the reporting year. This indicator measures adoption by agriculture system actors of i) aquaculture management practices and technology; ii) climate adaptation practices and technology; iii) other practices and technology (post-harvest, marketing and business management) for hatcheries, nurseries, producers, collectors, wholesalers and processors.
TREATMENT CONTROL n 1,039 339 Indicator value (# individuals) 178 43
Aquaculture Management 33 6 Climate Adaptation 71 9
Other 93 31 Smallholder 43 8
Non-smallholder - - Private sector 7 8
Age 15-29 8 1 Age 30+ 170 42
Male 159 38 Female 19 5
Standard Indicator# 18: Value of annual sales of farms and firms receiving USDA assistance
This indicator measures the value in U.S. dollars of the total amount of sales of products and services by USDA-assisted farms and firms during the reporting year within USDA-supported agricultural commodity value chains or markets. It includes the value of sales of hatcheries, nurseries, producers, collectors, wholesalers and processors. TREATMENT CONTROL n 1,014 332 Indicator value ($US) 48,866,778 16,560,657
Smallholder 11,440,825 2,607,840 Non-smallholder 1,435,500 0 Microenterprise 19,359,796 13,952,817
Small enterprise 70,000 0 Medium enterprise 0 0
Large enterprise 0 0 Age 15-29 30,376,922 16,232,798
Age 30+ 1,929,199 327,859 Male 24,593,213 12,912,056
Female 7,712,908 3,648,601

CAST Baseline Survey | Page 222
Standard Indicator# 19: Volume of commodities (metric tons) sold by farms and firms receiving USDA assistance
This indicator will collect the volume (as calculated in gross metric tons (MT)) of sales of targeted commodities by farms and firms receiving USDA assistance. This includes the volume of all sales of fish, fingerlings and processed fish, not just the volume of farm-gate sales. It includes the volume of sales of hatcheries, nurseries, producers, collectors, wholesalers and processors. TREATMENT CONTROL n 1,014 332 Indicator value (MT) 15,477.77 3,156.05
Smallholder 6,769.12 1,192.28 Non-smallholder 1,203.00 0 Microenterprise 7,498.64 1,963.77
Small enterprise 7.00 0 Medium enterprise 0 0
Large enterprise 0 0 Age 15-29 781.33 136.37
Age 30+ 14,696.43 3,019.68 Male 11,248.60 2,286.93
Female 4,277.82 869.12
Custom Indicator#2: Total area of ponds (square meters) under improved management practices or technologies with USDA assistance This indicator measures the area in square meters where USDA-promoted management practices or improved technologies were applied during the reporting year to areas managed or cultivated by producers participating in a USDA-funded activity. This indicator measures adoption of i) aquaculture management practices and technology; ii) climate adaptation practices and technology of hatcheries, nurseries and producers (for cage only the surface in square meter is taken into account) TREATMENT CONTROL
n 943 300 Indicator value (m2) 408,789 3,958
Hatcheries 250,904 114,218 Nurseries 21,850 800
Producers 136,036 3,958.00 Aquaculture Management 206,301 3,610
Climate Adaptation 202,488 348
Custom Indicator#3: Number of hatcheries or feed mills that are supplying seed or feed that meets improved quality standards This output indicator will measure the number of hatcheries and feed mills that are supplying the value chain with product (i.e., fingerlings and feed) that meets international or otherwise acceptable quality standards. For feed mills this indicators measure the compliance to international standards when producing fish feed. For hatcheries it takes into consideration 13 different practices, including biosecurity and hatcheries management and transport of fingerlings. TREATMENT CONTROL n 25 13 Indicator value (# firms) 0 0
Hatcheries 0 0 Feed mills 0 0

CAST Baseline Survey | Page 223
Custom Indicator#4: Number of beneficiaries who received market information about price and availability of aquaculture products This indicator measure the number of beneficiaries that access market information about fish prices including processed fish, price of and availability of inputs and quality standard. TREATMENT CONTROL
n 1,031 339 Indicator value (# individuals) 817 262
Hatcheries 14 7 Nurseries 8 0
Producers 713 230 Collectors 23 8
Wholesalers 20 5 Processors 25 7
Feed distributors 14 5
Custom Indicator #5: Number of market actors who are compliant with standard SPS best practices and/or are using an independent quality seal to market their products This indicator will measure the number of beneficiaries in the post-production segment of the value chain that apply standard SPS best practices and/or use an independent quality seal reserved for high-quality Cambodian-raised fish. TREATMENT CONTROL n 71 32 Indicator value ( #individuals) 0 0
Collectors 0 0 Wholesalers 0 0 Processors 0 0

CAST Baseline Survey | Page 224
Custom Indicator#6: Number of farms that increased the number, size, or amount of ponds, cages or equipment with USDA assistance This indicator measures the increased size and scope of production equipment or area of production activities. It measures the area of pond (m2) and volume of cage (m3) per farm, the average number of ponds and cages per farm and the number of farm equipped with well and aeration. For hatcheries, it also measure the number of tanks and the average number of equipment (oxygen tank, grader, refrigerator, scale, hapa net hauling tank with oxygen, seine and dip net and sechhi disk)
Indicator value
95% CI Lower bound
95% CI Upper bound
Number of records
Standard Error
Standard Deviation
TREATMENT Producers - pond Average area of pond (m2) 1,866.73 1,541.28 2,192.19 725 165.77 4,463.62 Average number of ponds 1.57 1.47 1.66 507 0.05 1.05 Average number of pumps 1.51 1.13 1.90 507 0.19 4.38 Number of pond farms with aeration
6 - - 507 - -
Number of pond farms equipped with a well
53 - - 507 - -
Producers – cage Average volume of cages (m3)
96.57 79.68 113.47 515 8.60 195.11
Average of number of cages
1.39 1.31 1.48 402 0.04 0.89
Number of cage farms with aeration
31 - - 402 - -
Hatcheries Average area of ponds in hatchery (m2)
2,951.12 2,073.54 3,828.69 103 442.44 4,490.27
Average number of ponds & cages
11.96 7.30 16.62 25 2.26 11.28
Average number of tanks 5.50 3.05 7.95 16 1.15 4.59 Number of hatcheries equipped with a well
3.00 - - 17 - -
Average pump per hatchery
2.18 1.26 3.09 17 0.43 1.78
Number of hatcheries with aeration
4.00 - - 17 - -
Average of number of equipment per hatchery
6.06 4.89 7.23 17 0.55 2.28
CONTROL Producers - pond Average area of pond (m2) 1,431.1 975.20 1,887.0 238 231.4 3570.3 Average number of ponds 1.4 1.30 1.5 183 0.05 0.7 Average number of pumps 1.3 1.10 1.4 183 0.10 0.9 Number of pond farms with aeration
1 - - 183 -
Number of pond farms equipped with a well
5 - - 183 -
Producers - cage Average volume of cages (m3)
105.7 88.20 123.1 166 8.80 114.0
Average of number of cages
1.7 1.50 1.9 103 0.11 1.1
Number of cage farms with aeration
12 103
Hatcheries Average area of ponds in hatchery (m2)
5220.3 2970.3 7470.4 30 1100.2 6025.8
Average number of ponds & cages
9.2 5.8 12.6 14 1.6 5.9
Average number of tanks 10.9 1.5 20.3 11 4.2 14.0

CAST Baseline Survey | Page 225
Number of hatcheries equipped with a well
0 - - 14 - -
Average pump per hatchery
2.9 2.0 3.9 13 0.4 1.6
Number of hatcheries with aeration
5 - - 13 - -
Average of number of equipment per hatchery
8.1 7.4 8.8 13 0.3 1.2

CAST Baseline Survey | Page 226
Custom Indicator#7: Number of value chain actors with increased capacity for distribution including processing and/or other value addition practice This indicator is intended to measure the number and type of tangible investments that value chain actors make in their businesses. Benchmark figures as below Storage assets include :i) refrigerators, ii) tanks for live fish with aeration, ii) tanks for live fish without aeration, iv) tanks for transporting dead fish and v) cooler boxes. Transformation assets include: i) solar dryers; ii) smoke fish stoves Transportation assets include: i) motorcycles; ii) carts; iii) cars; iv) motorized boats; v) mini-vans; vi) small trucks (4 wheels); vii) large trucks (6 or more wheels).
Indicator value
95% CI Lower bound
95% CI Upper bound
Number of records
Standard Error
Standard Deviation
TREATMENT Collectors Average storage assets 28.1 11.8 44.4 24 7.9 38.6 Average transformation assets
0.2 -0.04 0.37 24 0.1 0.7
Average transport assets 2.3 1.4 3.2 24 0.4 2.1 Wholesalers Average storage assets 32.7 10.8 54.6 21 10.5 48.1 Average transformation assets
0.3 -0.1 0.7 21 0.2 0.9
Average transport assets 3.1 1.6 4.7 21 0.7 3.3 Processors Average storage assets 4.9 1.8 8.0 24 1.5 7.6 Average transformation assets
5.8 1.6 10.0 24 2.0 10.4
Average transport assets 1.6 1.2 2.0 24 0.2 1.0 CONTROL Collectors Average storage assets 6.2 3.1 9.3 16 1.5 5.9 Average transformation assets
0.0 0.0 0.0
16 0.0 0.0
Average transport assets 2.6 1.7 3.6 16 0.4 1.7 Wholesalers Average storage assets 23.0 -0.8 46.8 8 10.0 28.4 Average transformation assets
0.0 0.0 0.0
8 0.0 0.0
Average transport assets 2.8 1.7 3.8 8 0.5 1.3 Processors Average storage assets 4.6 1.0 8.3 8 1.5 4.3 Average transformation assets
6.4 1.3 11.5
8 0.4 1.7
Average transport assets 2.4 1.9 2.8 8 0.2 0.5

CAST Baseline Survey | Page 227
Custom Indicator#10: Number of post-production market actors who report an increase in volume or improvement in the quality of freshwater fish in the aquaculture value chain. This indicator will measure the number of aquaculture producers and wholesalers who buy and sell fish that report an overall increase in quality and quantity of Cambodian raised fish in the value chain. Benchmark figures as below based on the perception of beneficiaries about quality of Cambodian aquaculture fish on a scale of 1 to 5 (1: very low; 2: low; 3: average; 4: good; 5: very good)
Indicator value
95% CI Lower bound
95% CI Upper bound
Number of records
Standard Error
Standard Deviation
TREATMENT Average Collectors 3.8 3.6 4.1 23 0.1 0.6
Average Wholesalers 4.1 3.8 4.4 21 0.1 0.7 Average Processors 3.9 3.7 4.2 24 0.1 0.6
CONTROL Average Collectors 3.7 3.4 4.0 16 0.2 0.6
Average Wholesalers 3.1 2.8 3.4 8 0.1 0.4 Average Processors 3.8 3.2 4.3 8 0.3 0.7

CAST Baseline Survey | Page 228
Custom Indicator#11: Number of business plans developed that include marketing and distribution strategies This indicator measures the number of enterprises or organizations that develop an annual business plan that includes plans for marketing and/or distributing their products and/or services. Benchmark figures below include i)marketing and distribution practices and ii) recording inputs and sales value, origin of products TREATMENT CONTROL n 1,039 339 Indicator value 93 32
Hatcheries 1 3 Nurseries 0 0
Producers 92 29 Collectors 0 0
Wholesalers 0 0 Processors 0 0
Feed distributors 0 0 Feed mills 0 0

CAST Baseline Survey | Page 229
ANNEX E: LIST OF KEY INFORMANTS Company – Institution Stakeholder category Position
1 CESAIN CAST partners Director 2 HARVEST II CAST partners Chief of Party 3 IDE CAST partners Innovation Lab Director 4 RUA CAST partners Vice Dean 5 Collector Collector Proprietor 6 AFD DP Program officer 7 IFAD - Seth DP Country Representative 8 JICA DP Program officer 9 UNIDO DP Project coordinator 10 Agri-Master distributor 1 Feed distributors Proprietor 11 Agri-Master distributor 2 Feed distributors Proprietor 12 Agri-Master distributor 3 Feed distributors Proprietor 13 Agri-Master distributor 4 Feed distributors Proprietor 14 Kheat Kheng Development
Co,.Ltd Feed distributors Proprietor
15 Ly Hong Choy Feed distributors Marketing and Technical Managers 16 Agri-Master Feed mill Marketing Manager 17 Green Feed Feed mill Assistant Purchasing Manager
Shareholder 18 FiA DFPTQ FiA Vice Director 19 NARDI FiA Vice Director 20 Rathada Hatcheries Proprietor 21 Beer Garden HORECA Proprietor 22 HAGAR HORECA Assistant Purchase Manager 23 Wedding Catering Group HORECA Manager 24 ACLEDA MFI SVP and Head of Credit Division 25 Rothada Hatchery Hatchery Proprietor 26 Davy Nursery Nurseries Proprietor 27 FORTE Insurance Other Vice President 28 Brahok Market Processor Owner 29 Fish processor Processor Proprietor 30 Cage farmer 1 Producers Proprietor 31 Cage farmer 2 Producers Proprietor 32 Cage farmer 3 Producers Proprietor 33 Cage farmer 4 Producers Proprietor 34 Pond farmer 1 Producers Proprietor 35 Pond farmer 2 Producers Proprietor 36 Pond farmer 3 Producers Proprietor 37 Pond farmer 4 Producers Proprietor 38 AEON Mall Retailer Purchasing Manager 39 Lucky Supermarket Retailer Assistant Purchasing Manager 40 Wholesaler 1 Wholesaler Proprietor 41 Wholesaler 2 Wholesaler Proprietor 42 Nursery3 Nurseries Proprietor 43 Processor 3 Processor Proprietor 44 Hatchery Hatcheries Proprietor 45 Collector 1 Collector Proprietor 46 Collector 2 Collector Proprietor

CAST Baseline Survey | Page 230
ANNEX F: ADDITIONAL RESULTS TO ANSWER BASELINE RESEARCH QUESTIONS
Baseline research question 1: What is the current productivity of feed mills, aquaculture producers and hatcheries and nurseries?
Figure A: Yield per year per species for cage (top) and pond (bottom) production systems

CAST Baseline Survey | Page 231
Baseline research question 2: What is the current soy protein and fish product trade in Cambodia?
Table A: U.S soy export to Cambodia
2015 2016 2017 2018
Cambodia Soy cultivation and production
Cultivated area (ha) 66,824 42,658 41,950 46,051
Production (Ton) 96,942 71,005 73,288 91,766
US Export to Cambodia (in MT)
Soy Bean 1,068 0 1,166 1,136
Soy Cake & Meals 23,386 44,613 50,271 28,819
Flour, Consent, Isolates 4.5 13.9 18 81.5
Corn/Soy blend 226.3 0 0 0
TOTAL (MT) 24,685 44,627 51,455 30,037 (source: MAFF statistics 2019 for Cambodia cultivation and production; GATS, USDA for US export to Cambodia)

CAST Baseline Survey | Page 232
Baseline research question 5: What is the current beneficiaries’ ability to access finance that is needed for business growth and development? Frequency, the average number of loans contracted aquaculture value chain actors, and the purpose of the loans.
Table B: Access to loans in treatment and control provinces
Beneficiaries Percentage of actor using loans
Average number of loans per actor
Top 2 purpose of loan
Treatment Hatcheries 24 1 Buying land for pond, warehouse
Buying fish feed Nurseries 38 1 Buying fish feed
Buying fish seed Producers 51 1.22 Buying fish feed
Buying fish seed Collectors 33 1 Buying equipment
Buying vehicle (incl. boat) Wholesalers 43 1 Other aquaculture related expense
Buying equipment Processors 35 1 Buying raw material for processing
Buying land for pond, warehouse or buying cage
Feed distributors
12 1 Buying fish feed
Control Hatcheries 46 1 Buying land for pond, warehouse
Buying fish feed Nurseries 100 1 Repair pond Producers 33 1.13 Buying fish feed
Buying fish seed Collectors 25 1 Buying equipment
Buying vehicle (incl. boat Wholesalers 25 1 Buying equipment
Buying vehicle (incl. boat Processors 38 1 Buying raw material for processing
Feed distributors
43 1 Buying fish feed Other aquaculture related expense

CAST Baseline Survey | Page 233
Table C: Number of individuals accessing agriculture-related financing
Number of individuals accessing agriculture-related financing
TREATMENT CONTROL
n 1,031 339
Number of individuals who took a loan in 2018
504 114
Number of loans contracted Cash 534 126
In-kind 74 2 Number of loans contracted by gender and age classes
Age 15-29 48 12 Age 30+ 560 115
Male 541 119 Female 67 8

CAST Baseline Survey | Page 234
Other relevant results -
Characteristics of the Control Group population
Table D: Characteristic of the surveyed population
Producers Hatcheries Nurseries Collectors Wholesalers Processors Feed distributors
MFI
n 286 13 1 16 8 8 7 6 Age
% of proprietor 15-29 3 0 100 6 0 0 43 0 % of proprietor ≥30 97 100 0 94 100 100 57 100
% of proprietor male 90 92 100 50 50 38 71 100 % of proprietor female 10 8 0 50 50 63 29 0 Average number of employees per farm and business
0.07 0.(0) 0.3 3.1 0.7 0.5 88
Total number of employees
38 1 0 5 4 6 4 672
% of employees 15-29 3 0 - 0 0 0 25 0 % of employees ≥30 97 100 - 100 100 100 75 100
% of employees male 100 0 - 100 75 67 100 100 % of employees female 0 100 - 0 25 33 0 0

CAST Baseline Survey | Page 235
Aquaculture production systems
Table E: Production per province and species
Provinces Total area (ha)
Pond
Total Volume(m3)
Cage
Volume (tons/year)
Top 3 species (by production
volume)
Volume (tons per year) per
top 3 species
Treatment Phnom Penh 32.24 20,202 2,543 1.Pangasius
2.Other 3.Silver barb
2,201 276 95
Kandal 21.42 6,841 644 1.C.micropeltes 2.Pangasius 3.Other
329 152 137
Kampong Cham 23.98 109 743 1. Pangasius 2.C.micropeltes 3.Other
366 347 19
Kampong Thom 6.83 3,428 445 1.Pangasius 2.C.micropeltes 3.C. striata
161 154 123
Siem Reap 18.60 3,347 1,099 1.C.micropletes 2. Pangasius 3.C.striata
637 312 104
Battambang 38.67 3,637 624 1.Pangasius 2.C.striata 3.Other
353 137 43
Pursat 36.18 17,373 1,930 1.Pangasius 2.C.micropletes 3.C.striata
1,262 366 269
Control Takeo 10.19 0 190 1.Pangasius
2.Silver barb 3.Nile tilapia
164 8 4
Kampong Chhnang 5.34 16,942 928 1.C. micropeltes 2. Pangasius 3. red tail catfish
358 262 176
Banteay Meanchey 18.76 0 76 1.Pangasius 2.Red tilapia 3.Other
46 10 8

CAST Baseline Survey | Page 236
Table F: Production system performances and characteristic per production system and per species in treatment provinces
Production system & species
Yield
Average selling price ($/kg)
Average number of production
cycle in 2018
Stocking Density*
Cage kg/m3 Fish/m2 Snakehead C. striata 62.00 1.43 1 244.6
Snakehead C. micropeltes 65.00 1.94 0.9 166.45 Pangasius 36.86 1.38 0.7 79.0
Red tail Catfish 36.86 3.02 0.8 18.6 Silver barb 69.33 2.11 1 126.4
Walking catfish 61.44 1.08 1.4 260.0 Pond kg/m2 Fish/m3
Snakehead C. micropeltes 7.30 2.26 0.96 18.45 Pangasius 6.80 1.26 11.74 Silver barb 0.64 2.23 0.84 10.95
Red Tilapia 0.91 1.81 0.95 4.87 Walking catfish 2.28 1.23 1.23 5.54
*Note: the stocking density was calculated based on a small sample of producer cultivating a single species.
Table G: Average management score of producers per province
Provinces Aquaculture management
Marketing and
distribution
Climate change
adaptation Phnom Penh 3.24 2.45 0.24 Kandal 2.97 2.31 0.82 Kampong Cham 3.41 2.15 0.62 Kampong Thom 2.58 1.85 0.66 Siem Reap 2.36 2.13 0.94 Battambang 3.48 2.35 0.57 Pursat 2.77 2.24 0.43
Note: Aquaculture management score includes 15 different practices or technologies: Handling properly dead fish; Not feeding fish with fish waste harvest; using feeding table; having a dry storage for feed; using floating pellets; using aeration; drying the pond between production cycles; control of predators; stocking certified fingerlings; using sechhi disk; using D.O meter; using water quality test kit; applying lime; applying organic fertilizer; knowing the production cost per unit
Marketing and distribution score includes: knowing his production calendar beforehand; having a contract or agreement with buyers
Climate change adaptation score includes: well for water supply, pond fenced; short production cycle

CAST Baseline Survey | Page 237
Table H: Feeding practices of aquaculture farmers
Provinces Only Pellet (%)
Only trash fish (%)
Only Homemade feed with trash
fish (%)
Only Homemade feed
without trash fish (%)
Mixed Methods
(%)
Target provinces Phnom Penh 6% 6% 13% 1% 74%
Kandal 3% 54% 2% 0% 41% Kampong Cham 5% 36% 1% 2% 55% Kampong Thom 7% 45% 1% 1% 46%
Siem Reap 4% 44% 0% 1% 51% Battambang 9% 12% 1% 6% 72%
Pursat 6% 32% 1% 0% 60% Control provinces
Takeo 9% 2% 0% 10% 79% Kampong Chhnang 1% 44% 3% 3% 49% Beantay Meanchey 15% 0% 0% 12% 74%
Table I: Millions of fingerlings sold by hatcheries and nurseries in 2018 in treatment provinces
Fish Nurseries (n=7) Hatcheries (n=17) Pangasius 14.500 7.33 Walking catfish 14.600 0.19 Red Tilapia 0.097 4.76 Nile Tilapia 0.118 3.41 C. striata 1.294 0 C. micropeltes 7.350 0 Snakeskin gourami 0.040 0 Red Tail catfish 0.020 0 Silver barb 0.200 2.12 Carp species 0.105 2.59

CAST Baseline Survey | Page 238
Post-harvest segment of the value chain Table J: Volume of fish traded and top fish species traded by treatment group (standard deviation in parenthesis)
Top aquaculture
species traded
Average volume
(tons/year) Aquaculture
fish purchased
Average volume
(tons/year) fish
purchased from
Cambodian aquaculture
Average % of live fish
of total aquaculture
volume purchased
Average % imported
fish of total aquaculture
volume purchased
Average spoilage
(%)
Collectors 1. Channa striata 2. Walking Catfish 3. Pangasius
178.9 (246.9)
117.2 (246.7)
83.3 (23.8) 18.6 (29.2) 1.8 (2.8)
Wholesalers 1. Channa Striata 2. Walking Catfish 3. Pangasius
339.8 (293.4)
233.1 (235.9)
80.5 (25.7) 29.8 (38.1) 1.8 (3.4)
Processors 1. Channa micropeltes 2. Channa striata
182.6 (244.9)
75.8 (81.2) 4.8 (10.8)
Table K: Performance of the post-harvest segments of the aquaculture value chain (treatment group)
Average score “Marketing and
distribution”
Average score “Post-harvest and storage”
Average score “Value added”
Average storage
capacity (tons)
Average total building
surface (m2) Collectors 0.52 0.87 37.91 18.57 Wholesalers 1.20 3.10 0.10 49.05 102.25 Processors 0.76 4.05 0.00 92.97 37.94
Note : Marketing and distribution score includes 4 different practices: 1) forecasting requirement for raw material; 2) forecasting economic return of activity; 3) knowing buyers in advance; 4) having contract or agreement with buyer that indicate volume and date
Post-harvest and storage score include 6 different practices for collectors, and 5 additional practices (11 in total for wholesalers and processor): 1) applying standard practices; 2) being aware of SPS; 3) use ice; 4) use safe ice; 5) use refrigeration; 6) use refrigerated truck; 7) using gloves and mask; 8) employee washing hands; 9) fish not in contact with floor; 10) using detergent to clean equipment; 11) using specific containers to store waste from processing.
Value added score include 4 different practices : 1) label on product with identification; 2) add manufacturing date; 3) add expiration date; 4) add origin of the fish on product

CAST Baseline Survey | Page 239
Table L: Average volume of sold alive and “dead-on ice” fish purchased per actor and per province (MT per year)- Standard deviation in parenthesis.
Provinces Collectors Wholesalers Processors Target
Phnom Penh 280.6 (90.5) 289.3 (252) 60.6 (41.8) Kandal 86.5 (89.8) 165 (21.2) 63.5 (51.6)
Kampong Cham 182 (0) 212.3 (180.8) 56 (22.6) Kampong Thom 25.1 (16) 309.6 (237.5) 425.8 (333.4)
Siem Reap 288 (0) 252 (0) 82 (39.6) Battambang 139.4 (227.9) 945 (190.9) 46.8 (63.5)
Pursat 347.4 (433.2) 333 (325.5) 54 (26.8) Control
Takeo 34.7 (32.7) 59 (91.9) 52.5 (3.5) Beantay meanchey 55.8 (91.8) 32.5 (27.7) 2539.8 (3276.7) Kampong chhnang 29.1 (17.6) 750 (0) 121.2 (86.6)
Access to Information
Table M: Involvement in past project, year of last training (treatment group)
Received Training
(% of target sample)
Year of the last training Past Beneficiary of a development project
(%) Hatcheries (n=17) 84% 81% - last 5 years 53% Nurseries (n=8) 37% 2010 2012 (66%)/ 2016 (33%) 12% Producers (n=918) 13% 75% - last 5 years 9% Collectors (n=23) 4% 2015 4% Wholesalers (n=21) 5% 2017 (50%) 2002 (50%) 10% Processors (n=26) 43% 100% - last 5 years 8%

CAST Baseline Survey | Page 240
Table N: Main source of information of aquaculture producers, wholesalers and processors in treatment group
Percentage of
respondent who claimed to received
information about
Main source of information
Last time it was received
Aquaculture producers n=918 Fingerling quality and prices 48.2 Other farmers
(40%) On demand (38%) Once a year (39%)
Input availability and prices 49.5 Input retailers (43%)
On demand (56%)
Fish farming techniques (feed, water management)
66.5 Other farmers (44%)
Once a year (32%)
Fish prices (live and dead on ice fish market)
66.8 Fish buyers (74%) On demand (48%)
Fish quality and standard 4.8 Fish buyers (25%) Projects (22%)
Once a year (54%)
Technical support 11.6 Projects (52%) FiA (27%)
Once a year (60%)
Processors and wholesalers n=47 Processed fish prices 22 Fish buyers (66%) On demand (66%)
Fish prices (live and dead on ice fish market)
30 Fish buyers (76%) On demand (40%)
Fish quality and standard 8 Fish buyers (80%) -

CAST Baseline Survey | Page 241
Climate change adaptation Table O: Aquaculture operations affected by drought and adaptation practices per actor and per province
Province/Actors Affected by drought (%)
Pond based system
operating well (%)
Average depth of well
(m)
Short species cycle (n)
(%)
Moving cage (%) (
Producers Treatment
Phnom Penh 16 12 - 3 57 Kandal 15 58 52.0 0 43
Kampong Cham 33 43 28.9 1 40 Kampong Thom 6 11 9.5 1 76
Siem Reap 7 16 - 10 38 Battambang 40 37 5.0 19 34
Pursat 44 28 8.0 12 30 Control
Takeo 9 43 30 7 - Beantay meanchey 22 24 - 8 - Kampong Chhnang 41 19 - 9 35
Hatcheries
Target 47. 10 16 NA NA Control 38 77 - NA NA
Nurseries Target 37 50 50 NA NA
Control 0 100 - NA NA

CAST Baseline Survey | Page 242
Table P: Aquaculture operations affected by flood and adaptation practices per actor and per province
Province/Actors Affected by flood (%) Fenced Pond (%) Producers Treatment
Phnom Penh 20 50 Kandal 41 58
Kampong Cham 52 76 Kampong Thom 10 13
Siem Reap 13 14 Battambang 33 56
Pursat 27 33 Control
Takeo 5 4 Beantay meanchey 27 32 Kampong Chhnang 32 46
Hatcheries
Target 41 42 Control 23 14
Nurseries Target 50 100
Control 0 -

CAST Baseline Survey | Page 243
Figure B: Location of potential model farmers – the top 15 fish producers in each province (by volume produced per farm per year). Note that dots overlap in some locations due to proximity of the farms.

CAST Baseline Survey | Page 244
Table Q: Top aquaculture producer communes by province
Province/Actors Top aquaculture producing commune Volume (Kg per commune and per year)
Overall Siem Reap, Siem Reap Kampong Kleang, Siem Reap
Kampong Luong, Pursat Roleab, Pursat
Samrong, Phnom Penh
386,400 506,540 697,550 740,450
1,681,700 Phnom Penh Kok Rokar
Ponhea Porn Prek Phnov Svay Pak Samrong
130,000 210,000 238,513 285,000
1,681,700 Kandal Sambuor Meas
Svay Ampear Preaek Ta Teaen Kampong Loung Chrouy Takeo
46,348 62,800 63,800 117,417 149,300
Kampong Cham Kien Chrey Soutip
Tang Krang Chea Lea
Preaek Koy
76,847 107,000 159,491 161,200 176,000
Kampong Thom Tboung Kravpeur Pat Sanday
Kampong Chin Tboung Kampong Krabau
Peam Bang
33,500 38,950 51,700 68,697 156,713
Siem Reap Dan Run Koa Por
Anlong Samnor Siem Reap
Kampong Kleang
39,400 50,353 65,740 386,400 506,540
Battambang Ta Loas Kaoh Chiveang
Prey Chas Peam Aek
36,767 50,720 125,220 319,800
Pursat Kbal Trach Anlong Tnaot
Me Tuek Kampong Luong
Roleab
63,720 99,621 253,516 697,550 740,450

CAST Baseline Survey | Page 245
Table R: Distribution surveyed farm per size class and province
Cage Pond Province # small-
scale # medium
scale # large scale
# small-scale
# medium scale
# large scale
(30-45m3) (45-90 m3) (>90m3) (<350 m2) (350-700m2) (>700m2)
Treatment Phnom Penh
5 39 2
24
Kandal 4 9 20 20 16 28 Kampong Cham
29 32 71
Kampong Thom 16 36 4 18 18 17 Siem Reap 35 17 8 27 33 42
Battambang 14 18 9 10 12 33 Pursat 110 42 16 12 16 47
Control Takeo
32 30 44
Kampong Chhnang 25 36 42 12 12 19 Beantay Meanchey
2 10 22
Total 204 163 138 164 179 347

CAST Baseline Survey | Page 246
ANNEX G: COVARIATES ANALYSIS Variable: Production Volume (kg per year) - Producers
Covariate n n as % of total
Mean (kg) Standard deviation
>1SD from global mean
Correlation coefficient
1044 - 8479.209 35585.04 - - Province-Battambang 87 8.333333 6646.2299 20038.01 - -
Province-Banteay Meanchey 26 2.490421 2486.8462 2938.634 - -
Province-Kampong Cham 119 11.39847 5964.4202 13778.48 - -
Province-Kampong Chhnang 120 11.49425 5475.9583 8848.173 - -
Province-Kampong Thom 102 9.770115 4374.7157 4657.058 - -
Province-Kandal 85 8.141762 7184.6118 9222.742 - -
Province-Phnom Penh 39 3.735632 65997.769 148789.5 X -
Province-Pursat 224 21.45594 8723.2946 33009.92 - -
Province-Siem Reap 154 14.75096 7087.5844 11949.07 - -
Province-Takeo 88 8.429119 1888.6477 2972.283 - -
Age<30 40 3.831418 5082.975 10839.68 - -
Age ≥30 1004 96.16858 8614.5169 36218.07 - -
Gender-Female 117 11.2069 12142.744 81770.37 - -
Gender-Male 927 88.7931 8016.8209 24223.49 - -
Past project participation-No 957 91.66667 9006.0554 37076.49 - -
Past project participation-Yes 87 8.333333 2683.8966 6267.233 - -
Loan recipient-No 391 37.45211 4933.3939 14915.04 - -
Loan recipient-Yes 653 62.54789 10602.354 43365.47 - -
Production type-both 9 0.862069 6000 5386.325 - -
Production type-cage 438 41.95402 4126.895 6032.852 - -
Production type-pond 597 57.18391 11709.739 46523.91 - -
Control 293 28.06513 4894.2253 7962.14 - -
Treatment 751 71.93487 9877.8775 41585.25 - -
Pond area 597 57.18391 - - - 0.4705879
Cage volume 438 41.95402 - - - 0.4147009

CAST Baseline Survey | Page 247
Variable: Production Volume (kg per year) - Hatcheries
Covariate n n as % of total Mean (kg) Standard deviation
>1SD from global mean
Correlation coefficient
- 26 - 1,782.81 3,040.17 -
Province-Battambang 3 11.54 138.50 112.66 -
Province-Kampong Cham 2 7.69 260.00 332.34 -
Province-Kampong Chhnang 1 3.85 429.50 NA -
Province-Kampong Thom 1 3.85 250.00 NA -
Province-Kandal 2 7.69 5,125.00 2,651.65 -
Province-Pursat 2 7.69 50.07 7.17 -
Province-Siem Reap 3 11.54 4,254.33 7,012.84 -
Province-Takeo 12 46.15 1,802.08 2,372.84 -
Age<30 1 3.85 250.00 NA -
Age ≥30 25 96.15 1,844.13 3,086.41 -
Gender-Female 1 3.85 2,500.00 NA -
Gender-Male 25 96.15 1,754.13 3,099.27 -
Past project participation-No 10 38.46 2,796.80 4,001.81 -
Past project participation-Yes 16 61.54 1,149.07 2,163.76 -
Loan recipient-No 13 50.00 1,991.15 3,660.63 -
Loan recipient-Yes 13 50.00 1,574.47 2,400.27 -
Control 15 57.69 2,153.63 2,550.62 -
Treatment 11 42.31 1,277.15 3,675.76 -
Pond area 26 100.00 - - -0.21

CAST Baseline Survey | Page 248
Variable: Production Volume (kg per year) - Nurseries
Covariate n n as % of total Mean (kg) Standard deviation
>1SD from global mean
Correlation coefficient
- 9 - 6,291.11 7,061.38 -
Province-Battambang 2 22.22 7,800.00 8,061.02 -
Province-Kampong Cham 2 22.22 2,750.00 1,767.77 -
Province-Kampong Thom 1 11.11 900.00 NA -
Province-Kandal 1 11.11 5,000.00 NA -
Province-Phnom Penh 1 11.11 21,380.00 NA -
Province-Siem Reap 1 11.11 8,202.50 NA -
Province-Takeo 1 11.11 37.50 NA -
Age<30 2 22.22 468.75 609.88 -
Age ≥30 7 77.78 7,954.64 7,203.71 -
Gender-Female 1 11.11 21,380.00 NA -
Gender-Male 8 88.89 4,405.00 4,516.16 -
Past project participation-No 8 88.89 6,815.00 7,359.57 -
Past project participation-Yes 1 11.11 2,100.00 NA -
Loan recipient-No 4 44.44 7,345.00 9,513.64 -
Loan recipient-Yes 5 55.56 5,448.00 5,463.03 -
Control 2 22.22 2,518.75 3,509.02 -
Treatment 7 77.78 7,368.93 7,637.60 -
Pond area 4 44.44
0.11

CAST Baseline Survey | Page 249
Variable: Production Volume (MT per year) - Collectors
Covariate n n as % of total Mean (MT) Standard deviation
>1SD from global mean
Correlation coefficient
- 41 - 44.58 67.38 -
Province-Battambang 3 7.32 90.33 130.42 -
Province-Banteay Meanchey 3 7.32 8.47 0.50 -
Province-Kampong Cham 1 2.44 182.00 NA X -
Province-Kampong Chhnang 9 21.95 12.11 9.05 -
Province-Kampong Thom 6 14.63 9.10 7.43 -
Province-Kandal 2 4.88 85.00 91.92 -
Province-Phnom Penh 3 7.32 116.67 28.87 X -
Province-Pursat 3 7.32 60.13 36.00 -
Province-Siem Reap 1 2.44 288.00 NA -
Province-Takeo 10 24.39 19.72 17.64 -
Age<30 3 7.32 85.33 133.95 -
Age≥30 38 92.68 41.36 61.59 -
Gender-Female 21 51.22 51.07 78.12 -
Gender-Male 20 48.78 37.76 55.12 -
Past project participation-No 38 92.68 47.64 69.11 -
Past project participation-Yes 3 7.32 5.77 1.33 -
Loan recipient-No 31 75.61 48.68 75.51 -
Loan recipient-Yes 10 24.39 31.86 30.55
Control 21 51.22 22.68 32.22
Treatment 20 48.78 67.57 85.90

CAST Baseline Survey | Page 250
Variable: Production Volume (MT per year) - Wholesalers
Covariate n n as % of total Mean (MT) Standard deviation
>1SD from global mean
Correlation coefficient
- 34 - 159.47 201.56 - -
Province-Battambang 2 5.88 630.00 254.56 X -
Province-Banteay Meanchey 1 2.94 283.00 NA - -
Province-Kampong Cham 4 11.76 215.00 178.93 - -
Province-Kampong Chhnang 5 14.71 38.20 32.35 - -
Province-Kampong Thom 3 8.82 308.67 224.97 - -
Province-Kandal 3 8.82 55.67 59.72 - -
Province-Phnom Penh 5 14.71 193.80 221.30 - -
Province-Pursat 4 11.76 50.50 40.68 - -
Province-Siem Reap 1 2.94 40.00 NA - -
Province-Takeo 6 17.65 87.33 157.79 - -
Age ≥30 34 100.00 159.47 201.56 - -
Gender-Female 13 38.24 192.08 245.47 - -
Gender-Male 21 61.76 139.29 172.51 - -
Past project participation-No 31 91.18 161.61 204.97 - -
Past project participation-Yes 3 8.82 137.33 198.33 - -
Loan recipient-No 18 52.94 155.33 223.04 - -
Loan recipient-Yes 16 47.06 164.13 181.52 -
Control 14 41.18 63.00 104.73 -
Treatment 20 58.82 227.00 226.71 -

CAST Baseline Survey | Page 251
Variable: Production Volume (MT per year) - Processors
Covariate n n as % of total Mean (MT) Standard deviation
>1SD from global mean
Correlation coefficient
- 28 - 344.14 1,308.96 - -
Province-Battambang 4 14.29 16.23 12.31 - -
Province-Banteay Meanchey 2 7.14 121.25 86.62 - -
Province-Kampong Chhnang 4 14.29 1,914.88 3,395.95 X -
Province-Kampong Thom 5 17.86 137.40 135.67 - -
Province-Kandal 2 7.14 63.50 51.62 - -
Province-Phnom Penh 3 10.71 115.00 82.16 - -
Province-Pursat 1 3.57 73.00 NA - -
Province-Siem Reap 5 17.86 67.38 47.95 - -
Province-Takeo 2 7.14 50.00 - - -
Age<30 1 3.57 200.00 NA - -
Age ≥30 27 96.43 349.47 1,333.58 - -
Gender-Female 13 46.43 117.11 151.73 - -
Gender-Male 15 53.57 540.89 1,787.54 - -
Past project participation-No 27 96.43 353.55 1,332.93 - -
Past project participation-Yes 1 3.57 90.00 NA - -
Loan recipient-No 15 53.57 550.49 1,788.30 - -
Loan recipient-Yes 13 46.43 106.04 97.12 -
Control 8 28.57 985.81 2,435.03 -
Treatment 20 71.43 87.47 87.01 -

CAST Baseline Survey | Page 252
Variable: Value (KHR per year) - Producers
Covariate n n as % of total
Mean (KHR) Standard deviation
>1SD from global mean
Correlation coefficient
- 1044 - 56,277,354 183,396,258 - -
Province-Battambang 87 8 33,324,448 84,945,208 - -
Province-Banteay Meanchey 26 2 12,758,423 12,414,963 - -
Province-Kampong Cham 119 11 42,205,101 97,035,806 - -
Province-Kampong Chhnang 120 11 54,588,971 125,934,357 - -
Province-Kampong Thom 102 10 27,375,433 37,033,381 - -
Province-Kandal 85 8 58,880,445 66,998,866 - -
Province-Phnom Penh 39 4 373,828,138 674,475,662 X -
Province-Pursat 224 21 53,890,754 184,121,823 - -
Province-Siem Reap 154 15 55,899,310 106,894,500 - -
Province-Takeo 88 8 10,148,585 15,575,886 - -
Age<30 40 4 51,846,665 149,605,205 - -
Age ≥30 1004 96 56,453,875 184,673,877 - -
Gender-Female 117 11 63,436,468 352,703,088 - -
Gender-Male 927 89 55,373,776 149,308,579 - -
Past project participation-No 957 92 59,928,295 190,867,247 - -
Past project participation-Yes 87 8 16,117,000 34,101,536 - -
Loan recipient-No 391 37 32,935,254 87,271,624 - -
Loan recipient-Yes 653 63 70,254,017 220,740,135 - -
Production type-both 9 1 48,212,222 52,270,659 - -
Production type-cage 438 42 33,836,967 78,483,635 - -
Production type-pond 597 57 72,862,740 231,646,608 - -
Control 293 28 42,486,655 90,996,997 - -
Treatment 751 72 61,657,746 208,438,963 - -
Pond area 597 100 - - - 0.4705879
Cage volume 438 100 - - - 0.4147009

CAST Baseline Survey | Page 253
Variable: Value (KHR per year) - Hatcheries
Covariate n n as % of total Mean (KHR) Standard deviation
>1SD from global mean
Correlation coefficient
- 26 - 393,198 1,175,080 - -
Province-Battambang 3 12 14,418 6,666 - -
Province-Kampong Cham 2 8 29,800 39,315 - -
Province-Kampong Chhnang 1 4 5,958,500 NA - -
Province-Kampong Thom 1 4 25,000 NA - -
Province-Kandal 2 8 361,250 281,075 - -
Province-Pursat 2 8 5,457 1,353 - -
Province-Siem Reap 3 12 425,183 701,509 - -
Province-Takeo 12 46 177,319 267,597 - -
Age<30 1 4 25,000 NA - -
Age ≥30 25 96 407,926 1,196,859 - -
Gender-Female 1 4 175,000 NA - -
Gender-Male 25 96 401,926 1,198,450 - -
Past project participation-No 10 38 251,095 387,602 - -
Past project participation-Yes 16 62 482,012 1,479,640 - -
Loan recipient-No 13 50 645,956 1,634,089 - -
Loan recipient-Yes 13 50 140,440 260,815 - -
Control 15 58 587,255 1,507,972 - -
Treatment 11 42 128,574 367,348 - -
Pond area 26 100 - - - -0.198

CAST Baseline Survey | Page 254
Variable: Value (KHR per year) - Nurseries
Covariate n n as % of total Mean (KHR) Standard deviation
>1SD from global mean
Correlation coefficient
- 9 - 214,755,556 535,606,036 - -
Province-Battambang 2 22 90,500,000 20,506,097 - -
Province-Kampong Cham 2 22 - - - -
Province-Kampong Thom 1 11 31,000,000 NA - -
Province-Kandal 1 11 22,500,000 NA - -
Province-Phnom Penh 1 11 45,000,000 NA - -
Province-Siem Reap 1 11 1,640,000,000 NA - -
Province-Takeo 1 11 13,300,000 NA - -
Age<30 2 22 22,150,000 12,515,790 - -
Age≥30 7 78 269,785,714 605,453,264 - -
Gender-Female 1 11 45,000,000 NA - -
Gender-Male 8 89 235,975,000 568,528,368 - -
Past project participation-No 8 89 228,475,000 570,893,852 - -
Past project participation-Yes 1 11 105,000,000 NA - -
Loan recipient-No 4 44 50,875,000 37,256,711 - -
Loan recipient-Yes 5 56 345,860,000 724,130,028 - -
Control 2 22 17,900,000 6,505,382 - -
Treatment 7 78 271,000,000 604,882,909 - -
Pond area 4 44 - - - -
- 9 - 214,755,556 535,606,036 - -0.357

CAST Baseline Survey | Page 255
Variable: Value (KHR per year) - Collectors
Covariate n n as % of total
Mean (KHR) Standard deviation >1SD from global mean
Correlation coefficient
- 41 - 4,635,034,512,195 29,672,872,632,811 - -
Province-Battambang 3 7 1,184,000,000 1,676,504,697 - -
Province-Banteay Meanchey 3 7 282,666,667 159,894,757 - -
Province-Kampong Cham 1 2 2,180,000,000 NA - -
Province-Kampong Chhnang 9 22 74,111,111 74,405,048 - -
Province-Kampong Thom 6 15 372,000,000 254,804,239 - -
Province-Kandal 2 5 151,000,000 1,414,214 - -
Province-Phnom Penh 3 7 4,403,333,333 1,864,841,369 - -
Province-Pursat 3 7 63,333,804,000,000 109,696,143,537,033 X -
Province-Siem Reap 1 2 2,590,000,000 NA - -
Province-Takeo 10 24 942,200,000 2,481,485,926 - -
Age<30 3 7 1,132,000,000 1,712,998,249 - -
Age≥30 38 93 5,000,868,921,053 30,821,925,297,659 - -
Gender-Female 21 51 949,476,190 1,790,015,743 - -
Gender-Male 20 49 9,500,823,800,000 42,485,097,704,856 - -
Past project participation-No 38 93 5,000,953,473,684 30,821,911,212,312 - -
Past project participation-Yes 3 7 61,000,000 84,870,490 - -
Loan recipient-No 31 76 835,677,419 1,487,245,740 - -
Loan recipient-Yes 10 24 19,001,050,900,000 60,082,906,343,715 - -
Control 21 51 494,809,524 1,721,846,672 - -
Treatment 20 49 9,501,301,200,000 42,484,985,334,834

CAST Baseline Survey | Page 256
Variable: Value (KHR per year) - Wholesalers
Covariate n n as % of total Mean (KHR) Standard deviation >1SD from global mean
correlation coefficient
- 34
1,695,352,941 2,359,737,015 - -
Province-Battambang 2 6 4,935,000,000 91,923,882 X -
Province-Banteay Meanchey 1 3 10,900,000,000 NA X -
Province-Kampong Cham 4 12 1,935,000,000 1,620,092,590 - -
Province-Kampong Chhnang 5 15 146,200,000 69,301,515 - -
Province-Kampong Thom 3 9 2,604,666,667 2,223,138,622 - -
Province-Kandal 3 9 1,059,666,667 972,075,271 - -
Province-Phnom Penh 5 15 1,361,800,000 1,942,325,204 - -
Province-Pursat 4 12 1,807,500,000 2,213,250,475 - -
Province-Siem Reap 1 3 990,000,000 NA - -
Province-Takeo 6 18 396,500,000 534,650,821 - -
Age≥30 34 100 1,695,352,941 2,359,737,015 - -
Gender-Female 13 38 2,677,769,231 3,133,541,770 - -
Gender-Male 21 62 1,087,190,476 1,510,180,374 - -
Past project participation-No 31 91 1,723,000,000 2,442,483,258 - -
Past project participation-Yes 3 9 1,409,666,667 1,502,591,206 - -
Loan recipient-No 18 53 1,592,222,222 2,822,047,203 - -
Loan recipient-Yes 16 47 1,811,375,000 1,788,143,502 - -
Control 14 41 449,214,286 615,944,950 - -
Treatment 20 59 2,567,650,000 2,732,510,784 - -

CAST Baseline Survey | Page 257
Variable: Value (KHR per year) - Processors
Covariate n n as % of total Mean (KHR) Standard deviation >1SD from global mean
Correlation coefficient
Province-Battambang 4 14 1,024,000,000 728,081,268 - -
Province-Banteay Meanchey 2 7 1,990,000,000 1,796,000,000
-
Province-Kampong Chhnang 4 14 8,851,000,000 17,430,000,000 - -
Province-Kampong Thom 5 18 3,290,000,000 2,834,000,000 - -
Province-Kandal 2 7 33,600,000,000,000 47,500,000,000,000 - -
Province-Phnom Penh 3 11 299,333,333 333,522,613 - -
Province-Pursat 1 4 325,000,000,000,000 NA X -
Province-Siem Reap 5 18 622,800,000 684,269,830 - -
Province-Takeo 2 7 55,000,000 63,639,610 - -
Age<30 1 4 666,000,000 NA - -
Age≥30 27 96 14,530,000,000,000 63,380,000,000,000 - -
Gender-Female 13 46 5,170,000,000,000 18,640,000,000,000 - -
Gender-Male 15 54 21,670,000,000,000 83,910,000,000,000 - -
Past project participation-No 27 96 14,530,000,000,000 63,380,000,000,000 - -
Past project participation-Yes
1 4 180,000,000 NA - -
Loan recipient-No 15 54 4,483,429,600,000 17,350,018,867,405 - -
Loan recipient-Yes 13 46 25,001,180,000,000 90,138,427,359,233 - -
Control 8 29 8,404,779,125,000 23,756,859,867,722 - -
Treatment 20 71 16,251,427,550,000 72,671,873,281,756 - -

CAST Baseline Survey | Page 258
Variable: Cage Yield (kg/m3)
Covariate n n as % of total
Mean Standard deviation >1SD from global mean
Correlation coefficient
- 440 - 50.30 54.30 -
Province-Battambang 39 8.86 71.68 75.83 -
Province-Kampong Chhnang 83 18.86 40.11 39.19 -
Province-Kampong Thom 51 11.59 65.61 57.37 -
Province-Kandal 29 6.59 33.34 20.21 -
Province-Phnom Penh 20 4.55 44.29 44.73 -
Province-Pursat 161 36.59 47.98 62.77 -
Province-Siem Reap 57 12.95 54.12 31.77 -
Age<30 25 5.68 53.98 38.21 -
Age≥30 415 94.32 50.08 55.15 -
Gender-Female 39 8.86 38.24 20.84 -
Gender-Male 401 91.14 51.48 56.39 -
Past project participation-No 427 97.05 50.24 54.91 -
Past project participation-Yes 13 2.95 52.24 28.56 -
Loan recipient-No 117 26.59 46.92 43.70 -
Loan recipient-Yes 323 73.41 51.53 57.68 -
Control 112 25.45 38.36 35.30 -
Treatment 328 74.55 54.38 58.91 -
Cage volume 440.00 100.00 - - - -0.13236

CAST Baseline Survey | Page 259
Variable: Pond Yield (kg/m2)
Covariate n n as % of total Mean Standard deviation >1SD from global mean Correlation coefficient 596.00 - 5.62 9.86
Province-Battambang 48.00 8.05 3.17 8.82 -
Province-Banteay Meanchey 26.00 4.36 1.07 1.41 -
Province-Kampong Cham 114.00 19.13 4.84 5.24 -
Province-Kampong Chhnang 38.00 6.38 4.84 4.62 -
Province-Kampong Thom 51.00 8.56 6.44 5.81 -
Province-Kandal 54.00 9.06 10.02 9.13 -
Province-Phnom Penh 19.00 3.19 7.96 8.82 -
Province-Pursat 61.00 10.23 5.86 6.78 -
Province-Siem Reap 97.00 16.28 8.43 19.26 -
Province-Takeo 88.00 14.77 2.70 3.00 -
Age<30 14.00 2.35 3.36 3.17 -
Age≥30 582.00 97.65 5.67 9.96 -
Gender-Female 76.00 12.75 4.72 5.10 -
Gender-Male 520.00 87.25 5.75 10.37 -
Past project participation-No 522.00 87.58 6.00 10.21 -
Past project participation-Yes 74.00 12.42 2.96 6.33 -
Loan recipient-No 274.00 45.97 4.57 12.66 -
Loan recipient-Yes 322.00 54.03 6.52 6.50 -
Control 180.00 30.20 5.35 6.60 -
Treatment 416.00 69.80 5.74 10.98 -
Pond area 596.00 100.00 - - - -0.04345

CAST Baseline Survey | Page 260
Variable: Pellet Feed Use (frequency)
Covariate n n as % of total
N using pellets
Frequency Mean Standard deviation
p-value (chi
squared test)
chi squared
value
- 1204
699 58.0564784 - - - -
Province-Battambang 95 7.890365 74 77.8947368 - - <0.001 97.839
Province-Banteay Meanchey 34 2.82392 30 88.2352941 - - - -
Province-Kampong Cham 137 11.37874 72 52.5547445 - - - -
Province-Kampong Chhnang 146 12.12625 58 39.7260274 - - - -
Province-Kampong Thom 109 9.053156 55 50.4587156 - - - -
Province-Kandal 99 8.222591 37 37.3737374 - - - -
Province-Phnom Penh 70 5.813953 46 65.7142857 - - - -
Province-Pursat 245 20.34884 155 63.2653061 - - - -
Province-Siem Reap 162 13.45515 86 53.0864198 - - - -
Province-Takeo 107 8.887043 86 80.3738318 - - - -
Age<30 50 4.152824 31 62 - - 0.5638 0.33315
Age≥30 1154 95.84718 668 57.8856153 - - - -
Gender-Female 133 11.04651 74 55.6390977 - - 0.5492 0.35881
Gender-Male 1071 88.95349 625 58.356676 - - - -
Past project participation-No 1108 92.02658 613 55.3249097 - - <0.001 42.58
Past project participation-Yes 96 7.973422 86 89.5833333 - - - -
Loan recipient-No 466 38.70432 311 66.7381974 - - <0.001 23.532
Loan recipient-Yes 738 61.29568 388 52.5745257 - - - -
Production type-both 9 0.747508 3 33.3333333 - - 0.004 11.167
Production type-cage 505 41.94352 269 53.2673267 - - - -
Production type-pond 690 57.30897 427 61.884058 - - - -
Control 352 29.23588 181 51.4204545 - - 0.003 8.9956
Treatment 852 70.76412 518 60.7981221 - - - -

CAST Baseline Survey | Page 261
Variable: Top Species Produced (frequency)
Covariate n n as % of total
N stocking
Pangasius
Frequency p-value (chi
squared test)
chi squared
value
Notes
- 1203
392 32.5852037 - -
Province-Battambang 95 7.896924 28 29.4736842 <0.001 150.9
Province-Banteay Meanchey 34 2.826268 13 38.2352941 - -
Province-Kampong Cham 137 11.3882 76 55.4744526 - -
Province-Kampong Chhnang
146 12.13633 39 26.7123288 - -
Province-Kampong Thom 109 9.060682 46 42.2018349 - -
Province-Kandal 99 8.229426 18 18.1818182 - -
Province-Phnom Penh 70 5.818786 16 22.8571429 - -
Province-Pursat 245 20.36575 48 19.5918367 - -
Province-Siem Reap 161 13.38321 33 20.4968944 - -
Province-Takeo 107 8.894431 75 70.0934579 - -
Age<30 50 4.156276 11 22 0.1 2.6609
Ag≥30 1153 95.84372 381 33.0442324 - -
Gender-Female 132 10.97257 52 39.3939394 0.08 3.129
Gender-Male 1071 89.02743 340 31.7460317 - -
Past project participation-No
1107 92.01995 365 32.9719964 0.3 0.94476
Past project participation-Yes
96 7.98005 27 28.125 - -
Loan recipient-No 466 38.73649 209 44.8497854 <0.001 52.085
Loan recipient-Yes 737 61.26351 183 24.8303935 - -
Production type-both 9 0.74813 3 33.3333333 <0.001 223.18
Production type-cage 505 41.97839 45 8.91089109 - - top cage species is Channa striata (45%)
Production type-pond 689 57.27348 344 49.9274311 - -
Control 352 29.26018 132 37.5 0.02 5.4716
Treatment 851 70.73982 260 30.5522914 - -

CAST Baseline Survey | Page 262
Variable: Most frequent aquaculture management practice reported - not feeding fish with fish waste from harvest
Covariate n n as % of total
n adopting practice
Frequency p-value (chi squared test)
chi squared value
- 1204
792 65.7807309 - -
Province-Battambang 95 7.890365 43 45.2631579 <0.001 35.002
Province-Banteay Meanchey 34 2.82392 19 55.8823529 - -
Province-Kampong Cham 137 11.37874 95 69.3430657 - -
Province-Kampong Chhnang 146 12.12625 104 71.2328767 - -
Province-Kampong Thom 109 9.053156 84 77.0642202 - -
Province-Kandal 99 8.222591 64 64.6464646 - -
Province-Phnom Penh 70 5.813953 41 58.5714286 - -
Province-Pursat 245 20.34884 152 62.0408163 - -
Province-Siem Reap 162 13.45515 118 72.8395062 - -
Province-Takeo 107 8.887043 72 67.2897196 - -
Age<30 50 4.152824 30 60 0.4 0.77444
Age≥30 1154 95.84718 762 66.0311958 - -
Gender-Female 133 11.04651 94 70.6766917 0.2 1.5922
Gender-Male 1071 88.95349 698 65.1727358 - -
Past project participation-No 1108 92.02658 719 64.8916968 0.03 4.8794
Past project participation-Yes 96 7.973422 73 76.0416667 - -
Loan recipient-No 466 38.70432 308 66.0944206 0.9 0.033234
Loan recipient-Yes 738 61.29568 484 65.5826558 - -
Production type-both 9 0.747508 9 100 0.002 12.018
Production type-cage 505 41.94352 309 61.1881188 - -
Production type-pond 690 57.30897 474 68.6956522 - -
Control 352 29.23588 240 68.1818182 0.3 1.274
Treatment 852 70.76412 552 64.7887324 - -

CAST Baseline Survey | Page 263
Variable: Most frequent post-harvest or business management practice - having a contract or agreement with buyer
Covariate n n as % of total
Frequency p-value (chi
squared test) chi squared value
- 1204
1076 89.3687708 - -
Province-Battambang 95 7.890365 83 87.3684211 <0.001 145.53
Province-Banteay Meanchey 34 2.82392 25 73.5294118 - -
Province-Kampong Cham 137 11.37874 108 78.8321168 - -
Province-Kampong Chhnang 146 12.12625 141 96.5753425 - -
Province-Kampong Thom 109 9.053156 101 92.6605505 - -
Province-Kandal 99 8.222591 88 88.8888889 - -
Province-Phnom Penh 70 5.813953 69 98.5714286 - -
Province-Pursat 245 20.34884 239 97.5510204 - -
Province-Siem Reap 162 13.45515 155 95.6790123 - -
Province-Takeo 107 8.887043 67 62.6168224 - -
Age<30 50 4.152824 49 98 0.04 4.0904
Age≥30 1154 95.84718 1027 88.9948007 - -
Gender-Female 133 11.04651 107 80.4511278 <0.001 12.515
Gender-Male 1071 88.95349 969 90.4761905 - -
Past project participation-No 1108 92.02658 1002 90.433213 <0.001 16.572
Past project participation-Yes 96 7.973422 74 77.0833333 - -
Loan recipient-No 466 38.70432 385 82.6180258 <0.001 36.466
Loan recipient-Yes 738 61.29568 691 93.6314363 - -
Production type-both 9 0.747508 8 88.8888889 <0.001 75.287
Production type-cage 505 41.94352 497 98.4158416 - -
Production type-pond 690 57.30897 571 82.7536232 - -
Control 352 29.23588 296 84.0909091 <0.001 14.584
Treatment 852 70.76412 780 91.5492958 - -

CAST Baseline Survey | Page 264
Distribution of Propensity Score before and after matching
Figure D: Distribution of Propensity Score before and after matching
01
23
45
kden
sity
_ps
core
.2 .4 .6 .8 1x
Control Treatment
Pscore Before Match
01
23
45
kden
sity
_ps
core
.2 .4 .6 .8 1x
Control Treatment
Pscore After Match

CAST Baseline Survey | Page 265
Table S: List of Un-matched producers (and survey ID) during the PSM analysis
No Province ID 1 Phnom Penh 1160 2 Phnom Penh 1164 3 Phnom Penh 1170 4 Phnom Penh 1175 5 Phnom Penh 1183 6 Phnom Penh 1187 7 Phnom Penh 1191 8 Phnom Penh 1200 9 Phnom Penh 1202
10 Phnom Penh 1203 11 Kandal 1161 12 Kandal 1169 13 Kandal 1171 14 Kandal 1177 15 Kandal 1178 16 Kampong Cham 1163 17 Kampong Cham 1190 18 Kampong Cham 1201 19 Kampong Thom 1174 20 Kampong Thom 1193 21 Kampong Thom 1196 22 Kampong Thom 1198 23 Kampong Thom 1204 24 Siem Reap 1173 25 Siem Reap 1176 26 Siem Reap 1180 27 Battambang 1162 28 Battambang 1165 29 Battambang 1166

CAST Baseline Survey | Page 266
30 Battambang 1167 31 Battambang 1168 32 Battambang 1172 33 Battambang 1194 34 Battambang 1197 35 Pursat 1179 36 Pursat 1181 37 Pursat 1182 38 Pursat 1184 39 Pursat 1185 40 Pursat 1186 41 Pursat 1188 42 Pursat 1189 43 Pursat 1192 44 Pursat 1195 45 Pursat 1199
Table U: Result of matched and unmatched variables used during the PSM (U: un-matched; M : matched)
Variable Matched Treated Control %bias bias t p>t V(C)
age U 46.724 48.678 -17.8
-2.66 0.008 0.92
M 46.724 46.231 4.5 74.8 0.96 0.335 1.02
gender U 0.88671 0.8986 -3.8
-0.56 0.576 .
M 0.88774 0.91317 -8.2 -113.9 -1.78 0.076 .
loan U 0.51416 0.33566 36.7
5.34 0 .
M 0.50515 0.51226 -1.5 96 -0.3 0.767 .

CAST Baseline Survey | Page 267
year U 9.1776 9.5105 -4.2
-0.63 0.527 0.9
M 8.9301 9.28 -4.4 -5.1 -0.98 0.329 0.97
farmsize U 3568.9 3600.7 -0.4
-0.05 0.96 2.57*
M 3045.6 2610.3 5.2 -1269.8 1.39 0.164 2.54*
producttype U 0.43791 0.36014 15.9
2.33 0.02 .
M 0.43757 0.48614 -9.9 37.5 -2.04 0.042 .
numbercage U 0.61111 0.61888 -0.8
-0.13 0.899 0.64*
M 0.59107 0.66277 -7.5 -822.9 -1.86 0.063 0.93
numberpond U 0.878 0.87762 0
0.01 0.996 1.46*
M 0.83505 0.7693 6.7 17514.9 1.44 0.149 1.03
pondsize U 1539.7 1215.6 7.5
1.06 0.291 1.38*
M 1292.2 1012.1 6.4 13.6 1.53 0.127 1.18*
male0_14 U 0.14052 0.13636 1
0.14 0.889 1.22*
M 0.13288 0.11959 3.1 -219.5 0.69 0.49 1.49*
female0_14 U 0.1122 0.07692 9.9
1.42 0.156 1.25*
M 0.09737 0.08637 3.1 68.8 0.67 0.505 0.88*
male15_29 U 0.56754 0.6049 -4.3
-0.64 0.519 0.89
M 0.56586 0.55097 1.7 60.1 0.37 0.709 1.01
female15_29 U 0.44989 0.4021 6.7
0.97 0.332 1.13
M 0.44903 0.42772 3 55.4 0.63 0.526 1.24*
male30 U 1.0458 1.049 -0.7
-0.1 0.921 1.55*

CAST Baseline Survey | Page 268
M 1.0321 1.0231 2 -179.3 0.43 0.669 1.28*
female30 U 0.92484 0.96503 -8.2
-1.2 0.23 1.08
M 0.91867 0.90103 3.6 56.1 0.77 0.439 1.1
employee U 0.16122 0.08392 14.4
1.99 0.046 1.73*
M 0.10309 0.06804 6.5 54.7 1.77 0.076 1.21*

CAST Baseline Survey | Page 269
ANNEX H: LIST OF DOCUMENT CONSULTED
Articles and reports
AgriSource. 2016. EMP soy market assessment for Cambodia. Report submitted to WISHH.
Bengtson, D.A. et al., 2016. Estimating Carrying Capacity for Aquaculture in Cambodia. In FEED THE FUTURE INNOVATION LAB FOR COLLABORATIVE (AQUAFISH INNOVATION LAB) Technical Reports Investigations 2013-2015 Volume 2 October 2016.
Chin, L., 2015. Enabling the Freshwater Fish Culture Champions of Cambodia to Pull Through Difficult Times. Fish for the People, 13(2), pp.23–36.
Golub, S. & Varma, A., 2014. Fishing Exports and Economic Development of Least Developed Countries: Bangladesh, Cambodia, Comoros, Sierra Leone and Uganda. Paper Prepared for UNCTAD.
ICEM, 2013. USAID Mekong ARCC Climate Change Impact and Adaptation: Main Report. Prepared for the United States Agency for International Development by ICEM - International Centre for Environmental Management.
JICA, 2015. Freshwater Aquaculture Improvement and Extension Project in Cambodia Phase 2 Final Report. (February).
Joffre, O., So, N. & Chheng, P., 2016. Aquaculture production in Cambodia: trends and patterns in recent years. Inland Fisheries Research and Development Institute (Fisheries Administration) and WorldFish. Phnom Penh, Cambodia. 14 pp.
Joffre O.M., Pant J., Somony T., Chantrea B. and Viseth H., 2019. Transforming aquaculture in Cambodia through introduction of improved tilapia. Penang, Malaysia: WorldFish. Program Brief: 2019-03.
Kusakabe, K., 2016. Women Fish Processors in Cambodia: Challenges for Collective Business Goals. In N., M.J. Williams, M. Porter and K. Kusakabe. 2016. Gender in Aquaculture and Fisheries: The Long Journey to Equality. Asian Fisheries Science (Special Issue) 29S. pp. 93–110.
MAFF, 2018. Briefing paper agricultural strategic development plan 2019-2023 national strategic development plan 2019-2023 fisheries. (August 2018), pp. 1–39.
Maredia, M.K., Suvedi M., Pitoro R., Ghimire R., 2017. Impact Evaluation of the Feed the Future Cambodia Helping Address Rural Vulnerabilities and Ecosystem Stability (HARVEST) Project. MSU International Development Working Paper
Navy, H., Minh, T.H. & Pomeroy, R., 2016. Impacts of climate change on snakehead fish value chains in the Lower Mekong Basin of Cambodia and Vietnam. Aquaculture Economics & Management.
Nietes-satapornvanit, A., 2016. Women in Aquaculture. Aquaculture Asia, (April), pp.4–6.
NIRAS, 2016. Feasibility Study of Cambodia Programme for Sustainable and Inclusive Growth in the Fisheries Sector: Aquaculture component (CAPFISH Aquaculture).

CAST Baseline Survey | Page 270
Lang, O, 2014. Current status of sustainable aquaculture in Cambodia. In International Workshop on Resource Enhancement and Sustainable Aquaculture Practices in Southeast Asia.
Richardson, R., Suvedi, M., M.K. and S.M., 2017. Cambodia HARVEST Aquaculture Program Evaluation. In Feed the Future – Cambodia Impact Evaluation and Strengthening of Local Capacity to Monitor and Evaluate Food Security Programs Evaluation case study reports.
Richardson, R. & Suvedi, M., 2018. Assessing the Potential for Small-Scale Aquaculture in Cambodia. Environments, 5(7), p.76. Available at: http://www.mdpi.com/2076-3298/5/7/76.
Sinh, L.X., Navy, H. & Robert Pomeroy, 2014. Value Chain of snakehead fish in the Lower Mekong Basin of Cambodia and Vietnam. Aquaculture Economics & Management, 18, pp.76–96.
VCA4D, 2018. Aquaculture value chain analysis in Cambodia. Brief N 9. November 2018. 6pp.
WorldFish, 2011. Fish supply and demand scenarios in Cambodia and perspectives on the future role of aquaculture. Scenario, pp.1–8. Penang, Malaysia: WorldFish. Project Brief: 2011-23.
Official Statistics and government reports
FiA. 2017. Official Fisheries Statistics. Fisheries Administration, Cambodia.
FiA. 2017. Official Fisheries Statistics, Fisheries export. Fisheries Administration, Cambodia
FiA. 2016. Official Fisheries Statistics, Fisheries export. Fisheries Administration, Cambodia
FIA. 2017. National Strategic Development Plan for Aquaculture up to 2030. Fisheries Administration, Cambodia.
FiA. 2018. Strategic plan for fishery value chain development in Cambodia 2019-2030. Draft report 14th June 2018. Fisheries Administration, Cambodia
FiA, 2019. Preparation of ASDP / PASDP-Fisheries. Presentation Technical Working Group on Fisheries. March 2019.
GATS Global Agricultural Trade System, United States Department of Agriculture,
Foreign Agricultural Service
MAFF. 2016. Agriculture statistics
MAFF. 2017. Agriculture statistics
MAFF. 2018. Agriculture statistics (in Khmer)
NIS 2017. Cambodia Socio Economic survey. Final report.
NIS 2017. Cambodia Socio Economic survey. Questionnaire.
NIS 2015. Cambodia Socio Economic survey, dataset.

CAST Baseline Survey | Page 271
HARVEST Program
Inland Fish Farmers’ Inputs & Services Suppliers Guide. 2011
List of villages. Harvest Client in Pursat, Siem Reap, Battambang, Kampong Thom
Harvest Evaluation Data Set

CAST Baseline Survey | Page 272
ANNEX I: QUALITATIVE STUDY FINDINGS
A. Aquaculture industry This topic was explored with a wide range of value chain entities, including development partners,
government representatives, Microfinance Institutions (MFIs), Hotels, Restaurants and Caterers (HORECA) and producers, nurseries, hatcheries and post-harvest actors. Within this topic, the researchers investigated two main areas of interest: i) constraints and opportunities to the commercialization of the aquaculture sector, and ii) constraints and opportunities to developing a traceability and quality control system for aquaculture products.
A.1. Constraints to the commercialization of the aquaculture sector
A common theme is the high cost of inputs, such as fingerlings, pellets, medicines/hormones, that affect both producers and hatcheries. The fact that these inputs need to be imported from neighboring countries contributes to their high price on the Cambodian market. The high prices of these inputs leads to increased costs for aquaculture production as well as higher electricity and fuel costs, increasing the overall operational cost of aquaculture production. The high cost of inputs hinders the competitiveness of Cambodian aquaculture products within the domestic market and also for export.
A producer mentioned that: “In the aquaculture sector, the cost of raising fish is higher than the cost of selling fish on the market”.
Market price is controlled by middlemen. Producers have limited bargaining power, as mentioned by a CAST partner: “… they [the middlemen] always make trouble for the fish farmers. […] from the interview or the survey I did with the snakehead fish farmers, almost 50%, I could say, they had trouble with the market price. Ahead of the harvesting season, and normally before any important function or ceremony, the price is high, but the middleman just lower the market price.”
A related theme concerns the low market price of imported fish, constraining Cambodian producers’ access to the market and reducing their profit margins. This also links to the point about preference for Cambodian produced fish. By raising the profile of local fish, Cambodian producers can begin to differentiate price and not be so beholden to the Vietnamese prices. Market prices are uncertain and fluctuate according to imports. A producer said: “…. the price rate is not stable, it declines when the imported fish from Vietnam enters the market. Because whenever it enters the market, our fish prices decrease.” This relates to an inadequate institutional framework and capacity, as well as the lack of political will to control imports of aquaculture products. The inadequate institutional framework also affects exports. There is an absence of regulation and procedures to control the quality of fish products for export, and thus to facilitate access to the export market. A development partner says “…to export fisheries products you need a competent authority, and up to now there is no written document anywhere”. A feed mill operator mentioned: “We cannot even adequately supply the domestic market; we need to import aquaculture fish”.
Aquaculture in Cambodia operates at a low technical level. Respondents described the level of technology and adoption of new technology as low. There is limited capacity to adopt innovations due to the limited capacity of extension services, and the farmers’ limited knowledge and risk averseness to adopting new technologies. A processor mentioned: “Sometimes people are greedy. Their pond can be
CAST Baseline Survey | Page 273
stocked with only 1,000 [fingerlings]. However, they try to stock 3,000 [fingerlings]. So this project will fail if he stocks too much”.
“the lack of quality is because of the knowledge in mixing the diet is still limited. The reason we are still behind is from the quality of our product. When the feed doesn’t meet the standard, fish grow slowly”, explains a feed distributor
Again, this theme is also linked with institutional constraints and the limited capacity of the research and extension services. A government representative mentioned that: “...laboratory are also very poor regarding fish diseases, water quality analysis. Genetic conservation issues [are] also very poor... These relate to the lack capacity of human resources”.
Finally, biophysical constraints concern inaccessibility to water and pollution of water resources by agriculture and industry. The months of April and May are difficult for fish farmers, as they often do not have access to water sources. A lack of water and high temperatures increase the occurrence of fish diseases. In addition, the development of industry and the intensification of agriculture now affects aquaculture activities as explained by producer: “we cannot pump water from our stream. Why so? Because the Chinese spray chemical substances on cassava and rice which flow into the stream. If we are not careful with that water, our fish would die”.
In addition, fish farmers stock and harvest at the same time due to climate constraints. This results in over-supply of the market, thereby reducing market prices and limiting producers’ bargaining power.
A.2. Opportunities for commercialization of the aquaculture sector
First, respondents perceived that national fish production is far from reaching its potential, given an important domestic market. There is a common belief that Cambodian-farmed fish is of good quality, and is raised using less chemicals compared to imported fish. Often, Cambodian aquaculture fish is ranked second in terms of quality behind wild fish. However, it is a common belief that farmed fish should be sold “live” as an indicator of freshness.
A wholesaler said: “…The quality of our fish is different from those fish from Vietnam. Our fish is of good quality and would not have any impact on our health. Producers in this village raise their fish in a very hygienic way; I myself also eat these fish”.
Another wholesaler mentioned: “Even though we sell our local fish at a higher price, people still buy our fish. Even though imported fish is sold at cheap prices, buyers would not buy it if they knew it was imported”.
Another opportunity mentioned by respondents is the role of the Pangasius in supporting the development of a commercial aquaculture sector. Pangasius is considered to be easy to raise, and is popular amongst farmers. In addition, suitable pelleted feed is already available. Respondents mentioned that Pangasius can be processed to create different products, and can also be sold un-processed or live. One wholesaler mentioned: “Do you know why fish retailers love selling Pangasius? Because when they cannot sell all of them, they can process them into various products. They can process Pangasius into fish paste and salted dried [fish]. They only need to dry them in the sun for a while before they can sell those processed fish. They can process it to fermented Pangasius.” Pangasius is seen as a model for the development of commercial fish farming and for industrial processing and export. A feed mill manager explains: “You know the market demand for process Pangasius is pretty high. So, in the next five years we may see more competition on both quality and price of the fish feed in our aquaculture market and I think we may see larger farms in our country”.
CAST Baseline Survey | Page 274
A.3. Constraints to developing a traceability and quality control system for aquaculture products
Two themes emerge from this topic. First, a theme that covers the limited technical capacity within the sector to enforce a traceability system and the lack of knowledge and awareness amongst aquaculture actors. The second theme concerns the lack of a regulatory framework to enforce an SPS and traceability system.
Several interviewees mentioned that producers lack knowledge regarding both SPS regulation and a traceability system. The lack of basic techniques for raising fish, fish health and food safety creates difficulties for the development and deployment of quality standards. In the post-harvest segments of the value chain, fish collectors and wholesalers are not interested in SPS, as it involves different ways of operating that are not necessarily rewarded with higher price. A CAST partner mentioned that: “So, even though the producers follow all the good standards of production, when the retailers know the collectors are coming, they don’t really give value. So it means they just give the same price. And then, later on, the producer might think ‘why do I need to do all these complicated things, and then the price is still the same?’”.
Another barrier is the lack of awareness about food safety amongst most of the poor and rural population of Cambodia, whose first criteria when purchasing fish is the price. In addition, consumers are purchasing live fish, which means good quality, as mentioned by a wholesaler: “…they [consumers] buy based on the size. Live fish means that fish is good quality. No one questions about fish quality; as long as fish are alive, fat and available in the market, those fishes are good”. A restaurant manager made mention of SPS regulations: “Sometimes the laws [guidelines and regulations] have already been established, but we do not understand what's in them, so it’s more like everything is okay”.
A development partner said: “How much people know HACCP60 logo? […] so then there’s no pressure. If the consumers start to go to market and looking for these labels then producers will follow. So we don’t have it, so there is a lack of pressure from consumers”.
Regulation, and its enforcement, is a key barrier to develop SPS and traceability systems. It appears that a traceability pilot system was developed in 2010 by FiA, but without success, due to a lack of the required capacity to coordinate different actors of the value chain. Also, SPS guidelines were never finalized due to a lack of budget and support from development partners. A government official mentioned: “We initiated it once in 2010, but there were constraints in making the system work. We lacked technical capacity to make the system. Another problem is that, this traceability system involves various actors, including producers, raw material suppliers, input suppliers, transporters, processors and market distributors. They all need to be recorded in the system, but currently, all these actors aren’t cooperating much. And the thing is that, we haven’t established that system yet”.
In addition, the roles and responsibilities for monitoring and controlling imported fish products are unclear among government departments, and there are overlapping roles between FiA and the Cambodia Import-Export Inspection and Fraud Repression Directorate-General (CAMControl)61. A government official also mentioned that: “Currently, we have some laws and regulations, but they don’t cover all aspects. And the law enforcement is also weak”.
60 Hazard Analysis and Critical Control Point (HACCP) 61 https://www.moc.gov.kh/en-us/faqs/catid/3/contentid/11

CAST Baseline Survey | Page 275
A.4. Opportunities to develop a traceability and quality control system for aquaculture products
One emerging theme concerns the need to develop and enforce an SPS system to facilitate the marketing of aquaculture products for both domestic and international markets. Development partners, government officials but also feed distributors and hotel and restaurant representatives share this vision. A development partner mentioned: “A food safety procedure has to be in place, because we don’t know what chemical products were used in raising this fish”. HORECA and supermarket managers mentioned that consumers (middle and upper class, foreigners) are more aware of food safety issues. Those actors (e.g., supermarkets and HORECA) do check the quality of the aquaculture products they purchase.
Several respondents mentioned that there is a missed opportunity for producers to access the market and sell at higher prices as consumers cannot identify and distinguish between local and imported products. QR code technology was mentioned by a development partner as a traceability system based on block chain mechanism: “I think it’s available but nobody really uses that. You know, this is a block chain technology, so it can trace where it came from, how it is processed. In China, I see they use a lot of QR code everywhere”.
B. Project implementation B.1. Barriers to program implementation
Input supply
Two main themes emerged: i) local conditions to produce fingerlings, and ii) access to loans.
Access to water for nurseries and hatcheries to produce quality fingerlings emerged as an important constraint, as well as the quality of water. A nursery operator mentioned: “Another constraint is the irregular rain that makes fish become sick or die […] it will make the fish die”. Fingerling production is hindered by the low quality of broodfish available in Cambodia. A hatchery manager mentioned: “We do not have a place for brood-fish supply which follows proper technical standards”.
The cost of pelleted feed is high, due to transportation costs. Low-cost feed is often of low quality, affecting the growth and performance of hatcheries and nurseries, as mentioned by a nursery operator: “If we buy the feed to feed our fish, we might fail because of the lack of protein content in the feed. In Vietnam, they check the quality of fish feed – to check that it contains 30% protein. So the fish will grow fast”
The second theme concerns access to finance for commercial farms, nurseries and hatcheries. Access to loans from MFIs requires collateral, which is a main barrier to some nurseries and hatcheries in accessing such loans. Instead, they borrow from informal lenders, with high interest rates. This limits investment and growth of the sector. Feed distributors often provide in-kind loans to fish farmers, but they then can face problems in generating sufficient cash flow to run their business until the loan is repaid after harvest: “Another challenge is that it is hard since some customers owe us, and the debt could get too big – we cannot allow anymore. And we do not have the ability to make exchanges with the company too much, because if we place an order at the company, we have to pay up. That is the main issue” mentioned one feed distributor.
Producers
Three themes emerged: i) competitiveness between imported and wild fish; ii) access to quality inputs; iii) financial barriers.
CAST Baseline Survey | Page 276
Project implementation will face strong competition from imported fish that is low-cost and popular amongst the rural population because of its affordability. Local producers face problems in selling their Pangasius due to this competition. A fish farmer said: “The problem is that a lot of Pangasius remains since there are a lot of imported fish from Vietnam. A lot of imported fish from Vietnam entered [Cambodia] recently, so the local fish prices declined”.
Due to local conditions, and particularly access to water, local fish farmers sell their product at the same time in the season, which also means that local fish is not available during some parts of the year. This creates a specific market for imported fish.
“Everything that come from neighboring country, they [consumers] tend to feel it’s not good. It is not good or bad but this what people feel, so if we can take this advantage and help consumer to identify which one is from Cambodia, which one come from imported, from Vietnam or Thailand. That would help a lot, even that our price is higher”. (Development partner).
A wholesaler explains: “Channa striata (Trey Ross) from culture is easy to sell. However, the amount of fish is not enough for supplying in the market since it has its period or season that have no fish to sell. So, I have to buy fish from Phnom Penh which are imported from abroad”
Wild fish, as the first choice of local consumers, also competes in this market. Consumers prefer wild fish, even if it is more expensive, as they believe its quality is higher than aquaculture fish. A wholesaler: “People like to consume the wild fish, but the pond cultured fish, they seem not to be interested in buying”. A nursery owner explains: “Most people prefer to eat wild fish. They think that the raised fish is not good”. A producer explains how it affect market prices: “The price of raised fish per Kilogram must be lower than the wild fish at least 40%. […] when they [consumers] heard about the cultured fish, they dislike it”.
Access to quality fingerlings is an issue. Producers order from nurseries or hatcheries they know, and new farmers just copy their neighbors. Nursery or fingerling traders do not have sufficient skills to manage the fingerlings, and there is no certification mechanism, so farmers receive fingerlings of unknown quality. There is also no guarantee that imported fingerlings are of higher quality. As an example, a case from a floating village in Tonle Sap, farmers received snakehead fingerlings from a local trader to stock in their cages in 2019. Three months later, those fish had not grown properly. A cage culture producer explained that: “When fingerlings traders said that their fingerlings would grow big and well, I would believe them, because I don’t have any test to prove. …Those fingerlings seemed to be good and to be big. But 3 months after we had released them into the cage, they had only grown to the size of my big toe”.
Access to feed is also a constraint for producers. Currently, the price of trash fish is high, limiting the development of commercial snakehead farming. A producer explained that: “In the past there were abundant supplies of fish, but now it has decreased, so if we raise more, the interest rate which applies when we buy trash fish become more expensive. We don’t make much profit from doing that”.
Local homemade feed used in Pangasius culture is of variable quality, with variable protein content. Farmers do not have the skills to produce quality feed, and, with no access to trainings to improve their feed management practices, their feeding practices are of low standards. Finally, snakehead producers must change the water often. A lack of water can be problematic for this type of producer, forcing the farmers to stop their activities in the dry season: “Regarding to the well pumping from groundwater, we have some ponds for storing water but the source of water is uncertainty for season water usage, the groundwater usage is just in the family scale”.
Cage farmers also face issues with water quality in the dry season, with anoxic and polluted water due to organic waste or pollution from agriculture pesticides resulting in fish dying in large numbers, as explained by producers:
CAST Baseline Survey | Page 277
“… water is also the problem. When we know that the water is not good enough, we move our cage backward or as far as possible. It can be easily contaminated as when the fish from upstream get sick, it makes our fish get sick too.”
“… water which is polluted from the upstream where farmers do their farming. Substance for fertilizer flows into the river, so the water is contaminated”
“…now farmers are doing dry-season rice farming. …….. It flows to nowhere else but into and along the river, so it is hard for us to produce fish”
Access to loans is also an issue for those producers who lack collateral to access loans from MFIs. Also, raising snakehead and Pangasius requires a long growing period, even longer than one year, which therefore requires a large investment in feed. Many farmers are facing financial constraints, and so they sell their fish before the fish reach the market size. These factors require producers to borrow cash from informal money lenders at high interest rates. A wholesaler mentioned: “The fish producers don’t have enough money to raise the fish – [specifically] regarding the expenditure on the feed. For example, the people who live nearby the river who raise Channa micropeltes - if they have low a budget, they can’t raise the fish well”. A cage culture producer mentioned: “I really want to expand my business, but I don’t have money, my capital is not enough. People living on the river are poor, they can earn just enough for daily living”.
Post-harvest
Emerging themes for this segment of the value chain concern i) the competitiveness between imported and wild fish; ii) the availability of local products, and iii) the lack of access to international markets.
Imported fish influence local market prices, making local aquaculture products difficult to sell. At the same time, wild fish command higher market prices. “There is nothing [more] important [than] just making sure [that the] price rate is stable - don’t make it decline when the imported fish from Vietnam enters the market. Because whenever it enters the market, our fish price will decrease” says a fish producer.
Those constraints limit opportunities for collectors, wholesalers and processors to support and promote local aquaculture fish. The high price of local aquaculture product is reflected in the final price of processed fish products. Low-priced processed products are imported, and these compete with local processed product. Processors express this as:
“the local fish is more expensive than the one from other country”
“just make sure make price rate stable don’t make it decline when the imported fish from Vietnam enters the market. Because whenever it enters the market, our fish price will decrease.”
The supply of local aquaculture fish is seasonal, affecting the activities of post-harvest actors. “If we talk about fish raising in Cambodia, Channa striata from culture is easy to sell. However, the amount of fish is not enough to supply the market since there are periods or seasons when there are no fish to sell” mentioned a wholesaler.
The quality of locally-produced fish is not homogenous. Fish in some farms are fed improperly/insufficiently, leading to poor quality product that doesn’t meet the local market’s requirement. A wholesaler reports: “Some producers cannot afford to feed their fish, so the fish become so skinny”.
Interviewees mentioned that the market requirements and volumes for export do not exist. In addition, the procedures and guidelines for export do not exist. The case of a private company who wanted to export

CAST Baseline Survey | Page 278
Pangasius fillets but never reached the quality and quantity requirements illustrates this issue, according to one wholesaler and one producer: “I used to hear that someone was preparing processed fish to export overseas. It was so difficult when taking the fish to the port. They had to choose fish that did not has any imperfection or damage. If fish were found to have any minor blemishes, then those fish will be removed. … This is a thing that we cannot do.”
The processing sector is also limited by the lack of local capacity. The sector remains “family based”, with limited investment, equipment, and technical capacity. “Local fish processors cannot access information about the export market as their knowledge, capacity and networks are very limited. They are not so interested in the export market since they believe that it involves very complicated procedures and processes”.
Barriers to project implementation mirror the general constraints within the aquaculture industry, with import of low-price fish causing market issues, limited access to quality inputs, and low capacity of the support system, producers and post-harvest actors.
B.2. Facilitators to program implementation
We disaggregated the analysis of facilitators to program implementation for i) input supply and producers, and iii) post-harvest actors.
Input supply and producers
A common theme with several interviewees in the input supply segment was the need for a more formal network and communication channels, that could be facilitated by the widespread adoption of communication technology in rural areas. As mentioned earlier, in Cambodia there is no formal network for sharing market information. Actors, especially producers and collectors, use their own connections for accessing market information. A development partner explained: “I think in general, this producer they [actors of the value chain] are not really well connected, at least to other stakeholders. They are connected mainly to their well immediate stakeholders. For example, if you’re aquaculture, a farmer, you are connected to your buyer, your middle man, and also to those who supply your inputs. …it’s not that well-connected in terms of producers – the farmer, to the consumer, the farmer to the farmer. I think that’s not that well-connected, especially between farmer and farmer”.
Smartphone technology can be used for better linkages between producers and other market actors. Furthermore, this technology can serve as a platform for facilitating other information sharing as well. For example, people in the sector can use it for sharing experiences, sharing good practices and for sharing new technologies. A feed distributor explained how he uses his smartphone to access and share information : “… I can access a smartphone and the internet. I can search for all the information that I need such as prices and sources of products. I can also call suppliers and customers from my phone if I need to.”
Better transparency of information is a good step in developing better trust in the value chain, which contributes to lowering overheads, and raising profits.
A second emerging theme concerns the local capacity of specific actors of the value chain - and specifically the hatcheries that acquire technical skills through trial and error, making them good candidates to be lead farmers and a source of knowledge. A hatchery owner mentioned: “Yet I still wonder

CAST Baseline Survey | Page 279
how they (Vietnamese fish farmers) can raise the fish to grow well but we can’t? So I had to try it by myself. Passion has pushed me to raise more fish.”
A nursery operator mentioned: “For everything, if we take good care of it, it won’t fail. Like my husband and I, when we started to deliver for the first time, a lot of fingerlings died. But I sought strategies which can save fingerings and reduce the fingerlings’ mortality rate”.
Feed distributors who started their business with limited aquaculture knowledge also gained experience through their engagement in the sector over a longer period of time. As a result, some feed distributors became unofficial learning hubs for producers. For example, one feed distributor and fingerlings producer mentioned that his strategy for attracting more clients was to share a complete set of techniques on aquaculture to provide support to farmers, alongside selling fish feed and other aquaculture inputs: “I used the strategy that I have mentioned […] we would bring the complete set (technical support, fish health, and fish feed) along with fingerlings to producers”.
A feed distributor explains: “Before I sell the products to farmers I always ask them about problems or issues that they are facing, and then I provide the technical guiding with the specifics products to farmers.” “A nursery manager describe : “I guide the fish farmers about the way to make water system or we process the feed from food waste (kitchen) as fish feed”.
This type of actor could become a central point for sharing such information, especially to medium-scale producers, who mentioned that they do not get any training or support from any source . For producers, other farmers remain the main source of knowledge. A producer said: “In general, the fellow fish farmers shall share the information to one another. For example, when I had good medicine, I would share to other farmers whose fish had diseases to apply the good medicine, since I had experience before”. This topic shows that existing and emerging network of producers and input suppliers can be the base on which to build more formal networks within the value chain.
Post-harvest
As for producers, an emerging theme mentioned by processors and wholesalers is the presence of an existing network that can be the base for future, more formal organization of the sector. Currently, connection between actors are informal. For example, a fish processor indicated that he processes fish based on orders placed by his clients: “The market is not the problem. For example, when we purchase at a higher price, I then have to ask customers to pay a higher price, because the fish is more expensive now when they come to buy from me. Once we agree on the pricing, I will start processing the fish. I cannot start doing it if there is no agreement with customers to increase the price, otherwise I won’t make any profit. Overall, they follow the market. A shortage of fish at the market forces me to increase the price.”
Likewise, a wholesaler stressed that he has no problem selling his fish, as every day his clients also place orders, so he knows how much fish he should collect from each producer each day: “Today, if the customer orders 2 tons, we will catch 2 tons. If the customer orders 3 tons, we will catch 3 tons.” The CAST project may be able to help to strengthen these networks, and also to introduce new technologies for better communication in order to achieve better linkages between business owners and their respective clients.
Another theme, less frequently reported, road and transportation networks that have improved greatly over the last 15 years. Fish collectors, wholesalers and processors all have sufficient transportation capacity, although refrigerated trucks are not common.

CAST Baseline Survey | Page 280
“The transportation is more comfortable than before, the road is easier to access, we transport fish faster than before, we can go from this market to that market, smoked fish won’t get damaged” express a processor.
Project facilitators in the different segments of the aquaculture value chain are limited to the existing network that can be used to upgrade the performance of the sector. The interviews did not identify specific technical or market related facilitator(s).
C. Services and support needed for beneficiaries’ success The first theme that emerged is the need for better coordination and access to information and
knowledge for different actors of the value chain. This idea is expressed by the need to create an association or platform that supports information exchange. The majority of those whose main livelihood activity is aquaculture indicated that they have never received any proper training and/or support from any development project at all. When talking about acquiring updated technologies, these producers want a proper information channel which provides them with regular support. Producers mentioned:
“I want to have frequent training and want them [CAST project] to show me which medicine to treat fish, teach me to diagnose fish and provide medicine that can treat our fish.”
“I want to gain experiences and techniques like yours, which include methods to raise fish, to treat sick fish, to use medicine and so on”
In relation to this, some farmers indicated that it would be helpful to have an aquaculture association in place so that they can use this association as a platform for regularly sharing experiences amongst members, as mentioned by a feed distributor: “I want to have a relationship with other retailers to gain more experience from them. For example, we can share with each other about our knowledge and experiences so that we can learn from each other and all gain knowledge together.”
Some suggested that the CAST project could create an online hub of technologies which each member can access anytime, as it already exists in other sectors. This last point was expressed by a feed distributor: “Nowadays farmers also know how to use modern technology. When we get information, we distribute it through WhatsApp. Everyone can get the information because now the cell phone technology is used by everyone, even when the animal is sick, they just take picture and send it to us to check”.
A second theme, related to the previous theme, is the need to develop a domestic value chain to limit the negative impact of imported fish on local fish market prices. A CAST partner mentioned:
Having more transparent access to market prices would help. “You can see somebody offers this price, you see somebody offers that price, you can make comparison. This is a real thing” a development partner mentioned. A processor also mentioned: “If the organization tells us the price of fish for one kilogram, and we can gain more profit, we follow the organization.”
Access to loans with lower interest rates to finance aquaculture activities was frequently referred to. This topic was already mentioned as a barrier to the project and a constraint to the aquaculture industry. Banks and MFIs perceive the sector as risky, exacerbated by a lack of access to information about the sector. Therefore, their investment in this sector is limited. Fish farmers, especially those who live in floating villages, take loans from private money lenders. They have to pay back both the principal and interest at the end of the production cycle (harvest and sale). A producer said: “Right now, we can take loans from certain clients. For example, we may be able to take a loan for the sum of 2,000 to 3,000 USD;
CAST Baseline Survey | Page 281
but when harvesting and selling the fish, we have to pay it back. The total interest is more than the principal that we borrowed.
“If you don’t take a loan, you can sell your fish for 8,000 (riel) per kilogram; however, if you take a loan, you have to sell the fish to your creditor, and the price of your fish is only 7,000 (riel) per kilogram. You can see that we lose 1,000 riel per kilogram. So, you have to work hard to not become a borrower so that you can sell your fish at a higher price”.
Access to quality fish feed would facilitate beneficiaries success. All respondents insisted that the price of commercial fish feed for Pangasius, and the price of trash fish for snakehead, are both relatively high compared to the prices of these inputs in neighboring countries. Respondents also discussed the lessons learned from past projects and what they consider a useful approach to engage actors of the value chain. A CAST partner mentioned that the project should support the development of a niche market for quality fish, stimulating the demand for higher value fish: “if we convince the restaurants and the hotels to really purchase those good quality (fish) compared to the normal one, I think it might also be an option that we can increase the demand for the producers, specifically those who adopt specific good practices”.
Service and support to value chain actors needs to follow a systematic approach, and provide support within technical, economic and institutional dimensions. As such, increasing profitability and developing business models for producers is required to improve access to loans, to increase market prices by developing a niche market and to create a demand for high-quality fish. This can be achieved by different means and using different tools.
D. Relationship building We identified two main themes related to relationship building: i) the need for an aquaculture
association; ii) improved trust and connection between actors.
D.1. Aquaculture association and private advisors
Actors highlighted the need to have a formal platform to share information among the various actors of the value chain. In the aquaculture sector there are informal networks currently operating at national and provincial level. However there are no formalized/official networks to help support better horizontal and vertical coordination of the value chain, or play an advocacy role. A development partner explained: “I think in general, producers are not really well connected, at least to other stakeholders. They are connected mainly to their immediate stakeholders. For example, if you are aquaculture, a farmer, you are connected to your buyer, your middle man, and also to those who supply your inputs. …it’s not that well-connected in terms of producers – the farmer, to the consumer, the farmer to the farmer.”
An aquaculture association should promote local aquaculture production in responding to market demands and help producers gain reasonable profits from product upgrade. An association should play a role in coordinating and supporting traceability and SPS systems and should involve different actors. A CAST partner stated:
“I think, CAST has to form like a team from, similar to association, but they have to involve the producers, middlemen, retailers, private sectors, and people from the university, the people from maybe FIA, the people from Ministry of Agriculture, Forestry and Fisheries, and probably from Ministry of Commerce so they all understand about the purpose of CAST because they’renot only producing but they also want to have the certification, production certification”.
CAST Baseline Survey | Page 282
The project should build on previous experience in the agricultural sector; upgrading value chain functioning, small-business and the emergence of a commercial sector. A development partner mentioned about an online tool: “…it connects the banks, the input suppliers, the buyers. It’s almost like a supply chain finance/management system. So everyone’s on one system, everything is, you know, transparent and digital. And it makes decision making easier, just sort of a general business operation. They, as I said, they’ve been working in rice, and I think that they had some success in rice”
Feed mills, feed distributors, hatcheries, nurseries, hotels and restaurants, are interested in the development of an association because it would facilitate information transparency, and sharing among actors. Fish producers are keen to see an association play a role in providing both aquaculture technical guidelines and information about market demand and updated market prices, sources of quality seed, feed and medicine. A restaurant owner sees the association as a “control” system related to quality standard: “When they [producers] join the association, they will gain more knowledge on how to raise the fish properly, so it won’t affect the health of the customer. If they are not under control of the association, they can do whatever they want with the fish by feeding it with chemical substance to make it grow abnormally”
FiA officers recognize that the extension services provided by the government are inadequate, and that the government needs the private sector, associations and NGOs to fill these gaps - for example, by transferring aquaculture technology, promoting local aquaculture products and supporting SPS and traceability systems. This already exists to a certain extent. A feed distributor involved in fish raising explains the services he provides: “I have my own fish farm. We provide fingerlings to fish farmers, extension service such as supplying both technical support and fish feed. We also provide fish’s healthcare services, thus the number of producers increase as they can harvest more yield.”
However, this type of service supplier is limited and there are limitations in the amount of advisors supporting fish raising techniques. Trust issues also exist when the same people both provide technical support and sell inputs.
D.2. Trust and distrust between actors
Long-term relationships between clients and service providers are common in the aquaculture sector. Theevelopment of trusted relationships can take different forms: providing technical recommendations when purchasing inputs (feed, fingerlings) or a technical follow-up of a client’s production. Other trusted relationships exist in the form of ‘business partnerships’ between feed suppliers and fish producers, producers and fish collectors, and feed mills and feed distributors.
“I trust the middleman. We do business together for almost two decades. For example: when the truck arrives, the middleman calls me […]. I go and collect that fingerlings from them and share with my fellow farmers” a producer explained. Another producer explained about collectors: “They are our loyal client, we do not concern that they are going to cheat us. Even with money, no need to fear.”
“I’ve been doing fingerling business for 15 years in here. For the old customers who take the fingerlings from me, they don’t run off although my price of fingerlings is a bit expensive, they still buy fingerlings from me because they trust me that I never cheat them.” a hatchery owner explains
Those relationships are based on trust between parties. We have seen that long-term relationships, personal connections and networks are really important in the aquaculture value chain. However, this trust can be jeopardized. Distrust of input suppliers can hinder adoption of new technologies or practices. For instance, some producers did not receive good quality fingerlings from fingerling traders as illustrated by a statement of a fish producer: “In Phnom Penh, there are some places that sell fingerlings too, but those

CAST Baseline Survey | Page 283
places might cheat the farmers”. Commercial fish feeds may not yet have received an approval or certificate from the government. These issues can be the result of a lack of regulatory framework or inadequate enforcement, as mentioned by a feed mill manager:
“We do not know exactly whether all of the commercial feed in our market has received approval from the government agency who is responsible for this or not. As a result, many farmers do not trust the feed quality”.
“These days when fingerlings traders said their fingerlings would grow big and good, I would believe them because I don’t have any test to prove. Once they said it’s good, both you and I would agree that it is good. When we first saw them, they are big but 3 months after we release them into the cage, they grow to the size of my big toe only”
Fixing trust issues and improving connections between actors is essential to developing and expanding commercial aquaculture in Cambodia. It relates to the previously identified theme and the use of online tools to facilitate interaction between actors increase transparency for price and economic return. This also applies to MFIs and their need to better understand the sector.