commercial market now and then petch gibbons january 26, 2011
TRANSCRIPT
Commercial MarketNow and Then
Petch GibbonsJanuary 26, 2011

Washington, DC Positive Absorption Hit Record Levels
- Occupancy Levels Increasing by 4.3 Million SF- Federal Government Activity and Spending
Sales Activity and Values Soared- The World Bank at 1225 Connecticut Ave NW for $216 Million ($900 psf)
Lots of tenants hunkering down
Northern Virginia The Tale of Two Markets; One Inside the Beltway; One Outside
Investors Lured by Financially Stable, Fully Leased, Quality Office Properties
Slow and Steady Recovery is Projected for Northern Virginia in 2011 with Tighter Markets Inside the Beltway
Suburban Maryland Bethesda Brings Suburban Maryland Office Market into Solid Recovery Mode
Government/Contractors Responsible for The Largest Transactions.
Southern Montgomery County Leads the Office Market Recovery in 2011
Tell ‘em what you’re going to tell ‘em!

A Record-Breaking Year for Absorption Downtown while the Suburbs turn Positive
Government Activity was Responsible for Most of the Demand in 2010 in all Markets
Private Sector Activity Led by:
Law firms (Core DC markets) Consulting, Technology (Northern VA) Consulting, Accounting (Suburban MD)
Absorption (msf)
3
Source: Cushman & Wakefield Research
* Overall absorption is defined as the change in occupied built space for a given period of time, including sublease space within five years.
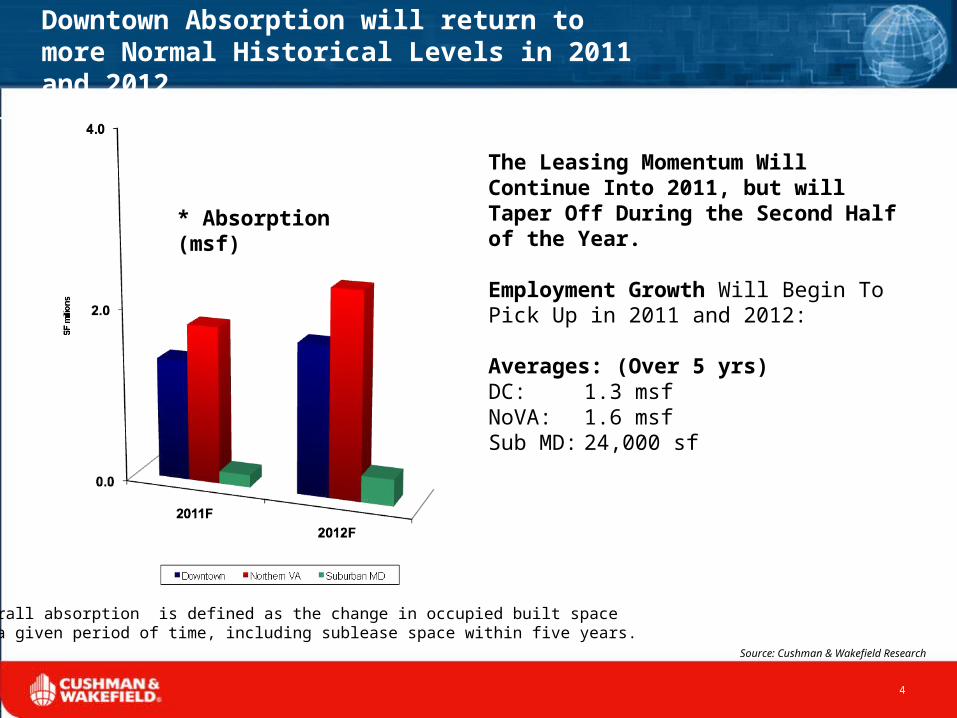
Downtown Absorption will return to more Normal Historical Levels in 2011 and 2012
The Leasing Momentum Will Continue Into 2011, but will Taper Off During the Second Half of the Year.
Employment Growth Will Begin To Pick Up in 2011 and 2012:
Averages: (Over 5 yrs)DC: 1.3 msfNoVA: 1.6 msfSub MD: 24,000 sf
* Absorption (msf)
4
Source: Cushman & Wakefield Research
* Overall absorption is defined as the change in occupied built space for a given period of time, including sublease space within five years.
Historical Available Sublease Space
5
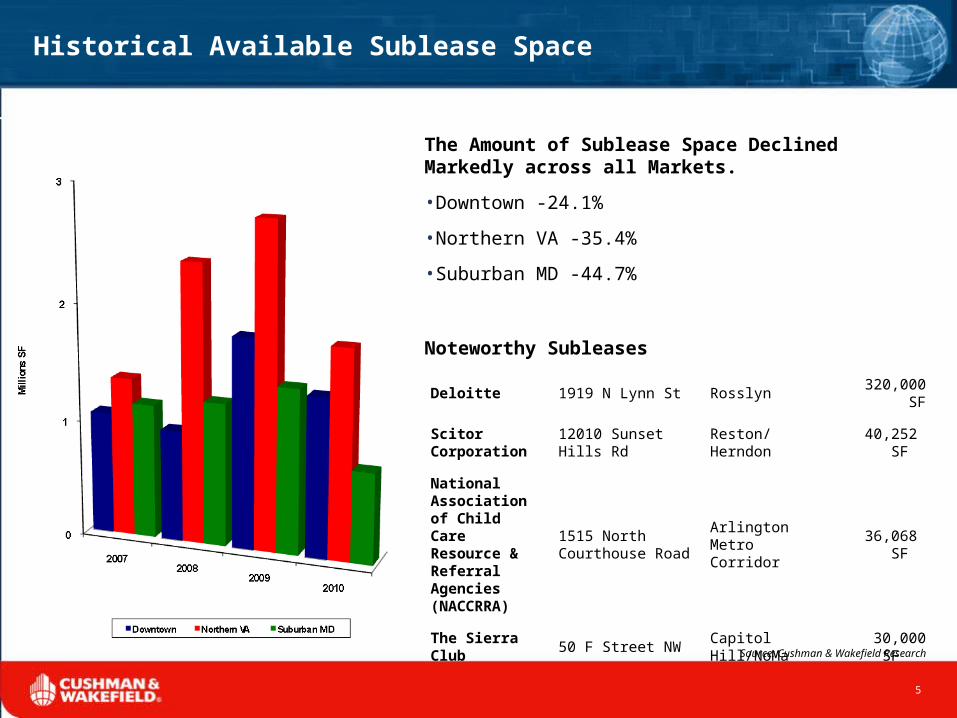
The Amount of Sublease Space Declined Markedly across all Markets.
•Downtown -24.1%
•Northern VA -35.4%
•Suburban MD -44.7%
Noteworthy Subleases
Source: Cushman & Wakefield Research
Deloitte 1919 N Lynn St Rosslyn 320,000 SF
Scitor Corporation 12010 Sunset Hills Rd Reston/Herndon 40,252 SF
National Association of Child Care Resource & Referral Agencies (NACCRRA)
1515 North Courthouse Road
Arlington Metro Corridor 36,068 SF
The Sierra Club 50 F Street NW Capitol Hill/NoMa 30,000 SF
Building Submarket Tenant SF
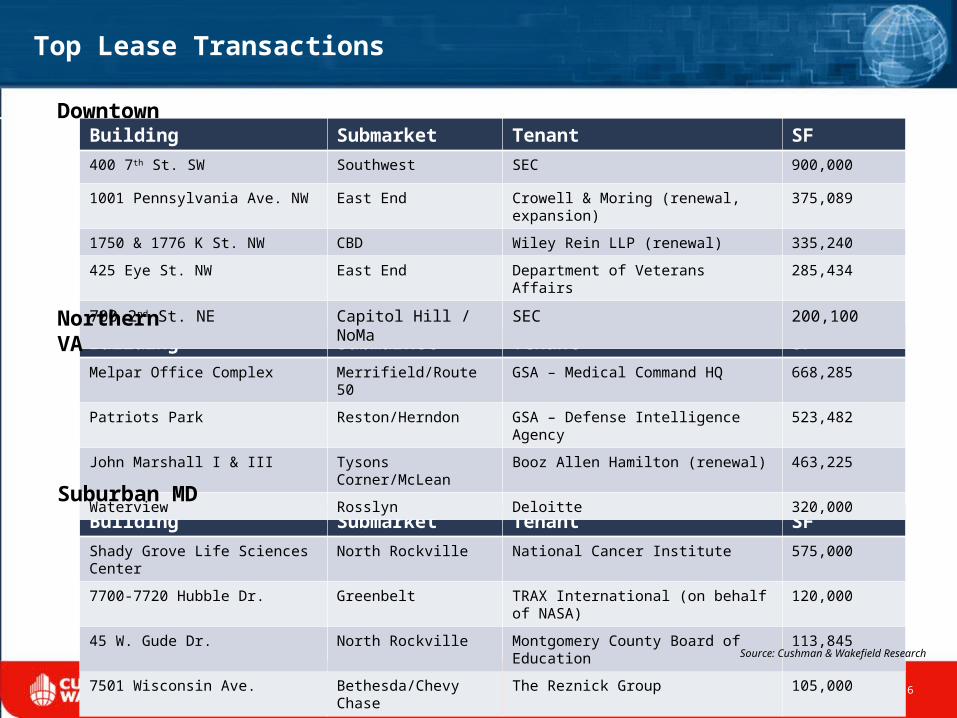
Shady Grove Life Sciences Center North Rockville National Cancer Institute 575,000
7700-7720 Hubble Dr. Greenbelt TRAX International (on behalf of NASA) 120,000
45 W. Gude Dr. North Rockville Montgomery County Board of Education
113,845
7501 Wisconsin Ave. Bethesda/Chevy Chase The Reznick Group 105,000
Top Lease Transactions
Downtown
Building Submarket Tenant SF
Melpar Office Complex Merrifield/Route 50 GSA – Medical Command HQ 668,285
Patriots Park Reston/Herndon GSA – Defense Intelligence Agency 523,482
John Marshall I & III Tysons Corner/McLean Booz Allen Hamilton (renewal) 463,225
Waterview Rosslyn Deloitte 320,000
Building Submarket Tenant SF
400 7th St. SW Southwest SEC 900,000
1001 Pennsylvania Ave. NW East End Crowell & Moring (renewal, expansion) 375,089
1750 & 1776 K St. NW CBD Wiley Rein LLP (renewal) 335,240
425 Eye St. NW East End Department of Veterans Affairs 285,434
700 2nd St. NE Capitol Hill / NoMa SEC 200,100
Northern VA
Suburban MD
6
Source: Cushman & Wakefield Research

Other Renewals
Building Submarket Tenant SF
John Marshall I & III Tysons Corner/McLeanBooz Allen Hamilton (renewal)
463,225
Washington Technology Park Route 28 South/ChantillyComputer Sciences Corporation (renewal)
257,485
Hunters BranchFairfax/Oakton/Vienna
ICF Consulting (renewal/expansion) 201,707
370 L'Enfant Plaza SWSouthwest Department of Health & Human Services 185,120
470-490 L'Enfant Plaza SWSouthwest National Transportation Safety Board 179,519
7
Source: Cushman & Wakefield Research

Vacancy Rates remained Elevated from their Pre-Recession Levels…
Submarkets with low 2010 vacancy rates:
East End 10.4%
Ballston 4.2%
Bethesda/Chevy Chase 10.5%
8
Source: Cushman & Wakefield Research

…but will Continue to Inch Down in 2011 and 2012
Very Few Construction Completions Help Vacancy Rates Tighten.
In Downtown and Suburban Maryland Vacancy Rates Will Remain Well Above10-year Averages:
10 Year Average Vacancy Rate
Downtown 7.9%
Northern VA 12.9%
Suburban MD 12.3%
9
Source: Cushman & Wakefield Research
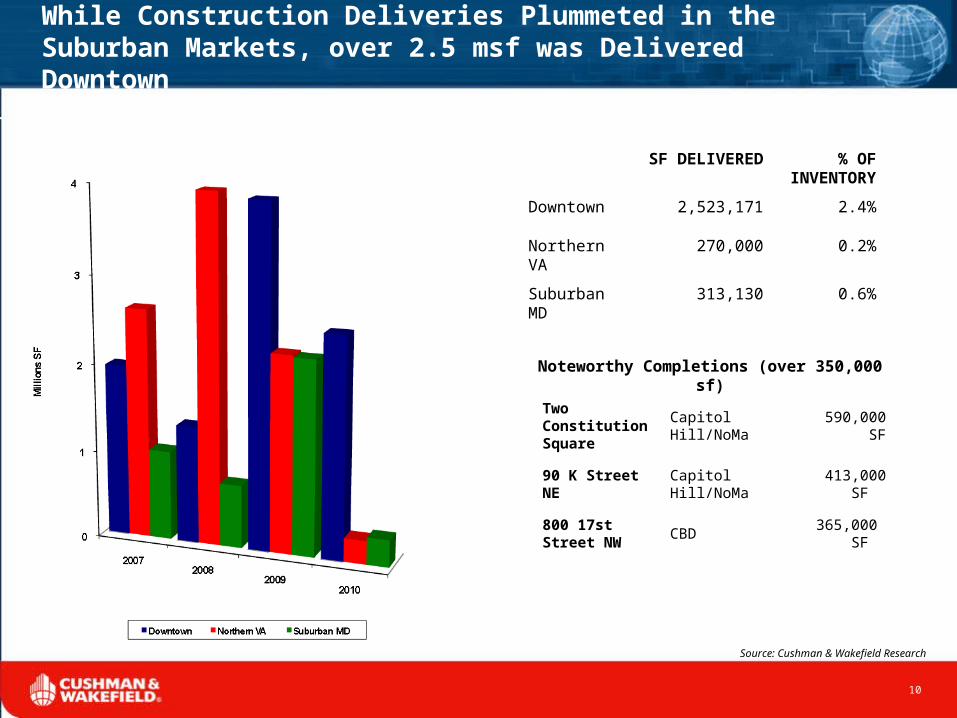
While Construction Deliveries Plummeted in the Suburban Markets, over 2.5 msf was Delivered Downtown
10
SF DELIVERED
% OF INVENTORY
Downtown 2,523,171 2.4%
Northern VA 270,000 0.2%
Suburban MD 313,130 0.6%
Source: Cushman & Wakefield Research
Two Constitution Square Capitol Hill/NoMa 590,000 SF
90 K Street NE Capitol Hill/NoMa 413,000 SF
800 17st Street NW CBD 365,000 SF
Noteworthy Completions (over 350,000 sf)
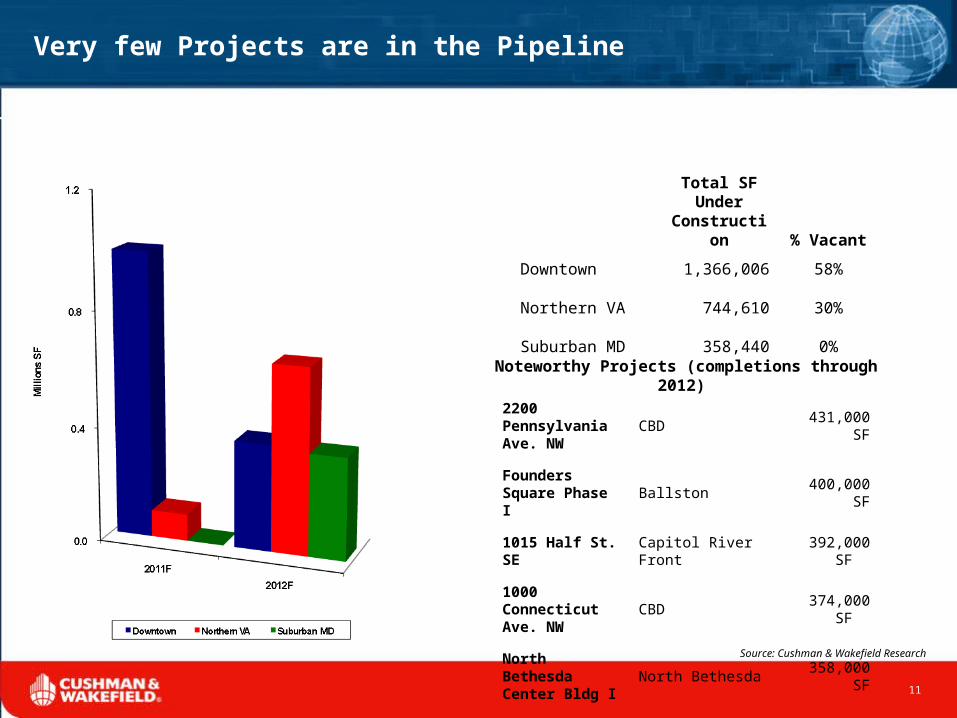
Very few Projects are in the Pipeline
11
Total SF Under
Construction % Vacant
Downtown 1,366,006 58%
Northern VA 744,610 30%
Suburban MD 358,440 0%
Source: Cushman & Wakefield Research
2200 Pennsylvania Ave. NW CBD 431,000 SF
Founders Square Phase I Ballston 400,000 SF
1015 Half St. SE Capitol River Front 392,000 SF
1000 Connecticut Ave. NW CBD 374,000 SF
North Bethesda Center Bldg I North Bethesda 358,000 SF
Noteworthy Projects (completions through 2012)
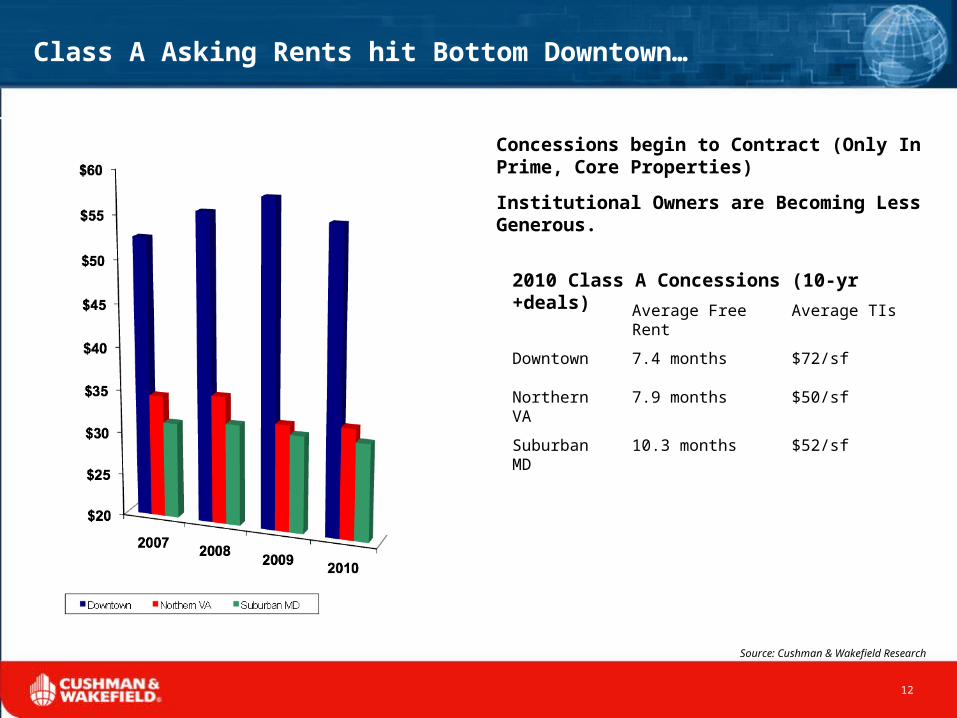
Class A Asking Rents hit Bottom Downtown…
Concessions begin to Contract (Only In Prime, Core Properties)
Institutional Owners are Becoming Less Generous.
12
Average Free Rent Average TIs
Downtown 7.4 months $72/sf
Northern VA 7.9 months $50/sf
Suburban MD 10.3 months $52/sf
2010 Class A Concessions (10-yr +deals)
Source: Cushman & Wakefield Research
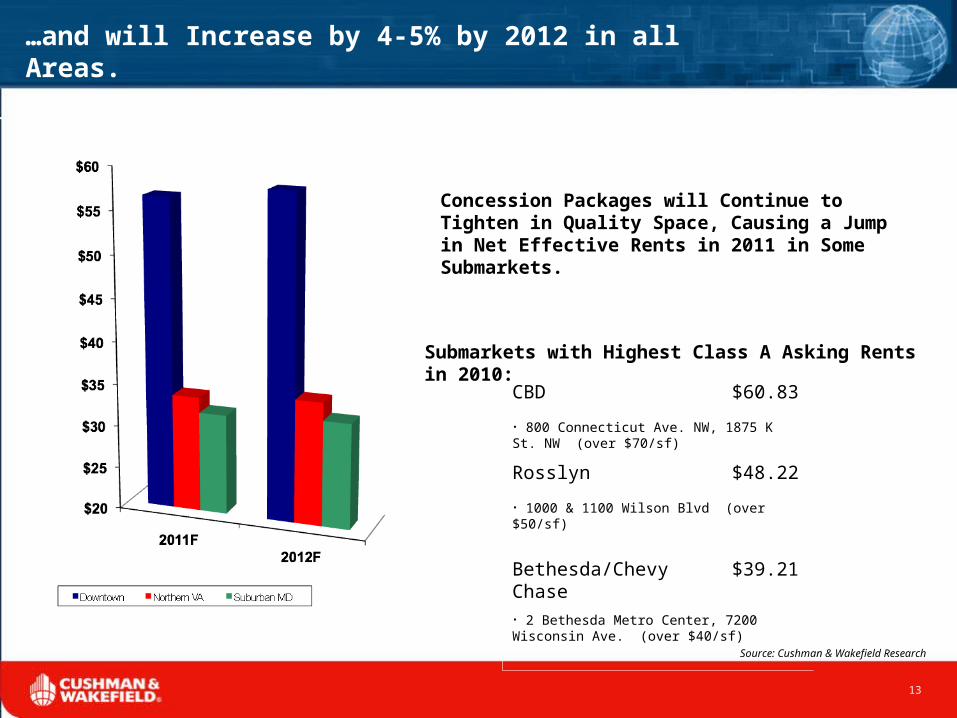
…and will Increase by 4-5% by 2012 in all Areas.
Concession Packages will Continue to Tighten in Quality Space, Causing a Jump in Net Effective Rents in 2011 in Some Submarkets.
13
Submarkets with Highest Class A Asking Rents in 2010: CBD $60.83
• 800 Connecticut Ave. NW, 1875 K St. NW (over $70/sf)
Rosslyn $48.22
• 1000 & 1100 Wilson Blvd (over $50/sf)
Bethesda/Chevy Chase $39.21
• 2 Bethesda Metro Center, 7200 Wisconsin Ave. (over $40/sf)
Source: Cushman & Wakefield Research
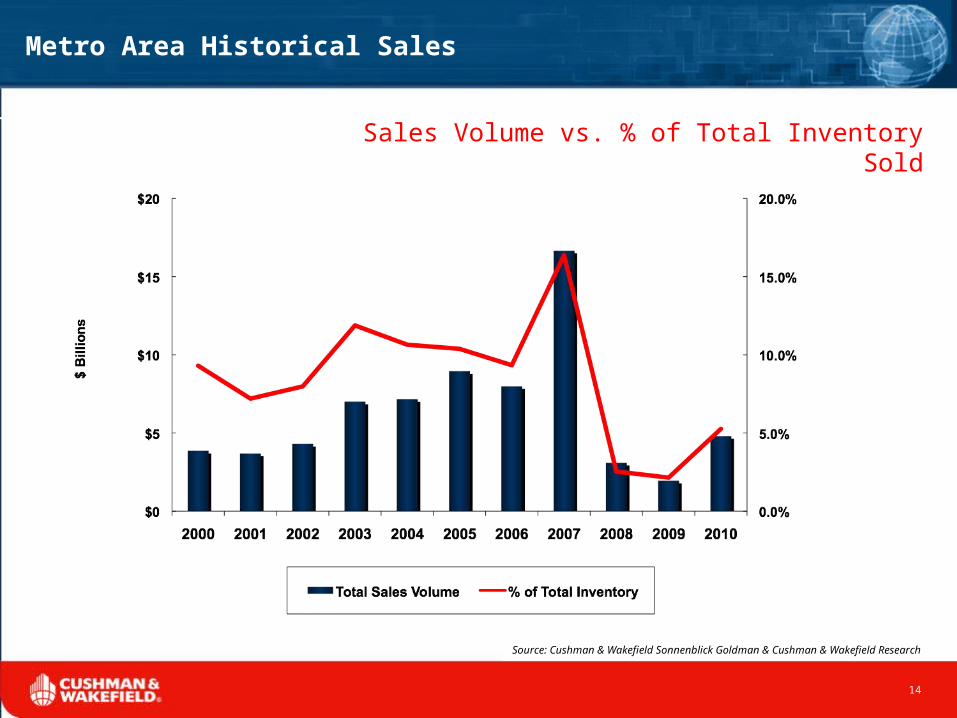
Metro Area Historical Sales
Sales Volume vs. % of Total Inventory Sold
Source: Cushman & Wakefield Sonnenblick Goldman & Cushman & Wakefield Research
14
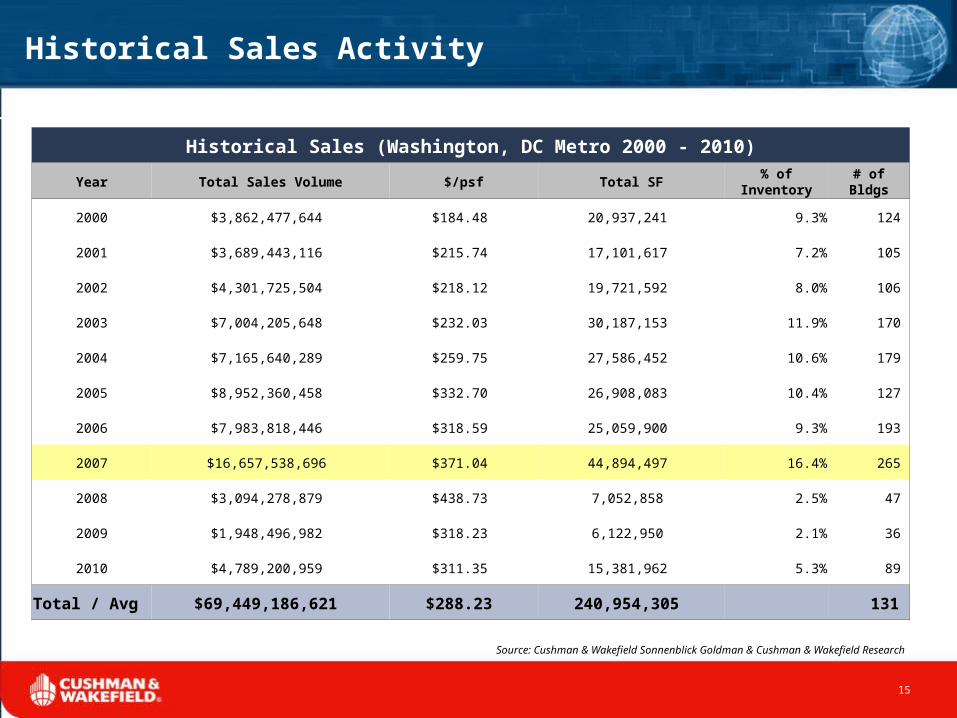
Historical Sales Activity
Source: Cushman & Wakefield Sonnenblick Goldman & Cushman & Wakefield Research
Historical Sales (Washington, DC Metro 2000 - 2010)
Year Total Sales Volume $/psf Total SF % of Inventory # of Bldgs
2000 $3,862,477,644 $184.48 20,937,241 9.3% 124
2001 $3,689,443,116 $215.74 17,101,617 7.2% 105
2002 $4,301,725,504 $218.12 19,721,592 8.0% 106
2003 $7,004,205,648 $232.03 30,187,153 11.9% 170
2004 $7,165,640,289 $259.75 27,586,452 10.6% 179
2005 $8,952,360,458 $332.70 26,908,083 10.4% 127
2006 $7,983,818,446 $318.59 25,059,900 9.3% 193
2007 $16,657,538,696 $371.04 44,894,497 16.4% 265
2008 $3,094,278,879 $438.73 7,052,858 2.5% 47
2009 $1,948,496,982 $318.23 6,122,950 2.1% 36
2010 $4,789,200,959 $311.35 15,381,962 5.3% 89
Total / Avg $69,449,186,621 $288.23 240,954,305 131
15

2010 Significant Office Building Sales
ADDRESS SALES PRICE
DATE BUILT/RENOV
% LEASED SALE DATE NRSFCAP
RATE PRICE PSFSELLER/BUYER COMMENTS
Downtown
World Bank
1225 Connecticut Ave. NWWashington, DC $216,000,000
1967/2008100% November-10 240,000 5.70% $900
Brookfield Office
Properties/The World Bank
World Bank exercised 2008 lease
option; highest psf price Downtown
The Evening Star Building
1101 Pennsylvania Avenue NWWashington, DC $180,000,000
1898/198988% June-10 219,627 5.80% $820 KanAm/TIAA
1899 Pennsylvania Avenue NW
Washington, DC $151,100,000
1915/2002
100% September-10 186,462 5.60% $810
KanAm/Paramount
Group
Northern Virginia
The Hartford Building3101 Wilson Blvd.
Arlington, VA $112,600,000
2003
100% December-10 212,443 6.00% $530
MRP JV Angelo
Gordon/Heitman, LLC
Prior sale June 2009
for $71.5 million
One & Two Potomac Yard2733 & 2777 Crystal Drive
Arlington, VA $241,900,000
2006
97% October-10 621,824 6.30% $389 JPMorgan/USAA
Three Ballston Plaza1100 N Glebe Road
Arlington, VA $120,000,000
1990
92% March-10 308,998 7.30% $388
Massachusetts
Mutual/AEW
Ridges at Quince Orchard
200 Orchard Ridge Dr.Gaithersburg, MD $27,500,000
1989100% December-10 104,025 NA $264
WRIT/MedImmune, LLC
Purchased for occupancy
Redland Corporate Center
520 and 530 Gaither Rd.Rockville, MD $85,000,000
2009
520, 100%; 530, 11% November-10 347,462 8.50% $245
Perseus Realty/ First Potomac Realty Trust 90% stake
Shady Grove Executive Center
9201-9231 Corporate BlvdRockville, MD $60,000,000
1984, 1985 &
198980% March-10 350,388 NA $171
BlackRock / PS Business Parks
Suburban Maryland
Source: Cushman & Wakefield Sonnenblick Goldman & Cushman & Wakefield Research
16
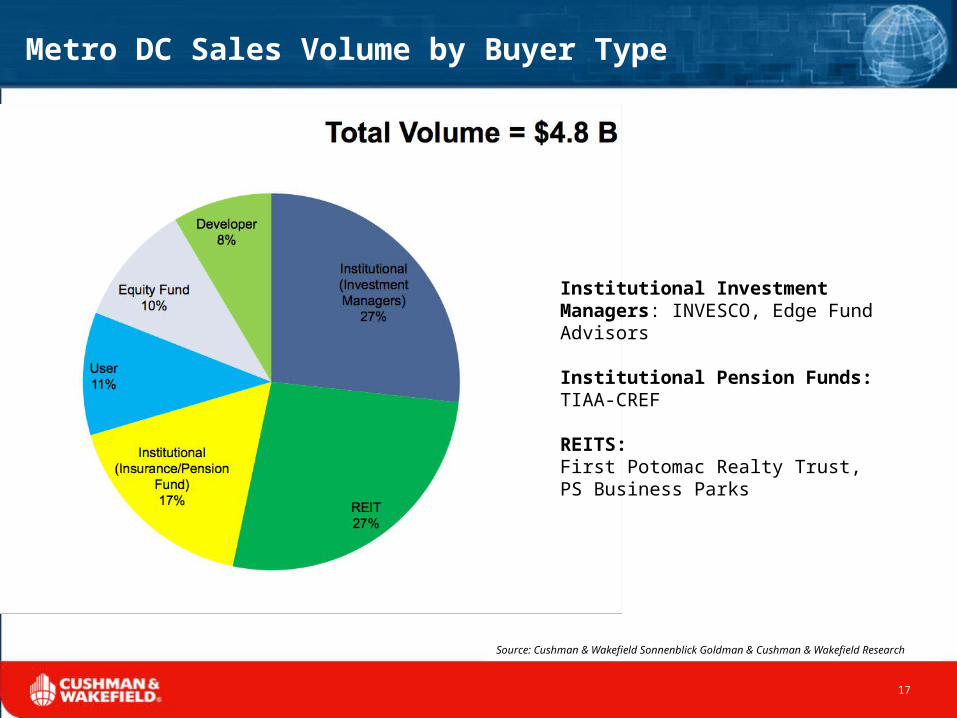
Metro DC Sales Volume by Buyer Type
Source: Cushman & Wakefield Sonnenblick Goldman & Cushman & Wakefield Research
17
Institutional Investment Managers: INVESCO, Edge Fund Advisors Institutional Pension Funds: TIAA-CREF REITS:First Potomac Realty Trust, PS Business Parks

Trends to Watch in 2011
Tenants will continue to hold occupancy costs down.
18
Investors widen their nets outside Downtown, but remain focused on well-located, class A product with good financials.
Slow and steady recovery in Northern Virginia and Suburban Maryland. Downtown returns to normal.
Source: Cushman & Wakefield Research