columbus taste and odor event - one water ohio · pdf filecyanophyta (blue-green algae or...
TRANSCRIPT

Columbus Taste and Odor Event

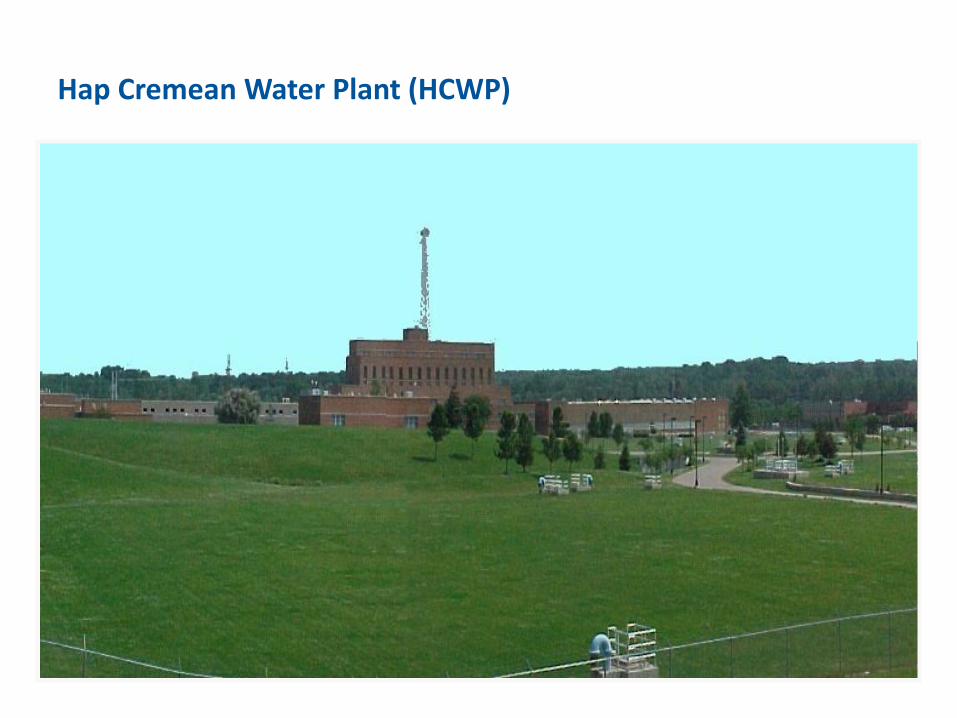
Hap Cremean Water Plant (HCWP)

Hoover Reservoir

Dublin Road Water Plant (DRWP)
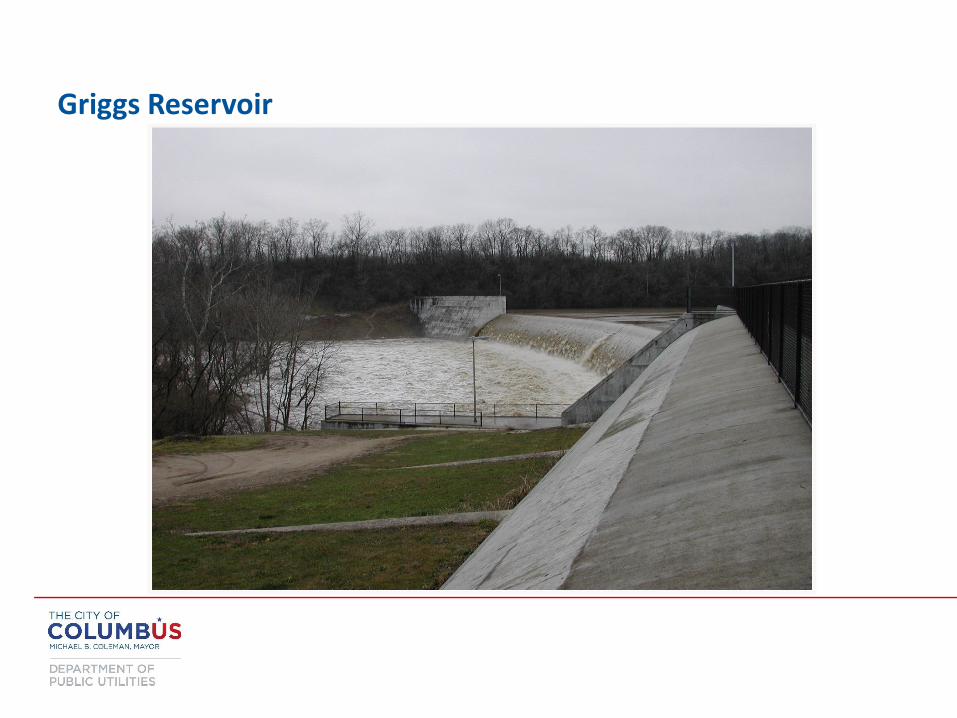
Griggs Reservoir
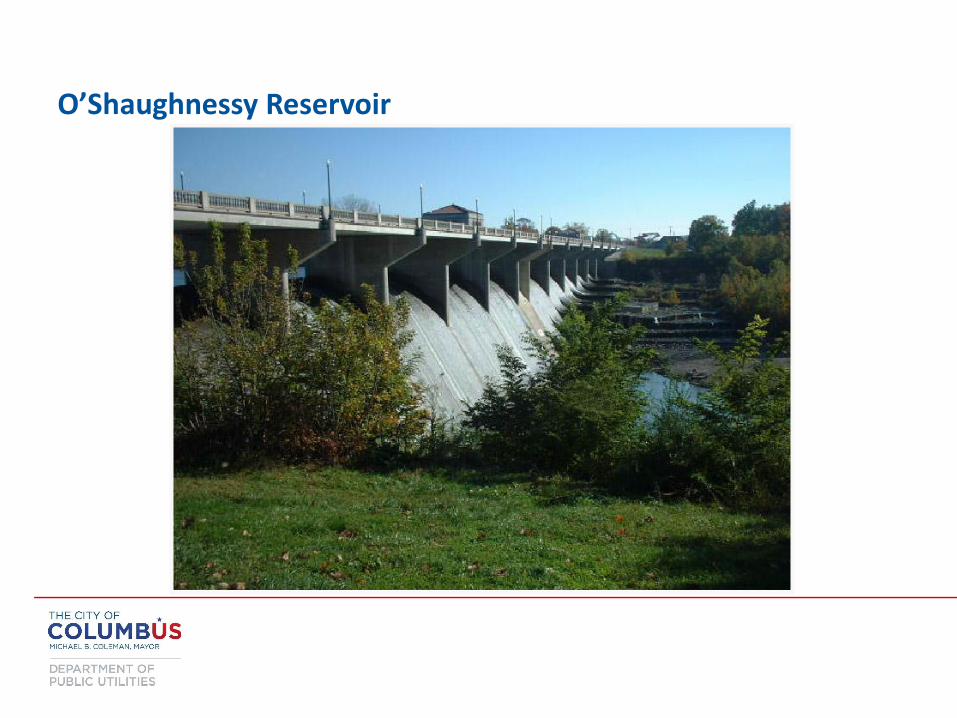
O’Shaughnessy Reservoir

Upground Reservoir
Upground Reservoir


Parsons Avenue Water Plant (PAWP)

PAWP Collector Well 115
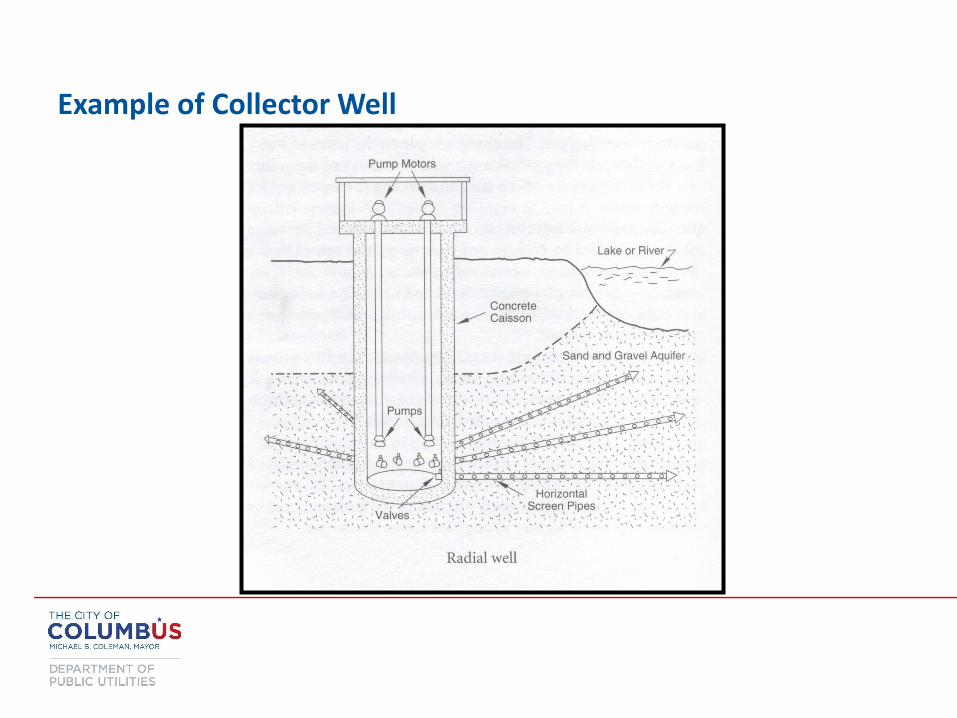
Example of Collector Well

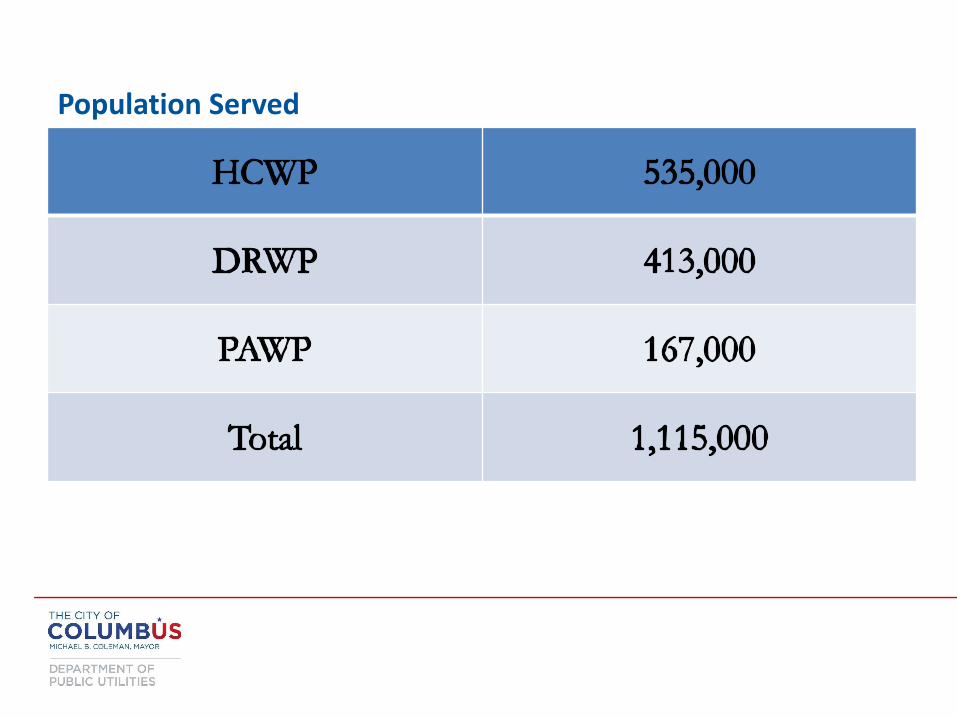
Population Served

Treatment and Supply Capacity

2012 Plant Production

Primary Goals of Water Treatment • Kill disease causing organisms
• Remove unwanted chemicals
• Remove sediment
• Fluoridate the water
• Produce water that has a pleasant appearance and taste
• Meet USEPA Drinking Water Regulations and Ohio EPA (OEPA) Drinking Water Rules
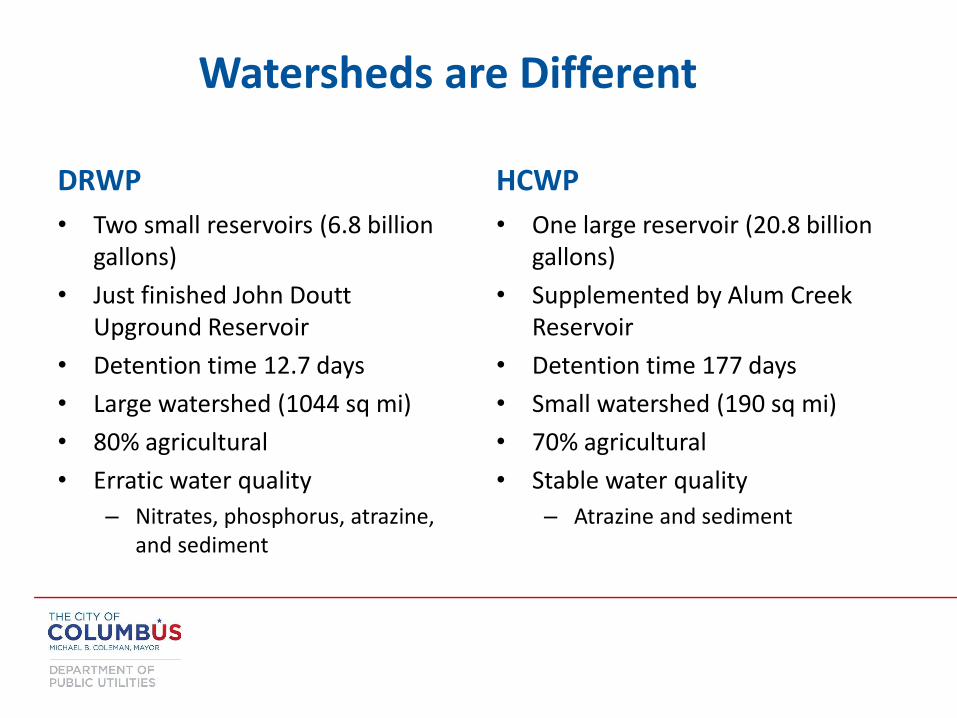
DRWP
• Two small reservoirs (6.8 billion gallons)
• Just finished John Doutt Upground Reservoir
• Detention time 12.7 days
• Large watershed (1044 sq mi)
• 80% agricultural
• Erratic water quality
– Nitrates, phosphorus, atrazine, and sediment
HCWP
• One large reservoir (20.8 billion gallons)
• Supplemented by Alum Creek Reservoir
• Detention time 177 days
• Small watershed (190 sq mi)
• 70% agricultural
• Stable water quality
– Atrazine and sediment
Watersheds are Different
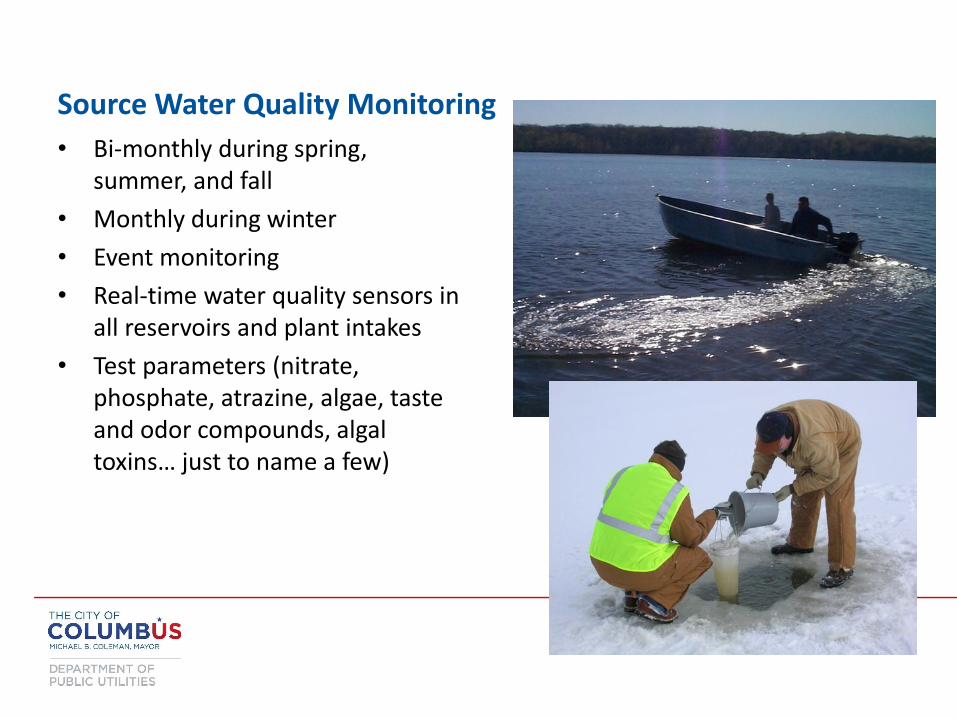
Source Water Quality Monitoring
• Bi-monthly during spring, summer, and fall
• Monthly during winter
• Event monitoring
• Real-time water quality sensors in all reservoirs and plant intakes
• Test parameters (nitrate, phosphate, atrazine, algae, taste and odor compounds, algal toxins… just to name a few)
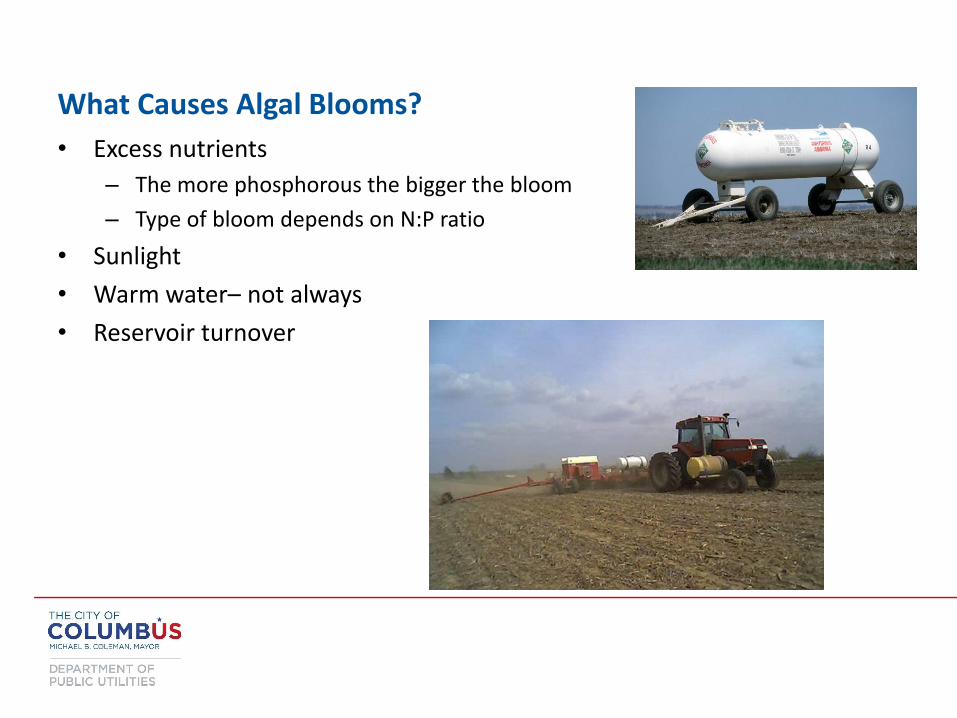
What Causes Algal Blooms?
• Excess nutrients
– The more phosphorous the bigger the bloom
– Type of bloom depends on N:P ratio
• Sunlight
• Warm water– not always
• Reservoir turnover

Algal Blooms
• Algae are always present in our water
• Depending on nutrients and water quality some algae thrive while others die off
• Cause various treatment issues
– Interrupt coagulation
– Plug filters
• Some cause taste and odors… some don’t
– Earthy, musty, fishy, cucumber, etc.
• Some produce toxins… some don’t


Diatom: Asterionella
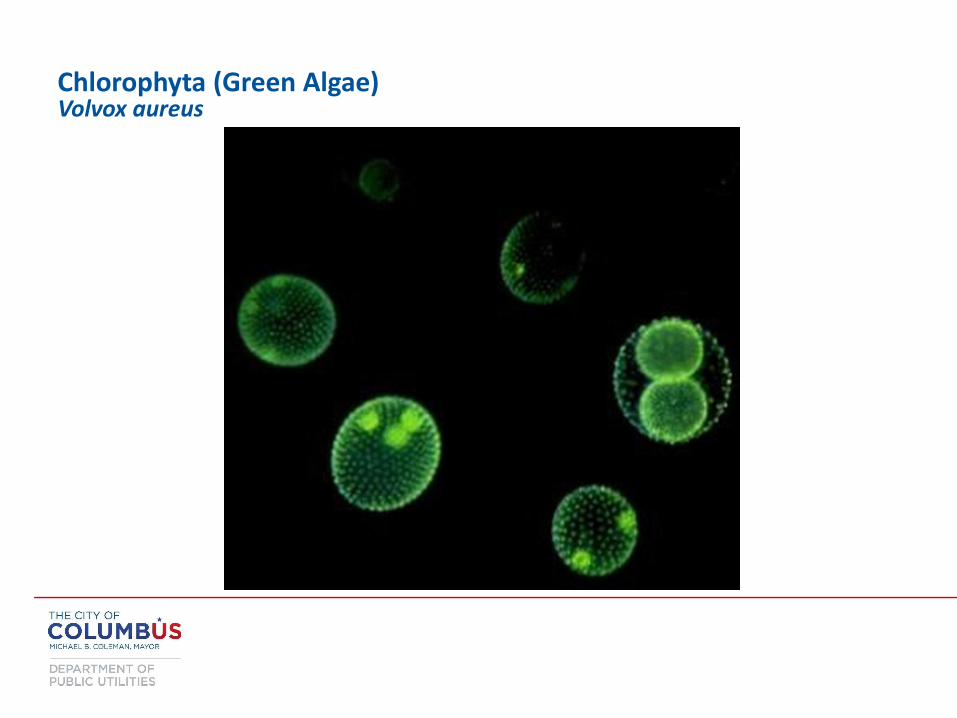
Chlorophyta (Green Algae) Volvox aureus
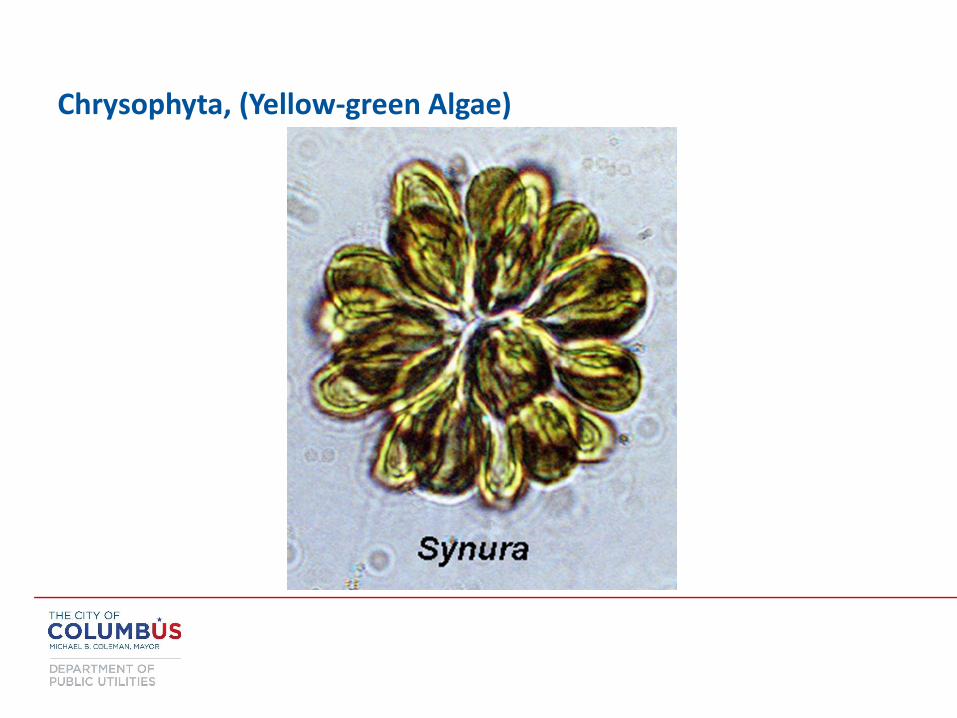
Chrysophyta, (Yellow-green Algae)
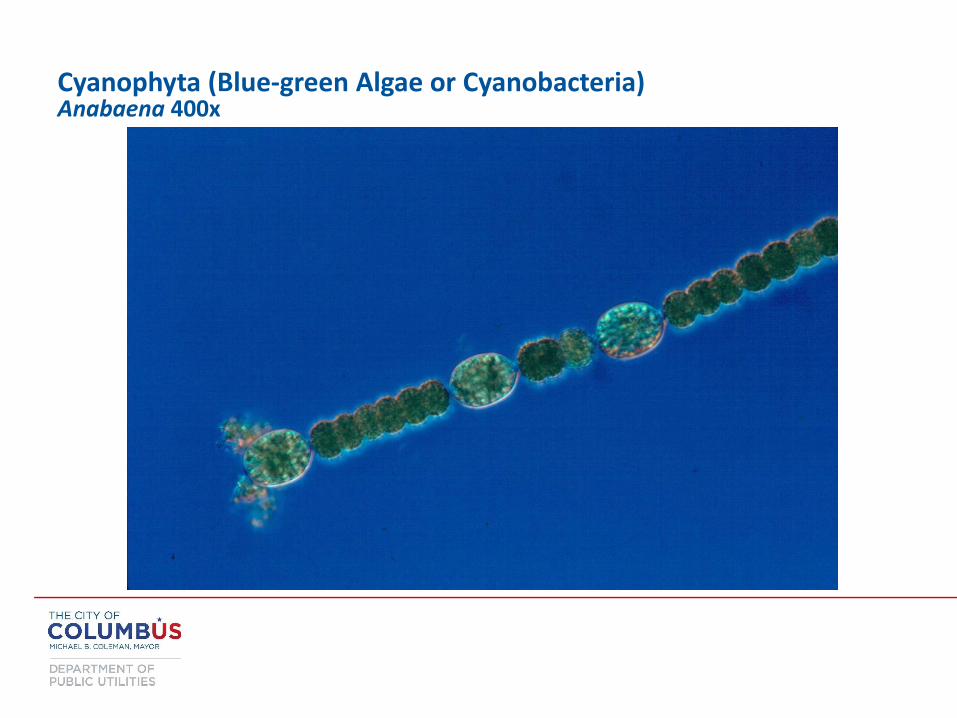
Cyanophyta (Blue-green Algae or Cyanobacteria) Anabaena 400x
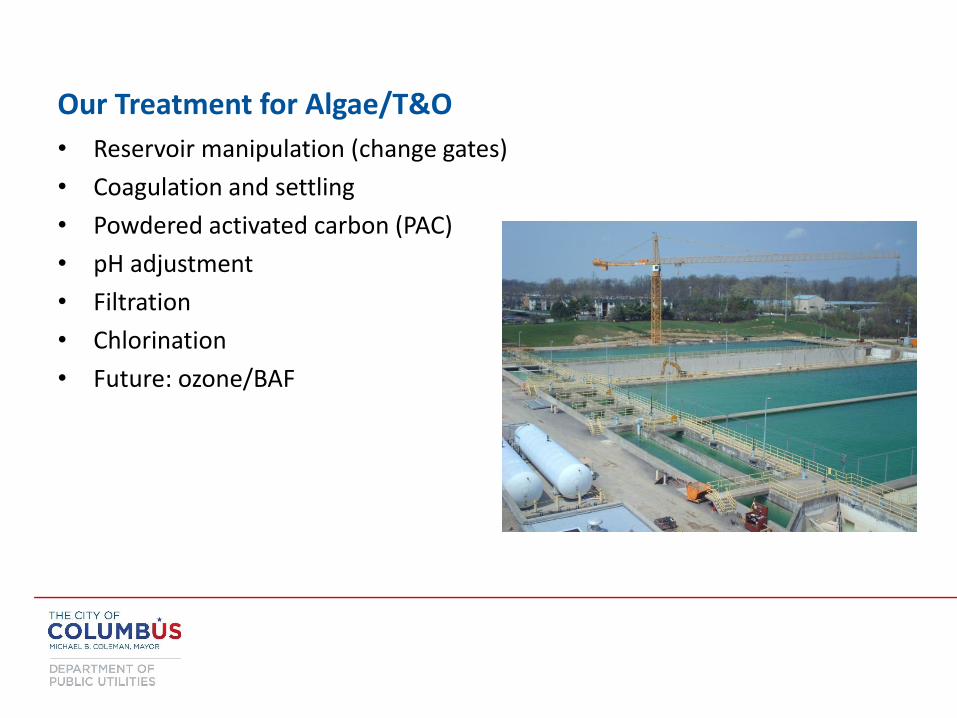
Our Treatment for Algae/T&O
• Reservoir manipulation (change gates)
• Coagulation and settling
• Powdered activated carbon (PAC)
• pH adjustment
• Filtration
• Chlorination
• Future: ozone/BAF
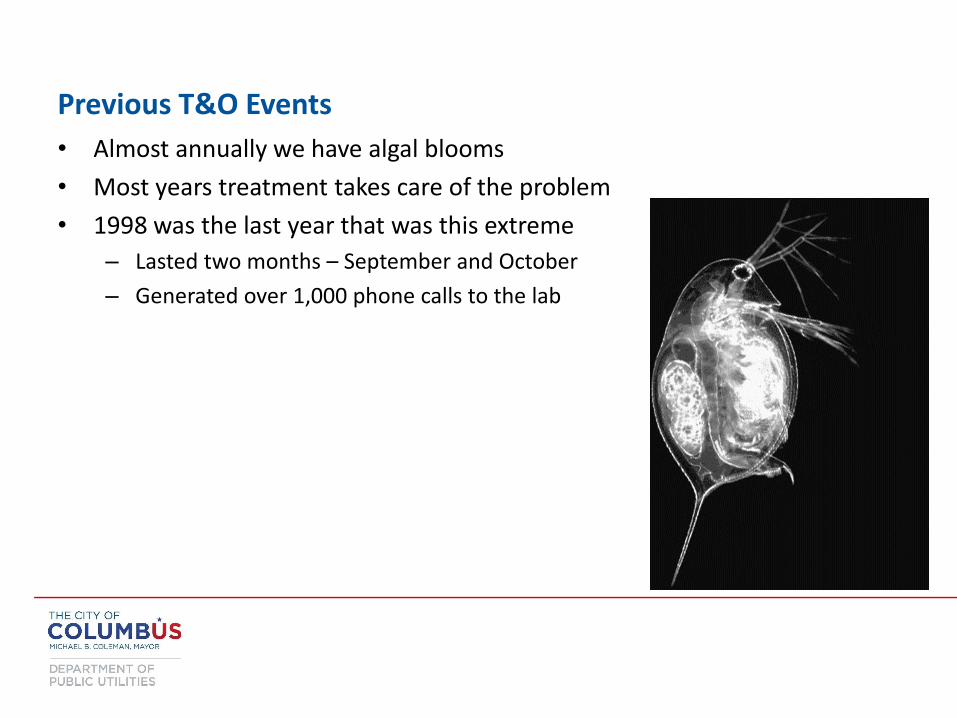
Previous T&O Events
• Almost annually we have algal blooms
• Most years treatment takes care of the problem
• 1998 was the last year that was this extreme
– Lasted two months – September and October
– Generated over 1,000 phone calls to the lab

This Event
• Algae were detected in the reservoir since May
• Reservoir turnover in late October
• T&O complaints began early November
• Peaked mid-December
• The type of algae is Anabaena
• Tastes described as earthy, musty, pond water
• No toxins present in reservoir or tap water

This Event (cont.)
• Generated over 1,800 calls to lab
• Treatment was achieving 60% removal of T&O compounds
• PAC treatment
– Five times normal dose
– $10,000 per day – doubling normal treatment cost
– $820,000 for the event

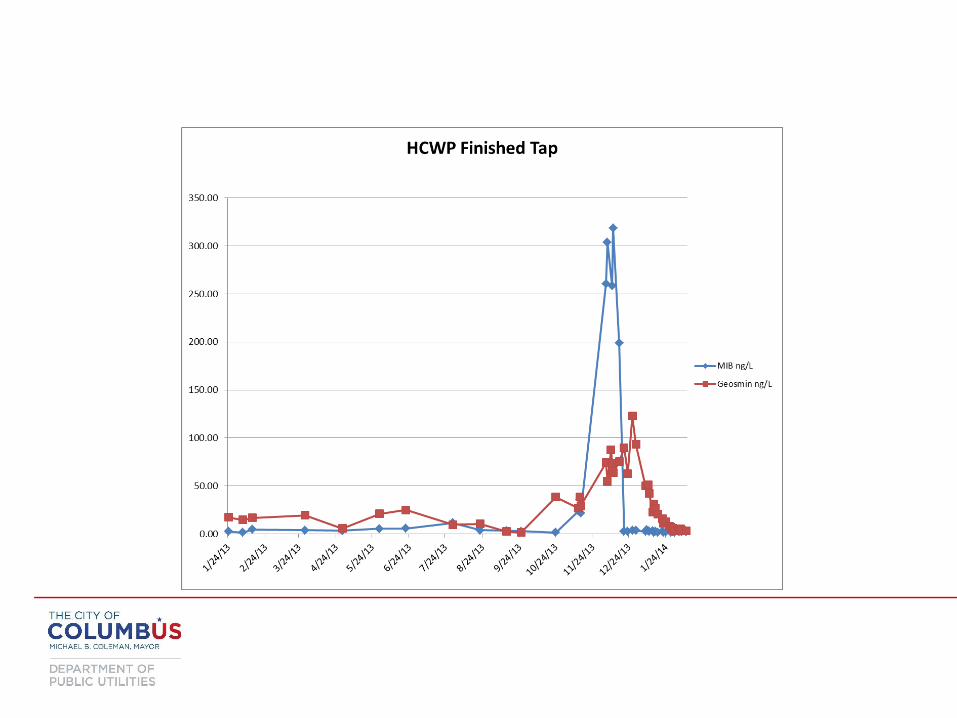
This Event (cont.)
– T&O compounds
– Geosmin and MIB
– Can be detected by customers at 6-10 ppt
– Can be detected by $100,000 instruments at 2 ppt
– Gesomin peaked >150 ppt
– MIB peaked >300 ppt
– Calls and T&O compounds were trending down by early January

2014 Prevention and Planning
• Withdrawing water from the bottom of the reservoir this summer
– P is released from the sediment when the bottom goes anoxic in the summer
– By sending it downstream, we reduce the amount of P available at turnover
• Second powdered activated carbon contract
– Normal carbon contract for atrazine and TOC removal
– Second carbon contract for T&O removal
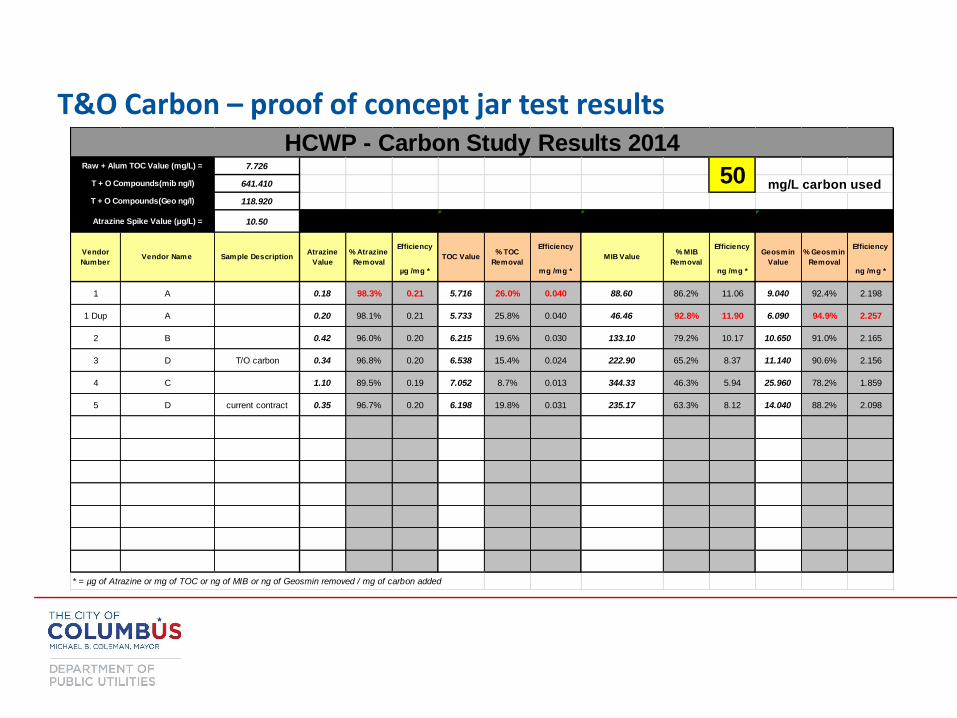
T&O Carbon – proof of concept jar test results
7.726
641.410 mg/L carbon used
118.920
10.50 50.00 98.3% 0.21 50.00 26.0% 0.04 50.00 92.8% 11.90 50.00 94.9% 2.26
Efficiency Efficiency Efficiency Efficiency
µg /mg * mg /mg * ng /mg * ng /mg *
1 A 0.18 98.3% 0.21 5.716 26.0% 0.040 88.60 86.2% 11.06 9.040 92.4% 2.198
1 Dup A 0.20 98.1% 0.21 5.733 25.8% 0.040 46.46 92.8% 11.90 6.090 94.9% 2.257
2 B 0.42 96.0% 0.20 6.215 19.6% 0.030 133.10 79.2% 10.17 10.650 91.0% 2.165
3 D T/O carbon 0.34 96.8% 0.20 6.538 15.4% 0.024 222.90 65.2% 8.37 11.140 90.6% 2.156
4 C 1.10 89.5% 0.19 7.052 8.7% 0.013 344.33 46.3% 5.94 25.960 78.2% 1.859
5 D current contract 0.35 96.7% 0.20 6.198 19.8% 0.031 235.17 63.3% 8.12 14.040 88.2% 2.098
* = µg of Atrazine or mg of TOC or ng of MIB or ng of Geosmin removed / mg of carbon added
50
HCWP - Carbon Study Results 2014
Atrazine
Value
% Atrazine
RemovalTOC Value
% TOC
RemovalMIB Value
% MIB
Removal
Geosmin
Value
Vendor
NumberVendor Name Sample Description
Raw + Alum TOC Value (mg/L) =
T + O Compounds(mib ng/l)
T + O Compounds(Geo ng/l)
Atrazine Spike Value (µg/L) =
% Geosmin
Removal

This Summer
• Cool, wet summer – much like 2013
• We are seeing the same cyanobacteria species and numbers as we did in July and August of 2013 – Including Anabaena, Aphanizomenon, Aphanocapsa, Limnothrix, and Microcystis
• There is a renewed sense of urgency and importance to T&O monitoring
• Increased our monitoring frequency to weekly from the reservoir for both algae and T&O
• We have started monitoring T&O at the middle and bottom gate levels
• We have started collecting a T&O sample from the distribution system each week to be evaluated by our taste test panel in the lab
Questions
• Will we have a T&O event this winter?