colloid systems and interfaces stability of dispersions through polymer and surfactant adsorption
DESCRIPTION
Colloid Systems and Interfaces Stabilityof Dispersions through Polymerand Surfactant AdsorptionTRANSCRIPT

6 Colloid Systems and Interfaces Stabilityof Dispersions through Polymerand Surfactant Adsorption
P. Somasundaran, Somil C. Mehta, X. Yu, and S. Krishnakumar
CONTENTS
6.1 Introduction ................................................................................................................................................................... 1556.2 Colloidal Forces ............................................................................................................................................................ 156
6.2.1 van der Waals Force .......................................................................................................................................... 1576.2.2 Hydrophobic Force ............................................................................................................................................ 1576.2.3 Steric and Bridging Forces ................................................................................................................................ 1586.2.4 Hydration and Solvation Forces ........................................................................................................................ 159
6.2.4.1 Capillary Condensation Forces............................................................................................................ 1596.2.5 Interacting Double Layers ................................................................................................................................. 1596.2.6 Summation of Various Forces ........................................................................................................................... 1626.2.7 Kinetics of Aggregation..................................................................................................................................... 163
6.3 Experimental Assessment of Dispersion Stability ........................................................................................................ 1646.3.1 Sedimentation Methods ..................................................................................................................................... 1646.3.2 Rheological Methods ......................................................................................................................................... 164
6.4 Dispersion in the Absence of Dispersing Agents ......................................................................................................... 1656.5 Adsorption and Its Effect on Dispersion....................................................................................................................... 166
6.5.1 Factors Affecting Adsorption ............................................................................................................................ 1676.5.2 Surfactant Adsorption and Its Effect on Dispersion Properties ........................................................................ 168
6.5.2.1 In Aqueous Media ............................................................................................................................... 1686.5.2.2 In Organic Media................................................................................................................................. 1736.5.2.3 Modeling the Sorption of Surfactant Stabilizers on Solids................................................................. 178
6.5.3 Adsorption of Polymers and Effect on Dispersion Properties .......................................................................... 1836.5.3.1 Theoretical Considerations on Polymer Adsorption ........................................................................... 1836.5.3.2 Basic Concepts of Adsorbed Polymer Conformations........................................................................ 1846.5.3.3 Mechanisms of Flocculation by Adsorbed Polymers.......................................................................... 1856.5.3.4 Role of Polymer Conformation in Flocculation and Stabilization...................................................... 1866.5.3.5 Stability of Dispersion in the Presence of Polymers........................................................................... 187
6.6 Summary ....................................................................................................................................................................... 193Acknowledgments.................................................................................................................................................................... 194References ................................................................................................................................................................................ 194
6.1 INTRODUCTION
Dispersions in both aqueous and nonaqueous media are used in many products including paints, dyestuffs, pigments, printinginks, papers, adhesives, cosmetics, detergents, ceramics, and pharmaceutical and pesticidal formulations. Use of coagulants toclarify drinking water was practiced in ancient China and Egypt. Mineral and environmental engineers have applied theconcepts of colloid science to help them utilize and preserve enormous resources which otherwise was waste material [1].Nowadays, ceramic products ranging from building bricks to expensive China to rocket parts are made from clay=water sols by
155
Birdi/Handbook of Surface and Colloid Chemistry 7327_C006 Final Proof page 155 8.10.2008 9:12pm Compositor Name: VAmoudavally
© 2009 by Taylor & Francis Group, LLC

applying principles of colloid science [2]. The wide use of colloid science in the areas of cosmetics and detergents has addedmany products into our daily life [3]. Knowledge of human life, either written on paper or stored on the film or disk, hasdepended upon the application of colloidal science in paper making and development of new magnetic and electronic materials.High-quality ceramics are also very important as substrates for electronic devices and are used in the preparation of capacitors,ferrites, and piezoelectrics [4]. The initial excitement of the discovery of the high-temperature superconducting oxide phaseshas been considerably dampened by the inability to process them into mechanically strong and durable products. The mainreason for the structural failure of ceramic materials is the presence of flaws in the material, which facilitates initiation andpropagation of cracks. These flaws are introduced into the material during the powder-processing stage and hence the future ofceramics, to a great extent, will depend on the control of the state of dispersion of the powder before firing [5]. Agglomeratesand inhomogeneities in the dispersion result in poor packing, grain growth porosity, and other defects. Good initial dispersionof ceramic powders in liquids is essential for production of high-quality ceramics. The similarity between some biologicalsystems and colloid dispersions, such as blood and proteins and polyelectrolytes [6], has made colloid science more attractive tothe scientific community. The successful applications of colloidal concepts in biological system include encapsulation,controlled drug release, and prevention or promotion of cell adhesion [7].
A colloidal system is composed of one or more dispersed phase and a continuous medium. Colloids are present as dispersedsystems, characterized by slow diffusion and slow (often negligible) sedimentation under normal gravity, which sets the size ofthe colloidal particles to the range of 1 nm to 1 mm. Systems in which a significant fraction of particles is in a size range that islarger than the colloidal range are termed suspensions.
Some colloidal systems such as polymer solutions and surfactant solutions containing micelles are thermodynamicallystable and form spontaneously. These types of colloids are called lyophilic colloids. However, most systems encounteredcontain lyophobic colloids (particles insoluble in the solvent). In the preparation of such lyophobic colloidal dispersions, thepresence of a stabilizing substance is essential. Since van der Waals forces usually tend to lead to agglomeration (flocculation)of the particles, stability of such colloids requires that the particles repel one another, either by carrying a net electrostaticcharge or by being coated with an adsorbed layer of large molecules compatible with the solvent.
In this chapter, the theories as well as the experimental justification for the mechanism of stabilization and destabilization ofcolloidal dispersions are outlined. Interacting forces between colloidal particles are analyzed and an overview of experimentalmethods for assessing the dispersion and relevant properties is given. The flocculation and stabilization of dispersions in thepresence of surfactants and polymers is discussed in Sections 6.5.3.5.5 and 6.5.3.5.6, respectively.
6.2 COLLOIDAL FORCES
Colloidal systems are composed of one or more dispersed phase and a continuous medium. In the processing of dispersions,aggregates or agglomerates in the dry state are broken into smaller particles in the dispersion medium. Total energy ofthe system increases due to the increase in surface energy resulting from the increase in the surface area and possible changes inthe structure and composition of the surface. The nature and the magnitude of the surface energy are determined by thephysicochemical properties of the particles and the solvent since the particles will have a tendency to undergo aggregation toreduce the surface energy. A colloidal dispersion is not a thermodynamically stable system.
Colloidal particles in a dispersion medium are always subjected to Brownian motion with frequent collisions between them.Stability and other characteristics of dispersion are thus determined by the nature of the interactions between the particlesduring such collisions. When attractive forces dominate, the particles will aggregate and the dispersion may destabilize. Whenrepulsive forces dominate, the system will remain in a dispersed state.
Generally, there are six important types of particle–particle interaction forces that can exist in a dispersion as summarized inTable 6.1.
TABLE 6.1Summary of Forces between Two Identical Particles in Aqueous Medium
Force Nature Source
Electrical double layer Repulsive Structure of surfaces and adsorption of ionsvan der Waals Usually attractive Universal presenceSteric interaction Repulsive Induced by adsorbed species
Hydration=solvation interaction Attractive=repulsive Hydration or solvation of adsorbent and adsorbatePolymeric bridging Attractive Induced by adsorbed long-chain polymerHydrophobic interaction Attractive Intrinsic or induced by adsorption
Birdi/Handbook of Surface and Colloid Chemistry 7327_C006 Final Proof page 156 8.10.2008 9:12pm Compositor Name: VAmoudavally
156 Handbook of Surface and Colloid Chemistry
© 2009 by Taylor & Francis Group, LLC

6.2.1 VAN DER WAALS FORCE
London explained the van der Waals forces (the universal attractive forces) acting between all atoms, molecules, ions, etc. onthe basis of wave mechanics. These short-range forces result from the interaction between temporary dipoles on somemolecules and induced dipoles on the neighboring molecules, and a quantum mechanical effect leading to attraction betweennonpolar molecules. Most of the interpretations of London–van der Waals forces in the past have been based on the Hamakerapproach [8], which involves pairwise addition of the microscopic forces acting between two bodies. The attractive energybetween two atoms varies inversely as the sixth power of the distance separating them and is given by
VA ¼ � b
l6(6:1)
where b is the London constant, which depends upon the properties of the specific atoms.In the case of dispersion, these forces are due to spontaneous electric and magnetic polarizations giving rise to a fluctuating
electromagnetic field within the dispersed solid and the medium separating the particles. The interaction energy between twoidentical spheres of radius R at a distance H between their centers remains the same for a constant ratio of R to H. Calling H=Ras S, the interaction energy is given as
VA ¼ �A
62
S2 � 4þ 2S2
þ lnS2 � 4S2
� �(6:2)
For the simplest case, the net attractive force between two particles at small separation distance after neglecting the retardationcorrection is given as
V ¼ �AR
12l(6:3)
wherel is the difference between H and 2R (i.e., H� 2R)A is the combined Hamaker constant
The Hamaker constant can be estimated theoretically by calculating certain molecular constants from optical data. For a systemof solid (1) dispersed in a medium (2), the combined Hamaker constant can be expressed as
A ¼ A11 þ A22 � 2A12 (6:4)
As an approximation, A12¼ (A11A22)1=2, so that
A ¼ A1=211 � A1=2
22
� �2(6:5)
6.2.2 HYDROPHOBIC FORCE
Hydrophobic interactions may exist naturally or be induced by the adsorbed hydrophobic species. Polar solvent moleculessqueezed between two hydrophobic surfaces have reduced freedom to form structures in certain directions, since contact withthe particle surfaces is essentially avoided. The hydrophobic surfaces therefore have a preference to associate with each other. Itis found that hydrophobic interactions extend over a much longer range than the van der Waals force [9]. Graphite and coal area few of the solids possessing natural hydrophobicity and their aggregation is observed in polar solvents. More often, surfacehydrophobicity of the solid particles can be induced by the adsorption of surfactants.
Hydrophobic forces have been experimentally first measured by Israelachvili and Pashley [10] with mica surfaces inequilibrium with cetyltrimethylammonium bromide solution. The hydrophobic force was found to decay exponentially in therange of 0–10 nm. van Oss [11] described the rate of decay with distance in terms of interaction energy as
DGl ¼ pRlDGl0 exp [(l0 � l)=l] (6:6)
wherel is the correlation length of the molecules of the liquid mediumDG is the interaction energy at the distance of l0l0 is the minimum equilibrium distance
Birdi/Handbook of Surface and Colloid Chemistry 7327_C006 Final Proof page 157 8.10.2008 9:12pm Compositor Name: VAmoudavally
Colloid Systems and Interfaces Stability of Dispersions through Polymer and Surfactant Adsorption 157
© 2009 by Taylor & Francis Group, LLC

In aqueous solutions, l¼ 0.6, three times of water molecule dimension, which may be attributed to the fact that the watermolecules tend to occur in clusters of three or more molecules resulting from hydrogen bonding with each other.
Though the real origin of the hydrophobic force still remains to be a mystery, its effect on the dispersion stability has longbeen recognized. Somasundaran et al. reported a clear relationship between the stability and the surfactant adsorption density aswell as the chain length of the adsorbed surfactants [12].
6.2.3 STERIC AND BRIDGING FORCES
Steric forces arise from the overlap of the adsorbed layers and can be repulsive or attractive in nature depending on whether ornot the outermost layers on the particles prefer to be in contact with the solvent. If the solvent power of the medium for theexposed portions of the exterior layer, for example, those of an adsorbed polymer layer, is satisfactory, they will be compatiblewith the medium and the suspension will remain stable [13,14]. On the other hand, if the solvent power for the adsorbed layer isminimal, there will be a tendency for the exposed portions of the adsorbed layer on one particle to interpenetrate into those of alayer on another particle and thereby promote aggregation.
Interpenetration and aggregation is possible only if the net change in Gibbs free energy due to the interpenetration of thepolymer chains is negative. The Gibbs free energy change is considered in such cases to be determined essentially by thechange in entropy due to the release of solvent molecules and due to the decrease in randomness of the polymer chain and bythe enthalpy of desolvation of the polymer chains. For flocculation to occur according to this mechanism, the increase inentropy due to the release of solvent molecules should outweigh the loss of entropy due to the interpenetration of polymerchains and increase in enthalpy of desolvation. It is clear that the desolvation characteristics of the adsorbed polymer speciesand the dependence of it on solution properties such as temperature and ionic strength will be important in determiningaggregation by this mechanism. Ottewill and Walker derived an equation for the energy change due to an overlap of theadsorbed layers by using Flory’s liquid lattice model for polymer solutions [13,15].
Vsteric(a) ¼ 4pkTC2v
3v21r22
(c1 � k1)(d� a)2(3Rþ 2dþ a=2) (6:7)
whereCv is the concentration of material in the adsorbed layerv1 is the molecular volume of solvent moleculesr2 is the density of the adsorbatec1 and k1 are the entropy and enthalpy parameters, respectively, of mixing proposed by Floryd is the adsorbed layer thicknessR is the particle radiusa is the distance separating the surfaces of two approaching particles
Steric repulsion can be explained in the following manner. When two particles with adsorbed long-chain moleculesapproach each other, the entropy per adsorbed molecule decreases causing desorption and a concomitant increase in theinterfacial energy. This means that additional work has to be input to bring the particles together and this manifests itself as arepulsive force.
A long-chain adsorbate with several active sites on it can induce aggregation by attaching itself to two or more particles.Polymers can provide such bridging between particles particularly under conditions where particles are not totally coated by thepolymeric species. If particles are already fully covered with polymers, bridging can take place only if there is eitherdetachment of some portion of the polymer already on a particle to provide sites for attachment of polymer fractions adsorbedon other particles or polymer–polymer bonding itself. It has been suggested that maximum flocculation occurs when thefraction of particle surface covered by polymer molecules is close to 0.5. It is to be noted that this hypothesis has not, however,been experimentally proven. As indicated earlier, bridging should be possible even when particles are fully covered if somedetachment and reattachment of the adsorbed polymer is possible. Adsorption of polymers is in general found to be irreversible,that is, except in the occasional case of polymers with functional groups that form covalent bonds with the surface species, onlydue to the cumulative effect of adsorption of a single-polymer molecule on several sites. Detachment and reattachment ofportions of such a polymer should, however, be possible and such a process should facilitate bridging. This has been shown tobe so by allowing polymers to be displaced from the surface by adding competing agents into the system. Thus polyacrylamidecan be desorbed from clay by adding phosphates into the solution. Absence of bridging might be interpreted to suggest thepresence of strong repulsive steric interactions between dangling portions of the adsorbed polymer chains.
For steric stabilization and bridging flocculation by adsorbed polymers, there is still no satisfactory quantitative theory. Thisis because any theory for those processes must be couched in terms of one or the other of the theories of polymer solutionthermodynamics which are at best semiquantitative. Also, to calculate the distance dependence of the steric interaction, it is
Birdi/Handbook of Surface and Colloid Chemistry 7327_C006 Final Proof page 158 8.10.2008 9:12pm Compositor Name: VAmoudavally
158 Handbook of Surface and Colloid Chemistry
© 2009 by Taylor & Francis Group, LLC

necessary to predict the conformation of close-packed polymer molecules. In fact, except in two solvents, it is very difficult topredict the polymer conformation in solution [13]. Despite these difficulties, some progress has been made in developingpragmatic models capable of predicting the distance dependence of the steric and bridging interactions.
6.2.4 HYDRATION AND SOLVATION FORCES
Recent work on the measurement of forces acting between surfaces on liquids has revealed the existence of some powerfulshort-range forces which have their origin on the packing ordering of molecules at the interface [16,17]. These includehydration and solvation interactions and also effects due to phase changes in the interlayer between two surfaces in closeproximity. The Derjaguin–Landau–Verwey–Overbeek (DLVO) theory is based on the continuum theory; both the interactingbodies and the medium are characterized by their dielectric properties which do not change with surface separation. However,this is not valid for small separation distances where due to molecular ordering the properties are quite different than in the bulk.At these small separation distances forces due to phase separation or phase transitions in the liquid film between the surfaces,including capillary condensation and cavitation and forces due to surface induced solvent structures come into play and cancontribute significantly to the stability of dispersions. The repulsion between the particles is due to the necessity for ions to losetheir bound water to allow the approach to continue and this is thermodynamically unfavorable. However, the hydration effectcan result in significantly enhanced attraction between two hydrophobic particles.
The presence of an isolated surface induces ordering (layering) of the adjacent molecules of the fluid in contact with it andthis gives rise to a density profile with an oscillatory nature. The magnitude of the oscillation decays with distance from thesurface and for the two surfaces at a sufficiently large separation the density profile from either surface has decayed to the bulkvalue at the midplane. As the surfaces are brought close together, there is an overlap of the density profiles. There is anenhancement of ordering at separation distances close to an integral number of layers or molecular diameters and this isenergetically favorable. At intermediate distances, the density profiles overlap destructively and will cause a free energymaximum. The result is a free energy curve that oscillates between repulsive maxima and attractive minima as the surfaceseparation is varied. Surface roughness smears out the ordering and removes this oscillatory force. Similarly solvent penetrationinto an adsorbed layer removes these short-range forces. In force measurements of mica surface immersed in organic solvents, itwas found that the adsorption of small quantities of water on the surfaces removed the oscillatory forces probably by disturbingthe molecular ordering of the solvent. The important aspect about these repulsive structural forces is that at distances below30 Å they can exceed van der Waals forces and electrical double-layer forces.
6.2.4.1 Capillary Condensation Forces
Phase changes can occur at the interface of solids and liquid mixtures. As mentioned earlier, a surface excess of a secondspecies will cause a disruption of the molecular ordering and a reduction of the free energy maxima and minima arising frompacking constraints. In the case of water on the surface of mica in a nonpolar solvent due to the low contact angle of water onmica, it will form an annulus around the contact area of two such surfaces. This is analogous to capillary condensation from thevapor phase. The thermodynamically stable state for two surfaces in close proximity in a nonpolar liquid containing water iswith a bridge of water connecting the two surfaces. The water bridge should be stable when the surface separation is less than orequal to twice the Kelvin radius. The net effect of this spontaneous capillary condensation occurring at separation distanceslower than about 10 Å is to provide a very strong attractive force as well as large adhesion between the surfaces. The adhesionat contact reflects the interfacial tension of the water–nonpolar liquid interface and is an order of magnitude larger than expectedeither from van der Waals or solvation forces [18].
6.2.5 INTERACTING DOUBLE LAYERS
Most substances acquire surface electrical charges when brought in contact with a polar medium, resulting from one or more ofthe following:
1. Preferential dissolution and solvation of surface species followed by dissociation of some of these species.2. Lattice imperfection on solid surfaces.3. Adsorption of ions or impurities at the solid–liquid interface. The surface charge influences the spatial distribution of
ions or molecules in the surrounding solution, attracting ions of opposite charge but repelling ions of similar chargefrom the surface. Along with the thermal motion, this leads to the formation of the diffused electrical double layer thatconsists of the charged surface, neutralizing counterions and, further from the surface, co-ions distributed in a diffusemanner [19] (Figure 6.1).
In the absence of any significant ionization in low dielectric constant media, the other three mechanisms are highlyimprobable. In the absence of any adsorbable surfactants, the dissociation of surface groups appears to be the most general
Birdi/Handbook of Surface and Colloid Chemistry 7327_C006 Final Proof page 159 8.10.2008 9:12pm Compositor Name: VAmoudavally
Colloid Systems and Interfaces Stability of Dispersions through Polymer and Surfactant Adsorption 159
© 2009 by Taylor & Francis Group, LLC

mechanism and the ion responsible for the charge transfer between solvent and particle is the proton. The direction of protonictransfer depends on the relative basicity or acidity of solvent and particle. If the solid surface be represented by PH and thesolution by SH then the sign of the surface charge due to proton acceptance or donation is governed by the relative protondonating=proton accepting capacity of the surface and the solution:
PHþ2 þ S� ¼ PHþ SH ¼ P� þ SHþ
2
If the particle charge is the result of adsorption of ionic surfactants, its sign depends on the absorbability of the surfactantcation and anion. The most probable mechanism as elucidated by Fowkes is the adsorption of the surfactant as an ion pair(neutral molecule) followed by a proton exchange reaction the direction of which depends on the relative acidity=basicityof the surfactant and the surface [20]. The final step in the charge generation process is the dissociation of the desorption ofthe protonated=deprotonated surfactant species leaving a net charge at the interface. Figure 6.2 depicts this processschematically.
Despite the difficulties in quantitative treatment, there exist theoretical models based on the classical treatment initiated byGouy, Chapman, Debye, and Huckel and later modified by Stern and Grahame. As shown in Figure 6.3 [19], a reasonablerepresentation of the potential distribution by the Poisson–Boltzman equation can be given as
–
+
+ +
d
Solid
+
+
+
–
–––
––
–
––
––
––
––
Sternlayer Gouy or diffuse layer
Bulksolution
Solvent molecule (water)showing direction of dipole
Specifically adsorbed coion
Counterion, usually hydrated
e = ∞
e = 32
e = 78
e = Dielectric constant(normal water = 78)
e = 6
Shearboundary Gouy
plane
InnerHelmholtz
plane
OuterHelmholtzor sternplane
FIGURE 6.1 Schematic representation of the electrical double layer in the vicinity of the solid–liquid interface.
Birdi/Handbook of Surface and Colloid Chemistry 7327_C006 Final Proof page 160 8.10.2008 9:12pm Compositor Name: VAmoudavally
160 Handbook of Surface and Colloid Chemistry
© 2009 by Taylor & Francis Group, LLC

d2c
dl2¼ � e
«
Xi
zini0 expziec
kT
� �(6:8)
wherec is the potential at a distance l from the surface« is the permittivity of the medium («¼ «o«r)ni0 is the bulk concentration of ions of charge zie is the electronic unit chargek is the Boltzman’s constantT is the absolute temperature
B
A– A–
A–
A–
A–
A–
A–
B
B
B
B
BB BH
B
BH
BH
BH
BH
AHAH
AHAH
AH
AH
AH
AH
AHAH
AH
BHBH
BH
B
BH
B
+
++
+
+
+ +
+
B
B
B+
FIGURE 6.2 Schematic representation of the origin of surface charge in nonaqueous media.
Gouy plane
Diffuse layer
Shear plane
Stern planeNet
negativeparticle
+
+
+
+
+
+++
+
+
+
+ +
+
++
++
+
+++++
++
+
++ +
++
+
++
+
+++++
++
++
+
–
–
–
–
– – –
–
– ––
–
–
–
–––
–
–––
–
––
–
–
Bulk solution
Particle surface
Surface potentialStern potentialZeta potentialDouble-layer thickness(reciprocal Debye length) l/x Distance from
particle surface
Potential, yo
yδ
z
FIGURE 6.3 Distribution of electrical potential in the double-layer region surrounding a charged particle showing the zeta potential and thereciprocal Debye length.
Birdi/Handbook of Surface and Colloid Chemistry 7327_C006 Final Proof page 161 8.10.2008 9:12pm Compositor Name: VAmoudavally
Colloid Systems and Interfaces Stability of Dispersions through Polymer and Surfactant Adsorption 161
© 2009 by Taylor & Francis Group, LLC

For low charge density, ziec=kT< 1, an explicit solution of the above equation can be written in the form
c(l) ¼ cde�kl (6:9)
where k is known as the reciprocal Debye length with 1=k often referred to as the double-layer thickness and can be calculatedfrom
k ¼ 1000e2NA
ekTSz2i Mi
� �1=2
(6:10)
whereNA is Avogadro’s constantZi and Mi are the valency and molar concentration of the ion, respectively
The nature and the thickness of the electrical double layer are important because the interaction between charged particles isgoverned by the overlap of their diffuse layers. Unfortunately, it is impossible to directly measure the Stern potential cd.Instead, zeta potential, z, which is the potential at the shear plane close to the Stern plane can be experimentally measured and isoften used as a measure of the surface potential.
For most simple situations, the repulsive interaction energy between two identical charged particles of equal radius R andzeta potential z at a distance of separation l can be given by
Ve ¼ 0:5p«Rz2 ln 1þ e�kl� �
(6:11)
Though derived based on the low surface charge density, Equation 6.11 has been found to be valid for situation where zetapotential is as high as 50 mV.
6.2.6 SUMMATION OF VARIOUS FORCES
The DLVO theory which has been used with success to explain stabilization mainly in aqueous systems states that the overallinteraction energy is the sum of the electrostatic and van der Waals forces. However, this has been extended now to include thesteric forces also. The total interaction energy can be expressed as
VT ¼ Velec þ VA þ Vsteric (6:12)
Figure 6.4 shows the total interaction energy as a function of particle separation and displays a maximum, called the energybarrier [21]. For suspensions to be destabilized, the particles must have enough energy to surmount this barrier duringcollisions. In the absence of electrostatic interactions, the particles can get trapped in the secondary minimum and formloose aggregates that can usually be redispersed easily. The electrostatic forces however, cause the disappearance of thesecondary minimum and increase the barrier to the primary minimum thereby decreasing the probability of aggregation. Thus acombination of electrostatic and steric forces is necessary for effective stabilization [20]. In systems stabilized solely byelectrostatic forces an energy barrier of about 30 kT is desirable with a debye length 1=k of not more than 1000 Å.
VA
(a) (b)
Pot
entia
l ene
rgy
Interparticle separation
H0
+
−
H
VSt
VA + VSt
Velec+ VA + VSt
Velec+ VA
VSt
FIGURE 6.4 Diagram representing the variation of total interaction energy between particles with separation distance.
Birdi/Handbook of Surface and Colloid Chemistry 7327_C006 Final Proof page 162 8.10.2008 9:12pm Compositor Name: VAmoudavally
162 Handbook of Surface and Colloid Chemistry
© 2009 by Taylor & Francis Group, LLC

For systems stabilized solely by electrostatic repulsion, a decrease in the energy barrier will lead to rapid coagulation. Theenergy barrier can be decreased by the addition of counterions that can specifically adsorb and alter the surface charge or causedouble-layer compression. The critical coagulation concentration for different ions depends on the valency of the ions asformulated by Schulze and Hardy. Typically cc, the critical coagulation concentration, is proportional to z2, where z is thevalency of the ion.
Adsorbed layers of surfactants and polymers can affect stability in the following manner. If they are charged they canproduce, increase, or decrease the electrostatic repulsion. In the case of polymer or long-chain molecules, steric repulsionoccurs when the adsorbed layers start to penetrate. The adsorbed layer has a Hamaker constant different from that of the particleand hence the van der Waals interactions are altered.
6.2.7 KINETICS OF AGGREGATION
The rate of aggregation will depend essentially on probability of collision between particles, probability of attachment duringsuch collisions and probability of their detachment from the aggregates subsequently. While the probability of collision willdepend on the Brownian motion determined essentially by the temperature of the system and on fluid flow motions determinedby the viscosity of the fluid medium and external stirring, probabilities of adhesion and detachment are dependent on the type ofphysicochemical interactions between the particles and, to some extent, on velocity gradients in the medium.
Both Brownian and velocity gradient aggregations are described by Smoluchowski treatment that relates the rate ofaggregation to the radius of the particle and the total number of particles in the system in the following manner. Aggregationdue to Brownian motion, known as perikinetic aggregation, leads to a decrease in the number of particles governed by thefollowing second-order equation if every collision is successful in creating an adhesion.
dNt
dt¼ �8pDrN2
t (6:13)
whereNt is the total number of particles at time tD is the diffusion coefficient for the particler is the radius of the particle
Integrated form of Equation 6.13 is
Nt ¼ N0
1þ 8pDrN0t(6:14)
This derivation takes into account formation of only doublets. In reality primary particles can also aggregate with multiplets.Solution for all particle aggregates containing i particles is given as
X1i¼1
Ni ¼ N0
1þ 4pDrN0t(6:15)
Slow stirring can indeed promote aggregation. Such aggregation under the influence of velocity gradient is known asorthokinetic aggregation. Rate of orthokinetic aggregation is given by
� dNt
dt¼ 16Gr3
3
Xpk¼1
N2k k (6:16)
whereG is velocity gradientNk is number of k particles per unit volumek is the particle(s) formed by aggregation of two particlesp is the particle of limiting size in shear gradient G
As mentioned earlier, above formulations assume that every collision is fruitful. In reality, only a fraction of the collisionsmight be effective and as a result the aggregation might be slow. The magnitude of this fraction is dependent upon the nature ofinteractions between particles and, to some extent, viscous properties of the liquid film between the particles. If V is the totalenergy of interaction between particles of radii ri and rj when they are separated by a distance d the fraction of effectivecollisions, a, according to Fuchs is given by the following expression:
Birdi/Handbook of Surface and Colloid Chemistry 7327_C006 Final Proof page 163 8.10.2008 9:12pm Compositor Name: VAmoudavally
Colloid Systems and Interfaces Stability of Dispersions through Polymer and Surfactant Adsorption 163
© 2009 by Taylor & Francis Group, LLC

1a¼ 2
ð1
2
expV
kT
� �dS
S2(6:17)
wherek is the Boltzmann constantS is equal to 2d=(riþ rj)
As an example, for maximum V equal to 5, 15, and 25 kT, a is 2.5� 10�2, 2.5� 10�5, and 2.5� 10�9, respectively.The interactions between particles that are important in determining a are made up on London–van der Waals attractive
forces (Va), electrical double-layer forces (Ve) that can be attractive or repulsive in nature, bridging forces (Vb) that are alwaysattractive and steric forces (Vsteric) that arise from the overlap of adsorbed layers. Steric forces can be repulsive or attractivedepending on the solubility properties of the adsorbed layer.
6.3 EXPERIMENTAL ASSESSMENT OF DISPERSION STABILITY
Stability in colloidal dispersions is defined as resistance to molecular or chemical disturbance and the distance the system isremoved from a reference condition may be used as a measure of stability. The stability can be analyzed from both energeticstandpoint and kinetic standpoints. The kinetic approach uses the stability ratio,W, as a measure of the stability.W is defined asthe ratio of rate of flocculation in the absence of any energy barrier to that when there is an energy barrier due to adsorbedsurfactant or polymer. These processes are referred to as rapid and slow flocculation with rate constants kT and kS, respectivelysuch that W¼ kT=kS. The stability of colloidal suspensions can be evaluated using various techniques. In practice, mainly twomethods are used: sedimentation and rheology measurements.
6.3.1 SEDIMENTATION METHODS
This is a relatively simple method in which a series of tubes containing the dispersion in a homogeneous state are arranged. Thesettling rate is estimated by monitoring the rate of descent of the upper interface with time and gives information on the stabilityof the dispersion. A high value of settling rate corresponds to an unstable dispersion and vice versa since flocculated particlessettle more rapidly than deflocculated ones except in concentrated systems where hindered settling occurs. Sedimentationvolumes can be typically measured after a settling rate determination after allowing the samples to settle for a considerably longtime. Sediment volumes provide valuable information on the nature of the floccs. For example, flocculated particles form softand loosely packed sediments and have large sediment volumes and are easily redispersed in most cases. However, stablesuspensions will form compact sediments of smaller volume that are not easy to redisperse. Techniques such as visualobservation, light scattering, and absorbance measurements with a spectrophotometer are generally used to study sedimentationrates. Two other useful parameters can be measured from these tests which yield further qualitative information on the nature ofthe dispersion=flocculation. Percent weight settled is estimated by removing a fixed volume of the dispersion after a fixedamount of time and calculating the amount of solids settled in that time. In many of applications, particularly when the liquidneeds to be recycled, clarity of the supernatant is an important factor. Therefore, the turbidity or light transmittance ofsupernatant after flocculation is also monitored sometimes as a criterion for suspension stability. This parameter is dependenton the particle size distribution (the same is valid for settling rate determination).This is very useful especially in the case ofpolymers and reflects the efficiency of fine particle capture by the flocculating agent. Advanced imaging techniques such asCAT-scan can also be used to get information on the structure of suspension and flocs [22].
6.3.2 RHEOLOGICAL METHODS
These methods are widely used to assess dispersion stability and can give very useful information on the particle–particleinteractions with the dispersion medium. These measurements however give indirect information on the stability of dispersionsand must be used in conjunction with the sedimentation tests for maximum benefit.
Additional tests to determine wettability of the surfaces include flotation and two-phase separation. In flotation, the particlesafter treatment with the surface modifier are introduced into a stream of bubbles and the amount of solids floated out in a fixedperiod of time is taken as a measure of the hydrophobicity of the particles. A modification of the flotation technique is thebubble pickup in which single bubbles are generated in a controlled manner and contacted with the dispersed particles. Theweight of particles thus removed by a fixed number of bubbles is taken as a measure of the hydrophobicity.
In the two-phase separation test, a known amount of the dispersion is introduced into a separatory funnel consisting of twoimmiscible phases (one aqueous and the other organic). The particles are shaken thoroughly and then allowed to separate intothe two phases. The two phases are then separated and the amounts of solids in each of them determined giving us a partitioncoefficient reflective of the wettability of the particle surface.
Birdi/Handbook of Surface and Colloid Chemistry 7327_C006 Final Proof page 164 8.10.2008 9:12pm Compositor Name: VAmoudavally
164 Handbook of Surface and Colloid Chemistry
© 2009 by Taylor & Francis Group, LLC

6.4 DISPERSION IN THE ABSENCE OF DISPERSING AGENTS
Figure 6.5 shows the settling behavior of bare alumina particles in solvents of varying polarity [23]. It can be observed that thedispersion stability displays a maximum (corresponds to minimum in normalized settling rate; the normalization is done toaccount for differences in the density and the viscosity of the solvents and the normalized settling rate¼ observed settlingrate� solvent viscosity=[particle density� solvent density]) with increase in solvent polarity. The maximum stability in thiscase is observed in moderately polar solvents (20< «< 45). Bare particles suspended in a liquid medium are in constantBrownian motion and can flocculate rapidly on collision if the Va term is larger than about 15 kT. Stabilization can usually beachieved by decreasing the van der Waals attractive forces. The potential energy due to the van der Waals interaction can becalculated approximately for two spherical particles suspended in a liquid medium using the following equation:
Va ¼ �AS=L=Sa
12H0
� �for H0 � a (6:18)
where AS=L=S is the combined Hamaker constant for the solid in the liquid and can be estimated from the following equation:
AS=L=S ¼ AS þ AL � 2(ASAL)1=2 (6:19)
where AS and AL are the Hamaker constants of the respective solids and liquids in vacuum.
AS(kT) ¼ 113:7(«� 1)2
(«þ 1)3=2(«þ 2)1=2(6:20)
The A values for ceramic substrates and liquids can also be estimated from Equation 6.20, where « is the static dielectricconstant of the material being considered. A value of «s¼ 9.3 is assumed for alumina based on reported measurements [24] andAal estimated to be 70.5 kT from Equation 6.20. Similar calculations have been performed for the different liquids consideredhere and the results are shown in Table 6.2. For a given set of particles, the AS=L=S value is directly proportional to the van derWaals attractive energy. It can be seen from the values shown in Table 6.2 that the dispersion behavior as predicted by changesin the van der Waals interaction is similar to the observed behavior. This suggests that the primary cause for the observedchanges in stability with solvent polarity is the change in the attractive interaction. Figure 6.6 depicts the variation ofthe attractive potential (Equation 6.20) with interparticle distance for these bare alumina particles in different liquids. Itcan be seen that at low interparticle separations, the attractive energy is maximum for cyclohexane (ASLS¼ 25.5 kT) andminimum for isopropanol (ASLS¼ 1.1 kT). However, one should be aware that in polar liquids, alumina is also capableof developing significant amount of surface charge which can enhance the dispersion stability by contributing to theelectrostatic repulsion term.
00
100
200
300
400
20 40Dielectric constant
Nor
mal
ized
set
tling
rat
e (µ
m/s
)
60 80
FIGURE 6.5 Stability of bare alumina particles as a function of solvent polarity.
Birdi/Handbook of Surface and Colloid Chemistry 7327_C006 Final Proof page 165 8.10.2008 9:12pm Compositor Name: VAmoudavally
Colloid Systems and Interfaces Stability of Dispersions through Polymer and Surfactant Adsorption 165
© 2009 by Taylor & Francis Group, LLC

6.5 ADSORPTION AND ITS EFFECT ON DISPERSION
Adsorption of molecules on solids from solution is important in controlling a variety of interfacial processes such as mineralflotation and other solid–liquid separation processes, flocculation=dispersion, blood clotting, and micellar flooding of oil wells.Adsorption results from energetically favorable interactions between the solid adsorbate and the solute species. Adsorption ofsurfactants on minerals from aqueous or organic solutions is often a complex process since it can be influenced by allcomponents of the system: solid, solvent, and solute. Several interactions such as electrostatic attraction, covalent bonding,hydrogen bonding or nonpolar interactions between the adsorbate and the adsorbent species, and lateral interaction between theadsorbed species as well as their desolvation can contribute to the adsorption process.
Adsorption can be considered to be a process of selective partitioning of the adsorbent species to the interface in preferenceto the bulk and is the result of interactions of such species with the surface species on the solid. The interactions responsible foradsorption can be either physical or chemical in nature. Therefore, adsorption can be broadly classified into two categories,physical adsorption or physisorption and chemical adsorption or chemisorption, depending on the nature of the forces involved[25]. Physical adsorption is usually weak and reversible and involves small energy changes. The van der Waals forces andelectrostatic forces are primarily responsible for physical adsorption which is also characterized by a high rate of adsorption andformation of multilayers [26]. Chemical adsorption occurs through covalent bonding between the adsorbate and the surfacespecies on the solid. Chemical adsorption normally involves an activation stage and is characterized by relatively higher energychanges and a low rate of adsorption. The adsorption is usually strong and irreversible and is limited to a monolayer.A distinction between physical and chemical adsorption can usually be made from the temperature dependence of theadsorption process. In the case of physical adsorption, the adsorption generally decreases with increasing temperature whilein the case of chemisorption, it increases. However, it must be noted that the distinction between physical and chemicaladsorption is an arbitrary one and in many cases an intermediate or combined character of adsorption is encountered. In somecases, like adsorption of gases on metal surfaces, physisorption may take place initially and may be followed by adsorbent–adsorbate reactions, resulting in chemisorption [27].
TABLE 6.2Hamaker Constant and Dispersion Stability for Alumina in Different Solvents
Solvent Dielectric Constant AL (kT) ASLS (kT) Observed Behavior
Cyclohexane 2.02 11.2 25.5 PoorChloroform 4.3 40.4 4.3 Poor2-Butanol 10.8 85.7 0.8 GoodIsopropanol 18.3 89 1.1 Good
Ethanol 24.3 94.6 1.9 GoodMethanol 32.4 99 2.5 GoodMethanol=water (40%) 66.7 106.3 3.8 Good–poor
Water 80 107.5 3.9 Good–poor
0−700
−600
−500
−400
Attr
activ
e po
tent
ial e
nerg
y, V
a, k
T
−300
−200
−100
0
dc
b
a
10 20 30
Interparticle distance, nm
40 50 60
FIGURE 6.6 Variation of attractive potential between particles as a function of separation distance for (a) cyclohexane, (b) water,(c) ethanol, and (d) isopropanol.
Birdi/Handbook of Surface and Colloid Chemistry 7327_C006 Final Proof page 166 8.10.2008 9:12pm Compositor Name: VAmoudavally
166 Handbook of Surface and Colloid Chemistry
© 2009 by Taylor & Francis Group, LLC

The adsorption density, which is the amount of adsorbate removed from the solution to the interface can be mathematicallyexpressed as [28]
Gi ¼ 2rC exp�DGo
ads
RT
� �(6:21)
whereGi is the adsorption density in the plane d, which is at the distance of closest approach of counterions to the surfacer is the effective radius of the adsorbed ionsC is the bulk concentration of the adsorbate in mol=mLR is the gas constantT is the absolute temperatureDGads
o is the standard free energy of adsorption
In practice however, the adsorption density is measured as depletion of the adsorbate from the solution as shown in thefollowing equation:
G ¼ (Cf � Ci)V
W(6:22)
whereG is the adsorption density in mol=gCf and Ci are the initial and final concentration, respectively, of the adsorbate in mol=LV is the volume of solution in LW is the weight of the adsorbent in g
The net driving force for adsorption DGo can be considered to be the sum of several contributing forces
DGoads ¼ DGo
elec þ DGochem þ DGo
c---c þ DGoc---s þ DGo
H þ DGoH2O
þ � � � (6:23)
whereDGo
elec is the electrostatic interaction termDGo
chem is the chemical term due to covalent bondingDGo
c---c is the lateral interaction term owing to the cohesive chain–chain interaction among adsorbed long-chain surfactantspecies
DGoc---s is due to interaction between hydrocarbon chains and hydrophobic sites on the solid
DGoH is the hydrogen bonding term
DGoH2O
is the solvation or desolvation term owing to hydration of the adsorbate or any other species from the interfaceduring adsorption
For each surfactant–solid–solvent system, several of the above terms can be significant depending on the mineral andthe surfactant type, surfactant concentration, background electrolyte, and solvent temperature. For nonmetallic minerals,electrostatic attraction and lateral interaction effects are considered to be the major factors determining adsorption while forsalt-type minerals such as calcite and sulfides such as galena, the chemical term often becomes significant. In organic liquids,the electrostatic forces are minimal and adsorption depends on the hydrophobic and hydrophilic interactions amongthe constituents.
6.5.1 FACTORS AFFECTING ADSORPTION
There are several factors controlling adsorption which also influence the mechanisms governing the adsorption process. Thesehave been reviewed by Parfitt and Rochester [26] and are briefly discussed here:
1. Nature of the surface: The physical characteristics of the solid (surface area, porosity, etc.) determine the area availablefor adsorption while the chemical nature of the surface determines the reactivity of the surface toward a given solute.The heterogeneity and the presence of adsorbed impurities can also affect the adsorption process.
2. Chemical structure of the solute and its interactions with the solvent: The structure (hydrocarbon chain length,branching, nature, and location of polar functional groups) of the solute and its interactions with the solvent (solubility,
Birdi/Handbook of Surface and Colloid Chemistry 7327_C006 Final Proof page 167 8.10.2008 9:12pm Compositor Name: VAmoudavally
Colloid Systems and Interfaces Stability of Dispersions through Polymer and Surfactant Adsorption 167
© 2009 by Taylor & Francis Group, LLC

complexation, micellization) has a marked effect on its adsorption. For example, it is well known from Traube’s rulethat for aqueous surfactant solutions the surface activity and hence the adsorption at the liquid=air interface increaseswith an increase in the chain length of the solute molecule. The solutes of interest, surfactants, are also capable offorming association structures in solution (micelles or reverse micelles depending on the solvent), which is a measureof their solvophobicity.
3. Nature of the solvent: The solvent can influence the adsorption by interacting with the surface and=or the solutethereby weakening the interaction between the solute and the surface. The chemical nature of the solvent and itspolarity are important properties in question.
4. Nature of the interactions between the surface and the adsorbed solute: The structure and orientation of the adsorbedlayer depend upon the relative strength of the interaction between the surfactant and the surface and the surfactantassociation behavior in the bulk solution. An example of such an interaction in aqueous systems is the electrostaticinteraction between the charged surface sites and the charged surfactant molecules.
5. Temperature: Temperature can affect adsorption by altering the properties of the solute, surface, solvent as well astheir mutual interactions. Usually physical adsorption which is weak, decreases with increase in temperature probablydue to the increased solubility of the solute. The effect of temperature on chemisorption depends on the nature of thechemical reaction taking place at the surface. Chemisorption usually increases within a temperature range, anddecreases above the range.
6.5.2 SURFACTANT ADSORPTION AND ITS EFFECT ON DISPERSION PROPERTIES
6.5.2.1 In Aqueous Media
Dispersion properties can be modified by adsorption of surfactants at the solid–liquid interface. Surfactant adsorption can alterthe dispersion properties by changing the van der Waals attraction, electrostatic repulsion, and the steric forces between theparticles as discussed earlier. The extent of the modification depends on the adsorption density (surface coverage), packing, andorientation of molecules at the interface, and the nature of charges on the molecule. Therefore, it is important to first discuss theadsorption process itself in terms of the dominant mechanisms and possible orientations.
6.5.2.1.1 Ionic SurfactantsA typical adsorption isotherm of charged surfactants on oppositely charged surfaces is shown in Figure 6.7 [29] where theadsorption of negatively charged sodium dodecyl sulfate (SDS) on positively charged alumina in shown. This isotherm ischaracterized by four regions, attributed to four different dominant mechanisms being operative in each region. Mechanismsinvolved in these regions may be viewed as follows:
. Region I, which has a slope of unity under constant ionic strength conditions, is characterized by the existence ofelectrostatic interactions between the ionic surfactant and the oppositely charged solid surface.
. Region II is marked by a conspicuous increase in adsorption which is attributed to the onset of surfactant aggregationat the surface through lateral interaction between hydrocarbon chains. This phenomenon is referred to as hemimicelle
10−510−14
10−13
10−12
10−11
10−10
10−9
10−4
Residual dodecylsulfate (mol/L)
SDS/aluminaO.I M NaCl. pH 6.5
CMCIII
II
IHMC
IV
Dod
ecyl
sulfa
te a
dsor
ptio
n (m
ol/c
m2 )
10−3 10−2
FIGURE 6.7 Adsorption isotherm of SDS on alumina at pH 6.5.
Birdi/Handbook of Surface and Colloid Chemistry 7327_C006 Final Proof page 168 8.10.2008 9:12pm Compositor Name: VAmoudavally
168 Handbook of Surface and Colloid Chemistry
© 2009 by Taylor & Francis Group, LLC

formation [24,30]. Such colloidal aggregates formed on the surface are referred to as solloids (surface colloids). In thecase of simple ionic surfactants, such aggregates have also been called hemimicelles, admicelles, and surfactantself-assemblies [31].
. Region III shows a marked decrease in the slope of the isotherm and this is ascribed to the increasing electrostatichindrance to the surfactant adsorption following interfacial charge reversal caused by the adsorption of the chargedspecies in region III and beyond; both the adsorbent species and the adsorbate are similarly charged.
. Region IV and the plateau in it correspond to the maximum surface coverage as determined by micelle formation inthe bulk or monolayer coverage whichever is attained at the lowest surfactant concentration; further increase insurfactant concentration does not alter the adsorption density. A schematic representation of adsorption by lateralinteractions is given in Figure 6.8.
Figure 6.9 shows the variation in electrophoretic mobility of alumina as a function of the dodecyl sulfonate concentration. It canbe seen that the electrophoretic mobility changes sign and then increases with surfactant concentration. This suggests that thedispersions should be electrostatically stabilized at high surfactant concentrations. However, measurements of particle hydro-phobicity by bubble pickup showed an initial increase in particle hydrophobicity followed by a decrease at higher surfactantloadings [32]. This can be explained by examining Figure 6.8 where the surface is shown to be rendered hydrophilic at highersurfactant concentrations by adsorption of a second layer of surfactant with reverse orientation. Also the particles continue toaggregate even after the system has undergone charge reversal and this is attributed to the fact that it may be possible for thepartially covered surfaces to be bridged by the adsorbed surfactant species.
6.5.2.1.2 Nonionic SurfactantsThe adsorption of ethoxylated alcohol on silica [33] displays an isotherm similar to that for SDS on alumina (Figure 6.10).However, the absence of electrostatic repulsion between the adsorbed nonionic species results in an exceedingly high slope forthe hemimicellar region. Adsorption of these surfactants was found to depend on the degree of ethoxylation as well as the alkylchain length [34] (Figures 6.11 and 6.12). At constant chain length, the extent of adsorption at low concentrations was found tobe greater for surfactants with higher degree of ethoxylation. However, the plateau adsorption is higher for the surfactants withlower degree of ethoxylation. A linear relationship is obtained when the parking area at plateau adsorption is plotted againstthe ethoxylation number. This yields a parking area per –OCH2CH2 segment of 9.2 Å2 suggesting direct adsorption of theethylene oxide chains on the silica surface. On the other hand, the alkyl chain length only affects the onset of plateau adsorptionwhich is in line with the decrease in critical micelle concentration (cmc) with increase in hydrocarbon chain length. Based onthese observations hydrogen bonding is proposed to be the initial driving force for adsorption and the higher uptake of surfactantswith higher EO number, at low concentrations is clearly due to the cumulative hydrogen bonding interactions of the EO chainswith the hydroxylated silica surface. However at higher concentrations, hydrophobic chain-chain interactions become moresignificant as evidenced by the progressive increase in slope of the adsorption isotherm with decrease in EO number (the smallerthe EO number the lesser is the steric hindrance due to the ethoxyl groups which promotes chain–chain interaction).
The effect of adsorption density and surfactant structure on the hydrophobicity of silica is shown in Figure 6.13 [34]. In theabsence on any adsorbed surfactant, silica is hydrophilic and its hydrophobicity increases with increase in the adsorption ofC8EO10. In the case of the higher ethoxyl chain length C8EO40, the hydrophobicity decreases at higher surface coverages and
+++
+ + + + +− −−
+
+
IV
III
II
+ + + +
+ + +
+ + ++++
+ + +
++
+++
+++++
−−−
−
−−
− − − − − −
− − − −−−−−
−−−−
−−
−
−−− −
−−−−
FIGURE 6.8 Schematic representation of the correlation of surface charge and the growth of aggregate.
Birdi/Handbook of Surface and Colloid Chemistry 7327_C006 Final Proof page 169 8.10.2008 9:12pm Compositor Name: VAmoudavally
Colloid Systems and Interfaces Stability of Dispersions through Polymer and Surfactant Adsorption 169
© 2009 by Taylor & Francis Group, LLC

10−4
Equilibrium concentration (mol/L)
Am
ount
ads
orbe
d (m
ol/c
m2 )
Adsorption density
of a monolayer120
Settling index
Mobility
pH 7.2
Ionic strength 2�10−3 N
10−510−13
10−12
100
10.0
Ele
ctro
phor
etic
mob
ility
(µm
/s p
er v
/cm
)
Set
tling
inde
x, r
elat
ive
chan
ge o
f int
ensi
ty
1.0
0.1 +5.5
+5
+4
+3
+2
+1
0
−1
−2
−3
10−11
10−10
10−3
FIGURE 6.9 Variation in the electrophoretic mobility of alumina panicles with SDS concentration.
10−6
10−13
10−12
10−11
10−10
10−9
10−5 10−4 10−3
Residual alcohol concentration (kmol/m3)
C12H25–(OC2H4)8–OH/silica
T = 50�C
pH = 6.9
I = 0.03 M NaCl
Alc
ohol
ads
orpt
ion
(mol
/cm
2 )
10−2
FIGURE 6.10 Adsorption of alkylaryl ethoxylated alcohol (Cl2EO8) on silica.
Birdi/Handbook of Surface and Colloid Chemistry 7327_C006 Final Proof page 170 8.10.2008 9:12pm Compositor Name: VAmoudavally
170 Handbook of Surface and Colloid Chemistry
© 2009 by Taylor & Francis Group, LLC

the original surface coverage is restored when plateau adsorption is reached. The observed changes in hydrophobicity areexplained in terms of conformational changes of the hydrocarbon chains of the adsorbed surfactant molecules at thesilica=liquid interface. At low adsorption densities, the hydrocarbon chains are most likely lying flat on the surface providingmaximum coverage with hydrocarbon chains and thereby rendering the surface hydrophobic. As adsorption density increases,however, the flatly adsorbed hydrocarbon chains will be pushed out by the adsorbing ethylene oxide chains and hence thesurface coverage by the hydrocarbon chains is reduced. This explains the decrease in hydrophobicity at higher adsorption forC8EO40 and at plateau adsorption the surface is covered least by hydrocarbon chains and hence the hydrophilicity of silica isrestored. The possibility of bilayer adsorption being responsible for the restoration of hydrophilicity is precluded by the fact thatin this case no surface aggregation occurs due to steric hindrance. However for the C8EO10, the higher adsorption density andthe higher aggregation at the interface (which causes hydrophobic patches on the surface) will offset the effect of anyconformational changes in the hydrocarbon chains and leads to maximum hydrophobicity at plateau adsorption. In the caseof surfactant mixtures, for example, both SDS and C12EO8 adsorb on kaolinite by themselves. Adsorption of C12EO8 onkaolinite is influenced by the presence of anionic SDS. The plateau adsorption in all cases is higher from its mixtures of SDS
10−610−12
10−11
10−10
10−9
10−5 10−4
Residual alcohol concentration (kmol/m3)
C9H19–C6H4–(OC2H4)m–OH/silica
T = 23�C–27�CpH = 6.8–7.5S/L = 0.2
I = 0
Alc
ohol
ads
orpt
ion
(mol
/cm
2 )
10−3 10−2
m = 10m = 20m = 40
FIGURE 6.11 Adsorption density of nonylphenoxyethoxylated alcohols on silica.
1E−51E−61E−8
1E−7
1E−6
1E−5CnH2n+1–C6H4–(OC2H4)10–OH/silica
T = 23�C–27�CpH = 7.0–7.6S/L = 0.2I = 0
1E−4
n = 8
n = 9
n = 12
Residual alcohol concentration (mol/L)
Alc
ohol
ads
orpt
ion
(mol
/m2 )
1E−3 0.01
FIGURE 6.12 Adsorption density of EO10 alcohols of different chain lengths on silica.
Birdi/Handbook of Surface and Colloid Chemistry 7327_C006 Final Proof page 171 8.10.2008 9:12pm Compositor Name: VAmoudavally
Colloid Systems and Interfaces Stability of Dispersions through Polymer and Surfactant Adsorption 171
© 2009 by Taylor & Francis Group, LLC

than in its absence [35]. These higher plateau adsorption values are due to additional adsorption of C12EO8 with reverseorientation. At low concentrations, the chain–chain interactions between the adjacently adsorbed SDS and C12EO8 moleculeswill provide additional energy gain for the adsorption process. These hydrophobic interactions at the interface will result in theformation of the hydrophobic microdomains into which the hydrocarbon chains of additional C12EO8 molecules can getincorporated as a second layer. This is schematically shown in Figure 6.14 [35]. The evolution of such an adsorbed layer clearlychanges the wetting behavior of the particle surface as indicated by the skin flotation tests. This shows a sharp decrease in theflotation of kaolinite with increase in the adsorption of the nonionic surfactant. Mixed surfactant adsorption also causesstabilization in these dispersions. The settling rate is dramatically reduced in this case without significant alterations in zetapotential. The observed stability is attributed to the reversed adsorption layer, with the protruding ethylene oxide chainsproviding steric repulsion to the approaching particles.
6.5.2.1.3 Flocculation by Phase SeparationPhase separation of polymers and surfactants has been demonstrated as a means to control solid=liquid dispersion. It has beenshown that partially water-miscible surface active solvents, N-alkyl-2-pyrrolidone, can effectively control the stability ofgraphite aqueous dispersion [36]. As shown in Figure 6.15, graphite particles that are dispersed via electrostatic repulsion canbe successfully flocculated by octyl pyrrolidone. Extremely rapid flocculation occurs at 2.0 wt%. octyl pyrrolidone. Furtherincrease in pyrrolidone concentration decreases the settling rate, suggesting that the graphite particles are restabilized. The othersignificant finding is that, at optimum pyrrolidone concentration, all the graphite particles form a single large floc, and thevolume of the sediment shows the graphite as packing very closely.
100
80
60
40
20
010−6 10−5 10−4
Residual alcohol concentration (kmol/m3)
Hyd
roph
obic
ity (
%)
10−3
CS fEO40
CS fEO10
10−2
FIGURE 6.13 Change in hydrophobicity of silica upon adsorption of nonionic surfactant.
+ + +
− − −
(a) (b) (c)
FIGURE 6.14 Schematic presentation of the adsorption mechanisms for SDS=C12EO8 mixtures on kaolinite.
Birdi/Handbook of Surface and Colloid Chemistry 7327_C006 Final Proof page 172 8.10.2008 9:12pm Compositor Name: VAmoudavally
172 Handbook of Surface and Colloid Chemistry
© 2009 by Taylor & Francis Group, LLC

This flocculation is proposed to be due to strong adsorption at solid=liquid interface (particle surface) due to the phaseseparation forming regions or patches rich in pyrrolidone. It is known that longer chain N-alkyl-2-pyrrolidones exhibit lowerconsolute temperature (LCT), which means that once when sufficient amount of pyrrolidone is adsorbed at solid=liquidinterface, the conditions for phase separation can be satisfied. Consecutively, particles aggregate to minimize the total freeenergy, resulting in the strong flocculation (Figure 6.16)
The phase separation flocculation depends strongly on the temperature. Excellent flocculation occurred when the concen-tration exceeded the maximum miscibility at temperatures higher than the LCT. The flocculation was reversible and theparticles were restabilized at temperatures bellow the LCT. Chain length of the alkyl group has a similar effect: the longer thealkyl chain, the lower is the concentration at which phase separation occurs. Such effect is clearly illustrated in Figure 6.17.
6.5.2.2 In Organic Media
Adsorption of surfactants from nonaqueous media has been widely employed to disperse hydrophilic solids in organic liquids.The main goal of most of these applications is to achieve uniform and complete coverage of the surface with the surfactant. Fora majority of systems involving adsorption in nonpolar media, a maximum monolayer coverage has been observed. Adsorptionfrom organic solutions usually involves physical forces and can be described by the following exchange process:
Bsurf þ Asol ¼ Asurf þ Bsol (6:24)
whereAsol and Bsol are the respective adsorbate and solvent molecules in solutionAsurf and Bsurf are the respective adsorbate and solvent molecules on the surface
00
20
40
60
80
100
120
140
160
20 40 60
Pyrrolidone concentration (%)
Set
tling
rat
e (c
m/m
in)
80 100
FIGURE 6.15 Flocculation of graphite with octyl pyrrolidone.
20
40
80
120
160
4 6
Carbon chain length of N-alkyl pyrrolidone
Set
tling
rat
e (c
m/m
in)
8
2 wt%
5 wt%
10 12
FIGURE 6.16 Effect of alkyl chain length on flocculation of graphite with pyrrolidone.
Birdi/Handbook of Surface and Colloid Chemistry 7327_C006 Final Proof page 173 8.10.2008 9:12pm Compositor Name: VAmoudavally
Colloid Systems and Interfaces Stability of Dispersions through Polymer and Surfactant Adsorption 173
© 2009 by Taylor & Francis Group, LLC

The adsorption process according to the above scheme can usually be described by the Langmuir adsorption isotherm:
GA ¼ KadsXA,s
1þ KadsXA,s(6:25)
whereGA is the surface concentrationXA is the mole fraction of the adsorbate in solutionKads is the equilibrium constant for the adsorption
Several other modified Langmuirian equations have been proposed for measured adsorption data taking into account hetero-geneities of the adsorbent [37,38].
In nonpolar media due to the low ionization of the solute species, electrostatic attractive or repulsive forces can be ruled outas a major mechanism for adsorption. However, polar interactions have to be considered especially when polar surfaces such asoxides are involved. Recent work has shown acid–base interactions between the surface species and the solute molecules to beresponsible for adsorption in nonaqueous media. Fowkes [39] has suggested that the interaction between a solid surface and anuncharged adsorbate can be divided into two parts: dispersive interactions and polar interactions. The dispersive interactions aredue to the fluctuating dipole moments created by the movement of electrons in any atom or molecule and thus occur between allatoms and molecules. Polar interactions refer to specific interactions between hydrophilic surface groups and functional groupsin the adsorbate molecules.
6.5.2.2.1 Oxide SurfacesFigure 6.18 shows the adsorption isotherms of aerosol-OT (AOT) on alumina and silica from cyclohexane [40]. It can be seenthat the anionic surfactant has a greater affinity for the basic oxide than for the acidic oxide. The situation is reversed in the caseof the adsorption of the cationic surfactant dimethyl dodecylamine (DDA). DDA adsorbs more on acidic silica than on alumina(Figure 6.19). Calculations based on a plateau adsorption value of about 3� 10�6 mol=m2 on alumina give a parking area ofabout 0.55 nm2 for the AOT molecule. This is in good agreement with the published values for AOT parking areas at thewater=xylene and water=isooctane [41] interfaces suggesting that it adsorbs at the alumina–cyclohexane interface as amonolayer in an orientation perpendicular to the adsorbent with the hydrocarbon chain extending into the solution. Similarcalculations based on the plateau adsorption for the cationic surfactant give a parking area of 1.6 nm2 per molecule which ismuch less than the area occupied by a flatly adsorbing DDA molecule (ffi4 nm2) suggesting that this also adsorbs perpendicularto the adsorbent. Figure 6.18 also shows the adsorption of AOT on dehydroxylated alumina. Dehydroxylation, in this case, isachieved by heating the alumina at 9008C for 48 h and verified by observing the disappearance of the OH vibration bands at3800 cm�1 from the infrared spectrum of the alumina sample. Dehydroxylation increases the acidity of the surface and hencereduces the adsorption of the anionic AOT. It is clear from these results that AOT adsorbs through interactions with thehydroxyl groups on the oxide surface. These results also suggest that for a given surfactant the relative acidity of the oxidesurface is one of the major factors that determine the extent of interaction. From the fact that both anionic and cationicsurfactants adsorb on alumina and silica, we infer that electrostatic forces do not play a major role in this adsorption.
Figure 6.20 shows the settling rates of alumina suspensions as a function of surfactant adsorption [42]. It can be observedthat the suspensions are stabilized by the adsorption of the anionic, cationic and nonionic surfactants (although to differentextent) and the maximum stability corresponds to the onset of the plateau in the adsorption isotherm. The adsorption, as
Flocculatedparticles settledfrom aqueous
medium
Stabilizedparticles inpyrrolidone
medium
Pyrrolidone adsorbs onparticles above LCT
Individual stableparticles in water
FIGURE 6.17 Schematic representation of hypothesized phase separation flocculation mechanism.
Birdi/Handbook of Surface and Colloid Chemistry 7327_C006 Final Proof page 174 8.10.2008 9:12pm Compositor Name: VAmoudavally
174 Handbook of Surface and Colloid Chemistry
© 2009 by Taylor & Francis Group, LLC

discussed earlier, takes place with the polar group of the surfactant interacting with the surface hydroxyls and the hydrocarbontails of the amphipathic surfactant molecules sticking out into the solvent phase. Thus the stability produced by surfactantadsorption can be attributed to a hydrophobic modification of the surface, which disperses well in the nonpolar liquids.
6.5.2.2.2 Hydrophobic Surfaces (Graphite)The adsorption isotherm of AOT on graphite from cyclohexane follows a very interesting pattern as shown in Figure 6.21[43]. The adsorption increases sharply in the initial part suggesting high affinity of the surfactant for the solid at lowconcentrations. The adsorption then appears to reach a plateau and calculations based on apparent monolayer coverage atthis level yields a parking area of approximately 1.03 nm2=AOT molecule. This molecular parking area corresponds to anAOT molecule adsorbing flatly at the solid–liquid interface. At higher AOT concentrations, above 10�2 mol=dm3, there isa further sharp increase in the adsorbed amount and this reaches to about five times the initial plateau value at about
4
2
Ads
orpt
ion
dens
ity (
� 1
06 m
ol/m
2 )
00 10 20
Residual concentration (� 103 mol/L)30
FIGURE 6.18 Adsorption isotherm of AOT on different solids from cyclobexane.
00
1
2
3
4
5
6
5 10
Alumina
Silica
15
Residual concentration (� 106/mol/L)
Ads
orpt
ion
dens
ity (
� 1
06 /m
ol/m
2 )
20 25 30 35
FIGURE 6.19 Adsorption isotherm of cationic DDA on different solids.
Birdi/Handbook of Surface and Colloid Chemistry 7327_C006 Final Proof page 175 8.10.2008 9:12pm Compositor Name: VAmoudavally
Colloid Systems and Interfaces Stability of Dispersions through Polymer and Surfactant Adsorption 175
© 2009 by Taylor & Francis Group, LLC

3� 10�2 mol=dm3. It is interesting to note that this sharp increase occurs above the cmc of AOT (1� 10�3 mol=dm3) althoughit does not coincide with the onset of micellization.
The settling behavior of these dispersions as a function of the adsorbed AOT amount is also very interesting (Figure 6.22).Settling rate increases sharply first and then decreases as sharply suggesting restabilization. At low surface coverages, thepolar head group of the flatly adsorbing AOT is exposed to the solvent with which it is not compatible. In such a case, theAOT molecules, as shown in Figure 6.23a, can form interparticle aggregates that would effectively create a polar micro-domain to shield the head groups from the solvent. Such an interparticle aggregation can account for the increased settling rate.As the AOT concentration is increased, the adsorbed molecules are proposed to form aggregates at the interface as shown inFigure 6.23b. This leads to the sharp increase in the adsorption density as well as the decrease in settling rate due to thedisappearance of the interparticle aggregation observed at low surface coverages. Formation of such reverse hemimicelle-likeaggregates at the interface have been reported earlier for the adsorption of 1-decanol on graphitized carbon black fromnonpolar solvents [44].
3
2
1
00 5 10 15 20 25 30
0
500
1000
AOTDDAC8EO4
Residual concentration � 103 M/l
Set
ting
rate
� 1
06 ,m
/s
Ads
orpl
ion
dens
ity �
106,
mol
/m2
1500
2000
FIGURE 6.20 Settling rate variation of alumina suspensions upon adsorption of different surfactants in organic media.
00
1
2
3
4
5
5 10 15 20
Residual concentration (� 103, mol/L)
Ads
orpt
ion
dens
ity (
�10
6 , m
ol/m
2 )
25 30 35
FIGURE 6.21 Adsorption of AOT on graphite from cyclohexane.
Birdi/Handbook of Surface and Colloid Chemistry 7327_C006 Final Proof page 176 8.10.2008 9:12pm Compositor Name: VAmoudavally
176 Handbook of Surface and Colloid Chemistry
© 2009 by Taylor & Francis Group, LLC

6.5.2.2.3 Effect of Water on Dispersion Stability of AluminaFigure 6.24 shows the effect of water on the stability of alumina suspensions, which have been dispersed in cyclohexane by theadsorption of a monolayer of AOT [43]. As the water content in the system increases, the suspension goes through a series offlocculated, stabilized, and flocculated stages. In an extremely dry state, the dispersions flocculate rapidly and the additionof trace amounts of water stabilizes the suspensions quite significantly. Thereafter the suspensions remain stable over a range ofwater concentration and then flocculate very rapidly at higher water concentrations. The concentration of water at which thesuspension reflocculates correlates well with the solubility of water in the bulk solution. Surface charge measurements madeusing the electrokinetic sonic amplitude (ESA) system (Figure 6.25) shows clearly that addition of trace amounts of waterinduces a significant amount of charge at the surface [43]. This observation along with that of the drastic increase ofconductivity of the dispersions (also shown in Figure 6.25) upon small additions of water leads to the conclusion that thestabilization in this case is due to the water-induced ionization of the adsorbed surfactant layer and resultant electrostaticrepulsion among the particles. At higher water concentrations, there is a slight decrease in the surface charge as measured by theESA. But this decrease in surface charge cannot fully explain the massive flocculation observed in this case. From the wateradsorption isotherm also shown in Figure 6.24, it can be seen that the water adsorption increases sharply close to the onset ofthe flocculation. We further investigated this behavior using electron spin resonance (ESR) spectroscopy.
6.5.2.2.4 Electron Spin Resonance Studies on the Water-Induced-FlocculationIn these studies, the spectral response of 7-doxyl stearic acid which is coadsorbed along with the surfactant was monitored as afunction of water adsorption [43]. A 7-doxyl stearic acid adsorbed on the alumina surface gives a characteristic anisotropicspectrum which can be quantified using the order parameter that can be calculated from the spectral characteristics. The orderparameter varies between S¼ 1 (highly ordered, restricted) and S¼ 0 (highly random and mobile) and reflects the state of theenvironment in which the probe resides. The order parameter calculated in this case decreases with increase in water
00
30
60
90
120
150
1 2 3
Adsorption density (� 105, mol/m2)
Set
tling
rat
e (�
106 ,
m/s
)
4 5
FIGURE 6.22 Variation in settling rate of graphite suspensions in cyclohexane as a function of adsorption density.
(a) (b)
FIGURE 6.23 Schematic representation of adsorption of AOT on graphite at (a) low concentrations and (b) high concentrations.
Birdi/Handbook of Surface and Colloid Chemistry 7327_C006 Final Proof page 177 8.10.2008 9:12pm Compositor Name: VAmoudavally
Colloid Systems and Interfaces Stability of Dispersions through Polymer and Surfactant Adsorption 177
© 2009 by Taylor & Francis Group, LLC

concentration and levels off at approximately the same water concentration corresponding to the onset of flocculation (Figure6.26). These results indicate that there is a change in the structure of the adsorbed layer with the surfactant layer becoming morefluid and mobile as water adsorbs at the interface. This opens up the possibility for the water layers on different particles topenetrate across the surfactant layers and bridge the particles together during collisions thereby causing massive flocculation asobserved.
6.5.2.3 Modeling the Sorption of Surfactant Stabilizers on Solids
Adsorption, which governs the stability of suspensions, can be described as preferential partitioning of the solute molecules atthe solid–liquid interface and is determined by several factors including interfacial potential, covalent bonding of the adsorbatewith the surface species, hydrophobic interaction in the bulk and at the interface, desolvation of surface species and adsorbate,and solute solubility in the bulk media [45,46]. On a broader scale, one can consider these effects to essentially result from three
200
500
1000
1500
2000
2500
1 3 4 5
Wo ([H2O]/[AOT])
AOT = 22.5 mx
6 7 8 9 10 11 120
Set
tling
rat
e (�
106 ,
m/s
)
Wat
er a
dsor
ptio
n de
nsity
(�
106 ,
mol
/m2 )
5
10
15
20
25
30
FIGURE 6.24 Effect of water on the alumina suspension stability and the corresponding adsorption of water.
1000
00 2 4 6 8 10
Wo [H2O]/[AOT]
AOT = 25 �10−3 M/l
ES
A (
mP
a m
/V)
Con
duct
ivity
(pm
hos/
cm)
12−12
−10
−8
−5
−4
−2
0
2000
3000
4000
5000
6000
7000
8000
9000
FIGURE 6.25 ESA and conductivity of alumina suspensions with adsorbed AOT as a function of water concentration.
Birdi/Handbook of Surface and Colloid Chemistry 7327_C006 Final Proof page 178 8.10.2008 9:12pm Compositor Name: VAmoudavally
178 Handbook of Surface and Colloid Chemistry
© 2009 by Taylor & Francis Group, LLC

main interactions, namely the solute–solvent (takes into account solubility and other bulk interaction=association of the solute);solvent–solid (takes into account solvent displacement=competitive effects from the solid surface); and solute–solid (takes intoaccount hydrophobic, covalent, electrostatic, or hydrogen bonding of the solute with the solid). Attempts to develop apredictive model for surfactant adsorption should first address the issue of quantitatively describing these interactions. Theprimary step is therefore to identify suitable parameters characteristic of the fundamental solute=solid=solvent properties thatcan be used to quantitatively predict the extent of their mutual interactions. One of the fundamental properties used to describesolvent interactions is Hildebrand’s solubility parameter.
6.5.2.3.1 Concept of Interaction or Cohesion ParameterThe solubility parameter as defined by Hildebrand is a liquid-state property and in the strictest sense is applicable only tononpolar systems. To globally describe these parameters for solids as well, the term cohesion parameter as calculated fromenthalpies of vaporization or sublimation of solids is used. Specifically, Hansen’s modification differentiates both polar andhydrogen-bonding interactions among the molecules from the dispersion interactions and can be applied for polar substances aswell [47,48]. In the expanded cohesion parameter formulation, the energy of vaporization, DE, can be divided into interactionenergies for dispersion, induction, dipole orientation, and hydrogen bonding.
V2d ¼ (Eii)d þ (Eii)in þ (Eii)o þ (Eii)hb (6:26)
where V is the molar volume.A simplification of the Equation 6.26 leads to the three component Hansen interaction parameter:
d2t ¼ d2d þ d2p þ d2h (6:27)
wheredd is the same as the original Hildebrand solubility parameterdp and dh, are contributions from the polar and hydrogen bonding interactions, respectivelydt is the total interaction parameter
Clearly, this parameter is more justifiable for molecules that are polar and hydrogen-bonding type.On the basis of the work by Fowkes et al., it is considered that acid–base components are more important than polar and
hydrogen-bonding components [49]. This is mainly because in condensed phases, especially in aqueous media, the polarinteractions are governed by hydrogen donor and hydrogen acceptor (or Bronsted acids and Bronsted bases). Moreover, it wasshown that these electron donor and acceptor interactions are asymmetric in nature. Hence it is preferable to extend the conceptof polar and hydrogen bonding in terms of electron donor and electron acceptor or Lewis acid–base interactions [50].Beerbower, Martin, and Wu developed a four-component approach incorporating factors such as dispersion, orientation,acid, and base components. Further, Beerbower and Hill also developed the concept of cohesive energy ratio (CER) whichis used to investigate the influence of components on emulsion characteristics. CER is defined as follows:
CER ¼ CE of lipophile group of oil phase
CE of hydrophile group of aqueous phase(6:28)
0
0.70
0.80
Setting
Adsorption
0.90
1.00
5 10H2O/AOT molar ratio, wo
Ord
er p
aram
eter
, S15 20
FIGURE 6.26 Effect of water on the order parameter, S, calculated from the ESR spectra of 7-doxyl stearic acid co-adsorbed with AOT atthe alumina=cyclohexane in interface.
Birdi/Handbook of Surface and Colloid Chemistry 7327_C006 Final Proof page 179 8.10.2008 9:12pm Compositor Name: VAmoudavally
Colloid Systems and Interfaces Stability of Dispersions through Polymer and Surfactant Adsorption 179
© 2009 by Taylor & Francis Group, LLC

The structure of individual components decide their cohesive energy and hence CER and hence the stability of emulsion [51].The above components of the interaction parameter can be theoretically estimated and in some cases experimentallydetermined.
It is clear from the above discussion that these interaction=cohesion parameters can be useful in predicting interactionsamong various molecules in desired media. Since it has been successfully used to predict polymer solubility, it can be assumedthat it will work for surfactant–solvent systems as well for predicting the compatibility of the surfactant with the solvent andsolid or liquid particulates provided the interaction parameter involved can be estimated [Ref. 53].
6.5.2.3.2 Determination of Interaction Parameters [52]1. Solvents: The total interaction parameters as well as the component values for the various solvents used in the study
were obtained from the literature [54,55] and are given in Table 6.1.2. Surfactants: The interaction parameter values for the surfactants were estimated from its structural formula using molar
attraction constant values in the literature [50]. In this case, it was not possible to estimate the values of the threecomponents separately. The values calculated for different surfactants are shown in Table 6.2.
3. Solids: For the solids, an approach used earlier by Shareef et al. [56] to determine pigment–solvent interactionswas used. The stability=dispersibility of a solid in a solvent over a period of time is taken as a measure of itsinteraction with the solvent. The algorithm also known as the spherical volume of suspension algorithm involvesdetermination of the dispersibility of the solid in several solvents of known interaction parameters [57]. A three-dimensional weighted average of the interaction parameters of the solvents in which the solid disperses well is used tocalculate the interaction parameter component of the solid. The values calculated for different solids are shownin Table 6.3.
6.5.2.3.3 Modeling Adsorption Using Interaction ParametersThe first step for the development of the model is to define a relationship for estimating the extent of mutual interaction amongthe solute, solvent, and the solid. The expanded interaction cohesion parameter concept has been used earlier to describeadsorption phenomenon for chromatography application [55]. Mcguire and Suffet [58] developed the net adsorption energyconcept for describing the adsorption of trace organics from water on activated carbon. Similarly a generalized model forsurfactant adsorption is developed by considering first the simple algebraic difference between the interaction parameters asbeing proportional to the magnitude of their mutual interactions. The larger the absolute value of di� dj, the weaker is theinteraction between the two species. The complex interactions taking place during the adsorption are divided into threerelatively simple binary interactions:
1. Solid–solvent, characterized by jdsolid� dsolventj: Stronger the interaction between the solid and the solvent, more is thesolvent interference with adsorption of the solute. Hence a low value for this difference is detrimental to adsorption.Alternatively for good adsorption, this difference should be large.
2. Solute�solvent, characterized by jdsolute� dsolventj: Stronger the interaction between the solute and the solvent, lesseris the tendency of the solute to adsorb. As in the above case, large value of this difference is essential for significantadsorption.
3. Solid�solute, characterized by jdsolid� dsolutej: Stronger the interaction between these two species, more is theadsorption. Thus a small value of this difference is favorable for enhancing adsorption.
TABLE 6.3Some Scaling Law Prediction in the Semidilute Regime
Scaling Law
Property Good Solvent u-Solvent
c* � N�4=5 N�1=2
R2g � Nc�1=4 N
j � c�3=4 c�1
(P=T) � c9=4 c3
Notes: c, polymer concentration; c*, the polymer concentration at which the totalvolume of the chain just fills the available volume, whose value must becomparable to that in polymer coil; j, the correlation length or average mesh
size: it represents the mean distance between intersections of the trajectoriesof the polymer chains; P, osmotic pressure.
Birdi/Handbook of Surface and Colloid Chemistry 7327_C006 Final Proof page 180 8.10.2008 9:12pm Compositor Name: VAmoudavally
180 Handbook of Surface and Colloid Chemistry
© 2009 by Taylor & Francis Group, LLC

Thus,
Net adsorption ¼ f (jdsolid � dsolventj, jdsolute � dsolventj, jdsolid � dsolutej) (6:29)
These three binary interactions can be combined in several different ways. The simplest case is to take a linear combination ofthese terms as shown below:
X ¼ abs{A�jdsolid � dsolventj þ B�jdsolute � dsolventj � C�jdsolid � dsolutej} (6:30)
where A, B, and C are coefficients used to account for other potential interactions.It can be seen from the earlier discussion that for good adsorption this sum should be large, that is, larger the value of X, the
greater is the adsorption tendency. Conversely one can argue that a low value of X will favor surfactant partitioning into thebulk solvent. We refer the value X as deff, the effective interaction parameter in the remainder of this discussion.
6.5.2.3.4 Correlation with Experimental DataA series of surfactant adsorption=desorption data published previously [59,60] was used to test the validity of this approach.
. Case 1. AOT on alumina: Figure 6.27 shows desorption of AOT as a function of deff (A¼B¼C¼ 1) forAOT=alumina system. There is a systematic decrease in the desorption amount (i.e., there is higher adsorbed amount)with an increase in the value of deff.
. Case 2. AOT on silica: Figure 6.28 shows the variation of desorption for AOT=silica system, also showing asystematic decrease in desorption with increasing deff The trend observed in this plot is very similar to the one forAOT=alumina case.
In both these cases, electrostatic forces that may affect adsorption at least in the polar solvents are not considered. Theelectrostatic forces can be brought into this formulations by modifying the jdsolute� dsolventj term. If the solid and the surfacehave the same sign, that is, repulsion between them, the interaction term is scaled down by a factor less than 1 (C< 1) and if
AOT/alumina
0
20
40
60
80
100
Effective interaction parameter
0 5 10 15 20
% D
esor
ptio
nFIGURE 6.27 Variation of desorbed amount as a function of deff for the AOT=alumina system.
AOT/silica
0
10
20
30
40
50
60
70
80
90
100
0 5 10 15 20 25Effective interaction parameter
% D
esor
ptio
n
FIGURE 6.28 Variation of desorbed amount as a function of deff for the AOT=silica system.
Birdi/Handbook of Surface and Colloid Chemistry 7327_C006 Final Proof page 181 8.10.2008 9:12pm Compositor Name: VAmoudavally
Colloid Systems and Interfaces Stability of Dispersions through Polymer and Surfactant Adsorption 181
© 2009 by Taylor & Francis Group, LLC

they are oppositely charged it is scaled up by a factor greater than 1 (C> 1). The exact values of these factors may be relatedto the magnitude of the zeta potential under the adsorption conditions. Thus, in the case of silica the data point correspondingto desorption from water can be modified (because both silica and AOT are negatively charged here) and made to fit intoEquation 6.28.
. Case 3. AOT on graphite: Figure 6.29a shows the plot of desorbed amount as a function of deff for AOT=graphite case.Although showing a similar trend as in the previous two cases, the curve is quite different. For this system,hydrophobic interactions among the various species become an important factor for adsorption due to the hydrophobicnature of the solid substrate, graphite.
Hydrophobic interactions can be of two types: (1) between the solid and the solute and (2) among the adsorbed solutemolecules, that is, the lateral interactions similar to those leading to solloid formation. The following guidelines can be used tomodify Equation 6.27 to incorporate these effects. Hydrophobic forces will drive the surfactant to the interface and potentiallycause them to aggregate at the solid–liquid interface depending on the nature of the solvent. Moreover, presence of micelles insolution may help the surfactants to desorb from solid surface and solubility in the micelle. If the solvent and the surfactant arecompatible, that is, jdsolute� dsolventj is small, the hydrophobic forces will be dominated by other forces and the surfactant willtend to stay dispersed in the solvent. However, if the solid is hydrophobic or in certain parts of the adsorption isotherm wherelateral interactions are possible in the adsorbed layer then the term, jdsolute� dsolventj needs to be modified to make thehydrophobic effect dominant For this, the above term is scaled up by a factor> 1 (B> 1). Figure 6.29b shows the resultswhen A¼ 1, B¼ 1.4, C¼ 1, for AOT on graphite and this, as in the earlier cases, shows a systematic decrease in the desorbedamount with deff.
. Case 4. Sodium alkylsulfates on alumina: Figure 6.30 shows the plots for sodium decyl, dodecyl, and tetradecylsulfates using Equation 6.28 with A¼B¼C¼ 1. All these plots show a similar trend as before with desorptionamount decreasing with increasing value of deff.
Graphite
0
20
40
60
80
100
120
Effective interaction parameter
0 2 4 6 8 10 12
% D
esor
ptio
nAOT/graphite
0
20
40
60
80
100
Effective interaction parameter
0 5 10 15 20
% D
esor
ptio
n
(a) (b)
FIGURE 6.29 Variation of desorbed amount as a function of deff for the AOT=graphite system for (a) A¼B¼C¼ 1 and (b) A¼B¼ 1,C¼ 1.4.
0
20
40
60
80
100
0 5 10 15 20
Effective interaction parameter
% D
esor
ptio
n
NaC14SO3
NaC12SO3
NaC10SO3
Alumina/alkylsulfates
FIGURE 6.30 Variation of desorbed amount as a function of deff for the alkylsulfates=alumina system similar trend as before withdesorption amount decreasing with increasing value of deff.
Birdi/Handbook of Surface and Colloid Chemistry 7327_C006 Final Proof page 182 8.10.2008 9:12pm Compositor Name: VAmoudavally
182 Handbook of Surface and Colloid Chemistry
© 2009 by Taylor & Francis Group, LLC

From the results shown here for a variety of solute–solvent–solid systems, it is clear that deff as given by Equation 6.28 is aneffective parameter for prediction of adsorption behavior in polar and nonpolar liquids. Thus an equation of the form
deff ¼ abs{A�jdsolid � dsolventj þ B�jdsolute � dsolventj � C�jdsolid � dsolutej} (6:31)
is proposed for predicting adsorption=desorption of surfactants in various systems where A, B, and C are system-specificconstants. The following guidelines are suggested from a correlation of the present experimental data with this model.
. B> 1 for systems where hydrophobic interactions are expected to be significant for adsorption. For example,adsorption on a hydrophobic substrate or when phenomenon such as hemimicellization occurs.
. C< 1 for systems where the surface and solute are similarly charged.
. C> 1 for systems where the surface and solute are oppositely charged.
Other forms of equations that were tested are given below:
deff ¼ {jdsolid � dsolventj2 þ jdsolute � dsolventj2 � jdsolid � dsolutej2}1=2 (6:32)
deff ¼ {jd2solid � d2solventj1=2 þ jd2solute � d2solventj1=2 � jd2solid � d2solutej1=2} (6:33)
Figure 6.31a and b shows the plots for AOT on alumina using Equations 6.32 and 6.33. The plots show the same general trendas that in Figure 6.1 and suggest that alternate combinations of these terms may also be used to predict overall adsorptiontendency. Once we predict the adsorption=desorption of given surfactants on a given solid in a given solvent, we can predict thestability=dispersibility based on the nature of interacting species.
6.5.3 ADSORPTION OF POLYMERS AND EFFECT ON DISPERSION PROPERTIES
6.5.3.1 Theoretical Considerations on Polymer Adsorption
To understand the behavior of polymers at interfaces, it is essential to get a clear picture of their behavior in solution first.Modern polymer solution studies were pioneered by Flory [13,61]. Since then, there has been considerable effort to elucidatesolution behavior of polymers and many models have been proposed. The theoretical treatment of polymer adsorptioncharacteristics and conformation characteristics received considerable attention mainly because of the significant applications.
One parameter that is commonly used to specify the dimension of a linear polymer molecule is the root-mean-square (rms)end-to-end length. The simplest, and also the most primitive, model for a polymer molecule is the random flight chain, alsotermed the freely jointed chain. In this model, the bonds are represented by volumeless lines in space and there are norestrictions on the valency angles or on the rotations about bonds. The rms end-to-end length, h2
1=20 , can be represented as
h2 1=2
0 ¼ lN1=2 (6:34)
wherel is the step lengthN is the number of steps
AOT/alumina
0
20
40
60
80
100
0 5 10 15 20Effective interaction parameter
% D
esor
ptio
n
Effective interaction parameter
Alumina
0
20
40
60
80
100
0 5 10 15 20 25 30
% D
esor
ptio
n
(a) (b)
FIGURE 6.31 Variation of desorbed amount as a function of deff for the AOT=alumina system calculated using (a) Equation 6.15and (b) Equation 6.16.
Birdi/Handbook of Surface and Colloid Chemistry 7327_C006 Final Proof page 183 8.10.2008 9:12pm Compositor Name: VAmoudavally
Colloid Systems and Interfaces Stability of Dispersions through Polymer and Surfactant Adsorption 183
© 2009 by Taylor & Francis Group, LLC

The random flight chain has the simplest mathematical properties, but, unfortunately, also has the smallest degree ofstructural similarity to real polymers. A more complex model considering the fixed valency angle (t) and the restrictions of freerotation has been proposed as
h2 1=2
0 ¼ lN1=2 1� cos t
1þ cos t
� �1=2
df (6:35)
where df is the steric factor, which clearly also is a measure of the flexibility of the polymer chain (usually 1.5 � df � 2.5). Forfrequently used carbon backbone polymers, cos t¼�1=3 and df � 2.0; therefore, <h2>=<h2>0¼ 8.
Other parameters used as a measure for the dimension of a polymer molecule include rms radius of gyration (Rg),average span (<Sx>, the maximum extension averaged in all direction) and Hollingsworth radius (<RHoll>, the radius ofthe smallest sphere which contains all the segments of a chain). Their relationships, for a random coiled polymer chain, can besummarized as
Rg: Sxh i: h2 1=2
: RHollh i ¼ 16
� �1=2
: 0:92: 1:00: 1:14 (6:36)
As discussed by de Gennes [62], scaling law focuses attention on the exponents and refrains from the determination of anyprefactory constants, which are usually much more difficult to determine. Some predictions of scaling law theory for polymersof high molecular weight in both good solvents and u-solvents in the semi dilute regime are summarized in Table 6.3.
The structure of adsorbed polymer layers on specific substrates from given solvents is less understood than the properties ofpolymer solution. It has, for many years, been derived by the self-consist theory where each chain feels an average potentialwith a short range part and a long-range repulsive part proportional to the concentration profile [63–65]. de Gennes [66]constructed from scaling laws a completely different scheme which provided a better insight into the polymer adsorbed layersdespite the fact that it does not predict the numerical parameters of any governing formula. The two techniques (self-consistfield and scaling) complement each other and have provided considerable useful information for understanding the polymerbehavior at interfaces.
Compared to most cases dealt by the above researchers, the behavior of polyelectrolytes is more complex. One of the mostprominent differences is the occurrence of long-range electrostatic interactions, whereas in the case of uncharged polymers onlynearest-neighbor interactions play a role. Due to wide application of polyelectrolytes, some attempts have been made todescribe the adsorption of polyelectrolytes. Most theories have been developed by incorporating the electrostatic free energyinto the models for the uncharged polymers [67].
6.5.3.2 Basic Concepts of Adsorbed Polymer Conformations
The process of polymer adsorption is quite different in many aspects from that of small molecules, the latter having beenstudied extensively in the past. These differences in their adsorption characteristics arise in turn from the obvious flexibility ofthe larger polymer molecules, so that in addition to the usual adsorption factors considered such as the adsorbate–adsorbent,adsorbate–solvent, and adsorbent–solvent interactions, a major aspect to be understood is the conformation of polymermolecules at the interface and its role in dispersion. Polymers have a large number of functional groups, each of which canpotentially adsorb at the surface, whereas smaller molecules are mostly monofunctional.
The importance of adsorbed polymer conformation at interfaces was first recognized by Jenkel and Rumbach in 1951 [68].A model of adsorbed polymer conformation was proposed based on the observation that amount of polymer adsorbed per unitarea of the surface corresponds to a layer of more than 10 molecules thick. In that model, not all the segments of a polymer arein contact with the surface. As schematically shown in Figure 6.32, those segments which are in direct contact with the surface
Trains
Tail
Loops
FIGURE 6.32 Schematic representation of an adsorbed polymer chain at the solid–liquid interface.
Birdi/Handbook of Surface and Colloid Chemistry 7327_C006 Final Proof page 184 8.10.2008 9:12pm Compositor Name: VAmoudavally
184 Handbook of Surface and Colloid Chemistry
© 2009 by Taylor & Francis Group, LLC
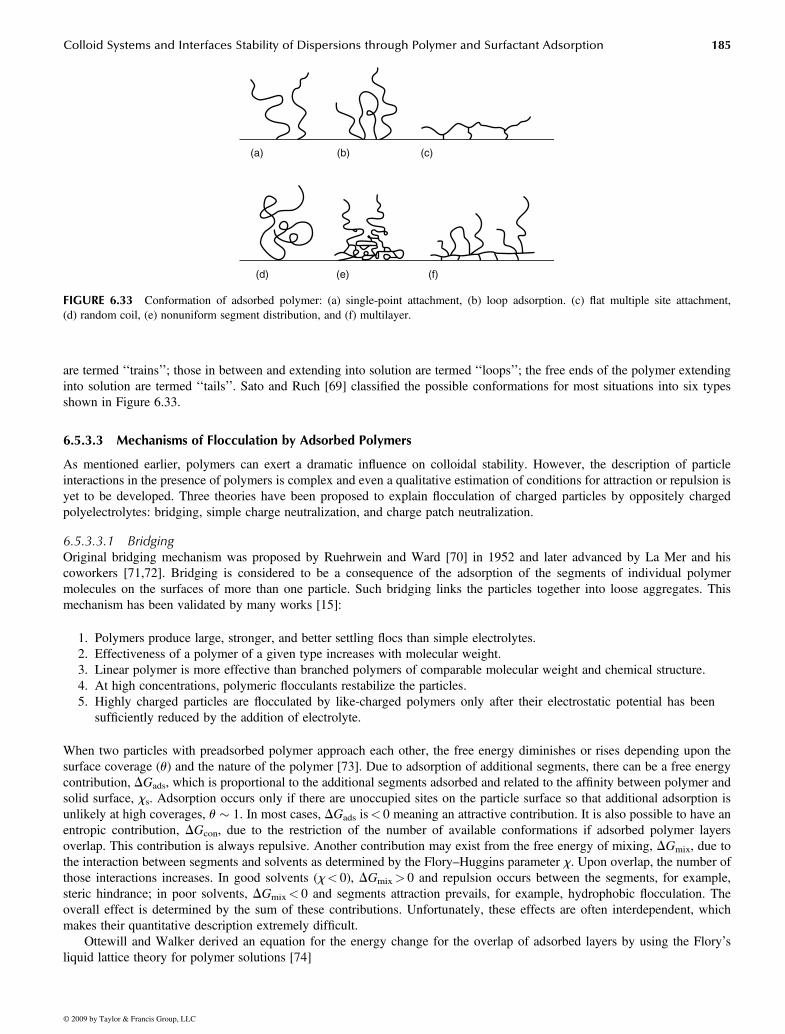
are termed ‘‘trains’’; those in between and extending into solution are termed ‘‘loops’’; the free ends of the polymer extendinginto solution are termed ‘‘tails’’. Sato and Ruch [69] classified the possible conformations for most situations into six typesshown in Figure 6.33.
6.5.3.3 Mechanisms of Flocculation by Adsorbed Polymers
As mentioned earlier, polymers can exert a dramatic influence on colloidal stability. However, the description of particleinteractions in the presence of polymers is complex and even a qualitative estimation of conditions for attraction or repulsion isyet to be developed. Three theories have been proposed to explain flocculation of charged particles by oppositely chargedpolyelectrolytes: bridging, simple charge neutralization, and charge patch neutralization.
6.5.3.3.1 BridgingOriginal bridging mechanism was proposed by Ruehrwein and Ward [70] in 1952 and later advanced by La Mer and hiscoworkers [71,72]. Bridging is considered to be a consequence of the adsorption of the segments of individual polymermolecules on the surfaces of more than one particle. Such bridging links the particles together into loose aggregates. Thismechanism has been validated by many works [15]:
1. Polymers produce large, stronger, and better settling flocs than simple electrolytes.2. Effectiveness of a polymer of a given type increases with molecular weight.3. Linear polymer is more effective than branched polymers of comparable molecular weight and chemical structure.4. At high concentrations, polymeric flocculants restabilize the particles.5. Highly charged particles are flocculated by like-charged polymers only after their electrostatic potential has been
sufficiently reduced by the addition of electrolyte.
When two particles with preadsorbed polymer approach each other, the free energy diminishes or rises depending upon thesurface coverage (u) and the nature of the polymer [73]. Due to adsorption of additional segments, there can be a free energycontribution, DGads, which is proportional to the additional segments adsorbed and related to the affinity between polymer andsolid surface, xs. Adsorption occurs only if there are unoccupied sites on the particle surface so that additional adsorption isunlikely at high coverages, u � 1. In most cases, DGads is< 0 meaning an attractive contribution. It is also possible to have anentropic contribution, DGcon, due to the restriction of the number of available conformations if adsorbed polymer layersoverlap. This contribution is always repulsive. Another contribution may exist from the free energy of mixing, DGmix, due tothe interaction between segments and solvents as determined by the Flory–Huggins parameter x. Upon overlap, the number ofthose interactions increases. In good solvents (x< 0), DGmix> 0 and repulsion occurs between the segments, for example,steric hindrance; in poor solvents, DGmix< 0 and segments attraction prevails, for example, hydrophobic flocculation. Theoverall effect is determined by the sum of these contributions. Unfortunately, these effects are often interdependent, whichmakes their quantitative description extremely difficult.
Ottewill and Walker derived an equation for the energy change for the overlap of adsorbed layers by using the Flory’sliquid lattice theory for polymer solutions [74]
(a) (b) (c)
(d) (e) (f)
FIGURE 6.33 Conformation of adsorbed polymer: (a) single-point attachment, (b) loop adsorption. (c) flat multiple site attachment,(d) random coil, (e) nonuniform segment distribution, and (f) multilayer.
Birdi/Handbook of Surface and Colloid Chemistry 7327_C006 Final Proof page 185 8.10.2008 9:12pm Compositor Name: VAmoudavally
Colloid Systems and Interfaces Stability of Dispersions through Polymer and Surfactant Adsorption 185
© 2009 by Taylor & Francis Group, LLC

Vr ¼ 4pkTc
3vp[f� K] [d� H=2]2[3r þ 2dþ H=2](6:37)
wherec is the concentration of material in the adsorbed layerv is the molecular volume of the solventp is the density of the adsorbatef and K are the entropy and enthalpy of mixing, respectively proposed by Floryd is the adsorbed layer thicknessH is the closest distance of approachr is the particle radius
LaMer [75,76] and others [77] have related the bridging efficiency factor to the fractional surface coverage of polymers (u).The original LaMer model and subsequently modified models can be generally described as
E ¼ f u(1� u) (6:38)
whereE is the bridging efficiency factorf is the constant (1< f< 2)
From Equation 6.38, it is clear that E will have a maximum when u is 0.5 corresponding to 50% particle surface coveragewith polymer. However, in practice, optimum polymer dosages are often found at much lower u value.
Other than the classical bridging, for which a polymer chain must adsorb on more than two particles, Somasundaran et al.[12] postulated that bridging may occur between two particles by two separate adsorbed polymer molecules. Similar to thehydrophobic interaction, when surface-active polymers adsorb on particles via terminal-hydrophilic groups with hydrophobicgroups extending into the bulk solution, bridging may occur through lateral interactions between the hydrophobic groupsextending from particles to reduce the surface energy of hydrophobic groups.
6.5.3.3.2 Simple Charge Neutralization and Charge Patch NeutralizationOppositely charged polyelectrolytes reduce the particle surface charge density such that particles may approach each othersufficiently closely so that the attractive van der Waals force becomes effective. Flocculation caused by this mechanism shouldnot be sensitive to the molecular weight of the polymer.
Gregory [78] proposed another flocculation mechanism, charge patch neutralization. There is no need for a one-to-onecorrespondence between charges on the surface and the adsorbed polymer. If the charge density of polymer in its adsorbed stateis higher than that of the surface, then patches of positively and negatively charged sites will appear on the particles. Thus,although the particles may have overall neutrality or even excess charge of the same sign, there exists the possibility ofaggregation due to the attraction of oppositely charged patches on different particles. Charge neutralization (simple or patch) isoften the mechanism for flocculation by low-molecular-weight polyelectrolytes.
6.5.3.4 Role of Polymer Conformation in Flocculation and Stabilization
Bridging can occur only if the extent of adsorbed polymer chain from the particle surface into medium is greater than theminimum particle approach distance over which the interparticle repulsion acts. This distance is of the order of the sum of thethickness of the electrostatic double layers of the approaching particles. The spatial extension of polymer molecules dependsnot only on molecular weights of the polymer but also, significantly, on the conformation of the adsorbed polymer molecules.To meet the requirement of bridging, one can either reduce the thickness of electrostatic double layers or use polymers of highmolecular weight and extended conformation. An increase in ionic strength reduces the thickness of the double layers;however, the extension of the polyelectrolyte is reduced at the same time because of potential screening effect.
Apparently, polymer conformation plays an important role in flocculation caused predominantly by bridging. This effect ofpolymer conformation on the dispersion properties has been confirmed by many observations where significantly differentdispersion behavior is obtained with identical adsorption density and electrostatic property. There have been substantial effortsboth theoretically and experimentally to develop relationships between the stability and the polymer conformation andguidelines for the optimum conformation to achieve desired dispersion properties. Despite these efforts, the progress is meagermainly because of the absence of reliable techniques and the complexity of systems. Tjipangandjara and Somasundaran [79,80]showed conformation of adsorbed polyacrylic acid (PAA) to have significant effect on the stability of alumina dispersions. Anexperiment involving manipulation of polymer conformation in solution and at interface by shifting pH up and down wasdesigned with polymer conformation monitored by pyrene fluorescence emission technique. They found that the conformation
Birdi/Handbook of Surface and Colloid Chemistry 7327_C006 Final Proof page 186 8.10.2008 9:12pm Compositor Name: VAmoudavally
186 Handbook of Surface and Colloid Chemistry
© 2009 by Taylor & Francis Group, LLC

of adsorbed polymer can be altered by changing the solution conditions, and depending upon the adsorption density anddirection of pH shift, significant enhancement in flocculation or stabilization can be obtained.
Another important effect which is critical but often ignored is the timescale involved in flocculation processes. The kineticsof polymer diffusion to interface, adsorption, conformation, and reconformation, and particle collision are quite different fordifferent particle=polymer=solvent systems [81]. The polymer diffusion and particle collision rate can be controlled by theintensity and the time of agitation applied. Unfortunately, there is very little information on the rate at which adsorbed polymerchains attain their equilibrium conformation. The only information available is that of polymer adsorption on a flat surface [82].A two-step process was observed, in which the polymer first adsorbs and then undergoes a very slow reconformation, whichmay take hours. This information is not very useful for the flocculation of suspensions. Optimum flocculation is usuallyobtained at a much lower surface coverage instead of the saturation condition used in the above study. Nevertheless, ofimportance is the relative rate of the reconformation process compared to the particle collision, whether particles collide beforeor after an equilibrium conformation state of the adsorbed polymers is achieved. This effect is manifested in the case ofconcentrated suspensions in which there is a high particle collision rate. In most practical polymeric flocculations, it is veryunlikely that an equilibrium conformation is achieved.
6.5.3.5 Stability of Dispersion in the Presence of Polymers
Besides the electrostatic forces, the suspension stability in the presence of polymers and surfactants is controlled by severalother forces [83]. In the case of flocculation, a bridging theory by adsorbed polymers and surfactants is an accepted mechanismin addition to charge neutralization. On the other hand, in the case of suspension stabilization, steric interactions by adsorbedpolymer or surfactant layer on particle surfaces become dominant [84]. In addition to adsorption density of the dispersant,conformation and orientation of the polymers and surfactants adsorbed on the particles will play a major role in controlling thesuspension stability [15]. However, the conformation requirements for flocculation or dispersion are not known mainly becauseof the complex nature of adsorption and the lack of reliable techniques to monitor conformation in situ. Techniques usednormally to determine the polymer adsorbed layer thickness (e.g., ellipsometry, viscometry, etc.) do not give sufficientinformation and, more important, cannot work in situ. In contrast, fluorescence and ESR spectroscopy techniques are powerfultools for probing in situ the microstructure orientation and conformation of adsorbed polymer and surfactant layers [85]. Thesetechniques, used along with classical ones used to determine suspension properties, such as settling rate, supernatant turbidity,zeta potential, and adsorption density, can provide required information for developing predictive capabilities on the conform-ation criteria and schemes to manipulate the stability of suspensions.
6.5.3.5.1 Fluorescence Spectroscopy for Polymer Conformation and Association MeasurementPyrene has been used widely as a photophysical probe because of its long fluorescence lifetime and a great tendency forexcimer formation. Emission characteristics of pyrene molecules depend upon the nature of the solvent. The ratio of relativeintensities of the Ist (373 nm) and IIIrd (383 nm) peaks, IIII=II, in a pyrene emission spectrum decreases as the polarity of thesolvent increases. This ratio has been used to estimate polarities of solvents as well as surfactant micelles and aggregates inaqueous solutions [86]. Here, we show the use of pyrene fluorescence spectroscopy for determination of the association ofhydrophobically modified polymers in bulk solution as well as at the solid–liquid interface. These types of polymers have beendeveloped recently to increase the viscosity and the elasticity of solutions because they undergo interesting intramolecular andintermolecular associations [87]. We have found the use of hydrophobically modified polymers for controlling the stability ofpolar and nonpolar suspensions to be promising because of their unique structure, which can provide either flocculation byintermolecular aggregation or stabilization by steric hindrance, depending on the orientation at the solid–liquid interface, whichis dependent on the nature of the particles and the extent of adsorption [88].
Excimer fluorescence of pyrene attached to synthetic polymer chains can be used to study polymer conformation in solutionand on particles surface. In this case, fluorescence spectroscopy involves the measurement of the emission intensity ofmonomer (Im observed at 375 nm) and excimer (Ie at 480 nm). The ratio of Ie to Im is related to coiling=stretching behaviorof a labeled polymer and we have called it the coiling index [89]. In the absence of intermolecular interactions (the polymerconcentration used is usually below this limit), a high value of Ie=Im can be considered to be the result of a coiled conformationwhile a low value is associated with a stretched one.
In a recent study, the necessity for understanding the effects that molecular probes (e.g., pyrene) can have on colloidalsystem has been clearly illustrated [90]. Mixtures of pyrene-labeled and -unlabeled polyethylene oxide (PEO) were adsorbed onsilica and the properties of the resulting suspension were monitored. Settling rate results (Figure 6.34) clearly demonstrated thatpyrene-labeled PEO has a marked effect on the flocculation of silica suspension. It has been shown that even relatively smallamounts of labeled polymer, when mixed with an unlabeled one, can dramatically affect the behavior of their mixtures. On theother hand, it has also been shown that when labeled polymer was used in sufficiently low amounts (<3%), the mixturebehavior does not differ from that due to the unlabeled polymer. These findings once again underscore the fact that whilecertain measurement techniques are invaluable for investigating colloidal phenomena, potential effects caused by introductionof various molecular probes into the system should always be noted.
Birdi/Handbook of Surface and Colloid Chemistry 7327_C006 Final Proof page 187 8.10.2008 9:12pm Compositor Name: VAmoudavally
Colloid Systems and Interfaces Stability of Dispersions through Polymer and Surfactant Adsorption 187
© 2009 by Taylor & Francis Group, LLC

Recent developments of some new high-performance composite materials, cosmetics, paints, and microelectronic com-ponents require a better understanding and manipulation of the colloidal interactions in nonpolar media [5,91]. However, unlikein the previous cases, pyrene cannot be used as a probe for studying aggregation in apolar media. Due to its ownhydrophobicity, it will stay in the hydrophobic bulk environment. Therefore, a less hydrophobic fluorescence probe, 7-dimethylamino 4-methylcoumarine (Coumarin 311) was chosen for the study of the alumina–toluene interface. It has been reported thatthe wavelength of the Coumarin 311 emission maximum shifts from 391 to 471 nm when the solvent is changed from hexane towater [5]. Polarity of an unknown environment can then be estimated by monitoring the position of the emission maximum.
6.5.3.5.2 Electron-Spin Resonance Spectroscopy for the Study of Adsorbed Polymer and Surfactant LayersESR spectroscopy, also known as electron paramagnetic resonance (EPR), is based on the property that an unpaired electronplaced in a magnetic field shows a typical resonance energy absorption spectrum sensitive to its environment. Recently, thistechnique which was primarily developed for biological studies of membrane properties has been adapted for the study ofadsorbed polymer=surfactant layers [92]. The mobility of ESR probe (stable free radical incorporated into the polymer orsurfactant molecule) depends on orientation of the surfactant or polymer and viscosity of the local environment around theprobe.
6.5.3.5.3 Effect of Adsorbed Polymer Conformation on Dispersion CharacteristicsIn a study of dispersion characteristics of alumina suspension with PAA (Mw¼ 88,000) the polymer conformation at alumina–water interface was determined as a function of pH using pyrene-labeled polymer along with settling rate and transmittance(Figure 6.35) [93]. It can be seen that the polymer is coiled (high Ie=Im) at low pH and that the stretched polymer results in betterflocculation in terms of increasing settling rate and larger floc size (observed by CAT-scan) but poor flocculation in terms of the
400
Initial polymer concentration (ppm)
No PEO
Pure PEO3% py-PEO25% py-PEO50% py-PEO100% py-PEO
Set
tling
rat
e (c
m/m
in)
1.6
1.2
0.8
0.4
00 100 200 300
FIGURE 6.34 Settling rate of silica suspensions (5% vol.) with pyrene-labeled and -unlabeled PEO.
310
20
30
40
50
60
70
80
90
100
4 5 6 7pH
Tra
nsm
ittan
ce (
%)
8 9 10 110
1
2
3
4
5
6
7
8 0.7
0.6
0.5
0.4
I e/I m
0.3
0.2
Set
tling
rat
e (c
m/m
in)
FIGURE 6.35 Flocculation of alumina with 20 ppm poly(acrylic acid). &, settling rate; , transmittance; and !, coiling index (Ie=Im).
Birdi/Handbook of Surface and Colloid Chemistry 7327_C006 Final Proof page 188 8.10.2008 9:12pm Compositor Name: VAmoudavally
188 Handbook of Surface and Colloid Chemistry
© 2009 by Taylor & Francis Group, LLC

supernatant clarity. Apparently, the stretched polymer at high pH provides better interparticle bridging while the electrostaticattraction between oppositely charged polymer molecules and alumina particles provides better capture of fine particlesyielding a clear supernatant at low pH values.
The above experiments were conducted under fixed pH conditions: pH was preadjusted and both polymer and aluminaparticles were conditioned at the same pH before mixing. To investigate the effect of adsorbed polymer conformational changeson flocculation performance, PAA was adsorbed at pH 4 and the pH of the suspension was then shifted to 10 and vice versa.Enhanced flocculation was observed in terms of both the settling rate and the supernatant clarity (Figure 6.36a), when pH wasshifted up from 4. In contrast, when the pH was shifted down from 10, the settling rate was similar to that observed under thefixed pH conditions (Figure 6.36b). A maximum in the supernatant transmittance was observed at pH 7, the value whichcorresponds to the isoelectric point of alumina with adsorbed polymer. The direction of pH shift (low to high or reverse)governs the polymer conformational changes: coiled polymer adsorbed on the alumina surface at low pH stretches out when pHis raised, but the initially stretched polymer does not coil when the pH is lowered.
Changes in polymer conformation at the alumina–water interface are schematically shown in Figure 6.37 [94]. When thepolymer is initially adsorbed at low pH in coiled conformation, it stretches out because of increasing electrostatic repulsioncaused by the ionization of the carboxyl groups and the charge reversal of alumina particles (Figure 6.37a through c). In thiscase, some of the polymer chains are dangling into the solution providing interparticle bridging. In the reverse case, when pHwas shifted from 10 to 4 (Figure 6.37d through f), the stretched polymer that initially adsorbs on the particle surface throughhydrogen bonding and retains the same conformation throughout the change in pH.
For significant improvement in supernatant clarity obtained in the scheme when the pH was shifted rather than fixed, thefollowing two-step flocculation mechanism is proposed:
310
20
30
40
50
60
70
80
90
100 8
7
6
5
4
3
2
1
0 0.2
0.3
0.4
I e/I m
0.5
0.6
0.7
(a) (b)4 5 6 7
pH
Tra
nsm
ittan
ce (
%)
Set
tling
rat
e (c
m/m
in)
8 9 10 11 310
20
30
40
50
60
70
80
90
100 8
7
6
5
4
3
2
1
0 0.2
0.3
0.4
I e/I m
0.5
0.6
0.7
4 5 6 7pH
Tra
nsm
ittan
ce (
%)
Set
tling
rat
e (c
m/m
in)
8 9 10 11
FIGURE 6.36 Flocculation of alumina with PAA (20 ppm) under changing pH conditions: (a) initial pH¼ 4, and (b) initial pH¼ 10. &,settling rate; , transmittance; and !, coiling index (Ie=Im).
(a) (b) (c)
(f)pH = 4 pH = 7 pH = 10
(e) (d)
FIGURE 6.37 Schematic representation of the variation of polymer conformation at the solid–liquid interface.
Birdi/Handbook of Surface and Colloid Chemistry 7327_C006 Final Proof page 189 8.10.2008 9:12pm Compositor Name: VAmoudavally
Colloid Systems and Interfaces Stability of Dispersions through Polymer and Surfactant Adsorption 189
© 2009 by Taylor & Francis Group, LLC

1. At low pH, polymer chain captures all alumina particles into small flocs.2. When pH is shifted up, the stretched polymer bridges these small flocs to create much larger aggregates which settle
rapidly, but retaining the smallest particles as well.
6.5.3.5.4 Dual Polymer System for Enhanced FlocculationCombined use of two or more polymers to enhance desired suspension property (flocculation or stabilization), is not anunknown procedure [12,94]. In some systems, it is possible to achieve the synergistic effect of two polymers when one (usuallyof low molecular weight) can adsorb strongly onto particle surface while the other (of much higher molecular weight) canprovide interparticle bridging. Some authors have reported such synergism for the combination of low-molecular-weightcationic and high-molecular-weight anionic polymers [95,96]. Most studies on double flocculants, however, have beenempirical, and the mechanisms are not well developed.
Flocculation of alumina suspensions obtained by the sequential addition of polystyrene sulfonate (Mw¼ 4,600) and cationicpolyacrylamide (Mw¼ 4,000,000) at pH 4.5 is compared in Figure 6.38 with that obtained using single polymers. While theanionic polystyrene sulfonate had only a minor effect, cationic polyacrylamide did not produce any flocculation. However,when used together, both polymers adsorb completely. This coadsorption is attributed to the interaction of complexes betweencationic polyacrylamide and the polystyrene sulfonate at the solid–liquid interface [97]. The mechanism of the superiorflocculation obtained with the dual polymer system is illustrated schematically in Figure 6.39. The anionic polystyrenesulfonate adsorbs on alumina surface and acts as an anionic anchor for the adsorption of the long-chain cationic polymerwhich ultimately provides interparticle bridging and excellent flocculation.
00
2
4
6
8
10
20 40 60Polymer concentration (ppm)
Set
tling
rat
e (m
m/s
)
80 100
FIGURE 6.38 Flocculation response of alumina suspension with dual polymer systems. &, C-PAM alone; , PSS alone; , PSS andC-PAM; D, C-PAM after PSS; and !, PSS after C-PAM.
Bridging by C-PAMPreadsorption of PSS
Cationic polyacrylamide
Polystyrene sulfonate
FIGURE 6.39 Schematic model for flocculation with dual polymer system.
Birdi/Handbook of Surface and Colloid Chemistry 7327_C006 Final Proof page 190 8.10.2008 9:12pm Compositor Name: VAmoudavally
190 Handbook of Surface and Colloid Chemistry
© 2009 by Taylor & Francis Group, LLC

Similar behavior was observed in a study of the other dual polymer flocculation system [98].A combination of a PAA, Mw¼ 10,000) and a high-molecular-weight cationic copolymer of acrylamide and quaternary
acrylate salt (Percol, Allied Colloids) was investigated for flocculating aqueous alumina suspensions. Although the turbidity ofthe supernatant was found to decrease somewhat when only PAA was used (Figure 6.40), suggesting some flocculation, neitherthe polymer molecular weight nor charge effects (pH¼ 8—close to isoelectric point of alumina) were sufficient for strongbridging or charge neutralization. The addition of only Percol has caused even lesser flocculation due to negligible interactionsbetween the positively charged polymer and the slightly positively charged alumina surface.
When both PAA and Percol were added to the suspension, flocculation was found to improve markedly (Figure 6.40). Inaddition, it can be seen that sequential addition of the two polymers (PAA first then Percol) produces better flocculation that co-addition (polymers premixed). These findings again confirm the preciously proposed mechanism (Figure 6.39) in which thelow-molecular-weight polymer provides particle surface charge neutralization and formation of smaller primary flocs. Con-secutively, the high-molecular-weight polymer of the opposite charge can successfully bridge the neutralized particles andprimary flocs, causing maximum flocculation.
6.5.3.5.5 Flocculation with Ultralow Polymer DosageAs mentioned earlier, typical polymer dosage used for flocculation of oxide minerals is of the order of several parts per million(ppm). Some recent results, surprisingly, show that a relatively low molecular weight polymer (PAA, Mw¼ 50,000), generallyconsidered to be a dispersant, can flocculate aqueous alumina suspensions at ultralow dosages of parts per billion effectively[99]. These unexpected results (Figure 6.41) have been attributed to specific interactions, namely hydrogen bonding betweensurface –OH groups and PAA. While these interactions do not effectively change the overall charge of alumina particles (seezeta potential in Figure 6.41), they can compensate for the charges on microdomains occupied by the polymer and causeparticle aggregation based on charge patch neutralization model [77].
Addition of a surfactant can further enhance the flocculation at ultralow polymer dosage regime. As shown in Figure 6.42,the addition of anionic surfactant (SDS) significantly improves the flocculation at very low polymer concentrations [100]. Athigher polymer levels, the surfactant addition has no effect on flocculation. This is probably due to a significant fraction ofadsorption sites being already occupied by polymer, making them unavailable for adsorption of the surfactant molecules.
Time (min)
Tur
bidi
ty (
NT
U)
00
100
200
300
400
500
600
700
800
900
1000
0.1 M NaClpH = 8
1 2 3 4 5 6 7 8 9
5 ppm PAA
5 ppm percol
5 ppm PAA + 5 ppm percol 757 (sequential addition)
5 ppm PAA + 5 ppm percol 757 (coaddition)
Blank (w/o polymer)
FIGURE 6.40 Enhanced flocculation with dual polymer system: PAA and Percol.
Birdi/Handbook of Surface and Colloid Chemistry 7327_C006 Final Proof page 191 8.10.2008 9:12pm Compositor Name: VAmoudavally
Colloid Systems and Interfaces Stability of Dispersions through Polymer and Surfactant Adsorption 191
© 2009 by Taylor & Francis Group, LLC

6.5.3.5.6 Stabilization of Aqueous and Nonaqueous Suspensions with a Hydrophobically Modified PolymerThe interest in hydrophobically modified polymers (containing both hydrophilic and hydrophobic groups along polymerbackbone) has increased recently due to their possible use in many different applications including stabilization of both aqueousand nonaqueous suspensions. A study using DAPRAL GE 202 (polymer with comb-like structure—hydrophobic andhydrophilic chains and carboxyl groups along the backbone) have shown some unusual performance [101]. The effect ofDAPRAL on the stability of aqueous alumina suspensions is shown in Figure 6.43 along with the zeta potential change andadsorption isotherm. The drastic effect of the polymer addition on suspension stability cannot be attributed to electrostaticforces: suspension stability remains unchanged up to a polymer concentration of 150 ppm, while most of the zeta potentialchange takes place in that region. Subsequently, the stability of the suspension increases markedly with further increase in theDAPRAL concentration, while there is only a minor change in the zeta potential.
The same polymer, DAPRAL, having both hydrophobic and hydrophilic groups, can be also used for stabilizingnonaqueous suspensions. The results obtained for the settling rate of alumina in toluene as a function of DAPRAL
100
80
60
40
20
0 0
50 k PAA, pH ~ 3.5,0.03 M NaCl
20
40
60
80
100
Zet
a po
tent
ial (
mV
)
Per
cent
floc
cula
tion
1�100 1�101 1�102
Polymer concentration (ppb)
1�103
→
→
FIGURE 6.41 Flocculation and zeta potential of alumina particles as a function of polymer concentration.
PAA concentration (ppm)0
0
200
400
600
800
1000
PAA alone
PAA/SDS
1200
0.01 0.1 1 10 100
Tur
bidi
ty (
NT
U)
FIGURE 6.42 Turbidity of alumina suspension as a function of polymer concentration with and without surfactant (SDS, 1.25� 10�3
mol=dm3).
Birdi/Handbook of Surface and Colloid Chemistry 7327_C006 Final Proof page 192 8.10.2008 9:12pm Compositor Name: VAmoudavally
192 Handbook of Surface and Colloid Chemistry
© 2009 by Taylor & Francis Group, LLC

concentration, are given in Figure 6.44. The polymer adsorption is proposed to be primarily through the interaction betweensurface hydroxyl groups and the hydrophilic (ethylene oxide) polymer side chains with the hydrophobic side chains exposedtowards bulk solution causing suspension stabilization. This possibility was investigated by using 7-dimethyl amino 4-methylcoumarin as a fluorescence probe to detect the polymer orientation on the particles. Correlation of the observed shiftof maximum wavelength (Figure 6.44) with suspension stability suggests the increase in the hydrophobicity of the aluminasurface; this supports the mechanism proposed above for the observed stability of the alumina suspension.
6.6 SUMMARY
Colloidal particles are subjected to several attractive and repulsive forces and the stability of dispersions depends on theinterplay of these various forces. The van der Waals attractive forces between particles have its origin in the electron wavefluctuations and are usually effective at close ranges. Electrical double-layer interactions stem from the presence of ionizedspecies at the interface and are effective at distances proportional to the double-layer thickness for the given system. In aqueoussystems this is usually of the order of 100 Å at an ionic strength of 10�3 mol=L. In nonaqueous systems, this is very large sincethe potential decays only very slowly from the surface. Another dominant force, steric force, depends on the nature and size ofthe adsorbed species, but is typically short range. Other forces such as solvation, hydration, and capillary forces occur due tostructural ordering at the interface and are active at separation distances of the order of 4 nm.
100
DAPRAL (ppm)
Sol
id s
ettle
d (%
)
80
60
40
20
00 200 400 600 800 1000
−80
−60
−40
−20
0
Zet
a po
tent
ial (
mV
)
Ads
orpt
ion
dens
ity (
mg/
cm2 )
20 8 � 10−5
6 � 10−5
4 � 10−5
2 � 10−5
0 � 100
FIGURE 6.43 Adsorption of DAPRAL on alumina and its effect on stability and zeta potential. pH¼ 8; S=L¼ 2.5%; !, zeta potential; &,adsorption; and , settling rate.
350
400
Max
imum
em
issi
on (
nm)
Set
tling
rat
e (m
m/s
)
450
500
00
0.1
0.2
0.3
200 400 600
DAPRAL (ppm)
800 1000
FIGURE 6.44 Effect of DAPRAL on stability and hydrophobicity of alumina in toluene. ~, emission wavelength; and , settling rate.
Birdi/Handbook of Surface and Colloid Chemistry 7327_C006 Final Proof page 193 8.10.2008 9:12pm Compositor Name: VAmoudavally
Colloid Systems and Interfaces Stability of Dispersions through Polymer and Surfactant Adsorption 193
© 2009 by Taylor & Francis Group, LLC

These forces and hence the stability of the dispersions can be altered=controlled by the adsorption of ions, surfactants, orpolymers at the solid–liquid interface. Adsorption of surfactants and polymers at the solid–liquid interface depends on thenature of the surfactant or polymer, the solvent and the substrate. Ionic surfactants adsorbing on oppositely charged surfacesexhibit a typical four-region isotherm. Such adsorption can alter the dispersion stability mainly by changing the double-layerinteraction which depends on the extent of adsorption. Thus it is seen that alumina suspensions are destabilized by theadsorption of SDS when the zeta potential is reduced to zero. At higher concentrations, bilayered surfactant adsorption canoccur with changes in wettability and flocculation of the particles by altering the hydrophobic interactions.
Nonionic surfactants adsorb primarily through hydration or hydrogen bond interactions and this depends on the hydrationcharacteristics of the substrate. These surfactants can affect also the double-layer forces due to charge screening effects.Nonionic surfactants affect the dispersion stability mainly by altering the van der Waals interaction and the hydrophobic forceswhich in turn depend on the nature and orientation of the adsorbed surfactant layer. The adsorption of nonionic surfactants canbe greatly enhanced by the presence of ionic surfactants and vice versa. Experiments have shown that nonionic and ionicsurfactants when used in mixtures can be forced to adsorb on substrates on which they do not show much adsorption bythemselves. The synergistic effect of these mixtures on adsorption is hypothesized to be due to the reduction in charge repulsioncausing to better packing of the ionic surfactants while for the nonionic surfactants the increase in adsorption is due to theirsolubilization in the hydrophobic microdomains formed by the ionic surfactants. These mixed systems give rise to interestingadsorbed layer structures which can be manipulated for desired dispersion properties.
In organic media, adsorption of surfactants depends on the relative acid–base characteristics of the solute, solvent, andsubstrate. Adsorption of ionic surfactants on oxide surfaces proceeds to a monolayer and there is no evidence of lateralinteraction between the adsorbed molecules. Such uniform adsorption imparts stability to the dispersion mainly by reducing thevan der Waals attractive forces. However on hydrophobic surfaces, interactions are possible among the polar groups of theadsorbed molecules leading to the formation of reverse solloids and a concomitant increase in adsorption density somewhatresembling solloid formation in aqueous media. This leads to a decrease in dispersion stability. The presence of water markedlyaffects the suspension stability in nonaqueous media. When present in trace amounts, it induces ionization in the adsorbed layerand imparts electrostatic stability to the dispersion while at high concentrations, it promotes capillary condensation between theparticles leading to flocculation.
Adsorption of polymeric dispersants and flocculants in aqueous media is controlled by the polymer charge, molecularweight, solvent, solution conditions (pH, ionic strength), and porosity of the substrate. However, the adsorbed polymer layerstructure is very different from that of the surfactants. A polymer can have various configurations at the interface and theadsorbed layer can be thought of as a fuzzy polymer layer with trains, loops, and tails. Polymer adsorption affects dispersionstability by altering the electrostatic forces (in the case of polyelectrolytes) and mainly the steric forces which are in this casesignificant since the adsorbed layer thickness is large for polymers. Flocculation by polymers is mainly by charge neutralizationand bridging which depends on the relative size of the polymer chain and the particle and more importantly on theconformational state of the adsorbed polymer. Also, it is clear that reorientation of the polymer molecules at the interfacecan take place in response to changes in the environmental conditions such as pH and this can produce drastic alternations.Interactions between different polymers can also influence dispersion behavior. Thus the use of two polymers in sequence isvery effective as it can control the kinetics of aggregation and the floc structure. It has been clearly established the dispersionstability can be manipulated through control of polymer structure and its conformation at the solid–liquid interface.
ACKNOWLEDGMENTS
The authors wish to acknowledge the financial support of the Industry=University Cooperative Research Center (IUCRC) forAdvanced Studies in Novel Surfactants at Columbia University (National Science Foundation grant # EEC-98–04168), TheDepartment of Energy (DOE # DE-FC26-03NT15413), the Engineering Research Center (ERC) for Particle Science andTechnology at the University of Florida (National Science Foundation grant # EEC-94-02989) and the Industrial Partners of theIUCRC and ERC.
REFERENCES
1. P. Somasundaran, Y.H.C. Wang, and S. Acar, Future Trends in Polymer Science and Technology, Technomic Publishing, Berlin, 1987,p. 134.
2. A.G. Evans and T.G. Langdon, Prog. Mater. Sci., 21, 174.3. H.M. Remz, Cosmet. Toiletries, 103, 1988, 70.4. V. Novotny, Colloids Surf., 24, 1987, 361.5. A. Blier, Ultrastructure Processing of Ceramics, Glasses and Composites, L.L. Hench and D.R. Ulrich (Eds.), John Wiley & Sons,
New York, 1984, p. 391.6. H. Goldsmith and S.G. Mason, Biorheology, 12, 1975, 181.
Birdi/Handbook of Surface and Colloid Chemistry 7327_C006 Final Proof page 194 8.10.2008 9:12pm Compositor Name: VAmoudavally
194 Handbook of Surface and Colloid Chemistry
© 2009 by Taylor & Francis Group, LLC

7. B. Max, Interfacial Phenomena in Biological Systems, Surfactant Science Series Vol. 39, Marcel Dekker, 1991.8. H.C. Hamaker, Rec. Trav. Chim., 55, 1936, 63.9. R.M. Pashley et al., Science, 229, 1985, 1088.10. J.N. Israelachvili and R.M. Pashley, J. Colloid Interface Sci., 98, 1984, 500.11. C.J. van Oss, Interaction Forces in Aqueous Media, Marcel Dekker, New York, 1994.12. P. Somasundaran, T.W. Healey, and D.W. Fuerstenau, J. Colloid Interface Sci., 22, 1966, 599.13. P.J. Flory, Statistical Mechanics of Chain Molecules, Interscience, New York, 1969.14. R.-H. Yoon and S.A. Ravishankar, J. Colloid Interface Sci., 166, 1994, 215.15. R.W. Slater and J.A. Kitchener, Disc. Faraday Soc., 42, 1966, 267.16. R. Horn and J. Israelachvilli, J. Phys. Chem., 75, 1981, 1400.17. H.K. Christenson, J. Dispersion Sci. Tech., 9, 1988, 171.18. H.K. Christenson, J. Colloid Interface Sci., 104, 1985, 234.19. R.A. Williams, Colloid and Surface Engineering: Applications in the Process Industries, Colloid and Surface Engineering Series,
Butterworth-Heinemann, 1992, p. 3.20. F.M. Fowkes and R.J. Pugh, Polymer Adsorption and Dispersion Stability, American Chemical Society Symposium Series, 240,
Washington, DC, 1984, p. 331.21. J. Lyklema, Adv. Colloid Interface Sci., 2, 1968, 65.22. P. Somasundaran, Y.-B. Huang, and C.C. Gryte, Powder Tech., 53, 1987, 73.23. S. Krishnakumar and P. Somasundaran, Colloids and Surfaces, 117, 1996, 37.24. K.F. Young and H.P.R. Frederikse, J. Phys. Chem. Ref. Data, 2, 1973, 313.25. A.W. Adamson, Physical Chemistry of Surfaces, 4th ed., John Wiley & Sons, New York, 1982.26. G.D. Parfitt and C.H. Rochester, In Adsorption from Solution at the Solid=Liquid Interface, G.D. Parfitt and C.H. Rochester (Eds.),
Academic Press, New York, 1983, p. 3.27. A. Zangwill, Physics at Surfaces. Cambridge University Press, New York, 1988, Chapter 14.28. E.D. Goddard and P. Somasundaran, Croat. Chem. Acta, 48, 1976, 451.29. P. Somasundaran and D.W. Fuerstenau, J. Phys. Chem., 70, 1966, 90.30. A.M. Gaudin and D.W. Fuerstenau, Miner. Eng., 7, 1955, 66.31. P. Somasundaran and Joy T. Kunjappu, Colloids Surf., 37, 1989, 245.32. P. Somasundaran, P. Chandar and K. Chari, Colloids Surf., 8, 1983, 121.33. Edward Fu, Doctoral thesis, Adsorption of Anionic–Nonionic surfactant Mixtures on Oxide Minerals, Columbia University,
New York, 1987.34. P. Somasundaran, E.D. Snell, and Qun Xu, J. Colloid Interface Sci., 144(1), 1991, 159.35. Q. Xu and P. Somasundaran, Miner. Metallurg. Process., 9, 1992, 29.36. P. Somasundaran et al., U.S. Patent 6051143, 2000.37. A.W. Marczewska and M. Jaroniec, Montash Chem., 114, 1983, 711.38. A.W. Marczewska and M. Jaroniec, In Surface and Colloid Science, E. Matijevi�c (Ed.), Vol. 14, Plenum Press, New York, 1987, p. 301.39. F.M. Fowkes, In Chemistry and Physics at Interfaces, American Chemical Society, Washington DC, 1965, p. 1.40. S. Krishnakumar and P. Somasundaran, Langmuir, 10, 1994, 2786.41. A.N. Maitra and H.F. Eicke, J. Phys. Chem., 85, 1981, 2687.42. S. Krishnakumar, P. Somasundaran, and X. Yu, Proceedings of First International Forum on Particle Technology. AIChE, Denver,
CO, 1994, p. 213.43. S. Krishnakumar and P. Somasundaran, Colloid Surf., 117, 1996, 227.44. T. Gu and B.-Y. Zhu, Colloid Surf., 46, 1990, 81.45. D.W. Fuerstenau, T.W. Healy, and P. Somasundaran, Trans. Am. Inst. Mining Metallurg. Pet. Eng., 229, 1964, 321–325.46. P. Somasundaran, T.W. Healy, and D.W. Fuerstenau, J. Phys. Chem., 68(12), 1964, 3562–3566.47. C.M. Hansen, Three dimensional solubility parameter and solvent diffusion coefficient—Importance in surface coating formulation,
Doctoral dissertation, Copenhagen, 1967.48. C.M. Hansen, The three dimensional solubility parameter—key to paint component affinities I. Solvents, plasticizers, polymers and
resins, J. Paint Technol., 39, 1967, 104: The three dimensional solubility parameter—key to paint component affinities II. Dyes,emulsifiers, mutual compatibility and solubility, and pigments, J. Paint Technol., 39, 1967, 505.
49. I. Yildirim, Surface free energy characterization of powders. (2001).50. A.F. Barton, Handbook of Solubility Parameters and Other Cohesion Parameters, CRC press, Boca Raton, FL, 1991, p. 166.51. S. Gasic, B. Jovanovic, and S. Jovanovic, The stability of emulsions in presence of additives, J. Serb. Chem. Soc., 67(1), 2002,
31–39.52. P. Somasundaran, S. Krishnakumar, and S.C. Mehta, A new model to describe the sorption of surfactants on solids in non-aqueous
media, J. Colloid Interface Sci., 292(2), 2005, 373–380.53. K.V.S.N. Raju and M. Yaseen, Suspension interaction of rutile and anatase titanium dioxide pigments in organic liquids, Langmuir, 8,
1992, 43–47.54. Y. Du, Y. Xue, and H.L. Frisch, Solubility parameters [of polymers], Physical Properties of Polymers Handbook—Mark Encyclopedia,
1996, pp. 227–239.55. B.L. Karger, L.R. Snyder, and Claude Eon, An expanded solubility parameter treatment for classification and use of chromatographic
solvents and adsorbents, J. Chromatogr., 125, 1976, 71–88.
Birdi/Handbook of Surface and Colloid Chemistry 7327_C006 Final Proof page 195 8.10.2008 9:12pm Compositor Name: VAmoudavally
Colloid Systems and Interfaces Stability of Dispersions through Polymer and Surfactant Adsorption 195
© 2009 by Taylor & Francis Group, LLC

56. K.M. Shareef, M. Yaseen, M. Mahmood Ali, and P.J. Reddy, Suspension interaction of pigments in solvents: Characterization ofpigment surfaces in terms of three-dimensional solubility parameters of solvents, J. Coatings Technol., 58, 1986, 35–44.
57. S. Krishnakumar, Doctoral thesis adsorption mechanism and surfactant conformation studies for dispersion stability in non-aqueousmedia, August 1995.
58. M.J. Mcguire and I.H. Suffet, Adsorption of organics from domestic water supplies, J. Am. Waterworks Assoc., 70, 1978, 621.59. S. Krishnakumar and P. Somasundaran, Role of surfactant-adsorbent acidity and solvent polarity in adsorption–desorption of surfactants
from nonaqueous media, Langmuir, 10(8), 1994, 2786–2789.60. S. Krishnakumar and P. Somasundaran, Aggregation behavior of aerosol OT in nonaqueous solvents and its desorption. An ESR study,
J. Colloid Interface Sci., 162(2), 1994, 425–30.61. P.J. Flory, Principles of Polymer Chemistry, Cornell University Press, Ithaca, NY, 1953.62. P.G. de Gennes, Scaling Concepts in Polymer Physics, Cornell University Press, Ithaca, NY, 1979.63. J.S. Jones and P. Richmond, Faraday Trans., II, 80, 1980, 865.64. J. Scheutjens and G. Fleer, The Effect of Polymers on Dispersion Properties, Th.F. Tadros (Ed.), Academic Press, London, 1982, p. 42.65. M. Kawaguchi and A. Takahashi, Adv. Colloid Interface Sci., 37, 1992, 219.66. P.G. de Gennes, Macromolecules, 14, 1987, 1637; 15, 1982, 1062.67. J. Scheutjens and G. Fleer, J. Phys. Chem., 83, 1979, 1619; 84, 1980, 178.68. E. Jenkel and R. Rumbach, Z. Elektrochem., 55, 1951, 612.69. T. Sato and R. Ruch, Stabilization of Colloidal Dispersion by Polymer Adsorption, Marcel Dekker, New York, 1980, p. 3.70. R.A. Ruehrwein and D.W. Ward, Soil Sci., 73, 1952, 485.71. V.K. La Mer and T.W. Healey, Rev. Pure App. Chem., 13, 1963, 112.72. V.K. La Mer, J. Colloid Sci., 19, 1964, 291.73. J. Lyklema, In Flocculation, Sedimentation and Consolidation, B. Moudgil and P. Somasundaran (Eds.), Engineering Foundation,
New York, 1985.74. R.H. Ottewill and T. Walker, Kolloid Z.Z. Polym., 224, 1967, 330.75. T.W. Healy and V.K. LaMer, J. Phys. Chem., 66, 1962, 1835.76. R.H. Smellie and V.K. La Mer, J. Colloid Sci., 23, 1958, 589.77. T.G.H. van der Ven, J. Colloid Interface Sci., 82(1), 1981, 290.78. J. Gregory, J. Colloid Interface Sci., 42, 1973, 448.79. K.F. Tjipangandjara and P. Somasundaran, Colloids Surfaces, 55, 1991, 245.80. K.F. Tjipangandjara and P. Somasundaran, Adv. Powder Technol., 3(2), 1992, 119.81. J. Gregory and I. Sheihin, Br. Polym. J., 6, 1974, 47.82. W.H. Grant, L.E. Smith, and R.R. Stromberg, Faraday Discuss. Chem. Soc., 59, 1975, 209.83. S.D. Faust and M.O. Aly, Chemistry of Water Treatment, Butterworths, Boston, MA, 1983.84. T. Sato and R. Ruch, Steric stabilization, Steric Stabilization of Colloidal Dispersion by Polymer Adsorption, Marcel Dekker,
New York, 1986.85. P. Chandar, Doctoral thesis. The effect of ionic strength on the adsorption of sodium dodecylsulfonate on alumina. Columbia
University, New York, 1986.86. D.C. Dong and M.A. Winnik, Can. J. Chem., 62, 1984, 2560.87. K. Sivadasan and P. Somasundaran, Colloids Surfaces, 49, 1990, 229.88. C. Maltesh, Q. Xu, P. Somasundaran, W.J. Benton, and N. Hung, Langmuir, 8, 1992, 1511.89. P. Chandar, P. Somasundaran, N.J. Turro, and K.C. Waterman, Langmuir, 3, 1987, 298.90. A. Campbell and P. Somasundaran, J. Colloid Interface Sci., 229, 2000, 257.91. R.B. McKay, Interfacial Phenomena in Apolar Media, Marcel Dekker, New York, 1987, p. 361.92. B. Moudgil and P. Somasundaran, Flocculation, Sedimentation and Consolidation, AIChE, New York, 1987.93. K.F. Tjipangandjara, Y.B. Huang, P. Somasundaran, and N.J. Turro, Colloids Surfaces, 44, 1990, 229.94. S. Shimabayashi, K. Nishino, and M. Nakagaki, Colloids Surfaces, 63, 1992, 121.95. K.W. Britt, A.G. Dillon, and L.A. Evans, Tappi, 60, 1977, 102.96. E.E. Moore, Tappi, 59, 1976, 120.97. X. Yu and P. Somasundaran, Colloids Surfaces, 81, 1993, 17.98. A. Fan, N.J. Turro, and P. Somasundaran, Colloids Surfaces A: Physicochem. Eng. Aspects, 162, 2000, 141.99. K.K. Das and P. Somasundaran, Colloids Surfaces A: Physicochem. Eng. Aspects, 182, 2001, 25.100. A. Fan, P. Somasundaran, and N.J. Turro, Colloids Surfaces A: Physicochem. Eng. Aspects, 146, 1999, 397.101. P. Somasundaran and X. Yu, Adv. Colloid Interface Sci., 53, 1994, 33.
Birdi/Handbook of Surface and Colloid Chemistry 7327_C006 Final Proof page 196 8.10.2008 9:12pm Compositor Name: VAmoudavally
196 Handbook of Surface and Colloid Chemistry
© 2009 by Taylor & Francis Group, LLC