college hill - cincinnati-oh.gov
TRANSCRIPT

1
2
1
2
1
2
1
2
1
2
2
31
3
2
1
3
1
1
2
3
1
1
1
3
2
1
3
1
24
4
1
73
2
3
2
1
2
3
1
2
24
84
81
73
80
85.01
83
111222
75
82.01
82.02
218.02
218.01
219
79
221.02207.62
208.11
207.62
College Hill
Mt. Airy
Winton Hills
Spring Grove VillageNorthside
Hartwell
KIRBY
HAMI
LTON
WIN
TON
GRAY
DALY
COLERAIN
CEDAR
BELMONT
GLEN
VIEW
WINTON RIDGE
ARGU
S
NORTH BENDKIPLING
GROESBECK
CARY
ASPE
N
EDW
OOD
HOLLYWOOD
HAND
REID
ELKTON
OAK KNOLL
LANT
ANA
TAHI
TI
MEIS
WIN
NEST
E
SPRINGLAWN
TEAKWOODWITTEKIND
RAEBURN
HILLCREST
KINGS RUN
ASHT
REE
LARCH
CAPR
I
BLUE SP
RUCE
BLUEBELL
SALV
IA
HAWAIIAN
LODGE
SAVA
NNAH
KENN
ETH
BOBO
LINK
FROOME
VENE
TIAN
CRESAP
DUTCH COLONY
ASTER
DEVONWOOD
GWINNET
AMBROSE
SUNR
IDGE
ZIGZA
G
BURR OAK
OTTE
KIRKL
AND
HEITZ
LER
OAK RIDGE
FURN
AS RI
DGE
FLATT
HARBESON
LOISW
OOD
LARRY
MERY
TON
BAHAMA
FOLC
HI
MARLOWEOAKW
OOD
HOMESIDE
ELSIE
PAW
NEE
ST EL
MO
EAST EPWORTH
BRUSHWOOD
LITTL
E FLO
WER
DAVE
Y
ROCKFORD
ATWOOD
WAL
DWAY
THOR
NHILL
GALBRAITH
STEL
LA
EDNA
WOO
DEN
SHOE
REDCED
AR
MONT
EVIST
A
CASEY
ELDA
SCARLETOAK
GOLD
ENRO
D
BANNING
RUGB
Y
PEAR
TON
EBONY
CRAVEN
WIO
NNA
BLUE
SPRU
CE
OAKFIELD
EAST APPLE
MONTICELL
O
VAN LEUNEN
BITTE
ROOT
ADDICE
ROBLEY
LANIUS
PEASLEE
ARCH
LAND
LINDEN
SWEE
TBRIA
R
REEMELIN
ORLE
ANS
COLL
EGEV
UE
BELL
EAIR
LOISKA
WEST
INNE
S
BUDDLEIA
THOMWOOD
KIEFE
R
ALBANY
STANFORD
TOLUCA
HIGHFOREST
LEAFWOOD
MEHMERT
RUDYARD
WILL
OWCO
VE
NAHA
NT
SOUTH RIDGE
GLAD
YS
WIN
TROP
EAST
LARRYWOOD
GRAYVIEW
PLAN
TATIO
N
PIQUA
PROVINCE
BANK
WOO
D
PASADENA
LARMON
FAIRC
REST
BIRCHWOOD
TANGLEWOOD
RENE
E
EASTKNOLL
ROXIE
CHER
RYW
OOD
MCCR
AY
DOVE
TAIL
WILMONT
CEDAR
CARY
NORTH BEND
NORT
H BE
ND
College Hill
LegendCollege Hill SNA Boundary2010 Census Tracts2010 Block GroupsBuildings Streets Ü 0 2,400 4,800 7,200 9,6001,200
Feet
Statistical Neighborhood Approximation

College Hill
Census 2010
81* 82.01 82.02 84 111* 221.02 Totals
TOTAL POPULATION 2,491 4,018 3,187 1,998 2,439 - 14,133
SEX
Male: 1,107 1,808 1,400 802 1,158 - 6,275
Female: 1,384 2,210 1,787 1,196 1,281 - 7,858
SEX BY AGE
Male: 1,107 1,808 1,400 802 1,158 - 6,275
Under 5 years 74 157 88 128 54 - 501
5 to 9 years 76 128 88 66 76 - 434
10 to 14 years 88 130 83 46 82 - 429
15 to 17 years 60 86 67 28 64 - 305
18 and 19 years 36 63 38 18 31 - 186
20 years 21 20 24 9 17 - 91
21 years 15 19 12 5 12 - 63
22 to 24 years 29 59 48 26 46 - 208
25 to 29 years 59 122 83 39 45 - 348
30 to 34 years 47 115 95 33 39 - 329
35 to 39 years 60 114 90 26 61 - 351
40 to 44 years 76 132 85 38 64 - 395
45 to 49 years 86 129 119 39 101 - 474
50 to 54 years 96 154 132 33 112 - 527
55 to 59 years 61 135 115 52 88 - 451
60 and 61 years 32 38 43 13 38 - 164
62 to 64 years 31 44 58 16 40 - 189
65 and 66 years 20 29 12 13 31 - 105
67 to 69 years 37 36 18 16 32 - 139
70 to 74 years 36 40 16 23 45 - 160
75 to 79 years 32 33 33 25 33 - 156
80 to 84 years 26 11 23 42 26 - 128
85 years and over 9 14 30 68 21 - 142
Female: 1,384 2,210 1,787 1,196 1,281 - 7,858
Under 5 years 66 151 94 91 34 - 436
5 to 9 years 67 148 92 77 72 - 456
10 to 14 years 99 141 67 42 74 - 423
15 to 17 years 77 83 63 24 58 - 305
18 and 19 years 46 49 41 19 23 - 178
20 years 15 19 9 8 16 - 67
21 years 10 18 23 19 16 - 86
22 to 24 years 42 76 59 75 28 - 280
25 to 29 years 61 116 122 77 57 - 433
30 to 34 years 69 167 102 34 54 - 426
35 to 39 years 78 146 102 52 83 - 461
40 to 44 years 75 160 118 49 86 - 488
45 to 49 years 109 174 139 53 107 - 582
50 to 54 years 119 213 161 67 123 - 683
55 to 59 years 112 159 133 65 117 - 586
60 and 61 years 38 57 39 32 32 - 198
62 to 64 years 54 78 60 27 68 - 287
65 and 66 years 29 23 31 13 28 - 124
67 to 69 years 44 48 41 27 47 - 207
70 to 74 years 62 56 33 32 54 - 237
75 to 79 years 49 55 62 59 42 - 267
80 to 84 years 30 34 57 79 34 - 234
85 years and over 33 39 139 175 28 - 414
RACE
One Race 2,437 3,897 3,096 1,947 2,411 - 13,788
White alone 338 1,347 1,208 995 912 - 4,800
Black or African American alone 2,075 2,497 1,855 930 1,464 - 8,821
American Indian and Alaska Native alone 5 9 12 - 4 - 30
Asian alone 3 32 9 13 16 - 73
Native Hawaiian and Other Pacific Islander alone - 3 1 - 1 - 5
Some Other Race alone 16 9 11 9 14 - 59
Two or More Races 54 121 91 51 28 - 345
Census Tract
April 2012Department of Planning and Buildings, City of Cincinnati
Source: US Census Report, 2010 1 of 9

College Hill
Census 2010
81* 82.01 82.02 84 111* 221.02 Totals
Census Tract
RACE ALONE OR COMBINATION WITH
ONE OR MORE OTHER RACES
White alone or in combination with one or more
other races
378 1,438 1,278 1,044 929 - 5,067
Black or African American alone or in combination
with one or more other races
2,124 2,596 1,933 975 1,486 - 9,114
American Indian and Alaska Native alone or in
combination with one or more other races
18 48 42 9 16 - 133
Asian alone or in combination with one or more other
races
8 48 15 19 17 - 107
Native Hawaiian and Other Pacific Islander alone or in
combination with one or more other races
1 12 6 - 1 - 20
Some Other Race alone or in combination with one or
more other races
21 16 18 14 20 - 89
HISPANIC OR LATINO AND RACE
Total Population: 2,491 4,018 3,187 1,998 2,439 - 14,133
Total Hispanic or Latino Population: 42 19 30 43 29 - 163
White alone 20 8 13 26 15 - 82
Black or African American alone 9 2 3 3 2 - 19
American Indian and Alaska Native alone 1 - 1 - - - 2
Asian alone - - - 1 - - 1
Native Hawaiian and Other Pacific Islander alone - - - - - - 0
Some Other Race alone 6 1 6 6 9 - 28
Two or More Races 6 8 7 7 3 - 31
HOUSEHOLD
Total: 2,491 4,018 3,187 1,998 2,439 - 14,133
In households: 2,467 4,014 3,057 1,898 2,417 - 13,853
In family households: 1,992 3,211 2,089 1,429 2,020 - 10,741
Householder: 651 1,028 706 492 667 - 3,544
Male 308 498 318 205 402 - 1,731
Female 343 530 388 287 265 - 1,813
Spouse 305 542 357 246 456 - 1,906
Biological child 662 1,174 732 528 631 - 3,727
Adopted child 16 22 18 21 17 - 94
Stepchild 46 38 17 8 30 - 139
Grandchild 136 149 85 44 87 - 501
Brother or sister 31 52 36 27 28 - 174
Parent 19 28 23 14 23 - 107
Parent-in-law 4 7 1 1 2 - 15
Son-in-law or daughter-in-law 7 6 2 1 5 - 21
Other relatives 52 70 41 21 28 - 212
Nonrelatives 63 95 71 26 46 - 301
In nonfamily households: 475 803 968 469 397 - 3,112
Male householder: 179 271 351 109 150 - 1,060
Living alone 151 221 313 95 128 - 908
Not living alone 28 50 38 14 22 - 152
Female householder: 242 423 514 316 195 - 1,690
Living alone 220 372 466 287 176 - 1,521
Not living alone 22 51 48 29 19 - 169
Nonrelatives 54 109 103 44 52 - 362
In group quarters: 24 4 130 100 22 - 280
Institutionalized population 24 - 65 100 - - 189
Noninstitutionalized population - 4 65 - 22 - 91
HOUSING TYPE
Total Households: 1,072 1,722 1,571 917 1,012 - 6,294
Family households: 651 1,028 706 492 667 - 3,544
Husband-wife family 305 542 357 246 456 - 1,906
April 2012Department of Planning and Buildings, City of Cincinnati
Source: US Census Report, 2010 2 of 9

College Hill
Census 2010
81* 82.01 82.02 84 111* 221.02 Totals
Census Tract
Other family: 346 486 349 246 211 - 1,638
Male householder, no wife present 61 89 65 28 37 - 280
Female householder, no husband present 285 397 284 218 174 - 1,358
Nonfamily households: 421 694 865 425 345 - 2,750
Householder living alone 371 593 779 382 304 - 2,429
Householder not living alone 50 101 86 43 41 - 321
HOUSING OCCUPANCY
Total Housing Units: 1,235 1,893 1,848 1,047 1,079 - 7,102
Occupied 1,072 1,722 1,571 917 1,012 - 6,294
Vacant 163 171 277 130 67 - 808
Vacancy Status
For rent 81 79 144 100 12 - 416
Rented, not occupied - 8 7 1 2 - 18
For sale only 9 26 18 5 27 - 85
Sold, not occupied 8 12 1 2 6 - 29
For seasonal, recreational, or occasional use 1 5 1 3 - - 10
For migrant workers - 2 6 - - - 8
Other vacant 64 39 100 19 20 - 242
HOUSING TENURE
Total Occupied Housing Units: 1,072 1,722 1,571 917 1,012 - 6,294
Owned Occupied 618 1,015 561 417 843 - 3,454
Owned with a mortgage or a loan 474 809 455 315 638 - 2,691
Owned free and clear 144 206 106 102 205 - 763
Renter occupied 454 707 1,010 500 169 - 2,840
COMMUTING TO WORK
Total: 1,202 1,999 1,421 653 1,123 - 6,398
Car, truck, or van: 1,052 1,637 1,011 628 967 - 5,295
Drove alone 956 1,393 905 585 857 - 4,696
Carpooled: 96 244 106 43 110 - 599
In 2-person carpool 96 230 106 35 110 - 577
In 3-person carpool - - - 8 - - 8
In 4-person carpool - - - - - - 0
In 5- or 6-person carpool - - - - - - 0
In 7-or-more-person carpool - 14 - - - - 14
Public transportation (excluding taxicab): 51 222 325 7 136 - 741
Bus or trolley bus 51 222 325 7 136 - 741
Streetcar or trolley car (carro publico in Puerto Rico) - - - - - - 0
Subway or elevated - - - - - - 0
Railroad - - - - - - 0
Ferryboat - - - - - - 0
Taxicab - - - 9 - - 9
Motorcycle - - - - - - 0
Bicycle 7 - - - - - 7
Walked 16 32 10 - 11 - 69
Other means 10 13 - - - - 23
Worked at home 66 95 75 9 9 - 254
164 37
OCCUPATION
Management, business, science, and arts occupations: 384 668 479 190 505 - 2,226
Service occupations: 233 354 356 138 224 - 1,305
Sales and office occupations: 344 562 384 220 297 - 1,807
Natural resources, construction, and maintenance
occupations: 103 173 57 8 58 - 399
Production, transportation, and material moving
occupations: 183 276 185 125 124 - 893
April 2012Department of Planning and Buildings, City of Cincinnati
Source: US Census Report, 2010 3 of 9
College Hill
Census 2010
81* 82.01 82.02 84 111* 221.02 Totals
Census Tract
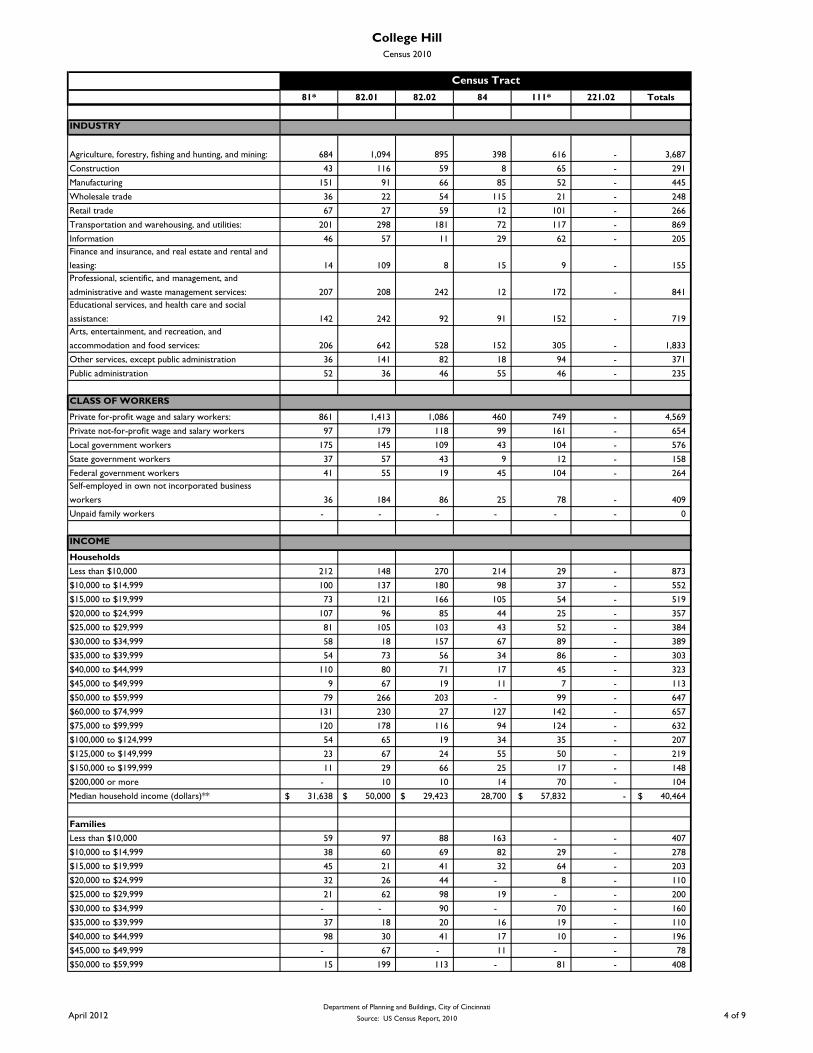
INDUSTRY
Agriculture, forestry, fishing and hunting, and mining: 684 1,094 895 398 616 - 3,687
Construction 43 116 59 8 65 - 291
Manufacturing 151 91 66 85 52 - 445
Wholesale trade 36 22 54 115 21 - 248
Retail trade 67 27 59 12 101 - 266
Transportation and warehousing, and utilities: 201 298 181 72 117 - 869
Information 46 57 11 29 62 - 205
Finance and insurance, and real estate and rental and
leasing: 14 109 8 15 9 - 155
Professional, scientific, and management, and
administrative and waste management services: 207 208 242 12 172 - 841
Educational services, and health care and social
assistance: 142 242 92 91 152 - 719
Arts, entertainment, and recreation, and
accommodation and food services: 206 642 528 152 305 - 1,833
Other services, except public administration 36 141 82 18 94 - 371
Public administration 52 36 46 55 46 - 235
CLASS OF WORKERS
Private for-profit wage and salary workers: 861 1,413 1,086 460 749 - 4,569
Private not-for-profit wage and salary workers 97 179 118 99 161 - 654
Local government workers 175 145 109 43 104 - 576
State government workers 37 57 43 9 12 - 158
Federal government workers 41 55 19 45 104 - 264
Self-employed in own not incorporated business
workers 36 184 86 25 78 - 409
Unpaid family workers - - - - - - 0
INCOME
Households
Less than $10,000 212 148 270 214 29 - 873
$10,000 to $14,999 100 137 180 98 37 - 552
$15,000 to $19,999 73 121 166 105 54 - 519
$20,000 to $24,999 107 96 85 44 25 - 357
$25,000 to $29,999 81 105 103 43 52 - 384
$30,000 to $34,999 58 18 157 67 89 - 389
$35,000 to $39,999 54 73 56 34 86 - 303
$40,000 to $44,999 110 80 71 17 45 - 323
$45,000 to $49,999 9 67 19 11 7 - 113
$50,000 to $59,999 79 266 203 - 99 - 647
$60,000 to $74,999 131 230 27 127 142 - 657
$75,000 to $99,999 120 178 116 94 124 - 632
$100,000 to $124,999 54 65 19 34 35 - 207
$125,000 to $149,999 23 67 24 55 50 - 219
$150,000 to $199,999 11 29 66 25 17 - 148
$200,000 or more - 10 10 14 70 - 104
Median household income (dollars)** 31,638$ 50,000$ 29,423$ 28,700 57,832$ - 40,464$
Families
Less than $10,000 59 97 88 163 - - 407
$10,000 to $14,999 38 60 69 82 29 - 278
$15,000 to $19,999 45 21 41 32 64 - 203
$20,000 to $24,999 32 26 44 - 8 - 110
$25,000 to $29,999 21 62 98 19 - - 200
$30,000 to $34,999 - - 90 - 70 - 160
$35,000 to $39,999 37 18 20 16 19 - 110
$40,000 to $44,999 98 30 41 17 10 - 196
$45,000 to $49,999 - 67 - 11 - - 78
$50,000 to $59,999 15 199 113 - 81 - 408
April 2012Department of Planning and Buildings, City of Cincinnati
Source: US Census Report, 2010 4 of 9

College Hill
Census 2010
81* 82.01 82.02 84 111* 221.02 Totals
Census Tract
$60,000 to $74,999 131 220 31 43 107 - 532
$75,000 to $99,999 113 122 77 60 120 - 492
$100,000 to $124,999 42 65 19 18 11 - 155
$125,000 to $149,999 23 38 19 39 50 - 169
$150,000 to $199,999 - 21 66 17 11 - 115
$200,000 or more - 10 7 14 70 - 101
Median family income (dollars)** 44,897$ 55,806$ 33,679$ 19,102 66,067$ - 46,526$
Per capita income (dollars)** 17,978$ 23,505$ 21,301$ 23,306 30,965$ - 23,293$
MEDIAN EARNINGS (DOLLARS)
Male full-time, year-round workers 14,914 29,597 23,750 32,316 37,454 - X
Female full-time, year-round workers 21,267 22,114 25,032 15,750 33,070 - X
POVERTY STATUS
Total: 654 1,056 823 531 650 - 3,714
Income in the past 12 months below poverty
level: 115 157 176 268 29 - 745
Married-couple family: 31 - - 21 29 - 81
With related children under 18 years: 31 - - - 29 - 60
Under 5 years only - - - - - - 0
Under 5 years and 5 to 17 years 31 - - - - - 31
5 to 17 years only - - - - 29 - 29
No related children under 18 years - - - 21 - - 21
Other family: 84 157 176 247 - - 664
Male householder, no wife present: - - - - - - 0
With related children under 18 years: - - - - - - 0
Under 5 years only - - - - - - 0
Under 5 years and 5 to 17 years - - - - - - 0
5 to 17 years only - - - - - - 0
No related children under 18 years - - - - - - 0
Female householder, no husband present: 84 157 176 247 - - 664
With related children under 18 years: 64 120 108 247 - - 539
Under 5 years only - 27 27 89 - - 143
Under 5 years and 5 to 17 years 13 46 12 71 - - 142
5 to 17 years only 51 47 69 87 - - 254
No related children under 18 years 20 37 68 - - - 125
SCHOOL ENROLLMENT
Enrolled in school: 712 1,026 668 418 688 - 3,512
Enrolled in nursery school, preschool: 49 67 - 56 - - 172
Enrolled in kindergarten: 67 79 - 56 - - 202
Enrollment in grade 1 to 8: 233 406 291 201 259 - 1,390
Enrolled in grade 9 to grade 12: 100 302 113 75 187 - 777
Enrollment in college or graduate school 263 172 264 30 242 - 971
EDUCATIONAL ATTAINMENT
Total 1,980 2,742 2,289 1,275 1,642 - 9,928
Less than 9th grade 93 26 53 33 41 - 246
9th to 12th grade, no diploma 442 220 354 112 91 - 1,219
High school graduate (and equivalency) 510 978 543 491 440 - 2,962
Some college, no degree 605 600 623 260 441 - 2,529
Associate degree 91 252 251 45 158 - 797
Bachelor's degree 122 452 298 203 199 - 1,274
Graduate or professional degree 117 214 167 131 272 - 901
April 2012Department of Planning and Buildings, City of Cincinnati
Source: US Census Report, 2010 5 of 9
College Hill
Census 2010
81* 82.01 82.02 84 111* 221.02 Totals
Census Tract
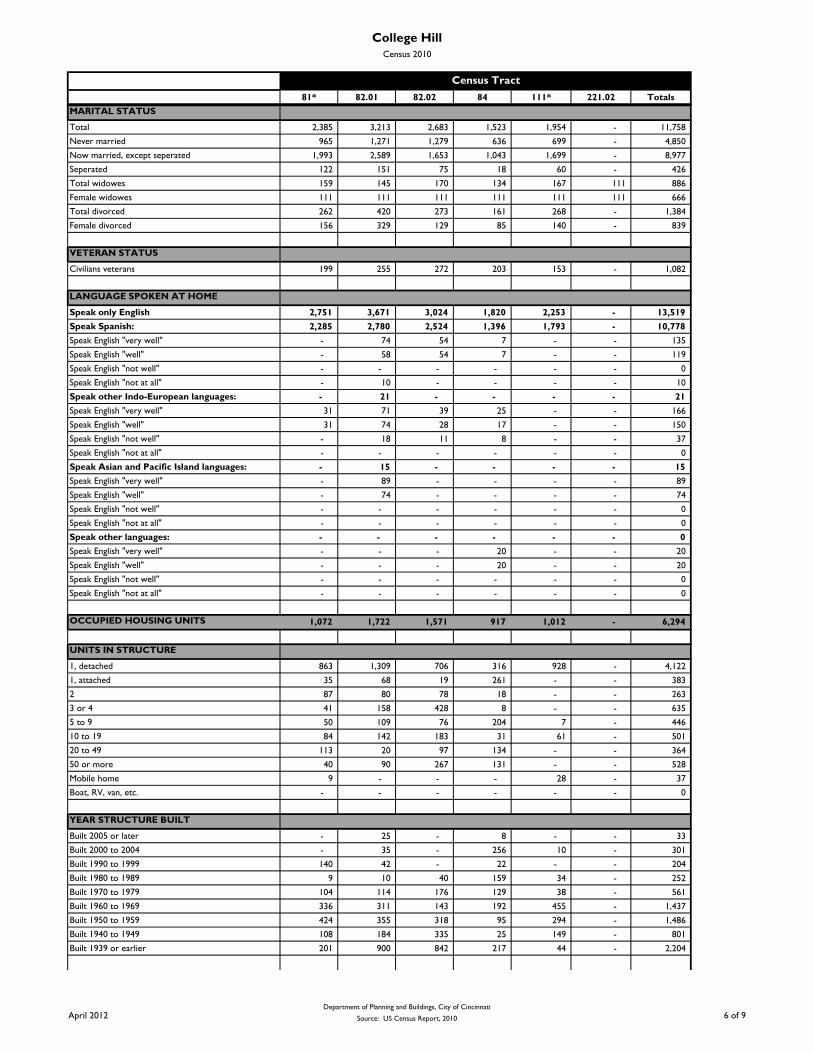
MARITAL STATUS
Total 2,385 3,213 2,683 1,523 1,954 - 11,758
Never married 965 1,271 1,279 636 699 - 4,850
Now married, except seperated 1,993 2,589 1,653 1,043 1,699 - 8,977
Seperated 122 151 75 18 60 - 426
Total widowes 159 145 170 134 167 111 886
Female widowes 111 111 111 111 111 111 666
Total divorced 262 420 273 161 268 - 1,384
Female divorced 156 329 129 85 140 - 839
VETERAN STATUS
Civilians veterans 199 255 272 203 153 - 1,082
LANGUAGE SPOKEN AT HOME
Speak only English 2,751 3,671 3,024 1,820 2,253 - 13,519
Speak Spanish: 2,285 2,780 2,524 1,396 1,793 - 10,778
Speak English "very well" - 74 54 7 - - 135
Speak English "well" - 58 54 7 - - 119
Speak English "not well" - - - - - - 0
Speak English "not at all" - 10 - - - - 10
Speak other Indo-European languages: - 21 - - - - 21
Speak English "very well" 31 71 39 25 - - 166
Speak English "well" 31 74 28 17 - - 150
Speak English "not well" - 18 11 8 - - 37
Speak English "not at all" - - - - - - 0
Speak Asian and Pacific Island languages: - 15 - - - - 15
Speak English "very well" - 89 - - - - 89
Speak English "well" - 74 - - - - 74
Speak English "not well" - - - - - - 0
Speak English "not at all" - - - - - - 0
Speak other languages: - - - - - - 0
Speak English "very well" - - - 20 - - 20
Speak English "well" - - - 20 - - 20
Speak English "not well" - - - - - - 0
Speak English "not at all" - - - - - - 0
OCCUPIED HOUSING UNITS 1,072 1,722 1,571 917 1,012 - 6,294
UNITS IN STRUCTURE
1, detached 863 1,309 706 316 928 - 4,122
1, attached 35 68 19 261 - - 383
2 87 80 78 18 - - 263
3 or 4 41 158 428 8 - - 635
5 to 9 50 109 76 204 7 - 446
10 to 19 84 142 183 31 61 - 501
20 to 49 113 20 97 134 - - 364
50 or more 40 90 267 131 - - 528
Mobile home 9 - - - 28 - 37
Boat, RV, van, etc. - - - - - - 0
YEAR STRUCTURE BUILT
Built 2005 or later - 25 - 8 - - 33
Built 2000 to 2004 - 35 - 256 10 - 301
Built 1990 to 1999 140 42 - 22 - - 204
Built 1980 to 1989 9 10 40 159 34 - 252
Built 1970 to 1979 104 114 176 129 38 - 561
Built 1960 to 1969 336 311 143 192 455 - 1,437
Built 1950 to 1959 424 355 318 95 294 - 1,486
Built 1940 to 1949 108 184 335 25 149 - 801
Built 1939 or earlier 201 900 842 217 44 - 2,204
April 2012Department of Planning and Buildings, City of Cincinnati
Source: US Census Report, 2010 6 of 9

College Hill
Census 2010
81* 82.01 82.02 84 111* 221.02 Totals
Census Tract
ROOMS
1 room - 18 101 8 12 - 139
2 rooms 18 10 68 151 55 - 302
3 rooms 239 235 457 106 36 - 1,073
4 rooms 126 323 458 252 22 - 1,181
5 rooms 206 467 240 305 118 - 1,336
6 rooms 377 385 184 132 250 - 1,328
7 rooms 199 299 144 77 201 - 920
8 rooms 99 74 90 17 187 - 467
9 or more rooms 58 165 112 55 143 - 533
YEAR HOUSEHOLDER MOVED INTO UNIT
Moved in 2005 or later 478 561 686 504 226 - 2,455
Moved in 2000 to 2004 122 424 338 251 245 - 1,380
Moved in 1990 to 1999 246 233 287 99 191 - 1,056
Moved in 1980 to 1989 76 135 108 73 67 - 459
Moved in 1970 to 1979 108 179 80 32 153 - 552
Moved in 1969 or earlier 192 158 73 23 79 - 525
VEHICLES AVAILABLE
No vehicle available 178 337 432 191 14 - 1,152
1 vehicle available 541 625 587 508 346 - 2,607
2 vehicles available 367 466 489 197 435 - 1,954
3 vehicles available 99 175 50 69 109 - 502
4 vehicles available 8 63 14 - 57 - 142
5 or more vehicles available 29 24 - 17 - - 70
SELECTED CHARACTERISTICS
Lacking complete plumbing facilities - - - - - - 0
Lacking complete kitchen facilities 6 7 11 - - - 24
No telephone service 103 135 158 87 92 119 694
SPECIFIED OWNER-OCCUPIED UNITS 1,918 2,087 1,308 749 1,951 - 8,013
VALUE
Less than $10,000 - - 11 - 28 - 39
$10,000 to $14,999 13 10 - - 12 - 35
$15,000 to $19,999 - - 9 - - - 9
$20,000 to $24,999 - - - - - - 0
$25,000 to $29,999 - - - - - - 0
$30,000 to $34,999 - - - - - - 0
$35,000 to $39,999 - - - - - - 0
$40,000 to $49,999 - 34 - - - - 34
$50,000 to $59,999 - - 10 - 15 - 25
$60,000 to $69,999 - 11 23 10 8 - 52
$70,000 to $79,999 49 42 19 - 11 - 121
$80,000 to $89,999 94 25 56 7 19 - 201
$90,000 to $99,999 81 104 30 18 35 - 268
$100,000 to $124,999 256 286 166 40 283 - 1,031
$125,000 to $149,999 106 158 187 105 196 - 752
$150,000 to $174,999 60 107 46 89 81 - 383
$175,000 to $199,999 12 80 32 41 24 - 189
$200,000 to $249,999 12 23 7 15 43 - 100
$250,000 to $299,999 - 20 8 15 51 - 94
$300,000 to $399,999 - 11 - 16 22 - 49
$400,000 to $499,999 - 8 - - - - 8
$500,000 to $749,999 - - - - - - 0
$750,000 to $999,999 - - - - - - 0
$1,000,000 or more - - - - - - 0
Median (dollars) 110,200$ 120,400$ 121,700$ 149,500 125,400$ - -
April 2012Department of Planning and Buildings, City of Cincinnati
Source: US Census Report, 2010 7 of 9

College Hill
Census 2010
81* 82.01 82.02 84 111* 221.02 Totals
Census Tract
MORTGAGE STATUS AND SELECTED
MONTHLY OWNERSHIP COSTS
Housing units with a mortgage: 456 705 461 268 538 0 2,428
Less than $200 0 0 0 0 0 0 0
$200 to $299 0 0 0 0 0 0 0
$300 to $399 0 12 11 0 0 0 23
$400 to $499 13 0 19 8 0 0 40
$500 to $599 13 23 10 0 12 0 58
$600 to $699 0 0 49 0 7 0 56
$700 to $799 6 45 0 10 0 0 61
$800 to $899 55 81 42 0 21 0 199
$900 to $999 22 32 26 16 11 0 107
$1,000 to $1,249 187 150 71 53 167 0 628
$1,250 to $1,499 51 183 138 97 203 0 672
$1,500 to $1,999 65 159 70 51 53 0 398
$2,000 to $2,499 44 20 18 18 11 0 111
$2,500 to $2,999 0 0 7 0 11 0 18
$3,000 or more 0 0 0 15 42 0 57
0
Housing units without a mortgage: 227 214 143 88 290 0 962
Less than $100 0 0 0 0 13 0 13
$100 to $149 0 0 0 0 0 0 0
$150 to $199 0 0 0 0 0 0 0
$200 to $249 0 0 7 0 19 0 26
$250 to $299 7 0 9 7 0 0 23
$300 to $349 12 23 9 0 24 0 68
$350 to $399 44 0 9 8 9 0 70
$400 to $499 57 104 22 49 32 0 264
$500 to $599 83 37 38 16 79 0 253
$600 to $699 24 26 21 0 54 0 125
$700 or more 0 24 28 8 60 0 120
SELECTED MONTHLY HOUSING COSTS AS
A PERCENTAGE OF HOUSEHOLD INCOME
Less than 10.0 percent 143 158 98 65 119 0 583
10.0 to 14.9 percent 122 134 67 61 92 0 476
15.0 to 19.9 percent 52 156 47 43 77 0 375
20.0 to 24.9 percent 104 91 28 32 125 0 380
25.0 to 29.9 percent 20 72 123 17 51 0 283
30.0 to 34.9 percent 22 30 49 0 54 0 155
35.0 to 39.9 percent 46 54 38 9 111 0 258
40.0 to 49.9 percent 101 132 42 56 59 0 390
50.0 percent or more 21 0 23 0 0 0 44
Not computed 9 0 0 0 0 0 9
SPECIFIED RENTER-OCCUPIED UNITS 1010 1855 1772 1300 371 0 6,308
GROSS RENT
With cash rent: 539 751 961 610 133 0 2,994
Less than $100 0 0 0 53 0 0 53
$100 to $149 28 0 0 8 0 0 36
$150 to $199 0 0 0 10 0 0 10
$200 to $249 0 0 22 11 0 0 33
$250 to $299 0 8 9 0 0 0 17
$300 to $349 0 0 73 0 0 0 73
$350 to $399 0 10 37 0 12 0 59
$400 to $449 10 28 52 23 0 0 113
$450 to $499 84 87 40 41 38 0 290
$500 to $549 90 99 106 74 7 0 376
$550 to $599 43 54 127 49 11 0 284
April 2012Department of Planning and Buildings, City of Cincinnati
Source: US Census Report, 2010 8 of 9

College Hill
Census 2010
81* 82.01 82.02 84 111* 221.02 Totals
Census Tract
$600 to $649 58 90 202 36 0 0 386
$650 to $699 83 40 92 41 0 0 256
$700 to $749 46 99 69 23 0 0 237
$750 to $799 0 96 10 10 0 0 116
$800 to $899 25 0 11 9 0 0 45
$900 to $999 0 39 43 28 0 0 110
$1,000 to $1,249 10 84 12 42 16 0 164
$1,250 to $1,499 49 0 20 0 29 0 98
$1,500 to $1,999 13 7 36 22 0 0 78
$2,000 or more 0 10 0 130 20 0 160
No cash rent 0 20 7 16 0 0 43
Median (dollars) 613 650 604 650 593 - X
GROSS RENT AS A PERCENTAGE OF
HOUSEHOLD INCOME
Less than 10.0 percent 11 59 19 19 0 0 108
10.0 to 14.9 percent 58 116 84 67 0 0 325
15.0 to 19.9 percent 52 45 70 29 29 0 225
20.0 to 24.9 percent 86 117 134 0 27 0 364
25.0 to 29.9 percent 38 86 89 94 0 0 307
30.0 to 34.9 percent 28 27 65 15 0 0 135
35.0 to 39.9 percent 0 6 11 32 20 0 69
40.0 to 49.9 percent 28 81 128 57 0 0 294
50.0 percent or more 207 214 352 257 57 0 1,087
Not computed 31 20 16 56 0 0 123
*Denotes that Census Tract/Block Group falls partially within the city boundary and partially within neighboring jurisdiction
**Neighborhood income averages calculated using the weighted mean formula
April 2012Department of Planning and Buildings, City of Cincinnati
Source: US Census Report, 2010 9 of 9