coastal and estuarine governance
TRANSCRIPT

Coastal and Estuarine Governance

MANAGEMENT OF ESTUARIES AND THEIR WATERSHEDSIN A NATIONAL SEASHORE CONTEXT
R.H. BurroughsUniversity of Rhode Island
Introduction
A recent development in coastal management is the recognition that landuses in watersheds affect water quality in adjacent estuaries. Throughout the 1970sand 1980s primary emphasis was placed on the control of point sources or pipedischarges through requiring increasinglevels of treatment. In the 1990s, techniquesfor control of pollution of estuaries will expand to incorporate the management ofland uses. The difficulty of instituting these substantial changes should not beunderestimated. First, they imply a change from managing pipe discharges tomanaging certain activities on the land. Second, they require that this managementof the landscape must occur in areas that are remote from the estuary to beprotected.
These enormous challenges, while new to national programs in waterpollution control, are not new to governance of natural resources in othercircumstances. The purpose of this paper is to indicate the parallel nature of theproblem identified above with that of park or seashore management. A secondobjective is to identify the types of solutions that have been applied in a coastal parksetting on Cape Cod.
Several terms provide a bridgebetween these two areas of investigation innatural resource management. Both park management and estuarine managementcontain cross-boundary problems. Thus, the ecosystem in question is affected by orextends into lands or waters outside a boundary of the protected area (Scho-newald-Cox, 1992). in this setting, the protected area, whether park or estuary,requires additional levels of control in nearby geographic regions.
In park management, the undesirable land manipulation is termed anexternal threat and consists of problems due to activities outside of park boundarieson public and private lands that threaten to degrade park resources (ConservationFoundation, 1985). Land uses outside of the park that produce water pollution withinit are one of several external threats. This water pollution connection is the one mostgermane to this study.
In the jargon of estuarine water quality protection, nonpoint sources includeeverything that is not an effluent from a pipe, and in impaired estuaries 45 percent ofthe problem has been attributed to nonpoint sources (Whittington, 1988). Thereauthorization of the Coastal Zone Management Act (1990) added Section 6217 onprotecting coastal waters. This section urges states with approved coastal programsto plan for control of nonpoint sources. Subsequent National Oceanic andAtmospheric Administration (NOAA) and Environmental Protection Agency (EPA)activities under that section have identified runoff from agriculture, silviculture andurban lands, in addition to hydromodification and erosion, as primary issues to beconsidered (EPA, 1991).
To summarize, an estuarine water quality problem is a type of externalthreat that may be caused by nonpoint sources. The cross-boundary nature of theproblem means that its solution requires that action be taken on lands that are not
147
under direct control of the management entity responsible for the water body beingimpacted.
The Cape Cod National Seashore
Controlling external threats has been an issue before the National ParkService for many years. For coastal units such as Cape Cod external threats aredue in some instances to nonpoint sources of pollution. The seashore, a unit of theNational Park system, includes the well-known ocean-facing outer beach of CapeCod. In addition and less well known are the many fresh and estuarine waters.Marine waters within one-half mile of the coast are also included, thereby extendingmanagement into nearby coastal waters (Cape Cod National Seashore, 1961). Thus,the protection of estuarine waters and their biota has been within the purview of theNational Park Service for many years.
However, in most instances the seashore does not include all the landwithin watersheds that affect water quality in estuaries. Furthermore, even when awatershed is substantially encompassed by seashore boundaries, there may still bea number of inholdings or privately owned lands within the protected zone. Thus,external threats to water quality may be generated on private lands within parkboundaries or from private lands within the watershed but outside of parkboundaries.
The nature of the water quality issues in five estuarine systems in oradjacent to the seashore has recently been summarized (Burroughs and Lee, 1991).The major external threats to aquatic areas may be noted in a few categories. Aprimary threat to most of the systems is the lack of saline flows into what wereformerly marsh areas. The Park Service does not control tide gates and musttherefore negotiate with adjacent landowners, primarily state and local government,prior to changing these flows. In every instance, enhancement of the estuarineenvironment depends upon reaching an agreement about saline flows.
A second concern is eutrophication. The surface, groundwater, and/oratmospheric inputs of nutrients may be a factor in estuarine decline. In manyinstances, land use practices in or adjacent to the park have been identified. Thesepractices include housing developments, solid or sewage waste disposal sites, andrunoff, among other factors. A third category includes potential problems derivedfrom marine or land spills of oil or other materials. Thus, the situation at the CapeCod National Seashore embodies a variety of cross-boundary issues, includingnonpoint source problems. Fortunately, in the establishment of the seashore anumber of mechanisms were created that may address these kinds of problems.
Techniques for Managing Cross-Boundary Problems on Cape Cod
The National Seashore on Cape Cod was established through substantialpurchase of private land. In this context the "Cape Cod formula" suspended thesecretary's authority to condemn improved property in areas of a town covered by azoning bylaw which had been approved by the secretary (Cape Cod NationalSeashore, 1961, Section 4 (b)(2)). In theory, some cross-boundary issues would besettled, not through federal purchase of adjacent land, but rather through localcontrol of land uses in such a manner that the uses remained compatible with the
148

protected status of the seashore. Its success in the park and seashore context issuch that many units established after 1961 adopted similar provisions at theirinception.
A second approach is the Advisory Commission (Cape Cod NationalSeashore 1961, Section 8). Composed of 10 members, the group hadrepresentatives from town, county, state and federal governments. Through thecommission, the secretary consults about commercial, industrial and recreationalland use within the seashore. Thus, activities within the protected area that mightaffect adjacent environments are discussed with regional representatives.
Many of the participants in the commission found it to be quite successful(Foster, 1985). The membership consisted of seashore supporters as well as opponents. In addition, representatives were drawn from towns, regional and state governmental entities. Eventually the Park Service developed a cooperative attitudetoward the group, and local residents recognizing the seashore's inevitability choseto become actively involved in advisory activities.
Finally, groups interested in the goals of the seashore often participate as"friends." As such, citizens from the area mayactconstructively as advocates for theseashore and/or provide services for its operation.
The mechanisms outlined above created a way to addresscross-boundaryproblems. Some could be resolved through condemnation or zoning while othersmight be approached through advisory mechanisms. These tools should be evaluated for their relevance to the design of institutional mechanisms for nonpointsource control in coastal areas. Furthermore, Park Service experience with theapplication of these tools in a varietyof locations may be examined to ascertain theirutility for nonpoint source control.
Conclusions
A recent analysis of external threats to Cape Cod National Seashoreestuaries has demonstrated that water quality may be jeopardized by nonpointsources. Frequently, these nonpoint sources are cross-boundary in origin. Thus, theland on which the pollution threat originates is not owned by the Park Service. Itmay be a private inholding within the seashore boundary or land adjacent to theseashore. As a result, effective management of estuarine water quality within thepark may require coordination with land owners and users outside of the seashoreboundary.
Revisions of the Coastal Zone Management Act catling for increasedcontrol of nonpoint sources from lands outside of the legally defined coastal zone inmany states require federal and state governments to develop solutions to externalthreats similar to those confronted by the Park Service. A nonpoint sourceoutside ofthe seashore boundary that affects water quality in estuaries within the boundary isanalogous to the problem faced in implementing successful programs under theCZMA revisions. Numerous tools have been developed in the park/seashore settingto meet external threats. The tools used on Cape Cod include: condemnation, theCape Cod formula, an Advisory Commission, and friends. Each should be evaluatedfor applicability andeffectiveness in meeting nonpoint source control problems in theestuarine environment.
149

References
Burroughs, R.H.,and Virginia Lee. 1991.Cape Cod National Seashore Estuaries: Quidance formarine environmental monitoring and citizen participation. In: Technical ReportNPS/NARURI/NRTR-9W2. U.S. Department of the Interior, National Park Service. 68 p.
Cape Cod National Seashore Enabling Act. 1961. Public Law 87-126.
Coastal Zone Management Act Amendments of 1990. Public Law 101-508.
Conservation Foundation. 1985. National Parks for a New Generation: Visions, Realities.Prospects. The Conservation Foundation,Washington, D.C. 407 p.
Environmental Protection Agency. 1991. Proposed guidance specifying management measuresfor sources of nonpoint pollution in coastalwaters. EPAOfficeof Water,Washington, D.C.
Foster. Charles H.W. 1985. The Cape Cod National Seashore: A Landmark Alliance. UniversityPress of New England, Hanover, N.H. 125 p.
Schonewatd-Cox, Christine, M. Buechner, R. Sauvajot and B.A. Wilcox. 1992. Cross-boundarymanagement between national parks and surrounding lands: A review and discussion.Environmental Management 16:273-282.
Whittington. William H. 1988. Statement, Coastal water quality hearing. Committee onMerchant Marine and Fisheries, House of Representatives, Serial No. 100-77. pp. 51-77.
150

A WETLAND/UPLAND LAND COVER CLASSIFICATION SYSTEMFOR USE WITH REMOTE SENSORS
Victor V. Klemas
University of Delaware
Steven R. Hoffer
Lockheed Engineering & Sciences Co.
Richard Kleckner
U.S. Geological Survey
Douglas NortonU.S. EPA/EPIC
Bill O. Wilen
U.S. Fish and Wildlife Service
Abstract
A land cover classification system for wetlands, submerged ecosystemsand uplands has been developed to satisfy the immediate needs of the NationalOceanic and Atmospheric Administration Coastwatch Change Analysis Program (C-CAP) and several components of the Environmental Protection Agency's Environmental Monitoring and Assessment Program (EMAP). Theclassification system hasthe following attributes:
It is hierarchial with special consideration for unique characteristicsof remote sensors and GIS;
It is a hybrid of the Anderson and Cowardin systems, minimizingthe need to define new classes;
It emphasizes wetland, deepwater habitat and upland categories tomeet special requirements of the C-CAP and EMAP programs;
The classes are defined in terms of land cover, avoiding land-useterms, to eliminate confusionand improve reliability of detection;
It is designed for use with satellite (TM, SPOT) data, yet capableof incorporating aircraft and field data at lowerlevels;
It is compatible with the National Wetlands Inventory (NWI), andother programs.
The system has been modified for more general land cover classificationduring meetings with representatives from U.S. Geological Survey, U.S. Fish andWildlife Service, NOAA, EPA and other government agencies. Also, comments from
151

five NOAA regional workshops were incorporated intothe classification developmentprocess.
Introduction
Coastal wetlands with emergent and submergent vegetation (saltmarshes,mangroves, macroalgae and submerged aquatic vegetation) support most marinefinfish and shellfish resources in the coastal United States. Yet coastal wetlands arebeing destroyed by dredge-and-fill operations, impoundments, toxic pollutants,eutrophication, and, for submergents, excessive turbidity. Continued loss of thesewetlands may lead to a collapse of coastal ecosystems and associated fisheries.Documenting losses and gains in coastal wetlands is critical to their conservationand to effective management of marine fisheries (Haddad and McGarry, 1989;Haddad and Ekberg, 1987). Such information is necessary to respond to thepresident's call for"no net loss of wetlands."
Current projections for U.S. population growth in the coastal zone suggestaccelerating losses of wetlands and adjacent habitats, as waste loads and competition for limited space and resources increase (U.S. Congress, 1989). Agencies responsible for coastal management must be kept current with regard to extent andstatus of wetlands and adjacent uplands. Therefore, timely quantification of wetlandarea, location and rate and cause of loss is needed now (Kean et al., 1988).Management decisions can then be proactive and based on fact rather thansupposition of the effects of coastal development on coastal wetlands and wetland-dependent fisheries.
Changes in wetlands are occurring too fast and too pervasively to bemonitored only once a decade, as is presentlybeing done by key federal and stateprograms. Therefore, the National Oceanic and Atmospheric Administration, withinits Coastal Ocean Program, has initiated a cooperative interagency and state-federaleffort to map coastal wetland and adjacent upland cover and change in the coastalregion of the United States every two to five years and to monitor annually areas ofsignificant change. The program is called the NOAA Coastwatch Change AnalysisProgram (C-CAP). Remote sensing (from satellites and aircraft) and othertechniques will be used to quantify and mapcoastal wetlands and adjacent uplands.The first cycle will document status and change (retroactively). The database,increasing with each monitoring cycle will be an invaluable resource for research;evaluation of local, state and federal wetland management strategies; andconstruction of predictive models.
In the first year, the NOAA C-CAP program concentrated on protocoldevelopment and prototype studies in the Chesapeake Bay and coastal NorthCarolina. Through a series of workshops and working group meetings, adocumented standard protocol for classifying and mapping habitat location,abundance and change in the U.S. coastal zone is being developed. A critical part ofthe protocol is the selection of a land cover classification system for wetlands anduplands that meets the needs of this and other programs.
Unfortunately, there is a multitude of classification schemes being used byfederal, state and county agencies to inventory wetland and deepwater habitat.Some of these classification schemes differ to the point of making it impossible tocross-reference and exchangedata between them. Also, the need for more frequent
152

updates of wetland and deepwater habitat inventories is forcing mapping and changedetection programs to make more efficient use of satellite and aircraft remotesensing data. Therefore, we have attempted to design a land cover classificationsystem for use with remote-sensing data that would meet the needs of most wetlandand deepwater habitat mapping programs.
Need for a Revised Classification System
Since the development and widespread use of remote sensing techniques,the Anderson land-use and land cover classification system (Anderson et al., 1976),or modified versions of it, have been used in numerous land-use mapping projects.This classification system includes only the more generalized first and second levels.The system satisfies the three major attributes of the classification process asoutlined by Grigg (1965): it gives names to categories by simply using acceptedterminology; it enables information to be transmitted; and it allows inductivegeneralizations to be made. The classification system is capable of furtherrefinement on the basis of more extended and varied use. At the more generalizedlevels it meets the principal objective of providing a land-use and land coverclassification system for use in land-use planning and management activities.Despite improvements resulting from widespread use of the system, the objective ofproviding a standardized system of land-use and land cover classification for nationaland regional studies has still not been attained.
A good overview of the historical development of wetlands classificationsystems can be obtained from Cowardin (1977). In 1974 the U.S. Fish and WildlifeService began planning for a new National Wetland Inventory and after examinationof the existing classifications decided to design a new one. The FWS's wetlandclassification system (Cowardin et al., 1979) was developed by a team of wetlandecologists with the assistance of local, state and federal agencies. After majorrevisions and extensive field testing, the Cowardin Classification System wasofficially adopted by FWS in 1980 (Wilen, 1990).
The structure used in the Cowardin Classification (Cowardin et al., 1979) ishierarchical and progresses from provinces at the most general level, to majorecological systems and subsystems, to habitat classes, subclasses and orders, andfinally to the habitat type, which is formed by adding modifiers for water regime andwater chemistry to the order. Where no orders have been defined, these samemodifiers may be applied to classes or subclasses. Within each of the five ecologicalsystems, the same parameters are not always used at the same level. Althoughconsistency is conceptually appealing, it is not always ecologically meaningful or, insome cases, even possible. For example, marine and estuarine systems aresubdivided on the basis of tidal inundation, whereas the riverine system issubdivided first on the basis of stream gradient, water velocity, stream bedcomposition and presence or absence of a floodplain.
Some county, state and federal programs map uplands using the Andersonclassification system and use the Cowardin system for the wetlands. Modifying andcombining classification systems for special applications has been quite common,particularly at the state and local levels. A good example is Florida, which has atleast half-a-dozen different schemes used by its counties and other agencies. As aresult, much time and money are wasted in duplicate data collection efforts.
153

Proposed Classification System -
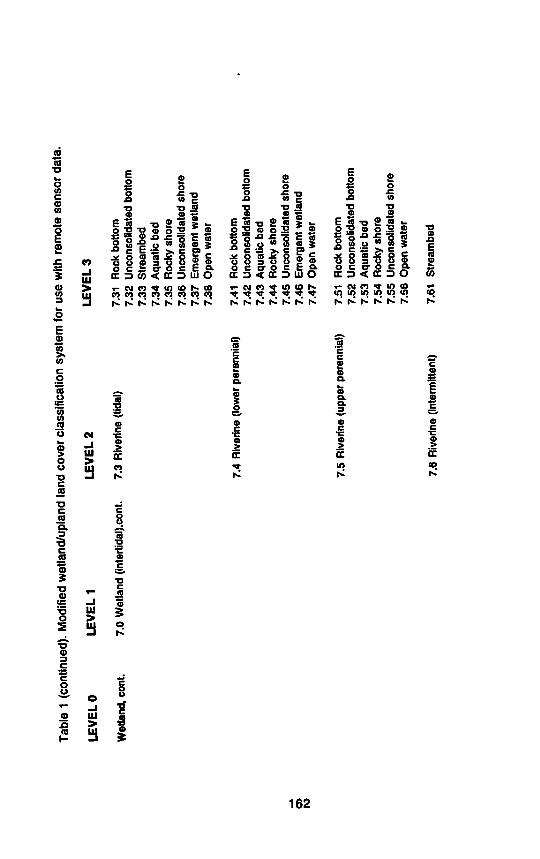
The proposed wetland and land cover classification system for use withremote sensing data is shown in Table 1. The system is a hybrid of the Andersonand Cowardin classification systems with some modifications to accommodate remote sensing data and the unique requirements of the C-CAP and EMAP programs.Since these programs concentrate on wetlands, submerged ecosystems andadjacent uplands, we divided the hierarchial system at the top into three superlevel(Level 0) categories. These are shown in Table 1 as uplands, wetlands, and waterand submerged land. All remote sensors can discriminate these three categories.
Level 1 classes were chosen to be similar to the Level 1 classes in
Anderson et al., 1976. At Levels 2 and 3 the upland classes still resemble theAnderson system with some significant modifications, including an emphasis on landcover instead of land use. The Level 2 and 3 classes for wetlands and water and
submerged lands ate based on the Cowardin scheme, which is more ecologicallyoriented.
Although land-use data obtained at any level should not be restricted to anyparticular user groups nor to any particular scale of presentation, information atLevels 1 and 2 in general would be of interest to users who desire data on anationwide, interstate or statewide basis. More detailed land-use and land coverdata, such as those categorized at Levels 3 and 4, usually will be used morefrequently by those who need local information at the intrastate, regional, county ormunicipal level. At this time we decided not to develop a more detailed breakdown ofclasses beyond Level 3. At Levels 4 and 5, each program is likely to have its ownunique needs, and attempting to make a universally acceptable breakdown ofclasses at those levels would be doomed to failure.
Uplands
The Level 1 classes for upland are similar to the Level 1 classes in theAnderson system, except that land-use terms were excluded (e.g., agricultural land,rangeland, etc.) and replaced by land cover designations (Anderson et al., 1976).Rangeland was replaced by grassland to ensure that no shrub-brushlands wereincluded. A new category, woody, was formed to include both trees and shrubs. Thiswas done in part to alleviate the problem of separating various sizes of trees andshrubs with satellite remote sensors and allowing that separation to be done at alower level where forest (treelano) and shrub (shrublano) are shown as separatecategories that can be distinguished by airborne remote sensors.
The developed and exposed land Level 1 categories are somewhat similarto the Anderson urban or built-up land and barren land classes, respectively. Forinstance, exposed land is land of limited ability to support life and in which less thanone-third of the area has vegetation or other cover. In general, it is an area of thinsoil, sand or rocks. Vegetation, if present, is more widely spaced and scrubby thanthat in the shrub category. Unusual conditions, such as a heavy rainfall, occasionallyresult in growth of a short-lived, more luxuriant plant cover. Wet, nonvegetatedexposed lands are included in the wetland categories.
Land may appear barren because of human activity. When it mayreasonably be inferred from the data source that the land will be returned to its
154

former use, it is not included in the exposedcategory but classified on the basis ofits site and situation. Cultivated land, for example, may be temporarily withoutvegetative cover becauseof cropping season ortillage practices. Similarly, industrialland may have waste and tailing dumps, and areas of intensively managed forestland may have clearcut blocks evident. When neither the former nor the future usecan be discerned and the area is obviously in a state of land-use transition, it isconsidered to be exposed land, in order to avoid inferential errors.
Some of the Level 2 classes differ so significantly from those of theAnderson system, that brief definitions will be provided here. High intensitydeveloped land refers to heavily built-up urban centers. Concrete and asphalt withsignificant land area covered by very little vegetation occur in these areas. Lowintensity developed land refers mainly to single family housing areas that containlandscaped and vegetatedareas around the buildings.
Unmanaged grassland encompasses lands dominated by naturallyoccurring grasses and forbs. Managed grasslands are areas in which human activityhas an influence in maintaining the area. Examples of these areas are yards, golfcourses, forest or shrub areas converted to grassland, or areas of permanentgrassland in which man haschanged the natural species composition. This categoryincludes pastures that containvegetation that grows as fallow. Pastures are used forgrazing activities, such as farmland maintained as grassland, orare used for growingand harvesting of hay, straw and kept fallow for future animal feeding. Detaileddefinitions of all classes and subclasses in Table 1 are being prepared by theauthors in a separate document.
Wetlands
In general terms, wetlands are lands where saturation with water is thedominant factor determining the nature of soil development and the types of plantandanimal communities living in the soil andon its surface. The single feature thatmost wetlands share is soilor substrate that is at least periodically saturated with orcovered by water (Cowardin et al., 1979).
The upland limit of wetland is designated as: the boundary between landwith predominantly hydrophytic cover and land with predominantly mesophytic orxerophytic cover; the boundary between soil that is predominantly hydric and soilthat is predominantly nonhydric; or in the caseofwetlands without vegetation orsoil,the boundary between land that is flooded or saturated at some time during thegrowing season each year and land that is not.
The wetlands breakdown at Levels 2 and 3 is closely related to theCowardin system (Cowardin et al., 1979). Level 2 includes Cowardin's five majorsystems, i.e. marine, estuarine, riverine, lacustrine and palustrine (Table 1).However, we have used Cowardin's subsystem designators (e.g., intertidal, tidal,etc.) as modifiers of our Level 2 categories. The main reason why we usedCowardin's subsystem designators (intertidal, tidal, etc.) as modifiers rather thanusing them as a separate level (e.g., Level 3) was that we did not want to relegatethe classes describing the bottom and vegetation types to Level 4. Cowardin'ssubsystem layers are also nearly impossible to detect by remote sensing.
Furthermore, all vegetated or bare surfaces that are subtidal or have acontinuously submerged substrate have been moved into the water and submerged
155

land superclass (Level 0). As a result, the Level 2 categories for "wetlands" becomemarine (intertidal), estuarine (intertidal), riverine (tidal, lower perennial, upperperennial, intermittent, and unknown perennial), lacustrine (littoral) and palustrine(wetland). At Level 3 we differentiate the various bottom, shore and wetland typesfollowing closely the scheme proposed by Cowardin at his "class" level. Thusestuarine (intertidal) breaks down at Level 3 into aquatic bed, reef, streambed, rockyshore, unconsolidated shore, emergent wetland, scrub/shrub wetland, and forestedwetland.
The definition of Level 3 classes is identical to those in Cowardin et al.
(1979). Six classes are based on substrate and flooding regime: rock bottom with asubstrate of bedrock, boulders, or stones; unconsolidated bottom with a substrate ofcobbles, gravel, sand, mud, or organic material; rocky shore with the same substrates as rock bottom, unconsolidated shore with the same substrates as unconsolidated bottom; streambed with any of the substrates; and reef with a substratecomposed of the living and dead remains of invertebrates (corals, mollusks orworms). The bottom classes are flooded all or most of the time and the shoreclasses are exposed most of the time. The class streambed is restricted to channelsof intermittent streams and tidal channels that are dewatered at tow tide. The lifeform of the dominant vegetation defines the five classes based on vegetative form:aquatic bed, dominated by plants that grow principally on or below the surface of thewater; moss-lichen wetland, dominated by mosses or lichens; emergent wetland,dominated by emergent herbaceous angiosperms; scrub-shrub wetland, dominatedby shrubs or small trees; and forested wetland, dominated by large trees.
Water and Submerged Land
Traditionally, the concept of wetland had not included the ocean or thedeeper areas of lakes, rivers and estuaries. These places, however, are ecologicallyinseparable from the typical shallow wetlands that border them. The Cowardinclassification defines subtidal coastal areas as deep-water habitats.
The boundary between wetland and deepwater habitat in the marine andestuarine systems coincides with the elevation of the extreme low water of springtide; permanently flooded areas are considered deepwater habitats in these systems. The boundary between wetland and deepwater habitat in the riverine andlacustrine systems lies at a depth of 2 m (6.6 feet) below low water; however, ifemergents, shrubs or trees grow beyond this depth at any time, their deepwateredge is the boundary. The 2-m lower limit for inland wetlands was selected becauseit represents the maximum depth to which emergent plants normally grow.
At first we attempted to separate water and submerged land into two Level0 superclasses. However, it seemed to be more logical and intellectuallysatisfying tolump the two classes together at Level 0, especially since the cover in each case iswater (Table 1). Also, strictly speaking, there is no such thing as bottomless water.
At Levels 2 and 3 we again relied heavily on the Cowardin system. TheLevel 2 classes consist of Cowardin's "system" categories with their appropriatemodifiers.They include marine (subtidal), estuarine(subtidal), riverine (tidal), riverine(lower perennial), riverine (upper perennial), riverine (unknown perennial) andlacustrine (limnetic). As shown in Table 1, at Level 3 we use Cowardin's class
156

categories. Thus for estuarine (subtidal) the Level 3 breakdown consists of rockbottom, unconsolidated bottom, aquatic bed, reer" and open water.
At first glance, the close adherence to the Cowardin scheme seems tointroduce much repetition, e.g., there are four Level 2 riverine classes under waterand submerged land, causing the same Level 3 categories to be repeated fourtimes. This apparent repetition is, however, the price we must pay ifwe wish to usemap data from other programs, such as the NWI, which are based on the Cowardinsystem. At a minimum, we have to beable to crosswalk between different programs.
Conclusions
A land cover classification system for wetlands, submerged ecosystemsand uplands hasbeendeveloped which hasthe following attributes:
It is hierarchial with special consideration for unique characteristics of remotesensors and geographic information systems (GIS);
It is a hybrid of the Anderson and Cowardin systems, minimizing the need todefine new classes;
It emphasizes wetland, deepwater habitat and uplands categories to meetspecial requirements of the C-CAP and EMAP programs;
The classes are defined in terms of land cover, avoiding land use terms, toeliminate confusion and improve reliability of detection;
it is designed for use with satellite (TM, SPOT) data, yet capable ofincorporating aircraft and field data at lower levels;
It is compatible with the National Wetlands Inventory (NWI), and otherprograms.
The proposed classification system was designed to be useful to resourcemanagers and researchers for studying and inventorying primarily wetlands,deepwater habitats and adjacent uplands. Therefore, at the top the entire system isdivided Into uplands, wetlands and water and submerged lands. Most ofthe uplandscategories are identical or similar to the ones used and defined in Anderson et al.(1976). On the other hand, the wetland and water and submerged land categoriesare similar to those defined by Cowardin et al. (1979). All classes in the proposedclassification system are uniquely defined andthe system as a whole meets most ofthe classification criteria outlined by Anderson et al. (1976). A report containingdefinitions of all classes and subclasses used in the proposed system is beingprepared by the authors.
We fully realize that the breakdown of the upland classes may not bedetailed enough for other, non-wetland-oriented programs. Therefore we hope tomodify our uplandsclassification scheme In the future to accommodate the needs ofland use and land cover mapping programs being conducted by the U.S. ForestService, the U.S. Soil Conservation Service, the Bureau of Land Management, and
157

other programs concerned with arid lands, grasslands, etc. Specifically, we plan totest our ability to "crosswalk* from our land cover categories to those contained insystems used by other programs such as the U.S. Fish and Wildlife Service GapAnalysis Program, the Natural Resources Inventory, and the State Natural HeritagePrograms. We will also determine our compatibility with global classification systemsbeing developed by United Nations agencies.
The classification system was developed during joint meetings withrepresentatives from various government agencies, including USGS, EPA, NOAA,USFWS, etc. Also, comments from five regional workshops were incorporated intothe classification development process. We believe that as a result of theseworkshops and planning meetings, we have produced a practical classificationsystem for inventorying and studying changes in wetlands, deepwater habitats andadjacent uplands not only for NOAA's C-CAP and EPA's EMAP programs but alsofor other programs at the national and state level.
Acknowledgements
Many people contributed to this effort at workshops, meetings and throughprivate communications. We wish to thank all of them, especially the following whohave helped us continuously over several years to develop this classification system:Jerome E. Dobson, Oak Ridge National Laboratory; Randolph L. Ferguson,NOAA/National Marine Fisheries Service; Frank Golet, University of Rhode Island;Kenneth D. Haddad, State of Florida Department of Natural Resources; JimmyJohnston, U.S. Fish and Wildlife Service; Kathy Lins, U.S. Geological Survey; andJames P. Thomas, NOAA/National Marine Fisheries Service.
NOAA's Coastal Ocean Program provided funding for five regionalworkshops and travel for the senior author to meetings leading to this consensusreport.
References
Anderson, J.R., E.E. Hardy. J.T. Roach and R.E. Witman. 1976. A Land Use and Land CoverClassification System for Use with Remote Sensor Data. U.S. Geological Survey ProfessionalPaper 864, Washington. D.C. 28 p.
Cowardin, L.M. 1978. Wetland classification in the United States. Journal of Forestry, Oct.1978, pp. 666-668.
Cowardin, LM., V. Carter, F.C. Golet and E.T. LaRoe. 1979. A Classification of Wetlands andDeepwater Habitats of the United States. Office of Biological Services, U.S. Fish and WildlifeService. FWS/OBS-79/31.103 p.
Grigg, David. 1965. The logic of regional systems. Annals Assoc. American Geographers55(3):465-491.
Kean. T.H., C. Campbell. B. Gardner and W.K. Reilly. 1988. Protecting America's Wetlands: AnAction Agenda. The Final Report of the National Wetlands Policy Forum. The ConservationFoundation, Washington, D.C. 69 p.
158

Klemas, V.. J.P. Thomas and J.B. Zaitzeff, eds. 1988. Remote Sensing of Estuaries:Proceedings of a Workshop. U.S. Dept. of Commerce. NOAA and U.S. Government PrintingOffice, Washington, D.C.
National Oceanic and Atmospheric Administration. 1985. National Estuarine Inventory DataAtlas. Volume I: Physical and Hydrologic Characteristics. U.S. Department of Commerce,Washington, D.C.
U.S. Congress. 1989. Coastal Waters in Jeopardy: Reversing the Decline and ProtectingAmerica's Coastal Resources. Oversight Report of the Committee on Merchant Marine andFisheries. Serial No. 100-E. U.S. Government Printing Office. Washington. D.C. 47 p.
Wilen. B.0.1990. The U.S. Fish and Wildlife Service's National Wetlands Inventory. U.S. Fishand Wildlife Service. Biological Report 90(18):9-19.
159

o»o
Table 1. Modified wetland/upland land cover classification system for use with remote sensor data.
LEVEL 0
Upland
LEVEL 1
1.0 Developed (solid cover)
2.0 Cultivated land
3.0 Grassland (herbaceous)
4.0 Woody
LEVEL 2
1.1 High intensity
1.2 Low intensity
2.1 Woody
2.2 Herbaceous
3.1 Herbaceous
4.1 Deciduous
4.2 Evergreen
4.3 Mixed
LEVEL 3
1.11 Residential
1.12 Commercial
1.13 Industrial
1.14 Transportation, communications and utilities
1.21 Residential
1.22 Commercial
1.23 Industrial
1.24 Transportation, communications and utilities1.25 Rural development
2.11 Orchards/groves2.12 Vine/bush
2.21 Cropland
3.11 Unmanaged3.12 Pasture
3.13 Groomed
4.11 Forest
4.12 Shrub
4.21 Forest
4.22 Shrub
4.31 Forest
4.32 Shrub

o>
Table 1 (continued). Modified wetland/upland land cover classification system for use with remote sensor data.
LEVEL 0 LEVEL 1 LEVEL2
Upland, cant 5.0 Exposed land 5.1 Soil
5.2 Sand
5.3 Rock
6.0 Snow and ice
Wetland 7.0 Wetland (intertidal)
5.4 Evaporite deposits
6.1 Snow and ice
7.1 Marine
7.2 Estuarine (intertidal)
7.2 Estuarine (intertidal),cont.
LEVEL 3
5.11 Transitional developed
5.21 Beach/dune complex5.22 Sandy, other than beach/dune complex5.23 Extraction pits
5.31 Outcrops5.32 Quarries/mines
5.33 Unconsolidated
5.41 Dry salt flats
6.11 Perennial snowfields
6.12 Glaciers
7.11 Aquatic bed7.12 Reef
7.13 Rocky shore7.14 Unconsolidated shore
7.21 Aquatic bed7.22 Reef
7.23 Streambed
7.24 Rocky shore7.25 Unconsolidated shore
7.26 Emergent wetland7.27 Scrub/shrub wetland
7.28 Forested wetland
o>ro
Table1(continued).Modifiedwetland/uplandlandcoverclassificationsystemforusewithremotesensordata.
LEVEL0LEVEL1LEVEL2LEVEL3
Wetland,cont.7.0Wetland(intertidal).cont.7.3Riverine(tidal)7.31Rockbottom"7.32Unconsolidatedbottom
7.33Streambed
7.34Aquaticbed7.35Rockyshore7.36Unconsolidatedshore
7.37Emergentwetland7.38Openwater
7.4Riverine(lowerperennial)
7.5Riverine(upperperennial)
7.6Riverine(intermittent)
7.41Rockbottom
7.42Unconsolidatedbottom
7.43Aquaticbed7.44Rockyshore7.45Unconsolidatedshore
7.46Emergentwetland7.47Openwater
7.51Rockbottom
7.52Unconsolidatedbottom
7.53Aquaticbed7.54Rockyshore7.55Unconsolidatedshore
7.56Openwater
7.61Streambed

o>CO
Table 1 (continued). Modified wetland/upland land cover classification system for use with remote sensor data.
LEVEL 0 LEVEL 1 LEVEL 2 LEVELS
Wetland, cont 7.0 Wetland (intertidal). cont. 7.7 Riverine (unknown perennial)
7.8 Lacustrine (littoral)
7.9 Palustrine (wetland)
7.71 Rocky7.72 Unconsolidated bottom
7.73 Aquatic bed7.74 Rocky shore7.75 Unconsolidated shore
7.76 Emergent7.77 Open water
7.81 Rock bottom
7.82 Unconsolidated bottom
7.83 Aquatic bed7.84 Rocky shore7.85 Unconsolidated shore
7.86 Emergent7.87 Open water
7.91 Rock bottom
7.92 Unconsolidated bottom
7.93 Aquatic bed7.94 Unconsolidated shore
7.95 Moss-lichen
7.96 Emergent7.97 Scrub/shrub
7.98 Forested
7.99 Open water

»
Table 1 (concluded). Modified wetland/upland land cover classification system for use with remote sensor data
LEVEL0
Water and
submerged land
LEVEL 1 LEVEL 2
8.0 Water and submerged land 8.1 Marine (subtidal)
8.2 Estuarine (subtidal)
8.3 Riverine (tidal)
8.4 Riverine (lower perennial)
8.5 Riverine (upper perennial)
LEVEL 3
8.11 Rock bottom
8.12 Unconsolidated bottom
8.13 Aquatic bed8.14 Reef
8.15 Open water
8.21 Rock bottom
8.22 Unconsolidated bottom
8.23 Aquatic bed8.24 Reef
8.25 Open water
8.31 Rock bottom
8.32 Unconsolidated bottom
8.33 Aquatic bed8.34 Open water
8.41 Rock bottom
8.42 Unconsolidated bottom
8.43 Aquatic bed8.44 Open water
8.51 Rock bottom
8.52 Unconsolidated bottom
8.53 Aquatic bed8.54 Open water
8.6 Riverine (unknown perennial) 8.61 Rock bottom8.62 Unconsolidated bottom
8.63 Aquatic bed8.64 Open water

o>en
Table1(concluded).Modifiedwetland/uplandlandcoverclassificationsystemforusewithremotesensordata
LEVEL0LEVEL1LEVEL2LEVEL3
Waterand
submergedland,cont
Openwater
8.0Waterandsubmergedland,cont.
8.7Lacustrine(limnetic)8.71Rockbottom
8.72Unconsolidatedbottom
8.73Aquaticbed8.74

THE COASTAL WETLANDSPLANNING, PROTECTION AND RESTORATION ACT
R.H. Schroeder Jr.
U.S. Army Corps of Engineers
Introduction
Across the nation coastlines are in trouble. This is true on the East Coast, theWest Coast, and the Gulf Coast, but nowhere is it more true than along theLouisiana coast. It is in Louisiana that 80 percent of the annual national loss ofcoastal wetlands is occurring. Each year 31 square miles of Louisiana's coastalwetlands convert to open water. Unless something is done, it is estimated that overthe next 50 years one-half of this unique ecosystem will disappear.
Loss of these wetlands imposes an immense environmental and economic hardship on the coastal area. The bounty produced by these wetlands, some 30 percentof the nation's total harvest of commercial seafood, has a value annually of $850million. Louisiana produces more wild fur and hides than any other state in thenation with an estimated current value of $19 million per year. Louisiana's coastalwetlands are located atthe southern end of the great Mississippi Flyway. Annually 4million ducks and geese, some 66 percent of the waterfowl that use that flyway,spend the winter in the Louisiana coastal marshes. Over 3 million man-days ofhunting, valued at over $10 million, is directly attributable to these wetlands. Inaddition to this direct economic loss, the loss of Louisiana's coastal wetlandsthreatens a way of life and a culture unique to this area, but important to the world.
Why arethese wetlands disappearing? No one causecan be singled outas theculprit. Coastal processes are far too complex to permit such an easy answer. Eachforce, both natural and human induced, acts synergistically with the other forcesintensifying and accelerating the affects. Some causes which are natural—sea levelrise, subsidence, compaction, salt water intrusion, and erosion have causedsignificant changes in the relative land and water surface elevations. While thesenatural forces are important, man's actions have played and continue to play a majorrole in causing the loss of Louisiana'scoastal wetlands. Flood controlworks such asleveeing of the Mississippi River and cutting off this source of sediments for thecoastal area have had a major role as have activities relative to the production,exploration, and development of the oil and gas industry in the area. Theseeconomic development activities interact with and intensify the natural processesresulting in the continuation of the coastal wetland losses. As these wetlands arelost the Gulf of Mexico estuarine dependent fishery will decline. Over the next 50years it is expected that the recreational and commercial fish and wildlife harvest willbe down about70 percent. The impact on the economywill be a $274 million annualloss. Over that same time period an estimated $300 million in wetlands real estatewould erode into the Gulf of Mexico. Navigation canals, hurricane protection levees.Federal andstate highways, railroads, pipelines, utility and telephone lines would allhave to be relocated. These would add many millions of dollars to the alreadydevastating economic effects caused by the erosion of Louisiana's coast.
167

Attempted Solutions
While there has not yet been a well-coordinated plan for the preservation ofLouisiana's coastal marshes, there have been numerous attempts by both theprivate and the public sectors. These have met with limited success in some cases,great success in other cases, and no success in still others. On the private side oilcompanies have had success in armoring some of the barrier islands and inpreventing erosion along some oil field canals. In the agricultural sector, mixedresults been obtained through the development of numerous marsh managementplans. In the public sector, the Corps of Engineers has had several projects that dealdirectly with coastal erosion. The Corps has developed a fresh water diversion planto move fresh water from the Mississippi River to the adjoining coastal marshes thathave been cut off from their source of fresh water by the Mississippi River levees.These projects consist of diversion structures through levees and outfall canals toconvey the water to where ifs needed. Three structures, one at Bonnet Carre, oneat Davis Pond, and one at Caernarvon, form the nucleus of this plan. TheCaernarvon structure is completed and is operating successfully. The structures atBonnet Carre and Davis Pond are in the final stages of design and are expected tocome on line in the not too distant future. Creating new wetlands is anothertechnique that the Corps has used to offset coastal wetland losses. Two methodsare used to create wetlands, strategically placing dredged material and divertingriverine sediments. In conjunction with the Corps' navigation projects, over 3,000acres of wetlands have been created. In addition, riverine sediments have beendiverted in a number of small locations along the distributaries of the MississippiRiver to create mini-deltas. Through the Corps Section 404 permitting process,attempts are made to minimize the impact of private development on the coastalwetlands. All of the efforts, however, pale in comparison to the overall wetland lossproblem.
A New Approach
The lack of a comprehensive plan has been a major hindrance to making anyreal progress in the problem of coastal wetlands losses and clearly a new strategy isneeded. The Coastal Wetlands Planning, Protection and Restoration Act signed intolaw on November 29, 1990, is that new strategy. The purpose of this act is toensure the long-termconservation of coastal wetlands throughout the nation. Specialemphasis, however, is placed on Louisiana'scoastal wetlands because of their rapidand extensive loss and their value to the nation as a whole. The Act is expected toprovide approximately $175 million in federal funds within coastal Louisiana betweenOctober 1991 and October 1996. The Act establishes the Louisiana CoastalWetlands Conservation and Restoration Task Force which consists of six members:the secretary of the Army, the administrator of the Environmental Protection Agency,the governor of Louisiana, the Secretary of the Interior, the Secretary of Agriculture,and the Secretary of Commerce. The task force is chaired by the Secretary of theArmy and is responsible for the planning and implementation of a comprehensivearray of coastal wetland restoration projects in Louisiana. By November 28, 1993,the task force is to prepare a comprehensive coastal wetlands restoration plan forLouisiana. That plan will consist of a list of wetland projects ranked by cost
168

effectiveness and wetland quality. Recognizing the severity of the problem and theneed for immediate action, the Actincludes a provision for the preparation of a list ofpriority projects. The construction of these projects is to be started as soon aspossible and the projects must be essentially complete within five years. Theseprojects must also fit in well with the long-term restoration plan that is to becompletedat the end of the third yearof activity underthe bill. The Act provides thatcost-sharing for the restoration plan shall be 75 percent federal and 25 percent local.If however the state prepares a conservation plan to further regulate coastalwetlands usage, the cost-sharing under the Act would changeto 85 percent federaland 15 percent local. Thus far the state of Louisiana has not initiated work on thatconservation plan.
The Act further provides matching grants to develop wetland conservation projects in states other than Louisiana. These projects would generally follow the samecriteria as applied to those projects in the Louisiana portion of the bill. The Act isfunded by monies collected in the Small Engine Gasoline Tax Fund. This fund isadministered by the Department of the Interior. It is currently estimated thatapproximately $35 million peryearwill be available. Funding in the act is set for fiveyears total. Of the roughly $35 million available each year, $5 million is to be usedfor planning and development of the projects and the remaining money for theconstruction and operation of the projects. Seventy percent of the funds collected isto be used for projects in the Louisiana coastal wetlands area, 15 percent is to beused for projects in the other states, and the remaining 15 percent is to be used tofurther the North American Wetlands Conservation Act. Including state funds, it isestimated that the Act will provide well over$40 million peryear for the constructionand operation of coastal wetlands projects in Louisiana.
Organization
As stated earlier, the Act is administered by a task force with representativesfrom the five federal agencies and the state. This task force is the policy-makinggroup and provides overall leadership and guidance in development of the program.Day-to-day activities are conducted under the auspices of a Technical Committee,again chaired by a representative of the Corps of Engineers with representativesfrom each of the other federal and the state agencies. This committee's mandate isto ensure that the projects are developed on schedule and within budget.Subordinate to the Technical Committee are several other working groups that arespecialized in nature. The Planning and Evaluation Group is responsible for theactual detailed development and evaluation of the projects. That group plans theoverall concepts of the projectsand develops the economics, both the costs and thebenefits, that would be attributable to each. There is a Monitoring Group whosepurpose is to develop monitoring techniques to comply with that section of the Actthat requires that each project be evaluated every three years to see that it is in factperforming as it is designed. This is a very important feature of the Act, becausemany ofthe projects are at the edgesof the state of the art in coastal work. Many ofthe projects that will be built, particularly in the early stages, will be experimental innature and will be investigating ways to better and more economically preservecoastal marshes. There is alsoan Engineering Work Group whose job it is to do theengineering design of the projects and to ensure consistency across the various
169

types of projects that are developed by the several agencies involved. AnEnvironmental Work Group has been tasked to develop the environmental impactsof the projects and to develop the National Environmental Protection Actcompliancedocuments. Our intent is to prepare a programmatic environmental impact statementcovering the entire process and then to supplement that for each individual projectwith an environmental assessment and a finding of no significant impact.
Also included in the organization plan is a Citizens Participation Group. Thisgroup has as its membership representatives of all of the user groups, environmental groups and resource groups interested in the coastal area. One of theprincipal reasons that priorattempts at saving the coastal marshes have not alwayssucceeded is that comprehensive citizen involvement has been lacking. It is theintent of this Act to ensure that every interest group and every individual who has anidea that could be developed into projects to preserve the coastal area is heard andto afford everyone the opportunity to be a participant in this process. Clearly, all ofthe expertise in coastal engineering and coastal preservation does not rest in thefederal and state agencies involved. The Citizens Participation Group has been veryactive, and they continue to provide a valuable service that is not available throughany other forum. While not directly a part of the organization plan, the organizationincludes a mechanism for involving the scientific community in the projects. Againone of the major shortcomings of priorattempts at comprehensive looks at coastalpreservation was a lack of real scientific involvement. Louisiana is blessed withhaving several great universities, allofwhich are deeply involved in research dealingwithcoastal preservation.Through a contractual arrangement with the EnvironmentalProtection Agency, a scientific advisor-coordinator has been hired whose job it is towork with the universities in the state to coordinate research and to find and developmeans of applying that research to the projects undertaken. This shows greatpossibility for having a payoff well beyond its cost.
First Year's Priority List
On November 28, 1991, Senator John Breaux, the major sponsor of the bill,held a press conference to announce the results of the first year's work. The taskforce recommended 14 projects for immediate implementation. Table 1 shows theranking of the projects based on their cost per habitat unit. It also gives a ranking ofthe projects by type, showing the lead task force member, the cost per habitat unit,and the fully funded cost over the life of the project which includes construction aswell as future operation and maintenance, and monitoring. These projects includemarshbuilding through sediment diversion, watermanagement plans, marsh buildingwith dredged sediments, structural shoreline erosion control, restoration work onbarrier islands, and vegetative planting demonstration projects. The projects were allevaluated on a cost per habitatunit basis. The costs used were life cycle costs andinclude the construction cost, the interest during construction, the annual operationsand maintenance cost, and the monitoring cost. All of these costs were put on apresent worth basis and amortized over the 20-year anticipated life of the project.On the benefit side, to determine the amount of habitat units that would be affectedso that a cost per habitat unit could be developed, a modification of the U.S. Fishand Wildlife Service's habitat evaluation procedure (HEP) was used. This evaluationprocess has been designated the Wetland Value Assessment. The Wetland Value
170
Assessment operates under the assumption that optimal conditions for coastalwetlands can be characterized and that any existing or predicted conditions can becompared to that optimum to provide an index ofwetland quality. The quality component of a wetland is expressed through the use of a mathematical model developed specifically for each wetland type. Models were developed for fresh marsh,brackish marsh and saline marsh. Each model consists of: a listof variables that areconsidered important in characterizing the particular wetland type; a suitability indexgraph for each variable which defines the assumed relationship between wetlandquality and that variable; and a mathematical formula that combines the qualityvalue, known as a suitability index, for each variable into a single overall value forwetland quality. That single value is referred to as the habitat suitability index. Anexample of a habitat suitability index for a fresh marsh, as well as a definition of thevariables involved, is given in Figure 1.
This first priority list illustrates an interesting combination of projects resultingfrom an even more interesting combination of agencies and individuals involved intheir development. The construction agencies involved—the Corps of Engineers andSoil Conservation Service—tended to be very practical in their approach, verypragmatic in developing projects using fairly proven technology and rather simplisticconstruction techniques. The nonconstruction agencies were less constrained indeveloping projects and tended to be a little more experimental in nature, such asthe barrier island proposal by the Environmental Protection Agency and theproposals by the National Marine FisheryService. The final result was a combinationofprojects varying from the interesting to the mundane, from the inexpensive to thevery expensive, and from the proven technology to the experimental. Therein liesone of the strengths of this bill: it combines both the practical engineeringcapabilities of the construction agencies with the free thinking approach of thoseagencies who are more interested in results with rather than how to accomplishthem. This approach which will continue throughout the operation of this Act willlikely be proven to be one of the strengths thatwas clearly built in by the crafters ofthis bill.
Current Operations
While all of the participants recognized that there would be, over the years, achanging of theguard in all of the federal and state agencies, an unanticipated eventoccurred early on that had a major impact on the development of the plans.Louisiana had an election. Historically in Louisiana, it has been almost impossible todefeat an incumbent governor. This year's election had three major players: theexisting governor, Buddy Roemer, a Democrat recently converted to the Republicanparty; a former governor, Edwin Edwards, who has a history ofcolorful involvementin state government including several indictments, but no convictions; and finallyDavid Duke, former leader of the Ku Klux Klan, who was running on a veryconservative approach to government. Louisiana has an open primary system whereall candidates run regardless of party in the same primary and then the top two vote-getters face each other in the run-off. While Gov. Roemer was not the most populargovernor Louisiana has ever had, conventional wisdom anticipated that the finalrun-off would include Gov. Roemer and one of the other two candidates. After thefirst primary it became a choice of former Gov. Edwards or David Duke. What this
171

meant to the Wetlands Act was that an entirely new slate of players would likely beinvolved from the state's side after the election. Former Gov. Edwin Edwards waselected in the second primary and became governor in January of this year. Heimmediately appointed an entirely new slate of state secretaries to variousdepartments including the Department of Natural Resources, a major player in thisAct. He also appointed a new governor's assistant for environmental affairs whorepresents the state of Louisiana on the task force. Fortunately, he chose someonewho had been involved to some extent with the program prior to the election. Sowhat could have been a real disaster for the program was averted.
Currently, the second year priority list is being prepared concurrently with thedevelopment of the restoration plan. The coastal area has been subdivided into nineindividual hydrologic basins and separate plans are being developed for each ofthose subbasins. A basin captain has been selected for each basin. His duty will beto draw together the plan for that basin. These captains have come from the variousfederal and state agencies involved and they will work closely with the Engineeringand Environmental Work Groups as well as the Planning and EvaluationSubcommittee to develop plans for each basin that will be complimentary in formingthe restoration plan for the entire coastal area. Work is being closely coordinatedwith the Louisiana legislature since that body has to approve state participation ineach of the projects. It is also being closely coordinated with the public through theCitizen Participation Group. The importance of both of these coordination effortscannot be overemphasized. If a program is going to be developed to have a majorimpact on the future of Louisiana's coastal marshes, that program is going to haveto enjoy the support of the elected officials of the state as well as the people in theaffected areas.
The Future
Where do we go from here? In the short term the Act will provide five years offunding to develop the plan, and to build and operate projects to restore andpreserve Louisiana's coastal marshes. The restoration plan which is being developedwill likely have a four-tiered approach: first, it will include projects that can be builtimmediately; secondly, projects that have been evaluated and found to be goodprojects, but that need further detailed design; third, it will list projects that appear tobe meritorious but that need additional study. These willbe recommended for furtherstudy to possibly be developed at a later date. Finally, the fourth phase will beprojects that are purely conceptual at this time. There is little chance that a programof five years duration will reverse the trends that are occurring in the coastalLouisiana marshes. It is going to take a much longer-term program and a far greatercommitment of resources to bring about major changes. This program, thisrestoration plan, will include a vision for the future describing in very general termswhat that commitment has to be. While it is recognized that major strides will bemade in the next five years, it is also recognized that if the marshes of coastalLouisiana are important to this nation and are important to the world then acommitment must be made for their permanent restoration. It is anticipated that aprogram will be recommended, through continued funding, that will do just that. It isa big project; it is an important project. It is the first time that the resource agencies
172

and the construction agencies have worked so closely in Louisiana toward acommon goal. This Act is just the beginning.
173

Table 1. Ranking of projects by type.
Lead Cost{$) Fully Funded
Priority Task Force per Cost
Ranking Member* AAHU" ($1,000s)
Marsh Buildingwith Sediment Diversion
West Bay sediment diversion 8 AR 305 8,517
Water Management(Hydrologic Restoration)Fourchon 1 CO 21 252
BA-2 (GIWW to Clovelly) 2 AG 68 8,142
Cameron Creole Watershed 3 IN 128 502
Bayou Sauvage Refuge 4 IN 180 1,105
Lower Bayou La Cache 10 CO 837 1,254
Marsh Buildingwith Dredged SedimentsBarataria Bay Waterway 9 AR 518 1,625
Bayou La Branche 11 AR 2.369 4,327
Shoreline Erosion Control
with Structures
Turtle Cove 5 IN/LA 194 386
Sabine Refuge 6 IN 253 4,844
Cameron Prairie Refuge 12 IN 3,171 1,111
Vermilion River Cutoff 13 AR/LA 6,196 1,523
Barrier Island Restorationwith Dredged SedimentsEastern Isle Demiers
Demonstration ProjectVegetative plantings
16 EPA
AF
13,949 6.345
282 848
*The lead task force member (federal sponsor) for the project, represented by the followingacronyms: CO, U.S. Department of Commerce; LA. State of Louisiana; AG, U.S. Department ofAgriculture: AR, U.S. Department ofthe Army; IN, U.S. Dept. of the Interior, EPA. Environmental Protection Agency.
** Average annual habitat units.
174
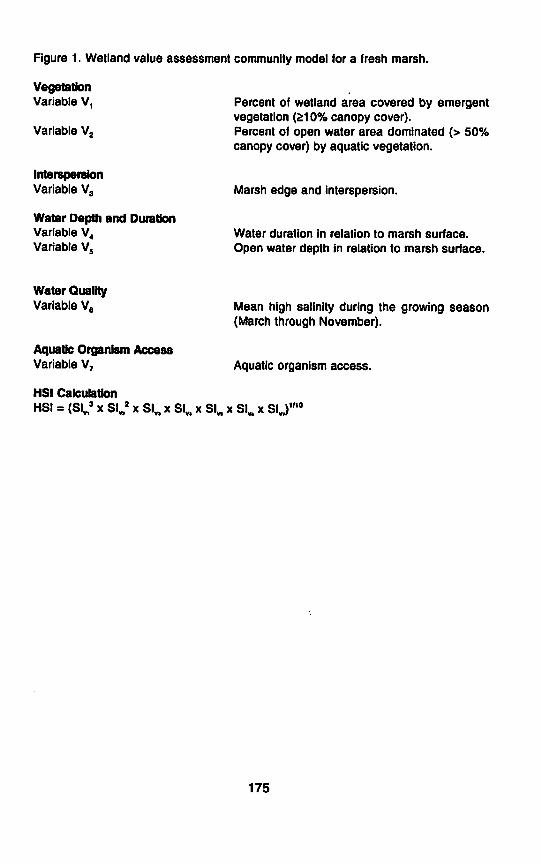
Figure 1. Wetland value assessment community model for a fresh marsh.
VegetationVariable V,
Variable V,
InterspersionVariable V.
Water Depth and DurationVariable V4Variable V5
Water QualityVariable VA
Aquatic Organism AccessVariable V;
Percent of wetland area covered by emergentvegetation (210% canopy cover).Percent of open water area dominated (> 50%canopy cover) by aquatic vegetation.
Marsh edge and interspersion.
Water duration in relation to marsh surface.
Open water depth in relation to marsh surface.
Mean high salinity during the growing season(March through November).
Aquatic organism access.
HSI Calculation
HSI = (SL,3 x SL,2 x Sl„x Slv. x SL, x Sl„xSU'"0
175