coal power plants - ntnu · coal power plants. 3 ... primary air coal+ limestone secondary air 8...
TRANSCRIPT

1
1
Bolland
TEP03 CO2 capture in power plants
Part 3 Power plant technology
EfficiencyAccounting CO2Classification
Olav BollandProfessor
Norwegian University of Science and TechnologyDepartment of Energy and Process Engineering
Sept 2013
2
Gas Technology Centre NTNU – SINTEFOlav Bolland
Coal power plants
3
Gas Technology Centre NTNU – SINTEFOlav Bolland
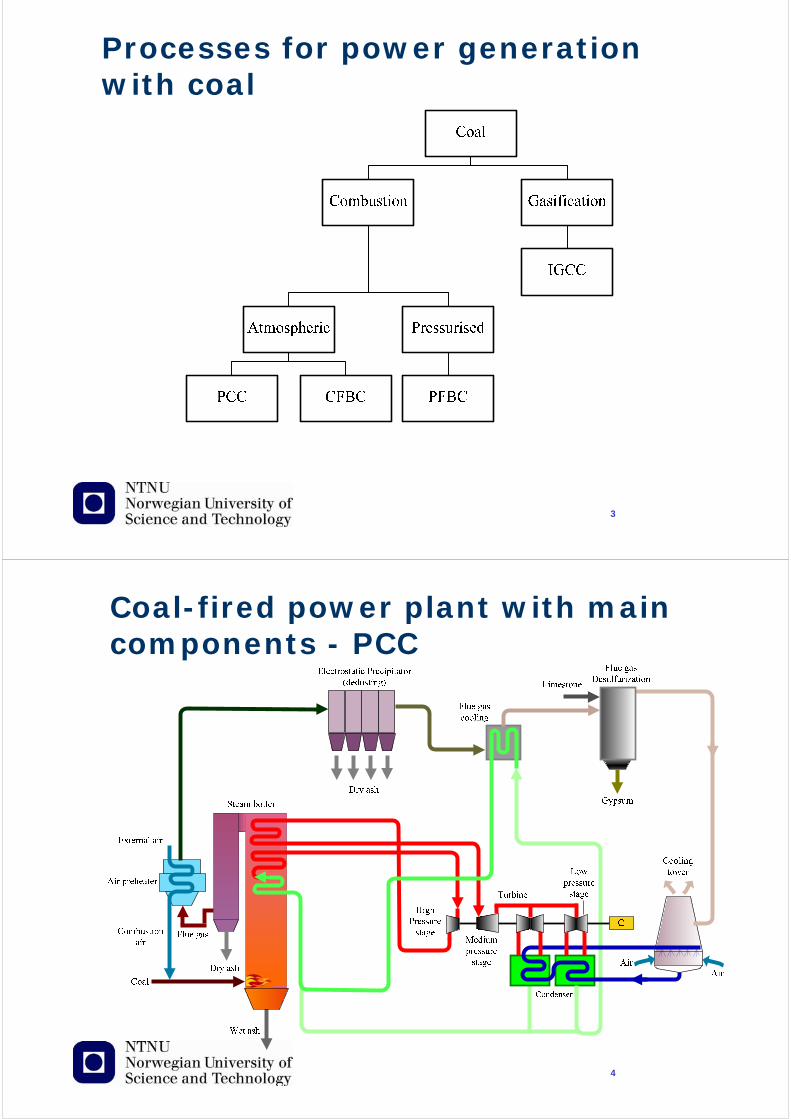
Processes for power generation with coal
4
Gas Technology Centre NTNU – SINTEFOlav Bolland
Coal-fired power plant with main components - PCC

5
Gas Technology Centre NTNU – SINTEFOlav Bolland
Steam cycle in coal-fired power plant
6
Gas Technology Centre NTNU – SINTEFOlav Bolland
The world’s most efficient coal-fired unit with 47% efficiencyDenmark
Nordjyllandsværket, unit 3Net output : 385 MWSteam parameters : 300 bar/585 °C/585 °CMaximum district heating : 460 MWCommissioning year : 1998
Nordjyllandsværket, unit 3

7
Gas Technology Centre NTNU – SINTEFOlav Bolland
CFBC - Circulating Fluidised Bed Combustion
off-gas
separationgas - solid
backflowingsolid stream
mixinggas - gas
mixinggas - solids
Lm
mixingsolids - solids
macro-scalerecycle streampenetration
ash
primary air
coal+limestone
secondaryair
8
Gas Technology Centre NTNU – SINTEFOlav Bolland
Fluidised Bed
5 – 100 MW
Stationary fluidized bed Circulating fluidized bed

9
Gas Technology Centre NTNU – SINTEFOlav Bolland
PFBC – Pressurised Fluidised Bed Combustion
10
Gas Technology Centre NTNU – SINTEFOlav Bolland
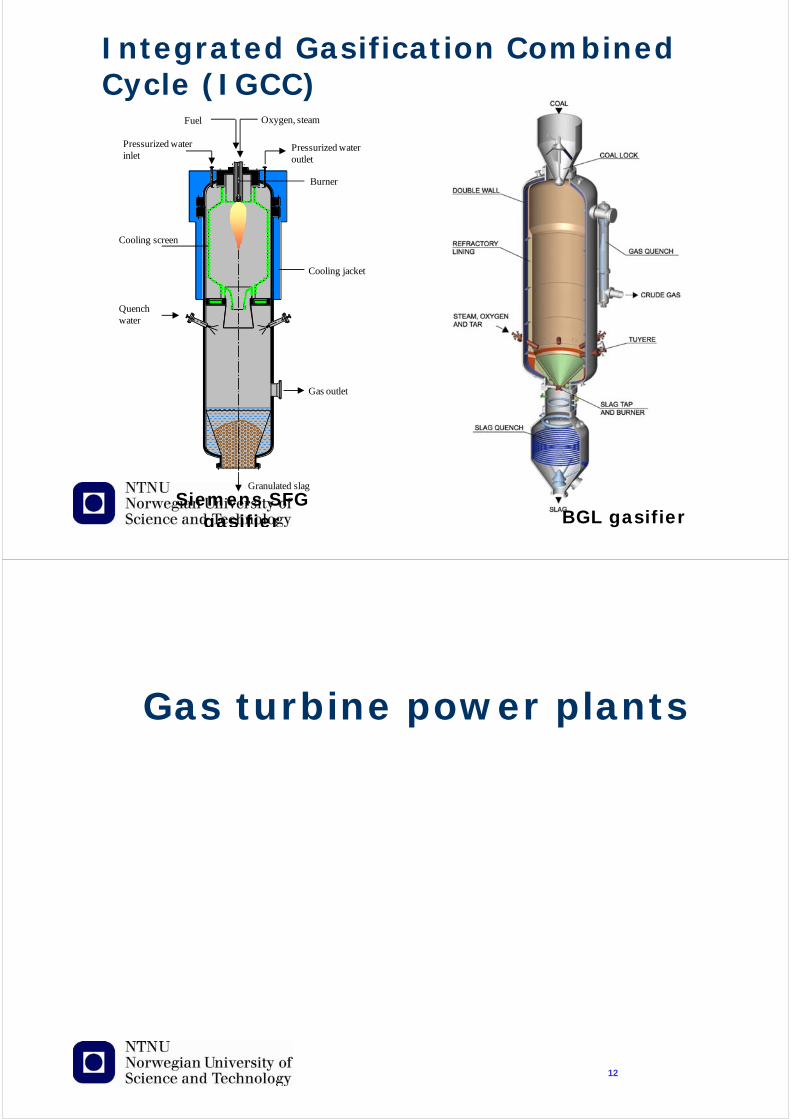
Integrated Gasification Combined Cycle (IGCC)
ST
Generator
HRSG
Air
GT
Gasifier
AirSeparation
UnitCompressed air
N2
O2
Quench/ heat
recovery
Particulate removal
Sulfur removal
Coal feed
Raw syngas
Hydrogen-rich gas
Quench water
Recovered heat
H2S
Recovered heat
11
Gas Technology Centre NTNU – SINTEFOlav Bolland
Integrated Gasification Combined Cycle (IGCC)
Pressurized waterinlet
Pressurized wateroutlet
Fuel Oxygen, steam
Cooling screen
Quenchwater
Granulated slag
Gas outlet
Cooling jacket
Burner
Siemens SFG gasifier BGL gasifier
12
Gas Technology Centre NTNU – SINTEFOlav Bolland
Gas turbine power plants

13
Gas Technology Centre NTNU – SINTEFOlav Bolland
GC T 1-shaft gas turbine (all GTs > 100 MWbut also smaller)
C T 2-shaft gas turbineT
C T TC 2-shaft gas turbine
C T TC 3-shaft gas turbineT
gas generator powerturbine
G
G
G
Gas Turbine Classification
14
Gas Technology Centre NTNU – SINTEFOlav Bolland
General Electric LM2500ca. 30 MW, oil&gas, process/chemical industry, ships

15
Gas Technology Centre NTNU – SINTEFOlav Bolland
Siemens V94.2ca. 170 MW,
first gas turbine with low-NOXcombustor
NOX = NO + NO2
16
Gas Technology Centre NTNU – SINTEFOlav Bolland
T1: Combustor exit temperature (not much used)T2: Temperature after first blade row in Stage 1 (mostly used)T3: Calculated mixing temperature of combustor exit stream and
cooling air (ISO definition)
T1
T2
Definitions of Turbine Inlet Temperature - TIT

17
Gas Technology Centre NTNU – SINTEFOlav Bolland
Turbine Blade Cooling
18
Gas Technology Centre NTNU – SINTEFOlav Bolland
Air cooling of turbine blades

19
Gas Technology Centre NTNU – SINTEFOlav Bolland
Single-Crystal
DirectionallySolidified
Turbine blade materials
Conventionalcasting
20
Gas Technology Centre NTNU – SINTEFOlav Bolland
21
Gas Technology Centre NTNU – SINTEFOlav Bolland
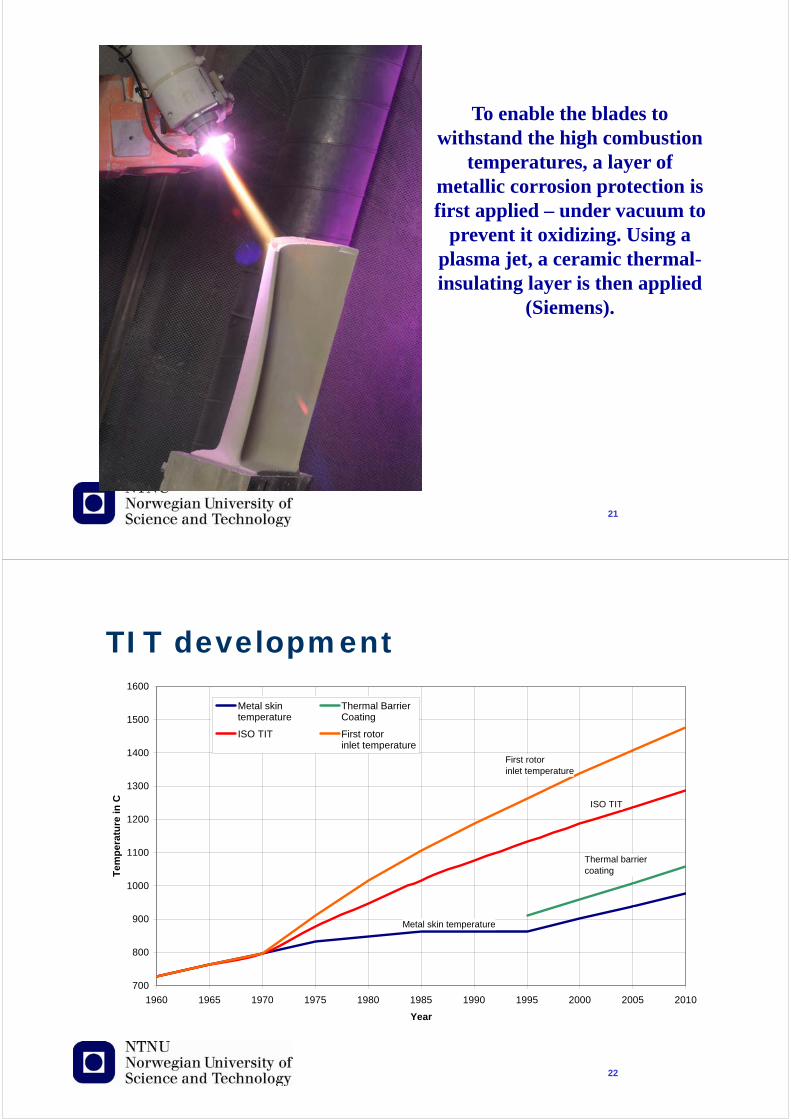
To enable the blades to withstand the high combustion
temperatures, a layer of metallic corrosion protection is first applied – under vacuum to
prevent it oxidizing. Using a plasma jet, a ceramic thermal-insulating layer is then applied
(Siemens).
22
Gas Technology Centre NTNU – SINTEFOlav Bolland
TIT development
700
800
900
1000
1100
1200
1300
1400
1500
1600
1960 1965 1970 1975 1980 1985 1990 1995 2000 2005 2010
Year
Tem
per
atu
re i
n C
Metal skintemperature
Thermal BarrierCoating
ISO TIT First rotorinlet temperature
Metal skin temperature
ISO TIT
First rotorinlet temperature
Thermal barriercoating

23
Gas Technology Centre NTNU – SINTEFOlav Bolland
Combined Cycle power plants
24
Gas Technology Centre NTNU – SINTEFOlav Bolland
Combined Cycle Power Plant,the principle
Gas TurbineSteam Turbine
Heat recoverysteam generatoror HRSG
Condenser
To stack
Generator
Generator
FuelFuel Supplementary
firing
G G
PumpBy-passstack
By-pass

25
Gas Technology Centre NTNU – SINTEFOlav Bolland
Steam Cycle – triple pressure reheat
26
Gas Technology Centre NTNU – SINTEFOlav Bolland
FOR QUALITATIVE INDICATION ONLY
Thermoflow, Inc.
PEACE/GT PRO 13.0
Date: 08.12.04
Company: NTNU
User: Olav Bolland
C:\Documents and Settings \obolland\Desktop\EXAMPLE
Drawing No:
HEAT RECOVERY STEAM GENERATOR
ELEVATION
A A
B B
C C
D D
E E
F F
1
1
2
2
3
3
4
4
5
5
6
6
7
7
8
8
A B C D E F G H I J
A C D E
F
G
H
12.7 m - 17.8 m 16.5 m 4.1 m 40.0 m 21.8 m 6.8 m - -
HRSG - Horizontal boiler

27
Gas Technology Centre NTNU – SINTEFOlav Bolland
0
100
200
300
400
500
600
700
0 50 100 150 200 250 300
Tem
pera
ture
[C
]
Heat transfer [MW]
Flue gas
Water/steam
pinch,smallest T in boiler,limititation for thesteam production
evaporator,boiling at constanttemperature
economiser,
slope 1 pmc
superheater,
slope 1 pmc
Flue gas line,
slope 1 pmc
HRSG TQ-diagram
28
Gas Technology Centre NTNU – SINTEFOlav Bolland
Triple pressure reheat steam turbine

29
Gas Technology Centre NTNU – SINTEFOlav Bolland
Enthalpy/entropy-diagram
30
Gas Technology Centre NTNU – SINTEFOlav Bolland
G G
G
MM
G
ADirect water cooling
of condenser
DWater-cooling with dry cooling tower
CAir-cooledcondenser
BWater-cooling withwet cooling tower
Power plant cooling systems

31
Gas Technology Centre NTNU – SINTEFOlav Bolland
DemisterWater inlet -from condenser
Water outlet -to condenser
Air inlet
Waterdistributor
Air outlet
Cooling tower
32
Gas Technology Centre NTNU – SINTEFOlav Bolland
Cooling tower plume
Phot
o: O
lav
Bol
land
32
Cruas Nuclear power plant, FranceSchwarze Pumpe power plant, Germany

33
Gas Technology Centre NTNU – SINTEFOlav Bolland
Induced draft cooling towers
34
Gas Technology Centre NTNU – SINTEFOlav Bolland
Cogeneration of heat and powerSteam turbine extraction
Gas turbine Heat recovery Boiler
Hot exhaust Exhaust to stack
Power PHeat QSteam turbine
Condenser
High-pressure steam
Steam, close to vacuum
Water
Steam extraction
Cooling water
Heat (Q) reduces the power generation (P) In the steam turbineQ can be zero P=max

35
Gas Technology Centre NTNU – SINTEFOlav Bolland
no extractionQP
LHV
Relation between heat production and powerin a plant using a steam turbine; conventional steam plant or combined cycle
Steam that is extracted from a steam turbine could alternatively have been used for further expansion and power generation
Heat production reduces the power generation (fixed fuel flow)
How is the power output reduced as function of heat generation?
The relation is then:
1
QP
P Q
36
Gas Technology Centre NTNU – SINTEFOlav BollandCHP Bolland, 2007
0
1
2
3
4
5
6
7
8
9
10
11
12
13
14
15
60 70 80 90 100 110 120 130 140 150 160 170 180 190 200 210 220 230
Steam extraction temperature, saturated [˚C]
Ra
tio
be
twee
n h
ea
t in
ex
tra
cted
ste
am
an
dlo
ss o
f st
ea
m t
urb
ine
po
wer
ou
tpu
t,
[-]
0123456789101112131415161718192021222324252627282930
Ste
am
ex
tra
ctio
n p
ress
ure
=
satu
rati
on
pre
ssu
re f
or
tem
per
atu
re o
n a
bsc
issa
[b
ar]
condenser pressure = 0.04 [bar]
condenser pressure = 0.07 [bar]
Saturation line
5QP
District heating
3.5-5QP
Typical amine boilingor paper drying
Relation between heat production and power

37
Gas Technology Centre NTNU – SINTEFOlav Bolland
Power plant efficiency
38
Gas Technology Centre NTNU – SINTEFOlav Bolland
Generator 1 2 3 4
Numbers in kilowatt
1
1 1
Gross shaft power
266755
/ 39.2%T K
LHV
W W W
W Q
Mechanical
losses
1067
99.6%m
2
2
Net shaft power
265688
39.1%
W
Generator-
losses
3985
98.5%g
Auxiliary power
Transformer
3926
98.5%aux
3
3
Generator terminal
261703
38.5%
W
LHV
Fuel energy
Q 680204
100%
4
4
Net power
257777
37.9%
W
265173CW
Air
Compressor
531928TW
Exhaust
Turbine
Fuel
LHVm
WWWW
f
auxipgmSTgmCTPInet
,,
PInet, net power plant efficiency for Power Island -
fm fuel flow rate kg/s
LHV lower heating value kJ/kg
TW turbine work, calculated as fluid enthalpy change kW (>0)
CW compressor work, calculated as fluid enthalpy change kW (<0)
m mechanical efficiency -
g generator efficiency -
STW steam turbine work, calculated as fluid enthalpy change kW (>0)
PW pump work, feed water pumps, cooling water pumps, etc. kW (<0)
aux auxiliary power efficiency (power island only!)
Power plant efficiency
39
Gas Technology Centre NTNU – SINTEFOlav Bolland
LHVm
WWWW
f
auxipgmSTgmCTPInet
,,
PInet, net power plant efficiency for Power Island -
fm fuel flow rate kg/s
LHV lower heating value kJ/kg
TW turbine work, calculated as fluid enthalpy change kW (>0)
CW compressor work, calculated as fluid enthalpy change kW (<0)
m mechanical efficiency -
g generator efficiency -
STW steam turbine work, calculated as fluid enthalpy change kW (>0)
PW pump work, feed water pumps, cooling water pumps, etc. kW (<0)
aux auxiliary power efficiency (power island only!)
LHVm
WWW
f
AUXOCOPInetNPEnet
22
,,
NPEnet, Net Plant Efficiency
PInet, net power plant efficiency for Power Island
fm fuel flow rate kg/s
LHV lower heating value kJ/kg
2COW work for CO2 compression kW (<0)
2OW work for O2 separation and compression kW (<0)
AUXW work for any related auxiliary processes kW (<0)
Power plant efficiency
40
Gas Technology Centre NTNU – SINTEFOlav Bolland
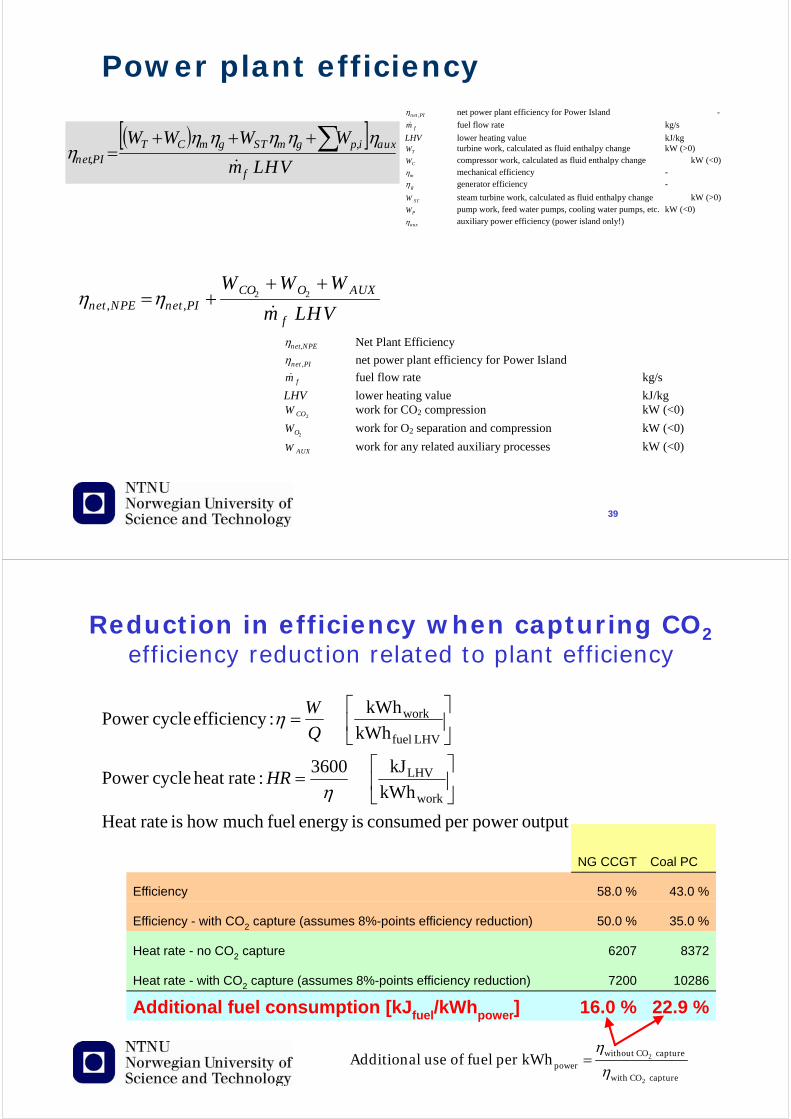
Reduction in efficiency when capturing CO2efficiency reduction related to plant efficiency
outputpower per consumed isenergy fuelmuch how is rateHeat
kWh
kJ
3600 :rateheat cyclePower
kWh
kWh :efficiency cyclePower
work
LHV
LHV fuel
work
HR
Q
W
NG CCGT Coal PC
Efficiency 58.0 % 43.0 %
Efficiency - with CO2 capture (assumes 8%-points efficiency reduction) 50.0 % 35.0 %
Heat rate - no CO2 capture 6207 8372
Heat rate - with CO2 capture (assumes 8%-points efficiency reduction) 7200 10286
Additional fuel consumption [kJfuel/kWhpower] 16.0 % 22.9 %
2
2
without CO capturepower
with CO capture
Additional use of fuel per kWh

41
Gas Technology Centre NTNU – SINTEFOlav Bolland
0 %
5 %
10 %
15 %
20 %
25 %
30 %
35 %
40 %
45 %
50 %
55 %
60 %
65 %
70 %
20 22 24 26 28 30 32 34 36 38 40 42 44 46 48 50 52 54 56 58 60 62 64 66 68 70
Add
itio
nal c
onsu
mpt
ion
of f
uel
beac
use
of C
O2
capt
ure
[%/k
Whp
ower
]
Efficiency of reference power plant without CO2 capture [%]
5%-points
8%-points
10%-points
12%-points
15%-points
2
2
without CO capture
with CO capture
Additional fuel use when capturing CO2
PCC
NGCC
42
Gas Technology Centre NTNU – SINTEFOlav Bolland
Specific Primary Energy Consumption for CO2 Avoided, SPECCA
Natural gas CoalFuel LHV MJ/kg fuel 50 28Fuel CO2 kg CO2/MJ_LHV 0.055 0.1
kg CO2/kg fuel 2.75 2.8eta 50 % 35 %eta_ref % 58 % 43 %E kg CO2/KWh 0.035 0.075E_ref kg CO2/KWh 0.35 0.75HR kJ_LHV/kWh 7200 10286HR_ref kJ_LHV/kWh 6207 8372
SPECCA kJ_LHV/kg CO2 3153 2835SPECCA MJ_LHV/kg CO2 3.15 2.83Fraction of LHV 17.3 % 28.3 %
LHV power
2
power
LHV LHV
2 2
1 13600
heat rate kJ /kWh
kg COE=
kWh
MJ kJSPECCA= ,
kg CO kg CO
refref
ref ref
HR HRSPECCA
E E E E
HR

43
Gas Technology Centre NTNU – SINTEFOlav Bolland
Accounting CO2 capture
44
Gas Technology Centre NTNU – SINTEFOlav Bolland
Powerplant
FuelCO2 emitted
Powerplant
CO2 emitted
CO2 captured
2
fuel LHV
kg CO
kWh
2
work
kg COkWhref
work
fuel LHV
kWhkWhref
Power, 1 kWh
Power, 1 kWh
Pre-combustionCO2 capture
2
work
fuel LHV
kWhkWhCO
Fuel feed
2
fuel LHV
kg CO
kWh
CO, CO2 and
H2-rich fuel
2
LHV, fuel feed
(1 )
kg CO
kWh
cap
2
2
work
kg CO
kWhcapCO
2
2
work
kg CO(1 )
kWhcapCO
2
2
kg CO captured
kg CO feedcap
Post-combustionCO2 capture
CO2 emitted
CO2 captured
Power, 1 kWh
Powerplant
2
work
fuel LHV
kWh
kWhCO
Fuel feed
2
fuel LHV
kg CO
kWh
CO2
2
2
work
kg CO
kWhCO
2
LHV
kg CO
kWhcap
2
2
work
kg CO(1 )
kWhcapCO
2
2
kg CO captured
kg CO feedcap
Accounting - 1

45
Gas Technology Centre NTNU – SINTEFOlav Bolland
Accounting CO2 - 2
The CO2 capture ratio, ca p is defined as the fraction of the formed CO2 which is captured
CO2 captured the amount of CO2 captured per main product of the plant
2
22
work
kg COCO captured
kWh
cap
CO
CO2 emitted amount of CO2 emitted per main product of the plant
2
22
work
kg COCO emitted (1 )
kWh
cap
CO
46
Gas Technology Centre NTNU – SINTEFOlav Bolland
Accounting CO2 - 3
CO2 capture efficiency, ,cap e ,
the net reduction of CO2 emission per unit of net power output comparing a reference power without CO2 capture and that of a similar power plant, and the emission of CO2 per unit of power output of the reference plant. Or; the ratio between CO2 avoided and the emission of CO2 per unit of power output of the reference plant.
2
2
,
(1 )
1 (1 )
capref CO ref
cap e capCO
ref
CO2 avoided, the net reduction of CO2 emission per unit of net power output comparing a reference power plant without CO2 capture and that of a similarpower plant with CO2 capture.
2
2CO avoided (1 )
capref CO

47
Gas Technology Centre NTNU – SINTEFOlav Bolland
Accounting CO2 - 4
0 0.1 0.2 0.3 0.4 0.5 0.6 0.7 0.8 0.9 1CO2 generated [kg/kWh]
Emitted
Captured
Plant withCO2 capture
Reference plant,no CO2 capture
CO2 captured
CO2 avoided
Additional CO2generated becauseof CO2 capture
48
Gas Technology Centre NTNU – SINTEFOlav Bolland
Accounting CO2 - 5Example: The power plant efficiency without CO2 capture (reference, ref ) is 45%,
while the corresponding for the plant with CO2 capture is 35% (2CO ).
In the CO2 capture plant, 86% ( cap ) of all generated CO2 is captured and stored.
The fuel’s is assumed to be 342 g/kWhpower. The CO2 avoided is 0.623 kg CO2/kWhpower, while the CO2 captured is 0.840 kg CO2/kWhpower. The additional CO2 generated coming from an increase in fuel
consumption of 2
451.29
35ref
CO
is 0.217 kg CO2/kWhpower
The CO2 capture efficiency,
,ca p e , is 82%.

49
Gas Technology Centre NTNU – SINTEFOlav Bolland
ClassificationCO2 capture
50
Gas Technology Centre NTNU – SINTEFOlav Bolland
51
Gas Technology Centre NTNU – SINTEFOlav Bolland
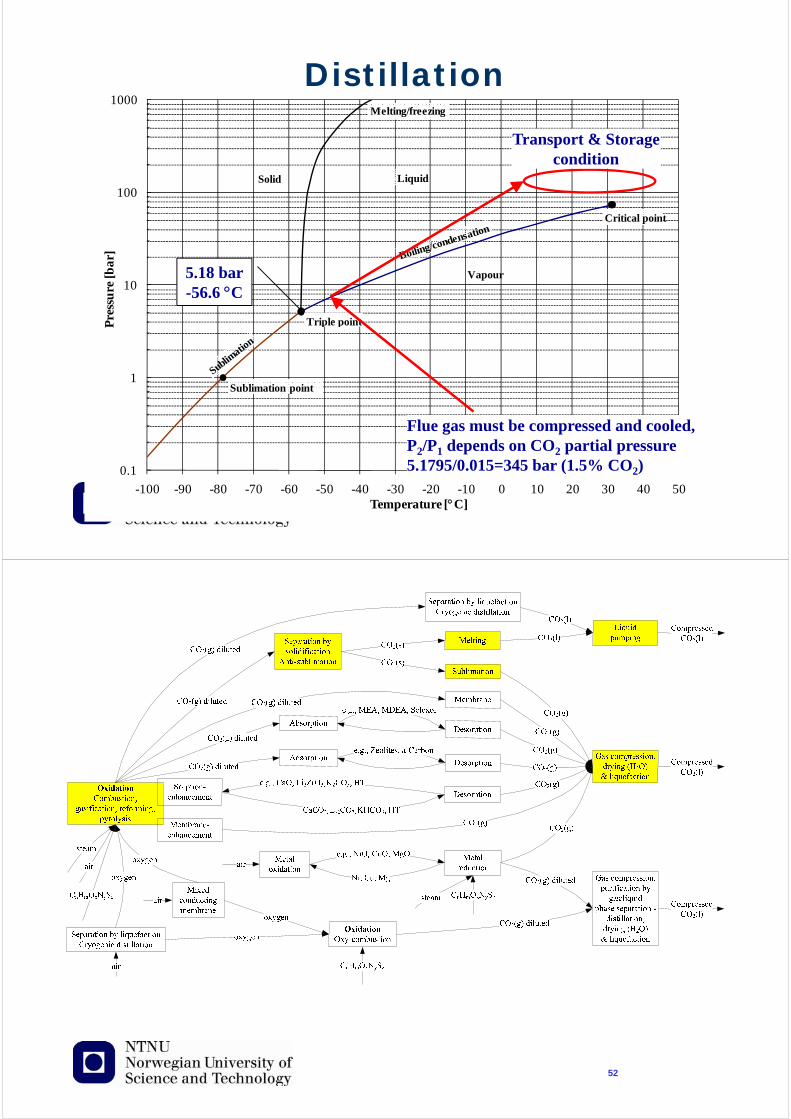
0.1
1
10
100
1000
-100 -90 -80 -70 -60 -50 -40 -30 -20 -10 0 10 20 30 40 50
Pre
ssu
re [b
ar]
Temperature [C]
LiquidSolid
Vapour
Sublimatio
n
Boiling/condensation
Melting/freezing
Critical point
Triple point
Sublimation point
5.18 bar-56.6 C
Flue gas must be compressed and cooled,P2/P1 depends on CO2 partial pressure5.1795/0.015=345 bar (1.5% CO2)
Transport & Storagecondition
Distillation
52
Gas Technology Centre NTNU – SINTEFOlav Bolland

53
Gas Technology Centre NTNU – SINTEFOlav Bolland
0.1
1
10
100
1000
-100 -90 -80 -70 -60 -50 -40 -30 -20 -10 0 10 20 30 40 50
Pre
ssu
re [b
ar]
Temperature [C]
LiquidSolid
Vapour
Sublimatio
n
Boiling/condensation
Melting/freezing
Critical point
Triple point
Sublimation point
5.18 bar-56.6 C
Flue gas must be cooled,How low T depends on CO2 partial pressure
Transport & Storagecondition
Anti-sublimation
54
Gas Technology Centre NTNU – SINTEFOlav Bolland

55
Gas Technology Centre NTNU – SINTEFOlav Bolland
Absorption of CO2most mature technology for flue gas
RectisolPurisolSelexol
BenfieldMEAMDEASulfinol
56
Gas Technology Centre NTNU – SINTEFOlav Bolland
0.1
1
10
100
1000
-100 -90 -80 -70 -60 -50 -40 -30 -20 -10 0 10 20 30 40 50
Pre
ssu
re [b
ar]
Temperature [C]
LiquidSolid
Vapour
Sublimatio
n
Boiling/condensation
Melting/freezing
Critical point
Triple point
Sublimation point
5.18 bar-56.6 C
Transport & Storagecondition
Gas-phase separation
Cooling
Cooling
AbsorptionAdsorption
Oxy-combustionMembraneSorbents

57
Gas Technology Centre NTNU – SINTEFOlav Bolland
58
Gas Technology Centre NTNU – SINTEFOlav Bolland

59
Gas Technology Centre NTNU – SINTEFOlav Bolland
OHCOOCH 2224 22
2222
22
77.344
)1(2
)77.3(4
Nn
mOn
mOHn
COm
NOn
mHC nm
AirAir excess ratio
Reactants
Products’exhaust’’flue gas’
3-14%
Oxy-combustion CO2 capture
60
Gas Technology Centre NTNU – SINTEFOlav Bolland
Oxy-combustion – the principle
Conversion system
Air SeparationUnit
O2
hydrocarbonC,H
CO2 to storage
H2O extraction
Flue gasCO2 + H2O
CO2 or H2O recycle

61
Gas Technology Centre NTNU – SINTEFOlav Bolland
Oxy-combustion - air separation?
Cryogenic distillation
AdsorptionMembrane
Polymeric membrane
Ceramic membrane
Vacuum Swing Adsorption
(VSA)
Vacuum Pressure Swing Adsorption
(VPSA)
Pressure Swing Adsorption
(PSA)
Electrically driven
membrane
Partial pressure driven
membrane
Air Separation Technologies
62
Gas Technology Centre NTNU – SINTEFOlav Bolland
OHCOOCH2224
22
Air Separation Unit (ASU)
kg4kg1
32216
/dayO tons 4150
MJ/kg 50/skg 12MW600
)efficiency (50%MW600MW 300
2
CHCHfuel
fuele
44
)(@
Largest ASU train sizePossible in 2009
63
Gas Technology Centre NTNU – SINTEFOlav Bolland
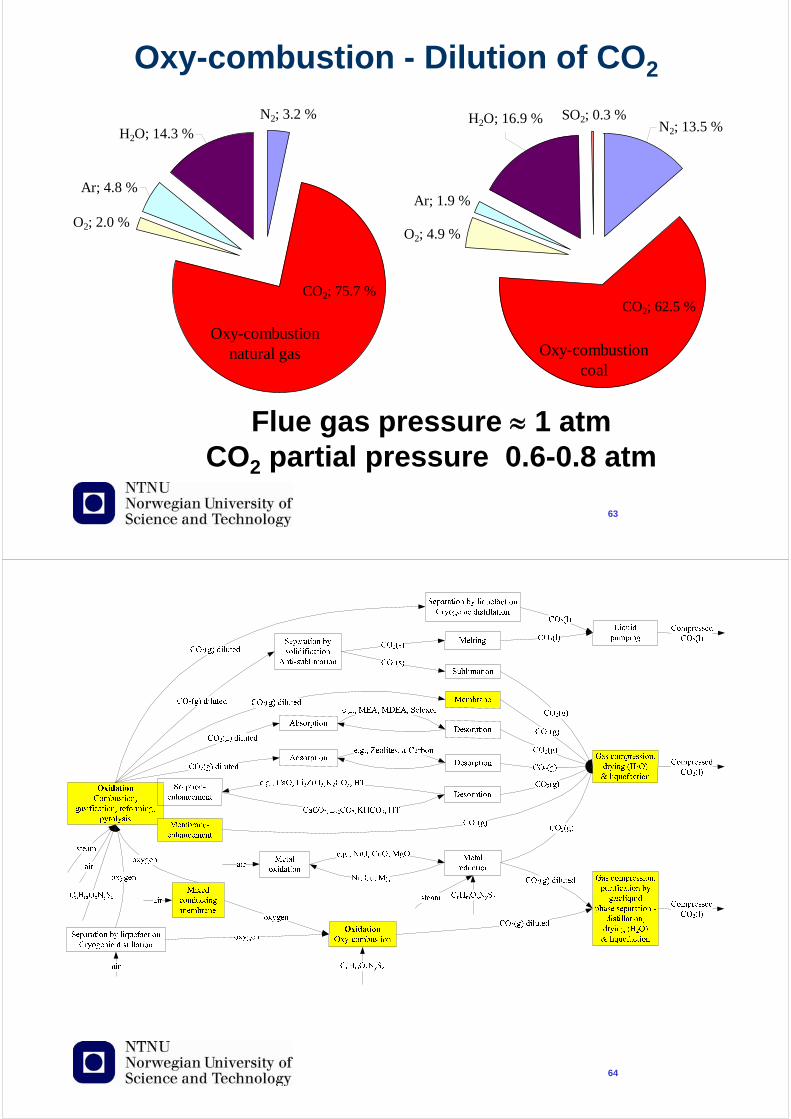
Oxy-combustion - Dilution of CO2
Flue gas pressure 1 atmCO2 partial pressure 0.6-0.8 atm
Oxy-combustioncoal
Ar; 1.9 %
SO2; 0.3 %H2O; 16.9 %
O2; 4.9 %
CO2; 62.5 %
N2; 13.5 %
Oxy-combustionnatural gas
N2; 3.2 %
CO2; 75.7 %
O2; 2.0 %
Ar; 4.8 %
H2O; 14.3 %
64
Gas Technology Centre NTNU – SINTEFOlav Bolland

65
Gas Technology Centre NTNU – SINTEFOlav Bolland
Oxygen ion transport membranes
ZrO2-Y2O3, CeO2,
La1-xSrxCo1-yFeyO3-d
Sr2Fe2O5,LaGaO3-d ,
(Bi2O2)(An-1BnOx), La2NiO4+d Mixed
conducting membrane
OMCM,
Oxygen ion conducting membrane,e.g. SOFC
Efficiency potential very good
66
Gas Technology Centre NTNU – SINTEFOlav Bolland