co capture by adsorption processes: from materials to...
TRANSCRIPT

www.monash.edu.au
CO2 capture by Adsorption Processes: From Materials to Process Development to Practical Implementation
Paul A. WebleyDept. of Chemical EngineeringTalloires, July 2010
www.monash.edu.au
2
Outline
• Adsorption for Post-Combustion CO2
Capture – PVSA or TSA or TVSA?
• Materials development – synergy with
process and adsorbent assessment
• Lab and Pilot scale Post Combustion
Experimental Work
• Field Demonstrations
• Conclusions

www.monash.edu.au
3
Post Combustion Flue Gas Conditions and Challenges – T,P,Flow
PC(black)+FGD PC(brown) NGCC OxyfuelMass Flow (kg/s) 600 790 1000 180Volume flow (m3/hr)
2.2 x 10⁶ 3.0 x 10⁶ 3.8 x 10⁶ 0.5 x 10⁶
Pressure (barg) ~ 0.05 ~ 0.05 ~ 0.05 ~ 0.05Temperature(°C) ~ 90 ~ 90 ~ 90 ~ 170
• Volume flows VERY large (pressure drop)• Pressures very low (no driving force) • Temperatures relatively high (for adsorption)
www.monash.edu.au
4
Post Combustion Flue Gas Conditions and Challenges - Composition
• CO2 concentration ranges from 12-63% (wet basis)
• High water content • SOx, NOx, ash, heavy metals, etc present
PC(black)+FGD PC(brown) NGCC OxyfuelNitrogen 71 60 75Carbon Dioxide 12.6 12 3.4 62.6Water 11.1 24 6.9 31.5Oxygen 4.4 3 13.8 4.5SO2 ~200ppm ~200ppmNOx 670 ppm 25ppm

www.monash.edu.au
5
Commercial Adsorption based CO2 Systems
• CO2 Recovery from COREX Gas–Saldanha Steel, South Africa
• 360,000 Nm3/h feed rate (15psig, 30%CO2)
• 2xVPSA trains• Each has 12 vessels
and 4 vacuum pump sets
• Worlds largest VPSA
Feed ~ 10,000 TPD
www.monash.edu.au
6
CO2 Capture: Program at Monash University
• Materials development:
– Good working capacity & good selectivity– Insensitive to moisture– Operable at above ambient temperature– There is a strong relationship to the process cycle
• Process development
– Cycle development– Structured adsorbents– Energy integration
• Solution of engineering issues

www.monash.edu.au
7
PSA or TSA?
• Throughput (kg CO2/day/kg adsorbent)
• TSA provides large WC at the expense of cycle time unless innovative rapid cycling systems are developed
• PSA provides smaller WC but can provide much shorter cycle time
• Large throughput, bulk separation tends to favor PSA, eg. O2VSA, H2PSA etc.
• PTSA??? (yes)
www.monash.edu.au
8
Adsorbent Requirements from Process Operation
• Minimal compression of flue gas! – vacuum operation => need large WC between 0 and 1 atm
• Regeneration of the adsorbent is where the energy is needed – put energy into CO2, not N2, not solid material (minimal N2 adsorption, minimal T swing)
• Difference between adsorption and desorption for CO2 compared to other gases is key
• Large adsorption amount is not necessarily better• Interaction of species is important (impurities)

www.monash.edu.au
9
Adsorbent Isotherms
CO2 Adsorption Isotherms at 25°C
0.00
0.50
1.00
1.50
2.00
2.50
3.00
3.50
4.00
4.50
5.00
0 20 40 60 80 100 120
P(kPa)
n(m
ol/
kg
)
13X
NaY
CaCHA
SWNT
BPL carbon
ACFAlumina
IRMOF-6
Feed
Reg
en
13X
WC,CO2 ~ 1.6
Isothermal Op.
www.monash.edu.au
10
Screening Problem
• Which adsorbent is “best” over a particular
operating region and what is this operating
region (can we solve the inverse problem)?
• By how much will improvements in adsorbent
reduce capture cost (or particular interest to
sponsors!)?
• Should improvements be aimed at CO2
capacity, N2 capacity, heat of adsorption, etc?
• Cannot simulate processes for every possible
adsorbent – too time-consuming.

www.monash.edu.au
11
Quick Assessment – “First Order” effects
• Need to consider adsorption P,T and desorption P,T of CO2 required to meet purity constraints
• Need to consider adsorption P,T and desorption P,T of N2 (selectivity)
• Need to consider temperature change on adsorption/desorption (isothermal vs adiabatic)
• Need to capture effect of isotherm shape on pressure profile and hence power
• Ideally, should include kinetics – however, initial goal is to permit equilibrium evaluation
www.monash.edu.au
12
Capacity for CO2 – effect of temperature
• Heat of adsorption (exothermic) leads to reduction in working capacity since adsorbent T increases on adsorption and decreases on desorption
• Instead of isotherm only, need to look at adiabat
13X Isotherm and Adiabat
0
0.5
1
1.5
2
2.5
3
3.5
4
4.5
5
0 0.2 0.4 0.6 0.8 1 1.2 1.4 1.6
CO2 Partial Pressure (bar)
Lo
ad
ing
(g
mo
le/k
g)
isotherm
adiabat
Isotherm at 300K, Adiabat starts at 300K
T=300K
T=370K
T=343K

www.monash.edu.au
13
Example T-swing during CO2VSA process
www.monash.edu.au
14
Development of Proposed Parameter
• Consider 1kg adsorbent with feed gas of known composition and specified pressure and temperature
• Perform adiabatic pump-down calculation tracking composition, temperature, moles removed (CO2 andN2) and energy consumed
• Derive CO2 working capacity (WCCO2), N2 working capacity (WCN2), working selectivity (WS=WCCO2/WCN2), and specific energy (ECO2=energy/mole CO2 removed)
• Repeat for a range of operating temperatures and pressure ratios
• Very easy and fast calculations

www.monash.edu.au
15
Basis for Comparison
• 3 adsorbents: NaX,
NaY, Activated
Carbon, ADSORBENT ZERO
LOADING
�H(kJ/mol)
NaX 44.4
NaY 37.0
AC 11.5
www.monash.edu.au
16
Isotherms for CO2
CO2 Adsorption Isotherms at 25C
0
0.5
1
1.5
2
2.5
3
3.5
4
4.5
5
0 20 40 60 80 100 120 140
P(kPa)
n(g
mo
le/k
g)
NaX
NaY
AC

www.monash.edu.au
17
Isotherms for N2
N2 Adsorption Isotherms at 25C
0.00
0.10
0.20
0.30
0.40
0.50
0.60
0.70
0.80
0.00 20.00 40.00 60.00 80.00 100.00 120.00 140.00
P(kPa)
n(g
mo
le/k
g)
NaX
NaY
AC
www.monash.edu.au
18
Comparison of Isothermal and Adiabatic Working Capacity (Yf=0.1)
• Isothermal working capacity exceeds adiabatic working capacity by several factors
• Adsorbent requirement scales directly with CO2
working capacity
• Adiabatic working capacity has a maximum unlike isothermal working capacity
CO2 Working Capacity - NaX
0.00
0.20
0.40
0.60
0.80
1.00
1.20
1.40
1.60
1.80
290 310 330 350 370 390
T(K)
WC
(gm
ol/kg
)
isothermal
adiabatic

www.monash.edu.au
19
Comparison of Isothermal and Adiabatic Working Selectivities (Yf=0.1)
• Isothermal working
selectivity exceeds
adiabatic working
selectivity by several
factors
• Adsorbent purity and
recovery scales with
CO2 working
selectivity
• Both show a
maximum but at
different locations
CO2 Working Selectivity - NaX
0.00
0.50
1.00
1.50
2.00
2.50
3.00
3.50
4.00
4.50
290 310 330 350 370 390
T(K)
WS
isothermal
adiabatic
www.monash.edu.au
20
Comparison of adsorbents – Adiabatic Working Capacity (Yf=0.15)
CO2 Working Capacity
0.00
0.10
0.20
0.30
0.40
0.50
0.60
0.70
0.80
290 310 330 350 370 390
T(K)
WC
(gm
ol/kg
) NaY
AC
NaX
www.monash.edu.au
21
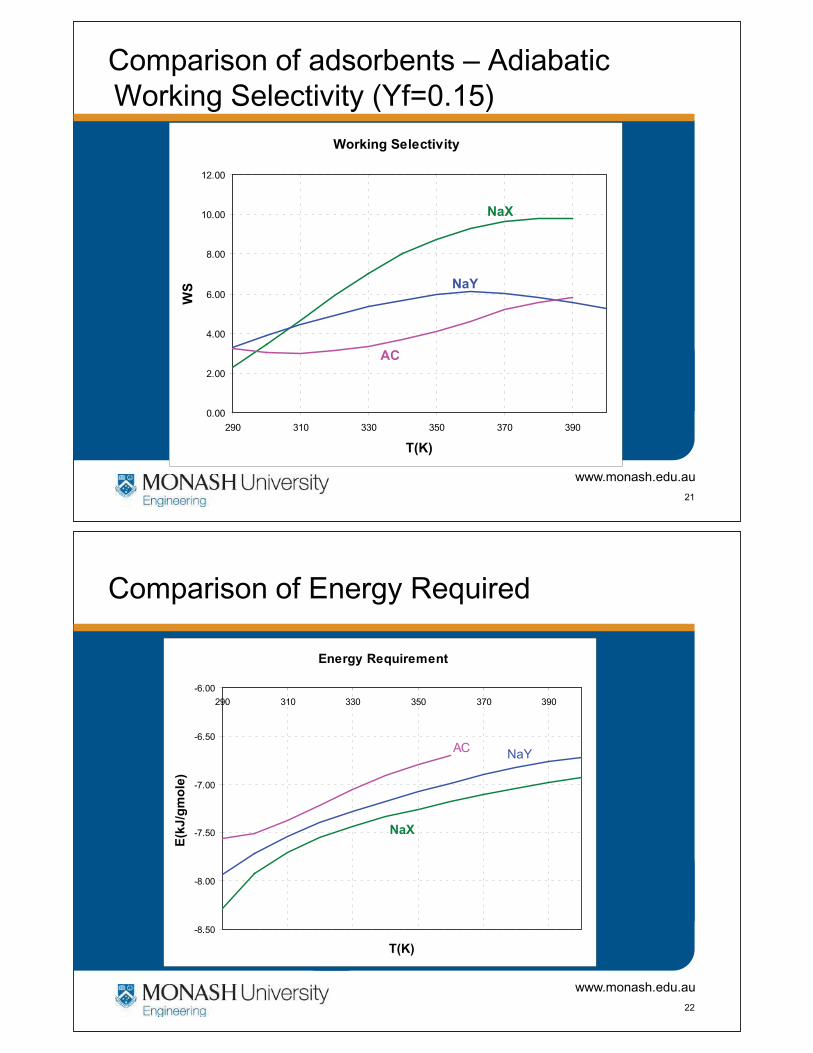
Comparison of adsorbents – Adiabatic Working Selectivity (Yf=0.15)
Working Selectivity
0.00
2.00
4.00
6.00
8.00
10.00
12.00
290 310 330 350 370 390
T(K)
WS NaY
AC
NaX
www.monash.edu.au
22
Comparison of Energy Required
Energy Requirement
-8.50
-8.00
-7.50
-7.00
-6.50
-6.00290 310 330 350 370 390
T(K)
E(k
J/g
mo
le)
NaYAC
NaX

www.monash.edu.au
23
Ranking depends on which parameter to chose
• WC and WS suggests NaX is superior for T >
300, NaY superior for T<300
• AC shows lowest regen. energy
• Ultimate ranking should reflect capture cost
relative to a base case (NaX) (trend at least!)
• Capture Cost depends on capital (use 1/WCCO2
as a surrogate) and power (use WS as a
surrogate). Both also depend on recovery (use
WS as surrogate)
www.monash.edu.au
24
“Capture Figure of Merit” or CFM
• Must necessarily be approximate since relative contributions to capital and operating are site specific
• Need 2 parameters to truly reflect each situation• For a given ratio of capital : power costs, we
combine the parameters into a single CFM:
ref
* CFM; Relative CFM
CFM
WC WSCFM
E� �
www.monash.edu.au
25
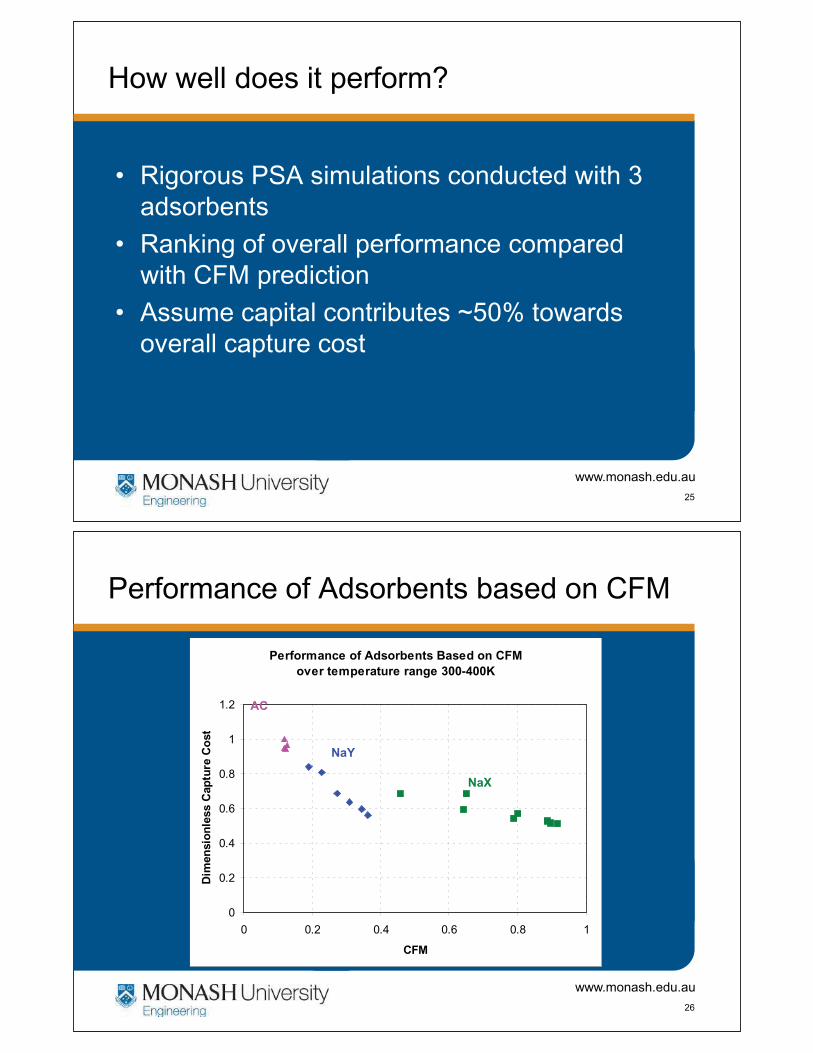
How well does it perform?
• Rigorous PSA simulations conducted with 3 adsorbents
• Ranking of overall performance compared with CFM prediction
• Assume capital contributes ~50% towards overall capture cost
www.monash.edu.au
26
Performance of Adsorbents based on CFM
Performance of Adsorbents Based on CFM
over temperature range 300-400K
0
0.2
0.4
0.6
0.8
1
1.2
0 0.2 0.4 0.6 0.8 1
CFM
Dim
en
sio
nle
ss C
ap
ture
Co
st
AC
NaY
NaX

www.monash.edu.au
27
Selection of Operating Temperature based on CFM
NaX Performance Based on CFM
over temperature range 300-400K
0
1
2
3
4
5
6
7
300 320 340 360 380 400
Tfeed(K)
CF
M
NaX
www.monash.edu.au
28
Laboratory and Pilot Scale Work
• Vacuum Swing Cycle with multiple beds
• Minimum pressurization of feed gas
• Evacuation of beds to low pressure (< 10kPa)
• Energy is used on recovered stream only, not on total feed stream
• Cyclic process to ensure longevity of adsorbent

www.monash.edu.au
29
Process Development and Testing
• Experimental pilot scale
plant
provides “real” operating data validates process simulations
– 3 beds, 1m x 8 cm i.d.
• Simulation
allows prediction of the effect of operating and design variables
– in-house simulation tools
www.monash.edu.au
30
PSA Cycle Design: Nine step cycle (product purge)
II III IV V VI
FP
W
I VII
P
W
ITEM Step 1 Step 2 Step 3 Step 4 Step 5 Step 6 Step 7 Step 8 Step 9
Bed 1 I II II III IV V VI VII VII
Bed 2 VI VII VII I II II III IV V
Bed 3 III IV V VI VII VII I II II

www.monash.edu.au
31
Performance 6-step Cycle no purge
9-Step cycle with purge
Purity, % 82~83 90~95
Recovery, % 60~80 60~70
Power, kW/TPDc
4-8 8~12
Power,MJ/kg CO2
0.35 to 0.7 0.7 to 1.0
Performance Data for 6 and 9 step VSA cycles
Cycle can be optimised for specific feed gas - adsorbent combinations
www.monash.edu.au
32
Water: Not just an “impurity”
• Will our existing adsorbent (13X) tolerate high concentrations of water?
• What is the impact on process performance (purity, recovery, power) of high humidity flue gas streams
• Can we operate at elevated temperature?• If water adversely affects CO2 capture plant
performance, can we “protect” the adsorbent?• What is the impact of impurities (SOx, NOX for post
combustion, NH3, H2S for pre-combustion) on adsorbents?

www.monash.edu.au
3333
Water and Impurities - Multilayers
www.monash.edu.au
34
Current P/VSA process currently undergoing testing at a Power Plant
• Multi-step cycle with 3 beds including two pressure equalizations, heavy and light rinse, heavy purge effluent recycle
• Up to 1 TPDc
• Capable of “deep” vacuum (1-2 kPa)
• Wash tower will remove impurities and reduce water level.

www.monash.edu.au
35
Demonstration Plant in fabrication shop
www.monash.edu.au
36
Demonstration Plant

www.monash.edu.au
37
www.monash.edu.au

www.monash.edu.au
www.monash.edu.au
40

www.monash.edu.au
41
Conditions – Flue Gas & Adsorbent
NaX Sorbead WS
Manufacturer UOP BASF-Engelhard
Mass in each column(3:1),kg
25.00 9.15
Mass in each column(9:1),kg
29.96 3.66
Price, US$/kg 11.18 7.10
Water capacity, wt% sat
28 >34
Structure Crystalline
Amorphous
Property Value
CO2, % 12
O2, % 8
CO, ppm 40
NOx, ppm 170-250
SOx, ppm 60-270
H2O, % ~10
www.monash.edu.au
42
Pressure Profiles with Simple Cycle (no Purge)
0
20
40
60
80
100
120
140
0 100 200 300 400 500 600 700
Time,second
Pre
ssu
re,k
Pa.a PIT201
PIT203
PIT204
PIT205
PIT206

www.monash.edu.au
43
Preliminary Results
6-step without purge (Actual plant)
Purity: ~71%
Recovery: ~60%
6-step without purge (Simulation with void volume)
Purity: ~70% Recovery: 75%
9-step with purge (Simulation with low void volume)
Purity: 96% Recovery: 75%
Power consumption: 12kW/TPD ~ 1 MJ/kg CO2 captured
www.monash.edu.au
44
Engineering Issues
• Ash carryover from wash tower
• Water condensation in adsorption
vessels
• Corrosion & Blockage in feed blower
• Large void space dilutes product % CO2
• Partial fluidization at high gas velocity
• Main capture plant disruption

www.monash.edu.au
45
Water Condensation – reduces pumping capacity
www.monash.edu.au
46
Void Volumes
Simulations
indicates a
drop in purity
of 5-10%

www.monash.edu.au
47
Conclusions
• CO2 Capture using adsorption processes is
technically feasible but issues remain
– Scale-up is significant challenge– Advantages of no waste, very limited water use– Very simple process– Significant improvements can be made using
advanced adsorbents but must be careful of water and other impurities
• Adsorbent development must carefully
consider the relationship to the process
www.monash.edu.au
48