clustering approaches for high- throughput data sushmita roy bmi/cs 576 [email protected] nov...
TRANSCRIPT
Clustering approaches for high-throughput data
Sushmita RoyBMI/CS 576
www.biostat.wisc.edu/[email protected]
Nov 12th, 2013
Key concepts
• Hierarchical clustering• Determining the number of clusters• Ways to assess cluster quality

Hierarchical clustering
• In K-means and GMMs we need to specify the number of clusters
• Hierarchical clustering instead requires us to specify how much dissimilarity we will tolerate
• We maintain a matrix of distance (or similarity) scores for all pairs of– expression vectors– clusters (formed so far)– Expression vectors and clusters
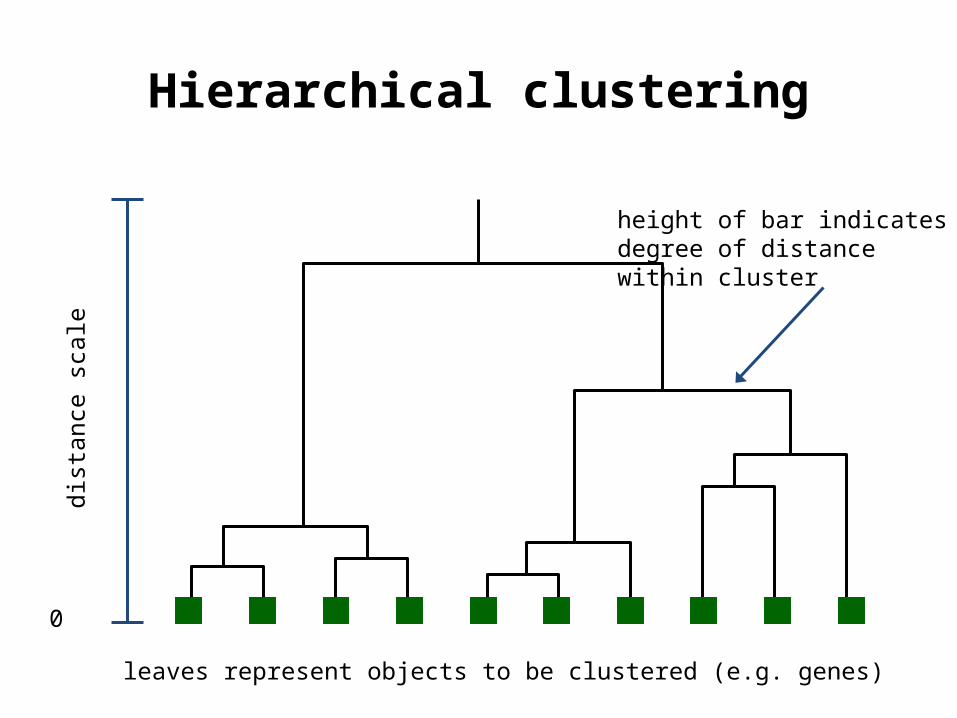
Hierarchical clustering
leaves represent objects to be clustered (e.g. genes)
height of bar indicates degree of distance within cluster
dist
ance
sca
le
0
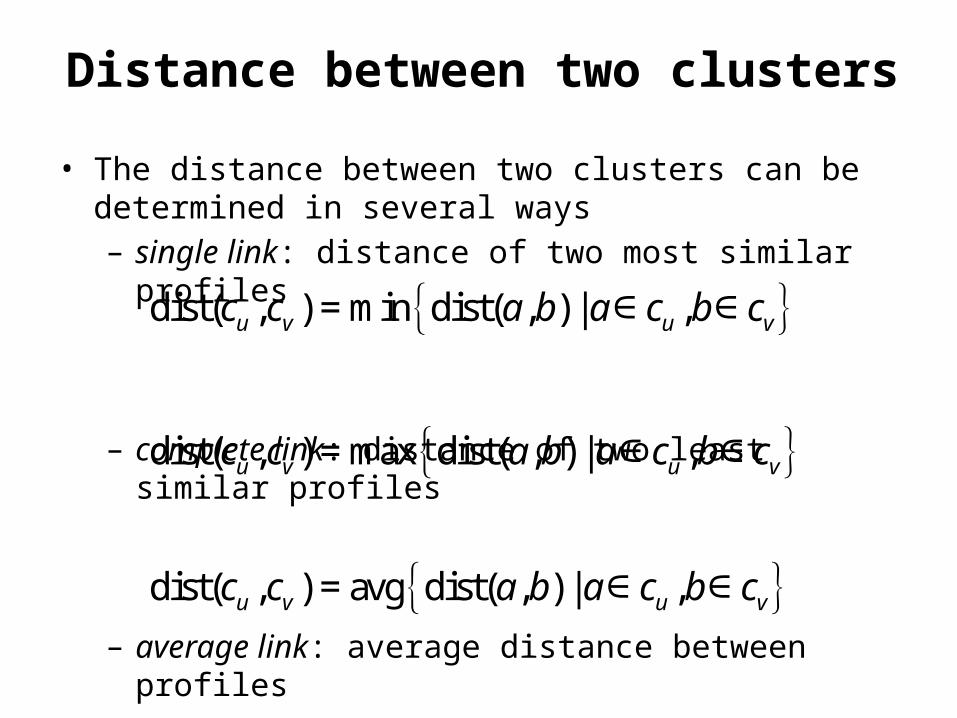
Distance between two clusters
• The distance between two clusters can be determined in several ways– single link: distance of two most similar profiles
– complete link: distance of two least similar profiles
– average link: average distance between profiles
{ }dist( , ) min dist( , ) | ,u v u vc c a b a c b c= ∈ ∈
{ }dist( , ) max dist( , ) | ,u v u vc c a b a c b c= ∈ ∈
{ }dist( , ) avg dist( , ) | ,u v u vc c a b a c b c= ∈ ∈
Updating distances efficiently
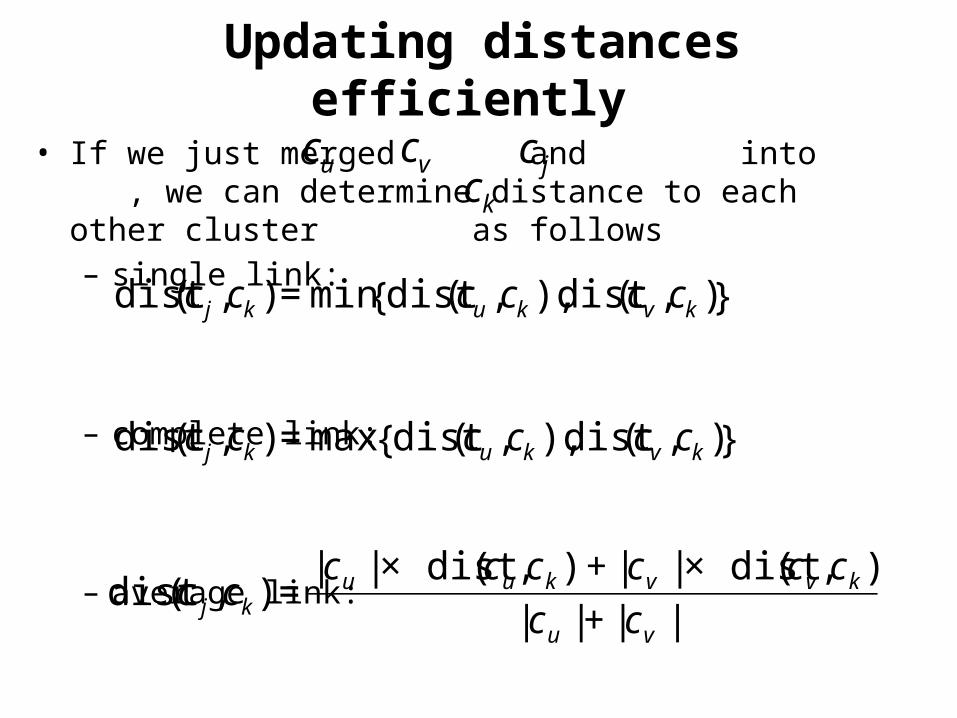
• If we just merged and into , we can determine distance to each other cluster as follows– single link:
– complete link:
– average link:€
dist(c j ,ck ) = min dist(cu ,ck ),dist(cv ,ck ){ }
€
dist(c j ,ck ) = max dist(cu ,ck ),dist(cv ,ck ){ }
€
dist(c j ,ck ) =| cu | × dist(cu,ck ) + | cv | × dist(cv,ck )
| cu | + | cv |
jcuc vckc

Effect of different linkage methods
Complete linkage
Average linkage
Single linkage
Flat clustering from a hierarchical clustering
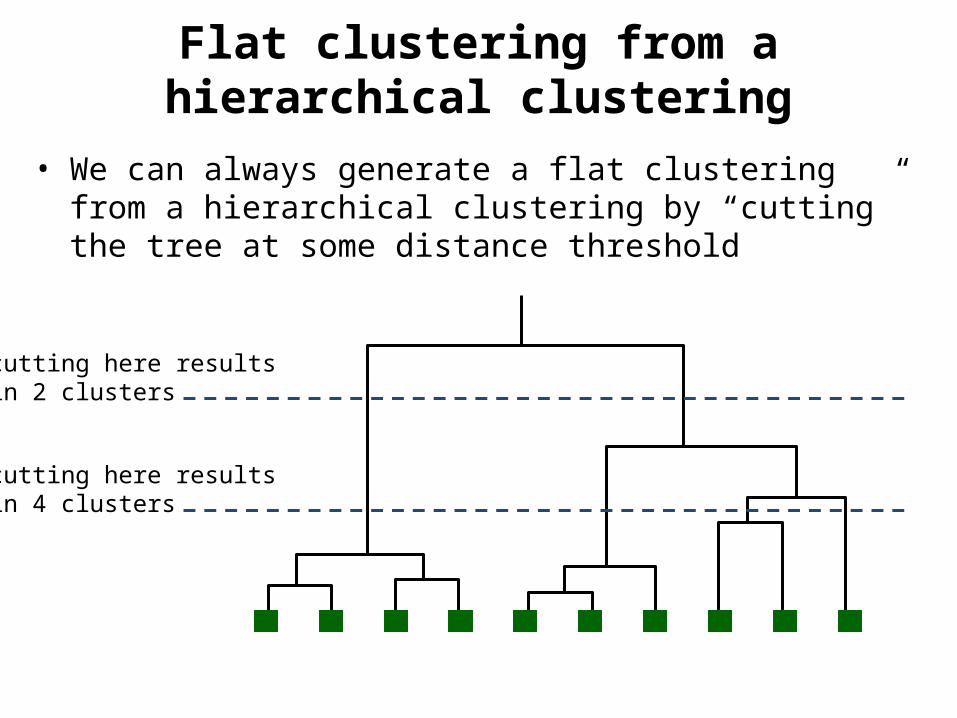
cutting here resultsin 2 clusters
cutting here resultsin 4 clusters
• We can always generate a flat clustering from a hierarchical clustering by “cutting” the tree at some distance threshold

Computational complexity
• The naïve implementation of hierarchical clustering has time complexity, where n is the number of objects– computing the initial distance matrix takes time– there are merging steps– on each step, we have to update the distance matrix and
select the next pair of clusters to merge• K-means and EM have time complexity for each iteration
– reassignment step: compute K × n distances– recomputation step: loop through n profiles updating k means
)( 3nO
)(nO)(nO
)( 2nO
)( 2nO
Choosing the number of clusters
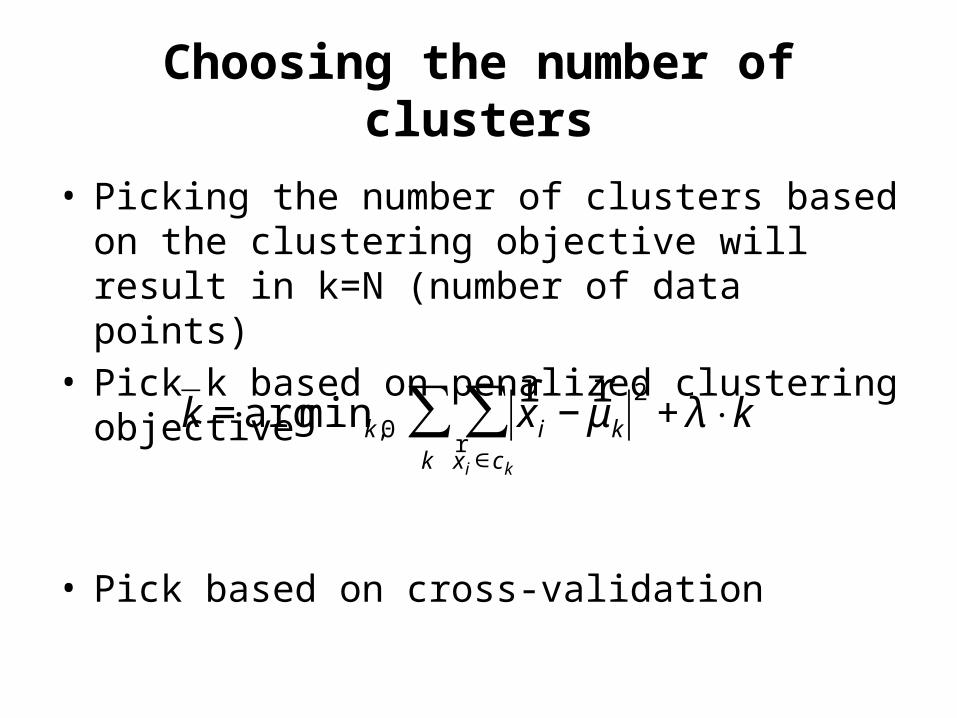
• Picking the number of clusters based on the clustering objective will result in k=N (number of data points)
• Pick k based on penalized clustering objective
• Pick based on cross-validation
€
k = argmink,Θ
r x i −
r μ k
2
r x i ∈ck
∑k
∑ + λ ⋅ k

Picking k based on cross-validation
Cluster Cluster Cluster
Training set Test set
Evaluate Evaluate Evaluate
Average
Data set
Split into 3 sets
Compute objective based on test data
Run method on all data once k has been determined
Evaluation of clusters
• Internal validation– How well does clustering optimize the intra-cluster
similarity and inter-cluster dissimilarity
• External validation– Do genes in the same cluster have similar function?

Internal validation
• One measure of assessing cluster quality is the Silhouette index (SI)
• More positive the SI, better the clusters
K: number of clustersCj : Set representing jth clusterb(xi): Average distance of xi to instances in next closest clustera(xi): Average distance of xi to other instances in same cluster
External validation
• Are genes in the same cluster associated with similar function?
• Gene Ontology (GO) is a controlled vocabulary of terms used to annotate genes of a particular category
• One can use GO terms to study whether the genes in a cluster are associated with the same GO term more than expected by chance
• One can also see if genes in a cluster are associated with similar transcription factor binding sites
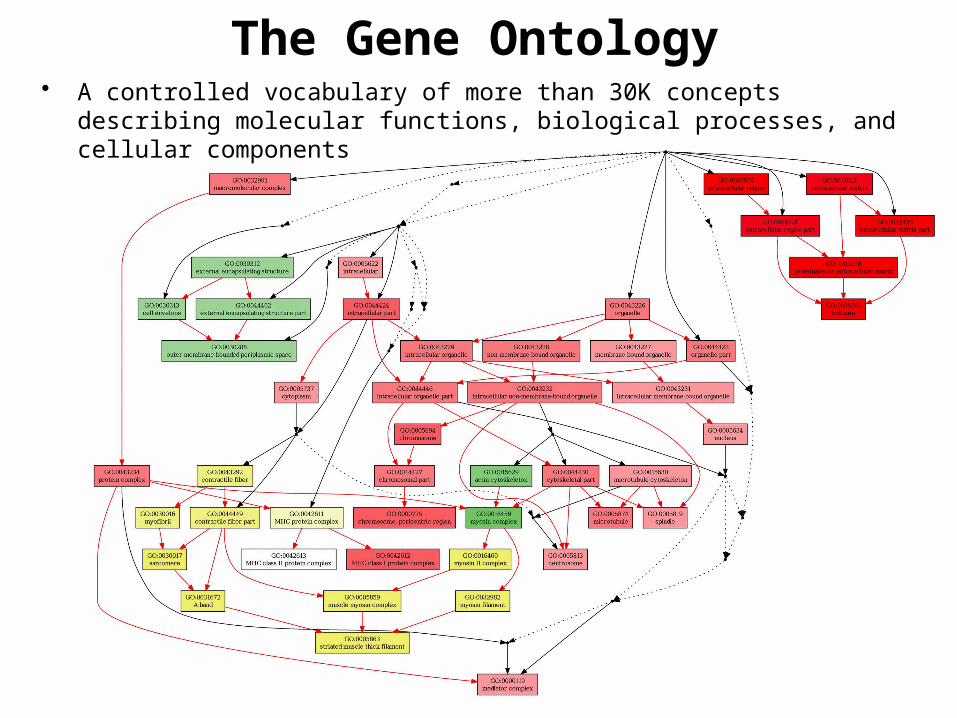
The Gene Ontology• A controlled vocabulary of more than 30K concepts describing molecular
functions, biological processes, and cellular components
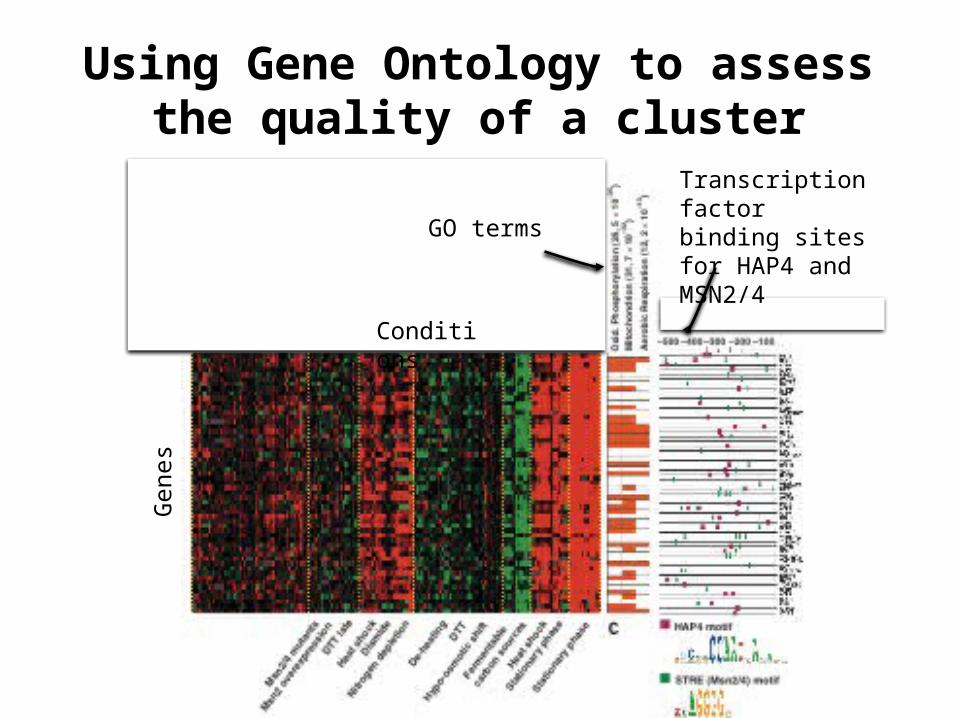
Using Gene Ontology to assess the quality of a cluster
Gen
es
Conditions
GO terms
Transcription factor binding sites for HAP4 and MSN2/4
Summary of clustering
• Many different methods to cluster– Flat clustering– Hierarchical clustering– Distance metrics among objects can influence clustering
results a lot
• Picking the number of clusters is difficult but there are some ways to do this
• Evaluation of clusters is hard sometimes– Comparison with other sources of information can help
assess cluster quality