f ai #arl n - biostat.wisc.edu
TRANSCRIPT
Reproducible Research
Karl Broman
Biostatistics & Medical Informatics, UW–Madison
kbroman.orggithub.com/kbroman
@kwbromanSlides: bit.ly/Memphis2015b
These are slides for a talk I gave for the Molecular Microbial Ecologyand Evolution (MoMiEE) group at UW-Madison on 11 May 2015, theannual retreat of the Center for Genome Dynamics, Jackson Lab, on28 May 2015, the Summer Institute for Training in Biostatistics(SIBS) at UW-Madison, on 9 July 2015, and the Division ofBiostatistics, University of Tennessee Health Science Center,Memphis, TN, on 4 Nov 2015.
Source: https://github.com/kbroman/Talk_ReproResSlides: http://bit.ly/Memphis2015b_nonotesWith notes: http://bit.ly/Memphis2015b
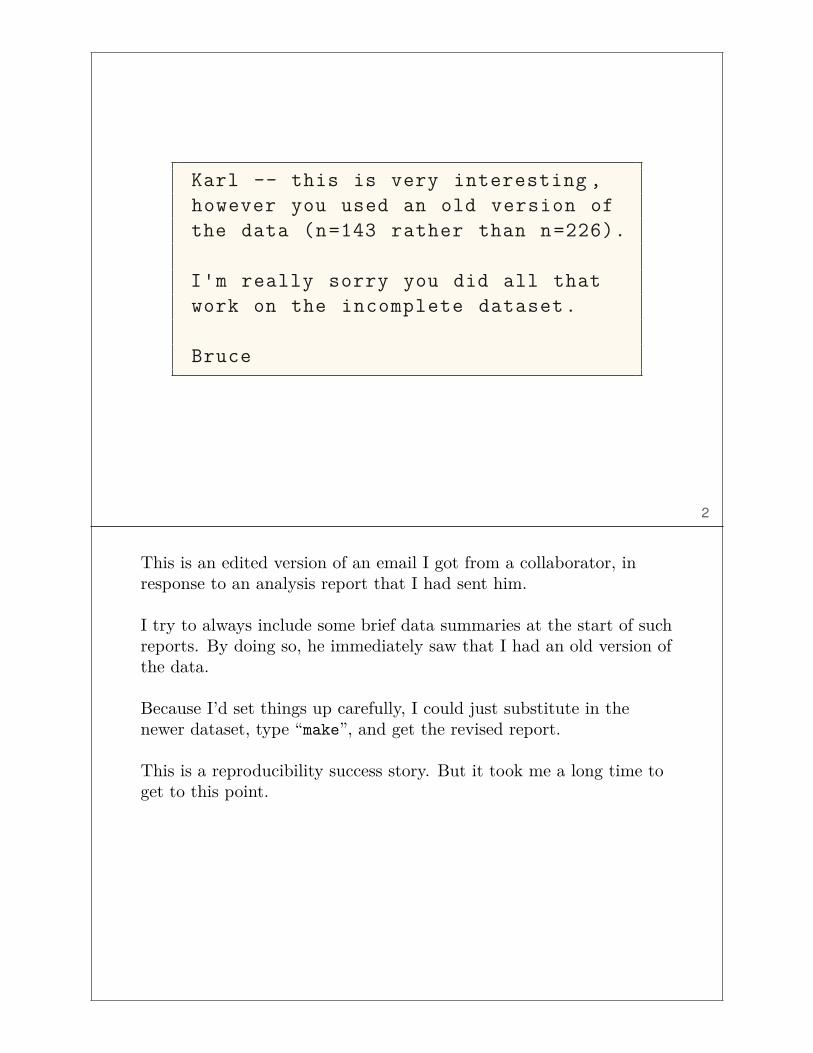
Karl -- this is very interesting ,however you used an old version ofthe data (n=143 rather than n=226).
I'm really sorry you did all thatwork on the incomplete dataset.
Bruce
2
This is an edited version of an email I got from a collaborator, inresponse to an analysis report that I had sent him.
I try to always include some brief data summaries at the start of suchreports. By doing so, he immediately saw that I had an old version ofthe data.
Because I’d set things up carefully, I could just substitute in thenewer dataset, type “make”, and get the revised report.
This is a reproducibility success story. But it took me a long time toget to this point.
The results in Table 1 don't seem tocorrespond to those in Figure 2.
3
My computational life is not entirely rosy. This is the sort of emailthat will freak me out.
In what order do I run these scripts?
4
Sometimes the process of data file manipulation and data cleaninggets spread across a bunch of scripts that need to be executed in aparticular order. Will I record this information? Is it obvious whatscript does what?
Where did we get this data file?
5
Record the provenance of all data or metadata files.
Why did I omit those samples?
6
I may decide to omit a few samples. Will I record why I omittedthose particular samples?
How did I make that figure?
7
Sometimes, in the midst of a bout of exploratory data analysis, I’llcreate some exciting graph and have a heck of a time reproducing itafterwards.
"Your script is now giving an error."
8
It was working last week. Well, last month, at least.
How easy is it to go back through that script’s history to see whereand why it stopped working?
"The attached is similar to the code we used."
9
From an email in response to my request for code used for a paper.
Reproducible
vs.
Replicable
10
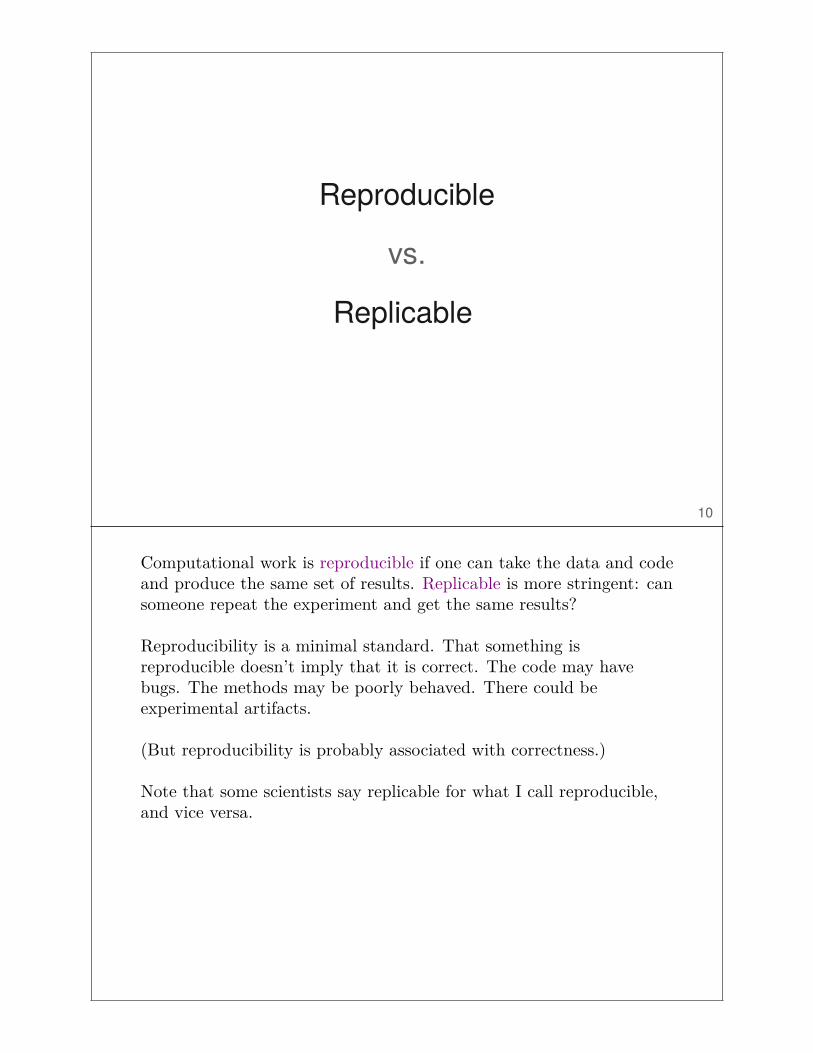
Computational work is reproducible if one can take the data and codeand produce the same set of results. Replicable is more stringent: cansomeone repeat the experiment and get the same results?
Reproducibility is a minimal standard. That something isreproducible doesn’t imply that it is correct. The code may havebugs. The methods may be poorly behaved. There could beexperimental artifacts.
(But reproducibility is probably associated with correctness.)
Note that some scientists say replicable for what I call reproducible,and vice versa.
Levels of quality
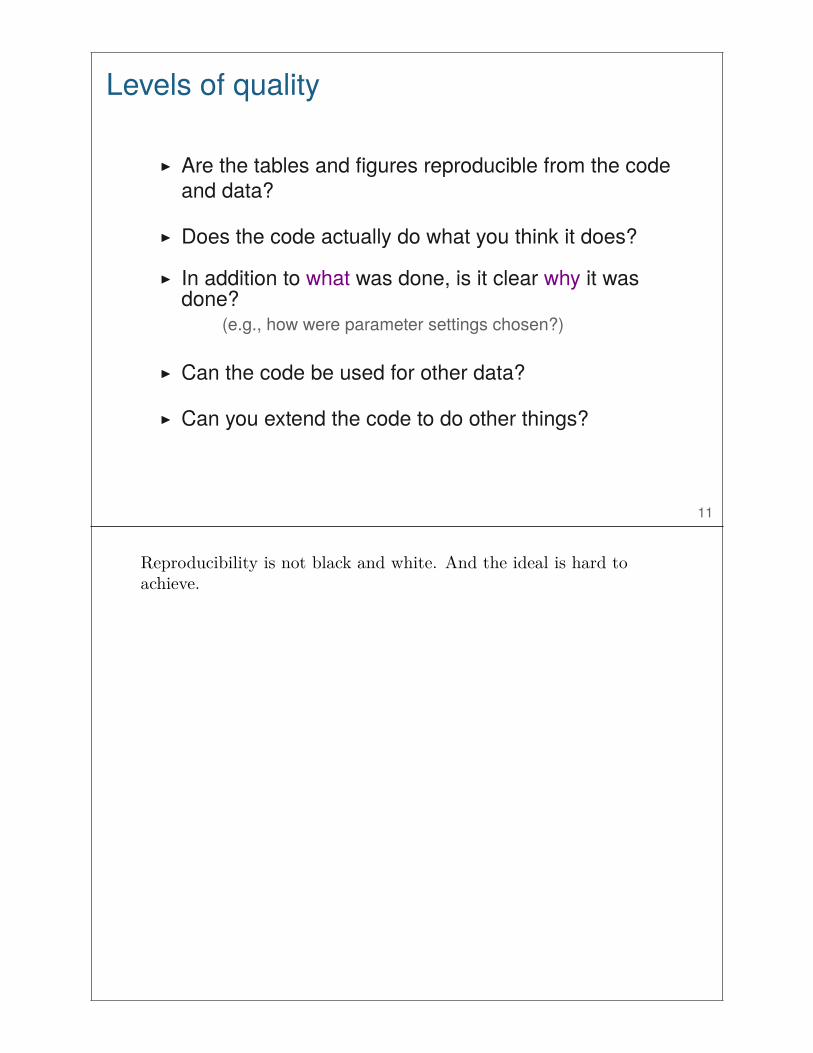
▶ Are the tables and figures reproducible from the codeand data?
▶ Does the code actually do what you think it does?
▶ In addition to what was done, is it clear why it wasdone?
(e.g., how were parameter settings chosen?)
▶ Can the code be used for other data?
▶ Can you extend the code to do other things?
11
Reproducibility is not black and white. And the ideal is hard toachieve.
Steps toward reproducible research
kbroman.org/steps2rr
12
The above website contains my thoughts on how to move towards fullreproducibility.
Don’t try to change every aspect of your workflow all at once.
1. Everything with a script
If you do something once,you'll do it 1000 times.
13
The most basic principle for reproducible research is: do everythingvia code.
Downloading data from the web, converting an Excel file to CSV,renaming columns/variables, omitting bad samples or data points...doall of this with scripts.
You may be tempted to open up a data file and hand-edit. But if youget a revised version of that file, you’ll need to do it again. And it’llbe harder to figure out what it was that you did.
Some things are more cumbersome via code, but in the long run you’llsave time.
2. Organize your data & code
Your closest collaborator is you six months ago,but you don't reply to emails.
(paraphrasing Mark Holder)
14
You don’t need to be organized, but it sure will help others (oryourself, later), when you try to figure out what it was that you did.
Segregate all the materials for a project in one directory/folder onyour harddrive.
I prefer to separate raw data from processed data, and I put code in aseparate directory.
Write ReadMe files to explain what’s what.
3. Automate the process (GNU Make)
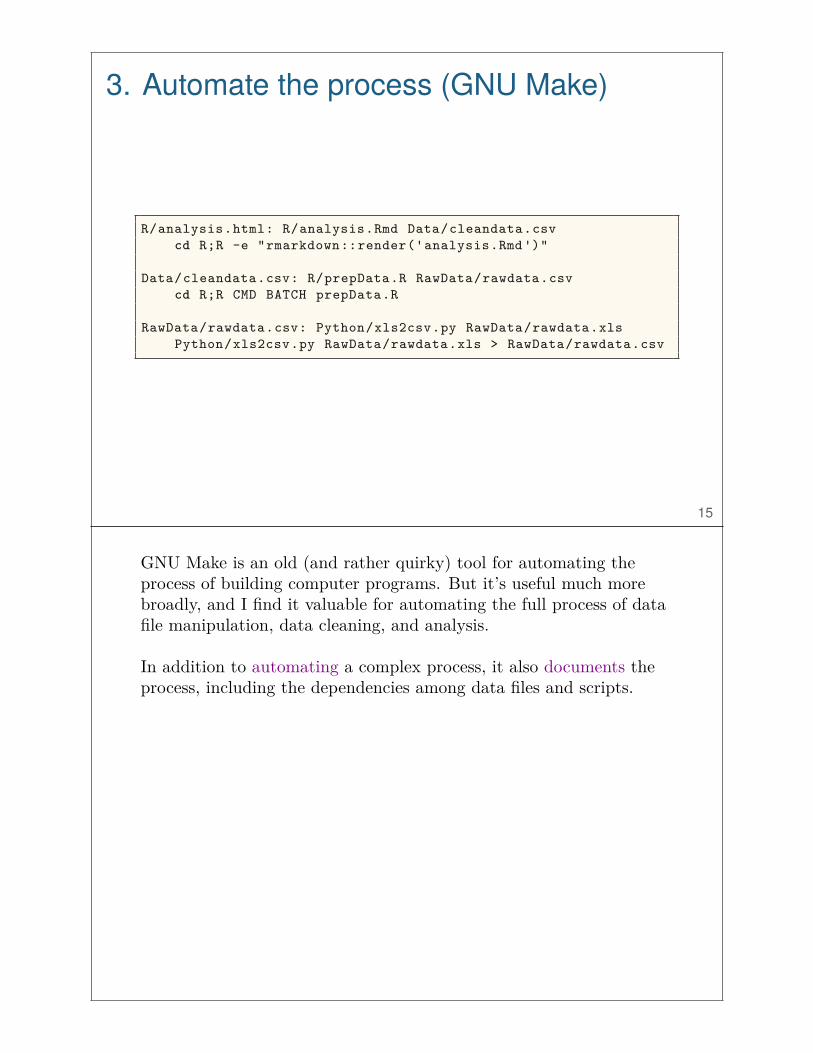
R/analysis.html: R/analysis.Rmd Data/cleandata.csvcd R;R -e "rmarkdown::render('analysis.Rmd')"
Data/cleandata.csv: R/prepData.R RawData/rawdata.csvcd R;R CMD BATCH prepData.R
RawData/rawdata.csv: Python/xls2csv.py RawData/rawdata.xlsPython/xls2csv.py RawData/rawdata.xls > RawData/rawdata.csv
15
GNU Make is an old (and rather quirky) tool for automating theprocess of building computer programs. But it’s useful much morebroadly, and I find it valuable for automating the full process of datafile manipulation, data cleaning, and analysis.
In addition to automating a complex process, it also documents theprocess, including the dependencies among data files and scripts.
4. Turn scripts into reproducible reports
16
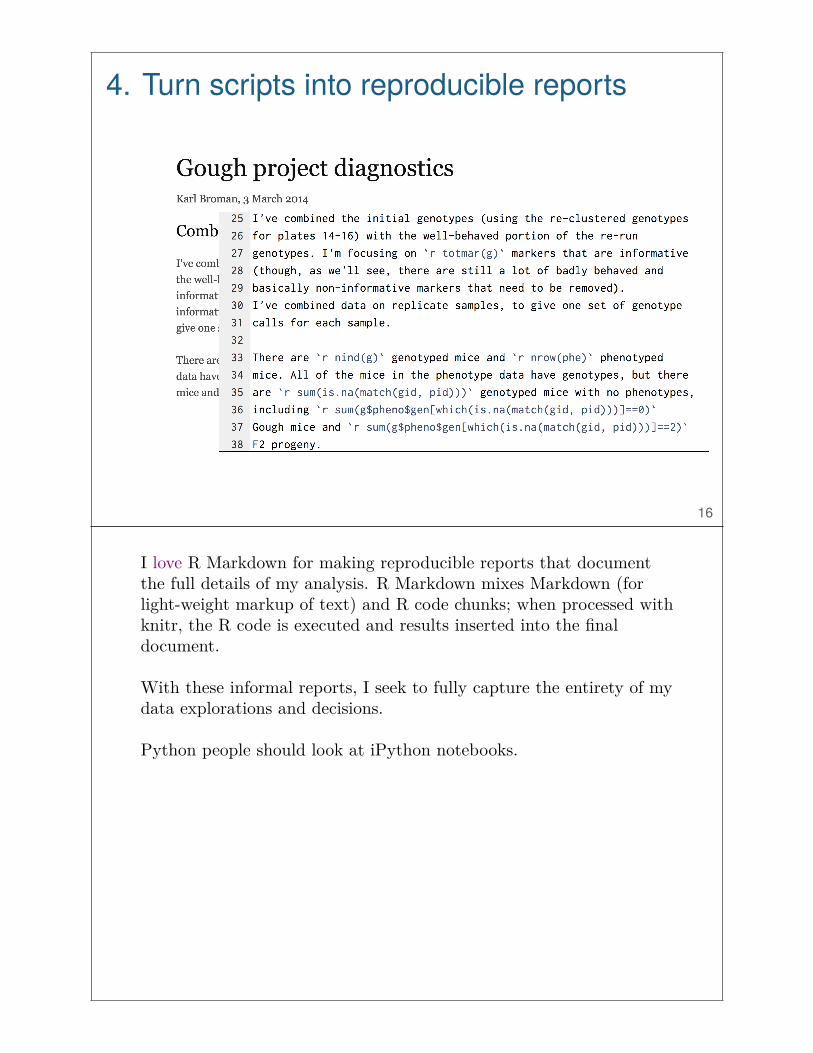
I love R Markdown for making reproducible reports that documentthe full details of my analysis. R Markdown mixes Markdown (forlight-weight markup of text) and R code chunks; when processed withknitr, the R code is executed and results inserted into the finaldocument.
With these informal reports, I seek to fully capture the entirety of mydata explorations and decisions.
Python people should look at iPython notebooks.
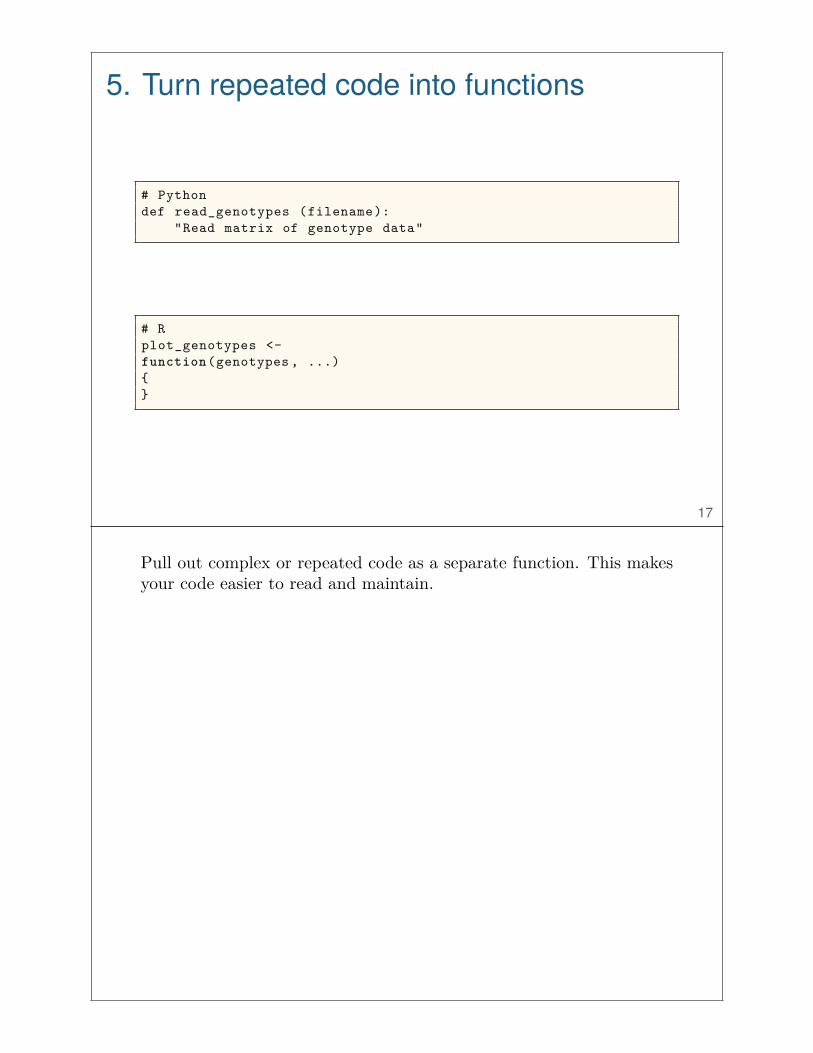
5. Turn repeated code into functions
# Pythondef read_genotypes (filename):
"Read matrix of genotype data"
# Rplot_genotypes <-function(genotypes , ...){}
17
Pull out complex or repeated code as a separate function. This makesyour code easier to read and maintain.
6. Create a package/module
Don't repeat yourself
18
It’s surprisingly easy to create an R package (seehttp://kbroman.org/pkg_primer) and it’s even easier to make aPython module.
When writing functions, try to write them in a somewhat-general wayand then pull them out of the project as separate package or module,so that you (and/or others) may reuse them for other purposes.
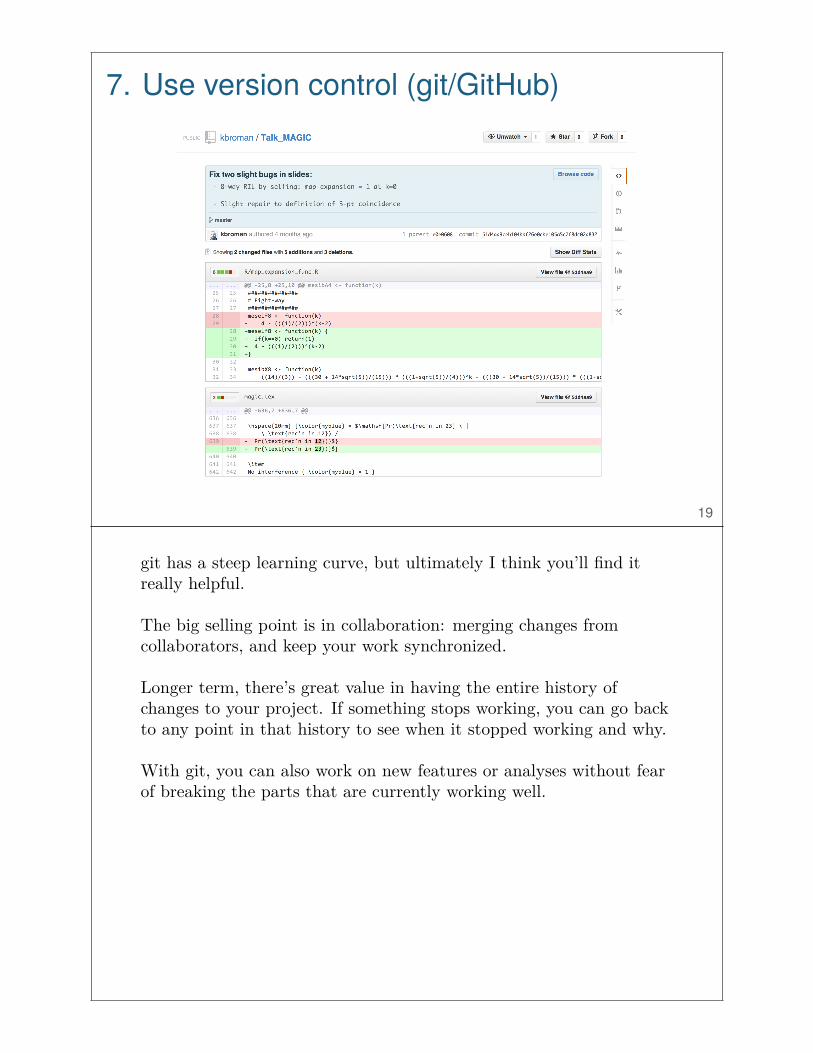
7. Use version control (git/GitHub)
19
git has a steep learning curve, but ultimately I think you’ll find itreally helpful.
The big selling point is in collaboration: merging changes fromcollaborators, and keep your work synchronized.
Longer term, there’s great value in having the entire history ofchanges to your project. If something stops working, you can go backto any point in that history to see when it stopped working and why.
With git, you can also work on new features or analyses without fearof breaking the parts that are currently working well.
8. License your software
Pick a license, any license
– Jeff Atwood
20
If you don’t pick a license for your software, no one else can use it.
So if you want to distribute your code so that others can reproduceyour analyses, you need to pick a license, any license.
I choose between the MIT license and the GPL.
Don’t use the Creative Commons licenses for code. But feel free touse them for other things.
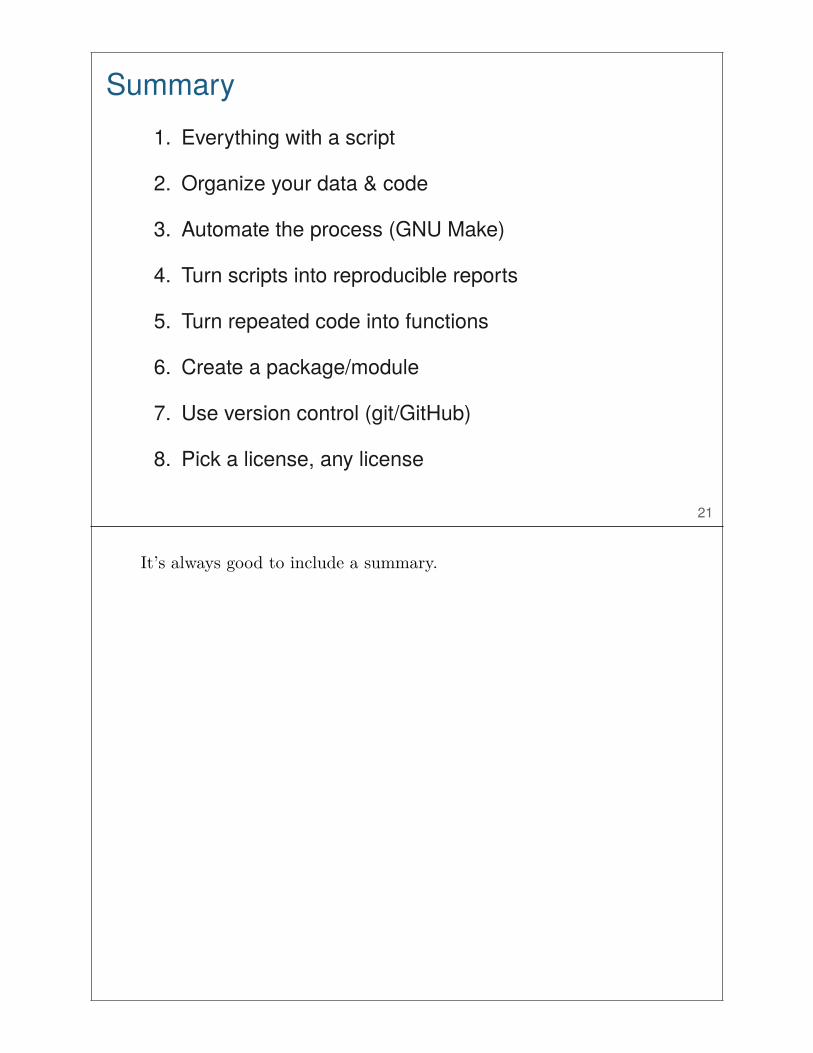
Summary1. Everything with a script
2. Organize your data & code
3. Automate the process (GNU Make)
4. Turn scripts into reproducible reports
5. Turn repeated code into functions
6. Create a package/module
7. Use version control (git/GitHub)
8. Pick a license, any license
21
It’s always good to include a summary.
Slides: bit.ly/Memphis2015b
kbroman.org
github.com/kbroman
@kwbroman
22
Here’s where you can find me, as well as the slides for this talk.