cluster lenses - springer
TRANSCRIPT

Astron Astrophys Rev (2011) 19:47DOI 10.1007/s00159-011-0047-3
Cluster lenses
Jean-Paul Kneib · Priyamvada Natarajan
Published online: 12 November 2011© The Author(s) 2011. This article is published with open access at Springerlink.com
Abstract Clusters of galaxies are the most recently assembled, massive, bound struc-tures in the Universe. As predicted by General Relativity, given their masses, clustersstrongly deform space-time in their vicinity. Clusters act as some of the most pow-erful gravitational lenses in the Universe. Light rays traversing through clusters fromdistant sources are hence deflected, and the resulting images of these distant objectstherefore appear distorted and magnified. Lensing by clusters occurs in two regimes,each with unique observational signatures. The strong lensing regime is character-ized by effects readily seen by eye, namely, the production of giant arcs, multipleimages, and arclets. The weak lensing regime is characterized by small deformationsin the shapes of background galaxies only detectable statistically. Cluster lenses havebeen exploited successfully to address several important current questions in cos-mology: (i) the study of the lens(es)—understanding cluster mass distributions andissues pertaining to cluster formation and evolution, as well as constraining the na-ture of dark matter; (ii) the study of the lensed objects—probing the properties ofthe background lensed galaxy population—which is statistically at higher redshiftsand of lower intrinsic luminosity thus enabling the probing of galaxy formation atthe earliest times right up to the Dark Ages; and (iii) the study of the geometry ofthe Universe—as the strength of lensing depends on the ratios of angular diameterdistances between the lens, source and observer, lens deflections are sensitive to the
J.-P. Kneib (�)Laboratoire d’Astrophysique de Marseille, CNRS-Université Aix-Marseille, 38 rue F. Joliot-Curie,13388 Marseille Cedex 13, Francee-mail: [email protected]
P. NatarajanDepartment of Astronomy, Yale University, New Haven, CT 06511, USAe-mail: [email protected]
P. NatarajanDepartment of Physics, Yale University, New Haven, CT 06520, USA

Page 2 of 100 Astron Astrophys Rev (2011) 19:47
value of cosmological parameters and offer a powerful geometric tool to probe DarkEnergy. In this review, we present the basics of cluster lensing and provide a currentstatus report of the field.
Keywords Cosmology: observations · Galaxies: evolution · Galaxies: formation ·Gravitational lensing
1 Introduction and historical perspective
In the early days of modern cosmology, soon after it was realized that the Universewas expanding (Hubble 1929, 1931; Lemaître 1931); Zwicky (1933) suggested thatsome unseen matter was the likely dominant mass component in clusters of galaxies.With remarkable prescience, Zwicky (1937) further noted that gravitational lensingby clusters would be an invaluable tool to: (i) trace and measure the amount of thisunseen mass, now referred to as dark matter and currently thought to pervade thecosmos; and (ii) study magnified distant objects lying behind clusters. Zwicky’s boldpredictions were based on a profound and intuitive understanding of the properties ofgravitational lensing. However, at that time, inadequate imaging technology coupledwith the lack of theoretical understanding of structure formation in the Universe ham-pered further observational progress and discoveries of gravitational lensing effects.
Although the existence of clusters of galaxies has been recognized for nearly twocenturies—they were first recognized by Messier and Herschel as “remarkable con-centrations of nebulae on the sky” (see the review of Biviano 2000 and referencestherein) the study of clusters began in earnest only really in the 1950s. In particular,the publication of the first comprehensive cluster catalog of the nearby Universe byAbell in 1958, can be considered as a milestone that spurred the study of clusters ofgalaxies transforming it into an active observational research area.
In comparison, gravitational lensing theory developed much later in the 1960swith early theoretical studies demonstrating the usefulness of lensing for astronomy.In particular, Sjur Refsdal derived the basic equations of gravitational lens theory(Refsdal 1964a) and subsequently showed how the gravitational lensing phenomenoncan be used to determine Hubble’s constant by measuring the time delay between twolensed images (Refsdal 1964b). Following the discovery of quasars, Barnothy (1965)proposed gravitational lensing as a tool for the study of quasars. With the discoveryof the first double quasar Q0957+561 by Walsh et al. (1979) gravitational lensingreally emerged in astronomy as an active observational field of study.
The study of clusters of galaxies as astronomical objects on the other hand, cameof age in the 1970s and early 1980s specially with the discovery of the X-ray emittingintra-cluster medium (Lea et al. 1973; Gull and Northover 1976; Bahcall and Sarazin1977; Serlemistos et al. 1977; Cavaliere and Fusco-Femiano 1978) and the numerousstudies of the stellar populations of galaxies in clusters (Bautz and Morgan 1970;Sandage 1976; Leir and van den Bergh 1977; Hoessl et al. 1980; Dressler 1980).However, there was no discussion of their lensing properties in theoretical papers tillthe 1980s. The paper by Narayan et al. (1984) is one of the earliest theoretical papersthat explored in detail the possibility that clusters can act as powerful lenses. As an

Astron Astrophys Rev (2011) 19:47 Page 3 of 100
example, this paper explained large separation multiple quasars as likely “cluster-assisted” lensing systems. Although such a possibility had been already proposed byYoung et al. (1980), who discovered a cluster of galaxies near the first double quasarQ0957+561, it was not so obvious for most other systems.
The likely explanation for the lack of interest in cluster lensing research was prob-ably the belief that clusters were rather diffuse/extended systems and therefore notdense enough to act as powerful light deflectors. Only with the establishment of therole of cold dark matter in structure formation, did it become clear that clusters areindeed repositories of vast amounts of dark matter that enable them to act as efficientlenses in the Universe. The theory of structure formation in the context of a colddark matter dominated Universe was developed in a seminal paper by Blumenthalet al. (1984). An attractive feature of this cold dark matter hypothesis was its consid-erable predictive power: the post-recombination fluctuation spectrum was calculable,and it in turn governs the formation of galaxies and clusters. At that time, good agree-ment with the data was obtained for a Zel’dovich spectrum of primordial fluctuations.Several decades later, a version of this paradigm the � Cold Dark Matter (�CDMhereafter) model which postulates the existence of a non-zero cosmological constantΩ� is currently well established and is in remarkable agreement with a wide rangeof current observations on cluster and galaxy scales.
Nevertheless, it still came as quite a surprise when in 1986, Lynds and Petrosian(1989) and Soucail et al. (1987) independently discovered the first “giant arcs”: thestrongly elongated images of distant background galaxies in the core of massive clus-ters (see Fig. 1). This new phenomenon was then immediately identified by Paczynski(1987) as the consequence of gravitational lensing by the dense centers of clusters,and was soon confirmed by the measurement of the redshift of the arc in Abell 370(Soucail et al. 1988). The discovery of giant arcs revealed the existence of the stronglensing regime, however, as we know now, it only represents the tip of the iceberg!
Coupled with the growing theoretical understanding of the structure and assem-bly history of clusters, this observational discovery of cluster lensing opened up anentire new vista to probe the detailed distribution of dark matter in these systems.In 1990, Antony Tyson while obtaining deep CCD imaging of clusters, identified a“systematic alignment” of faint galaxies around cluster cores (Tyson et al. 1990). Hethen suggested that this weak alignment produced by the distortion due to lensingby clusters could be used to map dark matter at larger radii in clusters than stronglensing afforded. These two key discoveries of strong and weak lensing, respectively,opened up a rich, new field in astronomy, the study of “cluster lenses”, which wediscuss further in this review.
These observational discoveries stoked the theoretical community to produce anumber of key papers in the first half of the 1990s that developed the theoreticalframework for strong and weak lensing techniques. Several of the seminal papersdate from this period, and theorists delved into quantifying this new territory of grav-itational lensing. Some of the significant early papers are: Schneider (1984), Bland-ford and Narayan (1986), Blandford et al. (1989), Kochanek (1990), Miralda-Escudé(1991), Kaiser (1992), and Kaiser and Squires (1993). It is important to underline thatsignificant advances in technology spurred the field dramatically during these years.The discovery of the lensing phenomenon in clusters was made possible thanks to

Page 4 of 100 Astron Astrophys Rev (2011) 19:47
Fig. 1 The galaxy cluster Abell 370 as observed by CFHT in 1985 (left) with one of the first CCDcameras (R-band), in which the first gravitationally lensed arc was later identified (Lynds and Petrosian1989; Soucail et al. 1987). For comparison, the image on the right shows the Hubble Space Telescopeimage of the same cluster Abell 370 taken with the WFPC-2 camera with the F675W filter in December1995 (Soucail et al. 1999). Most of the bright galaxies seen are cluster members at z = 0.375, whereas thearc, i.e. the highly elongated feature, is the image of a background galaxy at redshift z = 0.724 (Soucailet al. 1988). The image is oriented such that North is on top, East to the left and the field of view is roughly40 × 60 arcsec2
the successful development of CCD imaging that allowed deeper and sharper opticalimages of the sky, as well as deep spectroscopy—essential to measure the spectrumand the redshifts of the faint lensed background galaxies. Another technological rev-olution was in preparation at that time, a telescope above the atmosphere: the HubbleSpace Telescope (HST). HST has dramatically impacted cluster lensing studies, and,in particular, that of the strong lensing regime. Although launched in 1991, HST didnot make a strong impact at first, as its unforeseen “blurred vision” made the faintimages of distant galaxies inadequate for lensing work. Nevertheless, even with thefirst HST-WFPC1 (Wide Field Planetary Camera) images of Abell 370 and AC114one could already see the potential power of Hubble for lensing studies.
In December 1993, with the first successful servicing mission and the installationof the odd shaped WFPC2 camera, Hubble recovered its image sharpness, and it isnot surprising that one of the first image releases following the installation of WFPC2was the astonishing view of the cluster lens Abell 2218 (Kneib et al. 1996), which isiconic and has been included in most recent introductory astronomy textbooks.
Image sharpness is one of the key pre-requisites for studying lensing by clusters(e.g. Smail and Dickinson 1995) and unsurprisingly another requirement is a largeimage field of view. The strong lensing regime in clusters corresponds to the innerone arc-minute region around the cluster center. Typically, cluster virial radii are ofthe order of a few Mpc, which corresponds to ∼15 arcminutes for a cluster at z ∼ 0.2.

Astron Astrophys Rev (2011) 19:47 Page 5 of 100
Therefore, to go beyond the inner regions and to measure the weak lensing signalfrom cluster outskirts, cameras with a sufficiently large field of view are required toideally cover the full size of a cluster in one shot (e.g. Kaiser et al. 1998; Joffre et al.2000).
From the second half of the 1990s we have seen the rapid development of widefield imaging cameras such as: the UH8k followed by CFHT12k at CFHT (CanadaFrance Hawaii Telescope); Suprime at the Subaru Telescope; WFI at the 2.2 m tele-scope at ESO (European Southern Observatory); the Megacam camera at CFHT; theGigacam of Pan-STARRS (PS-1); the OmegaCam of the VST and soon the DarkEnergy Camera at CTIO (Cerro Tololo Inter-American Observatory). These camerasare composed of a mosaic of many large format CCDs (4k × 2k or larger) allowingcoverage of a large field (ranging from a quarter of a square degree up to a few squaredegrees). The making of these instruments was strongly motivated by the detectionof the weak lensing distortion of faint galaxies produced by foreground clusters andintervening large-scale structure, the latter effect is commonly referred to as “cosmicshear”.
In parallel, techniques to accurately measure the gravitational shear were also de-veloped. The most well documented is the “KSB” technique (Kaiser et al. 1995)which is implemented in the commonly used IMCAT software package,1 whichhas been since improved by several groups. The accuracy of shape measurementsfor distorted background images is key to exploiting lensing effects. The difficultyin the shear measurement arises as galaxy ellipticities need to be measured ex-tremely accurately given that there are other confounding sources that generate dis-tortions. Spurious distortions are induced by the spatially and temporally variablePSF (Point Spread Function) as well as by intrinsic shape correlations that are un-related to lensing (Crittenden et al. 2001, 2002). Corrections that carefully takeinto account these additional and variable sources of image distortion have been in-corporated into shape measurement algorithms like LENSFIT2 (Miller et al. 2007;Kitching et al. 2008). Although the “KSB” technique has been quite popular due toits speed and efficiency, many new implementations for extracting the shear signalwith the rapid increase in the speed and processing power of computers are currentlyavailable.
The first weak lensing measurements of clusters were reported with relativelysmall field of view cameras (Fahlman et al. 1994; Bonnet et al. 1994) but were soonextended to the larger field of view mosaic cameras (e.g. Dahle et al. 2002; Cloweand Schneider 2001, 2002; Bardeau et al. 2005, 2007). Two-dimensional dark mattermapping gets rapidly noisy as one extends over more than ∼2 arcminutes from thecluster center due to a rapidly diminishing lensing signal. However, radial averagingof the shear field provides an effective way to probe the mass profile of clusters outto their virial radius and even beyond. This technique of inverting the measured shearprofile to constrain the mass distribution of clusters is currently widely used. Com-bining constraints from the strong and weak lensing regime has enabled us to derive
1IMCAT software is available at http://www.ifa.hawaii.edu/~kaiser/imcat/.2LENSFIT software is available at http://www.physics.ox.ac.uk/lensfit/.

Page 6 of 100 Astron Astrophys Rev (2011) 19:47
the dark matter density profile over a wide range of physical scales. As a conse-quence, gravitational lensing has become a powerful method to address fundamentalquestions pertinent to cluster growth and assembly.
Theoretically, as it is known that clusters are dominated by dark matter, enormousprogress has been made in tracking their formation and evolution using large cosmo-logical N-body simulations since the 1980s. Gravitational lensing is sensitive to thetotal mass of clusters, thereby enabling detailed comparison of the mass distributionand properties inferred observationally with simulated clusters. Lensing observationshave therefore allowed important tests of the standard structure formation paradigm.
At the turn of the second millennium the new role of lensing clusters is its growinguse as natural telescopes to study very high-redshift galaxies that formed during theinfancy of the Universe (e.g. Franx et al. 1997; Pelló et al. 1999; Ellis et al. 2001).This became possible with deep spectroscopy on 4 m and then 8–10 m class tele-scopes that enable probing the high-redshift Universe, primarily by exploiting thelensing amplification and magnification3 produced by these natural telescopes (Pellóet al. 2001). Capitalizing on the achromatic nature of cluster lensing, various observa-tories functioning at different wavelengths of the electromagnetic spectrum have beendeployed for these studies. In particular, the discovery and study of the population ofsub-millimeter galaxies using SCUBA at the James Clerk Maxwell Telescope (JCMThereafter; see the reviews by Blain et al. 2002; Smail et al. 2002; Kneib et al. 2004;Knudsen et al. 2005, 2008; Borys et al. 2005), the Caltech interferometer at OwensValley (e.g. Frayer et al. 1998; Sheth et al. 2004), the IRAM interferometer (e.g. Neriet al. 2003; Kneib et al. 2005), the Very Large Array (VLA) (e.g. Smail et al. 2002;Ivison et al. 2002; Chapman et al. 2002) and Sub-Millimeter Array (SMA) (e.g.Knudsen et al. 2010) greatly benefited from the boost provided by the magnificationeffect of gravitational lensing in cluster fields. Similarly, observation of lensed galax-ies in the mid-infrared with the ISOCAM mid-infrared camera on the Infra-red SpaceObservatory (ISO) satellite (Altieri et al. 1999; Metcalfe et al. 2003), followed withthe Spitzer observatory (Egami et al. 2005) and now with the Herschel space observa-tory (Egami et al. 2010; Altieri et al. 2010) have pushed the limits of our knowledgeof distant galaxies further. Gravitational lensing is now recognized as a powerful tech-nique to count the faintest galaxies in their different classes: Extremely Red Objects(Smith et al. 2001); Lyman-α emitters at z ∼ 4–6 (Hu et al. 2002; Santos et al. 2004;Stark et al. 2007); Lyman-break galaxies at z ∼ 6–10 (Richard et al. 2008) as well asto study in detail the rare, extremely magnified individual sources (Pettini et al. 2000;Kneib et al. 2004; Egami et al. 2005; Smail et al. 2007, Swinbank et al. 2007, 2010)in the distant Universe.
Since March 2002, the installation of the new ACS camera onboard HST has pro-vided further observational advances in the study and unprecedented use of clusterlenses (see Fig. 2). These are exemplified in the very deep and spectacular ACS im-ages of Abell 1689 (Broadhurst et al. 2005; Halkola et al. 2006). This color image
3The magnification refers to the spatial stretching of the images by the gravitational lensing effect, how-ever, the magnification cannot be recognized when the lensed object is not resolved by the observations (ifthe object is compact or if the PSF is broad) leading to an apparent amplification of the flux of the lensedobject. In some cases, a lensed object can be tangentially magnified but radially amplified, the use of theterms magnification and amplification are thus sometimes mixed.

Astron Astrophys Rev (2011) 19:47 Page 7 of 100
Fig. 2 Color image of two cluster lenses observed by HST-ACS: left panel Abell 2218 at z = 0.175 andright panel Cl0024+1654 at z = 0.395
reveals more than 40 multiple-image systems in the core of this cluster (Limousinet al. 2007) and well over a hundred lensed images in total. The dramatic increase inthe number of strong lensing constraints that these observations provide in the clustercore has spurred important and significant new developments in mass reconstructiontechniques (e.g. Diego et al. 2005a, 2005b; Jullo et al. 2007; Coe et al. 2008). Withthis amount of high quality data the construction of extremely high-resolution massmodels of the cluster core are now possible. Mass models with high precision haveenabled the use of this cluster to constrain the cosmological parameters Ωm and Ω�
(Link and Pierce 1998; Golse et al. 2004; Gilmore and Natarajan 2009; Jullo et al.2010; D’Aloisio and Natarajan 2011a, 2011b). First observational constraints wereattempted by Soucail et al. (2004), and more recent work by Jullo et al. (2010) hasdemonstrated the feasibility of this technique involving detailed modeling of deepACS images coupled with comprehensive redshift determinations for the numerousmultiple-image systems. Combining these cosmological constraints from the clus-ter lens Abell 1689 with those obtained from independent X-ray measurements anda flat Universe prior from WMAP, Jullo et al. (2010) find results that are compet-itive with the other more established methods like SuperNovae (Riess et al. 1998;Perlmutter et al. 1999) and Baryonic Acoustic Oscillations (Eisenstein et al. 2005).Therefore, in the very near future cluster strong lensing is likely to provide us with aviable complementary technique to constrain the geometry of the Universe and probethe equation of state of Dark Energy, which is a key unsolved problem in cosmologytoday.
This brief and non-exhaustive historical account of cluster lensing research sum-marizes some of the important scientific results gathered up to now and demonstratesthe growing importance of cluster lensing in modern cosmology. This review is orga-nized as follows: we first describe the key features of gravitational lensing in clustersof galaxies, starting with strong lensing, and then summarize the various weak lensingtechniques as well as some recent developments in the intermediate lensing regime.

Page 8 of 100 Astron Astrophys Rev (2011) 19:47
We also dedicate a section to the lensing effect and measurements of galaxy halos inclusters which has provided new insights into the granularity of the dark matter distri-bution. The potency here arises from the ability to directly compare lensing inferredproperties for substructure directly with results from high-resolution cosmologicalN-body simulations. We then present the different uses of cluster lenses in moderncosmology. We start with the study of the lens: its mass distribution, and the relationof the lensing mass to other mass estimates for clusters. We then discuss the use ofcluster lenses as natural telescopes to study faint and distant background galaxy pop-ulations. And lastly, we discuss the potential use of clusters to constrain cosmologicalparameters. Finally, we recap the important developments that are keenly awaited inthe field, and describe some of the exciting science that will become possible in thenext decade, focusing on future facilities and instruments. Cluster lensing is today arapidly evolving and observationally driven field.
When necessary, we adopt a flat world model with a Hubble constant H0 =70 km s−1 Mpc−1, a density parameter in matter Ωm = 0.3 and a cosmological con-stant Ωλ = 0.7. Magnitudes are expressed in the AB system.
2 Lensing theory as applied to clusters of galaxies
2.1 General description
Clusters of galaxies are the largest and most massive bound structures in the Universe.Due to their large mass, galaxy clusters (as do galaxies) locally deform space-time(see Fig. 3). Therefore, the wave front of light emitted by a distant source traversinga foreground galaxy cluster will be distorted. This distortion occurs regardless of thewavelength of light as the effect is purely geometric. Moreover, for the most massiveclusters the mass density in the inner regions is high enough to break the wave frontcoming from a distant source into several pieces, thereby occasionally producingmultiple images of the same single background source. Background galaxies multiplyimaged in this fashion tend to form the observed extraordinary gravitational giant arcsthat characterize the so-called strong lensing domain. Strongly lensed distant galaxieswill thus appear distorted and highly magnified. They are often referred to as arcletsdue to their noticeably elongated shape and preferential tangential alignment aroundthe cluster center. Note, however, that their observed distorted shape is a combinationof their intrinsic shape and the distortion induced by the lensing effect of the cluster.
When the alignment between the observer, a cluster and distant background galax-ies is less perfect, then the distortion induced by the cluster will be less important andcannot be recognized clearly. Statistical methods are required to detect this change inshape of background galaxies seen in the weak regime. In the weak lensing regime,the observed shapes of background galaxies in the field of the cluster are typicallydominated by their intrinsic ellipticities or even worse by the distortion of the imag-ing camera optics and the imaging point spread function (PSF) which is a function ofposition on the detector and may also vary with time. Thus, only a careful statisticalanalysis correcting the observed images for the various non-lensing induced distor-tion effects can reveal the true weak lensing signal. The shape changes induced in theoutskirts of clusters in the weak regime are at the few percent level, while the stronglensing distortions are often larger, and are typically at the 10%–20% level.

Astron Astrophys Rev (2011) 19:47 Page 9 of 100
Fig. 3 Gravitational lensing in clusters: A simple schematic of how lensed images are produced delineat-ing the various regimes: strong, intermediate and weak lensing (see text for a detailed description)
2.2 Gravitational lens equation
Before proceeding to the elegant mathematics of lensing, we first recap the assump-tions needed to derive the basic lens equation. First, it is assumed that the “Cosmo-logical Principle” (i.e. the Universe is homogeneous and isotropic) holds on largescales. The scales under consideration here are the ones relevant to the long-rangegravitational force:
L ∼ c√Gρ
∼ 2 Gpc, (1)
where c is the speed of light, G is the gravitational constant and ρ is the mean densityof the Universe. The large-scale distribution of galaxies as determined by surveys likethe 2 degree Field survey (2dF), the Sloan Digital Sky Survey (SDSS) and the Cos-mic Microwave Background (CMB) as revealed by the Cosmic Background Explorer(COBE), and the Wilkinson Anisotropy Probe (WMAP) satellites are in good agree-ment with the cosmological principle. The assumption of homogeneity and isotropyimposes strong symmetries on the metric that describes the Universe and allows so-lutions that correspond to both expansion and contraction. Symmetries restrict themetric that describes space-time to the following form:
ds2 = c2 dt2 − a2(t)
(dr2
1 − kr2+ r2 dθ2 + r2 sin2 θ dϕ2
), (2)
where a(t) is the scale factor, and k defines the curvature of the Universe.

Page 10 of 100 Astron Astrophys Rev (2011) 19:47
Fig. 4 A single deflectorlensing configuration showingthe relevant angles and distancesthat appear in the lens equation
This metric will be locally perturbed by the presence of any dense mass con-centration, such as individual stars, black holes, galaxies or clusters of galaxies. TheSchwarzschild solution (e.g. Weinberg 1992) gives the form of the metric near a pointmass, and is easy to generalize for a continuous mass distribution in the stationaryweak field limit corresponding to Φ � c2:
ds2 =(
1 + 2Φ
c2
)c2 dt2 −
(1 − 2Φ
c2
)dr2, (3)
where Φ is the 3D gravitational potential of the mass distribution under consideration.If we consider a simple configuration of a single thin deflecting lens (Fig. 4), the
observer (O) will see the image (I) of the source (S) deflected by the lens (L). Thegeometric equation relating the position of the source �θS to the position of the image�θI depends on the deflection angle �α and the relevant intervening angular diameterdistances Dij in this case between the lens and source (denoted by DLS) and theobserver and source (denoted by DOS):
�θI = �θS + DLS
DOS�α(�θI). (4)
The value of �α depends on the local perturbation of the mass on space-time mea-sured at the location of �θI. The photon path follows a null geodesic that is defined byds2 = 0. Hence from (3), one can determine the travel time tT for a given path lengthwhich in turn, is a function of the angle �α. By applying Fermat’s principle, whichstates that light follows the path with a stationary travel time, i.e. dtT/d �θI = �0, wecan derive the value of the deflection �α as a function of the local Newtonian gravita-tional potential:
�α(�θI) = 2
c2
DLS
DOS
�∇�θIφ2D
N (�θI), (5)
where φ2DN is the Newtonian gravitational potential projected in the lens plane.
Combining (4) and (5) we derive the lens equation under the thin lens approxi-mation, which holds for a wide range of deflector masses, from stars to galaxies to

Astron Astrophys Rev (2011) 19:47 Page 11 of 100
Fig. 5 Lensing efficiencyE = DLS/DOS for a given lensas a function of source redshiftzS for different cosmologies.The two sets of curvescorrespond to two different lensredshifts zL = 0.3 and zL = 0.9and the solid lines correspond toΩm = 0.1, Ω� = 0; the dashedline to Ωm = 1, Ω� = 0; andthe dashed-dotted line toΩm = 0.1, Ω� = 0.9
clusters of galaxies (see Schneider et al. 1992 for a more detailed derivation):
�θS = �θI − 2Ec2
�∇φ2DN (�θI) = �θI − �∇ϕ(�θI). (6)
The thin lens approximation is valid when the distances from the observer to thelens and source are significantly larger than the physical extent of the lens, an as-sumption that is strictly true for all galaxies and clusters. Above we define ϕ as thelensing potential—a lensing normalized version of the Newtonian projected poten-tial, and the distance ratio E = DLS/DOS which depends on the redshift of the clusterzL and the background source zS, as well as—but only weakly—on the cosmologi-cal parameters Ωm and Ωλ. The distance ratio E measures the efficiency of a givenlens at redshift zL. The factor E is an increasing function of the source redshift zS(Fig. 5); therefore the larger the background source redshift, the stronger the deflec-tion and distortion. This relation can be slightly more complex for sources located inthe strong lensing regions. Note also that E is independent of the Hubble constant,therefore lensing deflection angles and deformations are independent of the valueof H0.
It has also been shown that going beyond the thin lens approximation, the abovelensing equation can be derived in the more general case (with (4) being the limitingcase for Einstein–de Sitter space-time) by simply calculating the null geodesics inter-secting an observer’s world-line without partitioning light paths into near and far lensregions (see Pyne and Birkinshaw 1996 for a detailed derivation). The particularlyinteresting case is when more than one lensing deflector is responsible for producingthe observed magnification and shear. Observations suggest that the lensing effect ofmost clusters are likely further amplified due to the existence of multiple additionalmass concentrations aligned along the line of sight. Therefore, multiple lens planes
Page 12 of 100 Astron Astrophys Rev (2011) 19:47
will ultimately need to be taken into account for accurate mass modeling of clus-ter lenses. The precise coupling between the lensing effects of two adjacent massesdepends on their transverse separation. Examining the two-screen gravitational lens,Kochanek and Apostolakis (1988) find, albeit for galaxy scale lenses, that their effectsinteract significantly for transverse separations less than 4 × r0 where r0 is the radiusof the outer critical line of the singular potential.4 Independent lenses that are close inredshift almost always interact and these interactions can lead to either an increase ora decrease in the total cross section relative to the cross section of two isolated lensesdepending on the system’s geometry. The resultant image geometries in such casesare dominated by the effects of fold caustics. The deflection can be calculated for thetwo-screen lens configuration numerically and most current lens equation solvers areadapted to do so.
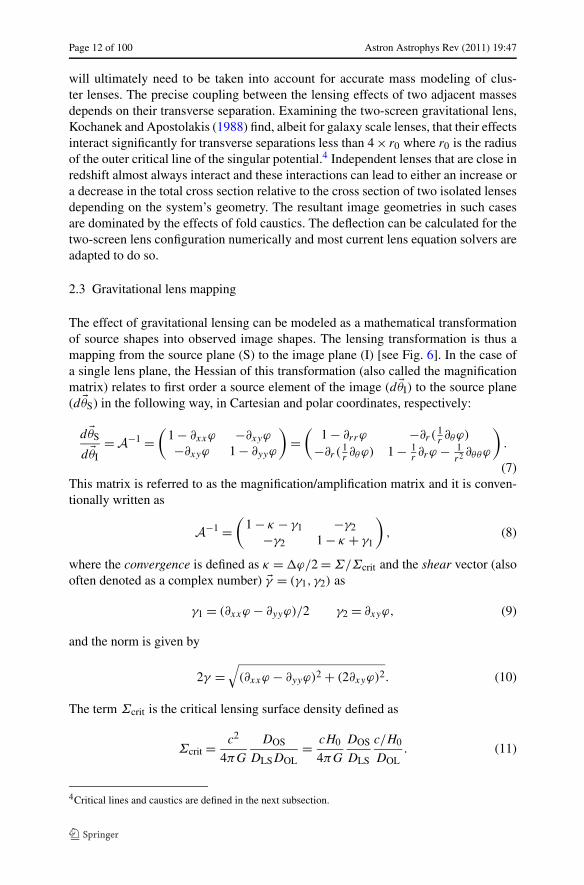
2.3 Gravitational lens mapping
The effect of gravitational lensing can be modeled as a mathematical transformationof source shapes into observed image shapes. The lensing transformation is thus amapping from the source plane (S) to the image plane (I) [see Fig. 6]. In the case ofa single lens plane, the Hessian of this transformation (also called the magnificationmatrix) relates to first order a source element of the image (d �θI) to the source plane(d �θS) in the following way, in Cartesian and polar coordinates, respectively:
d �θS
d �θI= A−1 =
(1 − ∂xxϕ −∂xyϕ
−∂xyϕ 1 − ∂yyϕ
)=
(1 − ∂rrϕ −∂r(
1r∂θϕ)
−∂r(1r∂θϕ) 1 − 1
r∂rϕ − 1
r2 ∂θθϕ
).
(7)This matrix is referred to as the magnification/amplification matrix and it is conven-tionally written as
A−1 =(
1 − κ − γ1 −γ2−γ2 1 − κ + γ1
), (8)
where the convergence is defined as κ = �ϕ/2 = Σ/Σcrit and the shear vector (alsooften denoted as a complex number) �γ = (γ1, γ2) as
γ1 = (∂xxϕ − ∂yyϕ)/2 γ2 = ∂xyϕ, (9)
and the norm is given by
2γ =√
(∂xxϕ − ∂yyϕ)2 + (2∂xyϕ)2. (10)
The term Σcrit is the critical lensing surface density defined as
Σcrit = c2
4πG
DOS
DLSDOL= cH0
4πG
DOS
DLS
c/H0
DOL. (11)
4Critical lines and caustics are defined in the next subsection.

Astron Astrophys Rev (2011) 19:47 Page 13 of 100
Fig. 6 Illustration of the effect of lensing: local deformation of a regular grid and a circle (left: sourcemap) by a lens with constant value of the convergence κ and the shear γ over the region (right: imagemap)
It can be clearly seen that the critical surface mass density scales as
Σcrit � 0.162
(H0
70 km s−1 Mpc−1
)(DOS
DLS
)(c/H0
DOL
)g cm−2. (12)
For instance, given a cluster lens at zL = 0.3 and a source at redshift zS = 1.0,DOSDLS
= 1.567 and c/H0DOL
= 4.661, yielding
Σcrit � 1.18
(H0
70 km s−1 Mpc−1
)g cm−2. (13)
Thus, for a cluster with a depth of ∼300 kpc, the 3D mass density needed to reachthe lensing critical surface mass density is about 10−24 g/cm3, which corresponds toa density that is ∼10,000 times the critical density of the Universe ρcrit. Backgroundgalaxies viewed via a cluster region where the surface mass density is critical orhigher are likely to be multiply imaged.
We can readily see that the magnification matrix is real and symmetric, therefore,it can be diagonalized, and can be written in its principal axes as follows:
A−1 =(
1 − κ + γ 00 1 − κ − γ
)= (1−κ)
[(1 00 1
)+ γ
1 − κ
(1 00 −1
)]. (14)
From this equation, we see that 1 − κ describes the isotropic deformation, andthe shear γ describes the anisotropic deformation. Note that the quantity that is mostdirectly measured from faint galaxy shapes is the reduced shear g defined as g =γ /(1 − κ).
The direction of the deformation (or equivalently of the shear) can be written as
tan 2θshear = 2∂xyϕ
∂yyϕ − ∂xxϕ. (15)

Page 14 of 100 Astron Astrophys Rev (2011) 19:47
As the direction of the shear is a ratio of the components of the lensing potential,the shear direction θshear will be independent (modulo 90 degrees) of the distanceratio E = DLS/DOS and thus will be independent of the source redshift zS. Only theintensity or magnitude of the shear will change with the source redshift zS.
2.4 Critical and caustic lines
The magnification μ is defined as the determinant of the magnification matrix andcan be expressed as a function of κ and γ as
μ−1 = det(
A−1) = (1 − κ)2 − γ 2 = (1 − κ)2(1 − g2). (16)
The magnification is infinite if one of the principal values of the magnificationmatrix is equal to zero, which implies that the reduced shear g is equal to 1 or −1.Thus, the locus in the image plane of infinite magnification defines two closed linesthat do not intersect (as g cannot be equal to 1 and −1 at the same location) andthese are called the “critical lines”. The corresponding lines in the source plane arecalled “caustic lines”, they are also closed lines but contrary to the critical lines, theycan intersect each other. In general, for a simple mass distribution, we can easilydistinguish the two critical lines: the external critical line where the deformations aretangential, and the internal critical line where the deformations are radial. Note thatthese simple geometries for the critical and caustic lines do not hold strictly for morecomplex mass distributions (see Fig. 7 for examples of critical and caustic lines fordifferent simple mass distribution).
For a circularly symmetric mass distribution, the equations for the critical lines aresimple. The magnification matrix in polar coordinates simplifies to
A−1 =(
1 − ∂rrϕ 00 1 − 1
r∂rϕ
). (17)
Thus both the critical and caustic lines (if they exist) are circles. In fact, substitut-ing the equation of the tangential critical line: r = ∂rϕ into the lensing equation tocompute the caustic line, we find that the tangential caustic line is always restrictedand reduces to a single point in the case of a circular mass distribution. It is also rela-tively easy to demonstrate that for a well behaved mass distribution the radial criticalline is always located within the tangential critical line (Kneib 1993).
It is important to notice that for a circularly symmetric mass distribution, the pro-jected mass enclosed within the radius r can be written as
M(r) = c2
4G
DOSDOL
DLSr∂rϕ(r) = πΣcritr∂rϕ(r). (18)
At the tangential critical radius we have rct = ∂rϕ(rct), thus the mass within the tan-gential critical radius (also referred to as the Einstein radius rE) is
M(rE) = πΣcritr2E. (19)
The critical surface mass density Σcrit corresponds to the mean surface density en-closed within the Einstein radius. Thus the higher the mass concentration, the larger

Astron Astrophys Rev (2011) 19:47 Page 15 of 100
Fig. 7 Critical lines (dashed) and caustics (solid) for different classes of mass models: (a) for a singularisothermal circular mass distribution, the radial critical line is the central point, and the correspondingcaustic line is at infinity, (b) a singular isothermal elliptical mass distribution, the tangential caustic line isan astroid, (c) a circular mass distribution with an inner slope shallower than isothermal mass distribution,in this case a radial critical curve appears, and both caustics are circles. (d) same as (c) but for an ellipticalmass distribution, the relative size of both caustic lines will depend on the mass profile and the ellipticityof the mass distribution, (e) a bimodal mass distribution with two clumps of equal mass, similar to (d), and(f) for a bimodal distribution with unequal masses
the Einstein radius. For a given surface mass density profile, the size of the Einsteinradius will depend on the redshift of the lens and the source as well as the underlyingcosmology. The variation of Σcrit for a given source redshift as a function of the lensredshift shows that for a given lens mass distribution the most effective lens is placedat roughly less than half the source redshift.
Furthermore, the radial critical curve is defined as
∂rrϕ(r) = ∂r
(M(r)
πΣcritr
)= 1, (20)
thus, the position of the radial critical line depends on the gradient of the mass profile.The above equations suggest that: (i) from the tangential critical curve location,
the total mass enclosed within a circular aperture can be measured precisely, and (ii)from the radial critical curve, the slope of the mass profile near the cluster center canbe strongly constrained. However, for an accurate estimate of the mass enclosed theredshifts of the cluster and the arc need to be known precisely. Furthermore, note thatonly the mass normalization scales directly with the value of H0, but not the derivedmass profile slope.
For the general non-circular case, the determination of the critical lines cannot beaddressed analytically except for certain simple elliptical mass profiles (e.g. Kneib

Page 16 of 100 Astron Astrophys Rev (2011) 19:47
Fig. 8 HST/ACS color image of MACSJ0451+00. The red curve shows the location of the critical line fora source at z = 2. A giant arc at z = 2.01, as well as different sets of multiple images are identified (eachsystem of images is marked with a circle of the same color—the cyan and magenta identified multipleimage have no spectroscopic redshift measurement yet) (Richard et al. private communication)
Fig. 9 Multi-scale marchingsquare field splitting to mapcritical lines: the boxes representthe splitting squares and the redlines chart the critical curvecontour. The imposed upper andlower limits for the box sizes are10′′ (corresponding to thelargest box shown) and 1′′,respectively. The 1′′ boxes arenot plotted here for clarity.Figure adapted from Jullo et al.(2007) where more details maybe found
1993). The complexity of the shapes of critical lines can be seen for the lens modelof MACS0451-02 (Fig. 8). Indeed, to solve for the critical line in complex lens massmodels, one has to resort to numerical methods. Iterative methods are more econom-ical in terms of CPU time. For example, Jullo et al. (2007) have implemented the“Marching Square” technique for computing critical lines (see illustration in Fig. 9).
The above property linking the total mass within the critical line to the area withinthe critical line does not hold exactly for the more general cases but it is still a goodapproximation if the mass distribution is not too different from the circularly sym-

Astron Astrophys Rev (2011) 19:47 Page 17 of 100
metric case (Kassiola and Kovner 1993). Hence identifying the characteristic sizes ofthe critical lines both radial and tangential in an observed cluster is the first importantstep toward measuring the mass and its degree of concentration in the inner regions.
2.5 Multiple images
2.5.1 Definition
Critical lines are virtual lines, and thus cannot be directly mapped. However, multipleimages that straddle critical lines can easily be identified in high resolution images.For instance, tangentially distorted images are found near tangential critical lines andradially distorted ones near the radial critical lines. One often refers to tangentialpairs or radial pairs, which are simple configurations that are easily recognizable(e.g. Miralda-Escudé and Fort 1993). For example, one can have triplets, quadruplets,quintuplets or even larger multiplicities of images of the same source depending onthe complexity of the mass distribution.
The number of multiple images produced is simply the number of solutions of (6).It can be estimated easily using catastrophe theory (Thom 1989; Zeeman 1977; Erdland Schneider 1993), according to which each time one crosses a caustic line in thesource plane two additional lensed images are produced. For a non-singular massdistribution we expect to always have an odd number of multiple images (Burke1981). However, some images are likely to be less magnified, or in fact, demagnifiedso that they are not observable, thereby complicating at first the task of counting thetotal number of multiple images produced. Often, the presence of a bright centralgalaxy in clusters scuppers the detection of the central demagnified image.
2.5.2 Multiple-image symmetry
Multiple images have different symmetries which can be summarized by the signs ofthe eigenvalues of the magnification matrix, we can thus in principle have three pos-sibilities for the parities, which correspond to the symmetry of the source, denotedas (+,+), (+,−) and (−,−). For example we often talk about “mirror” symmetry,when we recognize a counter image as the flipped image of galaxy with a remarkablysimilar morphology. The image symmetry property is generally used to identify mul-tiple images in what turns out to be a secure way, as we see in the pair configurationof Fig. 10.
Indeed, each time, one crosses a critical line (this corresponds to a change in signof one of the eigenvalues of the magnification matrix), the parity of the image changes(Blandford and Narayan 1986; Schneider et al. 1992). For simple mass distributions,only three parities described above by the notation (+,+), (−,−) and (+,−) can beobserved as shown in Fig. 11. Since for a simple mass distribution the radial criticalline is always inside the tangential critical line, the parity (−,+) is not physicallyallowed.
2.5.3 Examples of multiple-image systems
Massive clusters frequently produce multiple images, and this happens when the sur-face mass density of the cluster core is close to or larger than the critical surface mass

Page 18 of 100 Astron Astrophys Rev (2011) 19:47
Fig. 10 The lensed pair S1–S2 in AC114. This galaxy at z = 1.867 displays the surprising morphologyof a hook, with an obvious change in parity (Smail et al. 1995; Campusano et al. 2001)
Fig. 11 Area in the image plane showing different image parities (indicated by the signs in parentheses):(a) in the case of a simple elliptical mass distribution, (b) in the case of a bimodal mass distribution. Thedashed lines correspond to the critical lines. The arrow is just an indication of the radial direction of theclosest mass clump. We note that while the deformations shown in this figure are completely arbitrary, theorientation of the images is portrayed accurately
density:
Σcrit = c2
4πG
DOSDOL
DLS,
for given lens and source redshifts. The detailed configuration of multiple images canbe used to unravel the structure of the mass distribution.
A cluster with one dominant clump of mass will produce (for the range of multiple-image configurations see Fig. 12) fold, cusp or radial arcs (e.g. MS2137.3-2353: Fortet al. 1992; Mellier et al. 1993; AC114: Natarajan et al. 1998; A383: Smith et al.2001, 2003); a bimodal cluster can produce straight arcs (e.g. A2390: Pelló et al.1991; Cl2236-04: Kneib et al. 1994), triplets (A370: Kneib et al. 1993; Bezecourtet al. 1999); a very complex structure with lots of massive halos in the core canproduce multiple-image systems with seven or more images of the same source (e.g.

Astron Astrophys Rev (2011) 19:47 Page 19 of 100
Fig. 12 Multiple-image configurations produced by a simple elliptical mass distribution. The panel (S)shows the caustic lines in the source plane and the positions numbered 1 to 10 denote the source positionrelative to the caustic lines. The panel (I) shows the image of the source without lensing. The panels (1)to (10) show the resulting lensed images for the various source positions. Certain configurations are verytypical and are named as follows: (3) radial arc, (6) cusp arc, (8) Einstein cross, (10) fold arc
A2218, see Fig. 13). The presence of every nearby perturbing mass can typically addtwo extra images to a simple configuration if that mass is well positioned relativeto the central core. Very elongated/elliptical clusters with appropriate inner densityprofile slopes can produce hyperbolic-umbilic catastrophes producing quintuple arcconfigurations such as the one seen in Abell 1703 (Limousin et al. 2008). A thorough

Page 20 of 100 Astron Astrophys Rev (2011) 19:47
Fig. 13 A spectacular set of multiple images seen in the cluster Abell 2218 in the composite B, R, andI-band HST image. A distant E/S0 galaxy at z = 0.702 is lensed into a 7-image configuration
description of exotic configurations has been discussed quite extensively in a paperby Orban de Xivry and Marshall (2009).
2.5.4 Multiple-image identification
Multiple images can be identified by their distinct properties. Traditionally, multipleimages have been recognized as the images forming the giant arcs (3 images in thecase of Abell 370, but only two images in the case of MS2137-17 or Cl2244-04).However, not every giant arc is composed of multiple images, for example it is mostlikely that the northern giant arc in Abell 963 is only a single image, and that thesouthern arc in Abell 963 is composed of two or three arclets (single images) fromsources at different redshifts as revealed by their different colors. Multiple images canbe recognized in terms of their (mirror) symmetry, which is of course best visible withhigh-resolution HST data. One of the classic examples is the “hook-pair” in AC114(Fig. 10) where the image symmetry is readily identified. Furthermore, as lensing isachromatic, multiple images can be recognized by the similarity of their colors, or bytheir extreme brightness at a specific wavelength like in the sub-mm or in mid-infrared.
Finally, the secure way to identify and confirm the existence of a multiple-imagesystem, is through the detailed modeling of the cluster lens itself. This allows one inprinciple to test if a set of images having similar morphology and colors can actu-ally be multiple images of the same source. Calibrated lens models can predict thelocation of counter images and also predict the redshift of the multiply lensed source(Kneib et al. 1993, 1996).
Ultimately, for studying a large sample of massive clusters, one would likely needto develop automatic techniques to identify multiple-image systems based on theirmorphology, color and more sophisticated lens modeling software. Although suchrobotic processes are being developed (Sharon private communication), further de-velopments are needed to make them completely user friendly.
Astron Astrophys Rev (2011) 19:47 Page 21 of 100
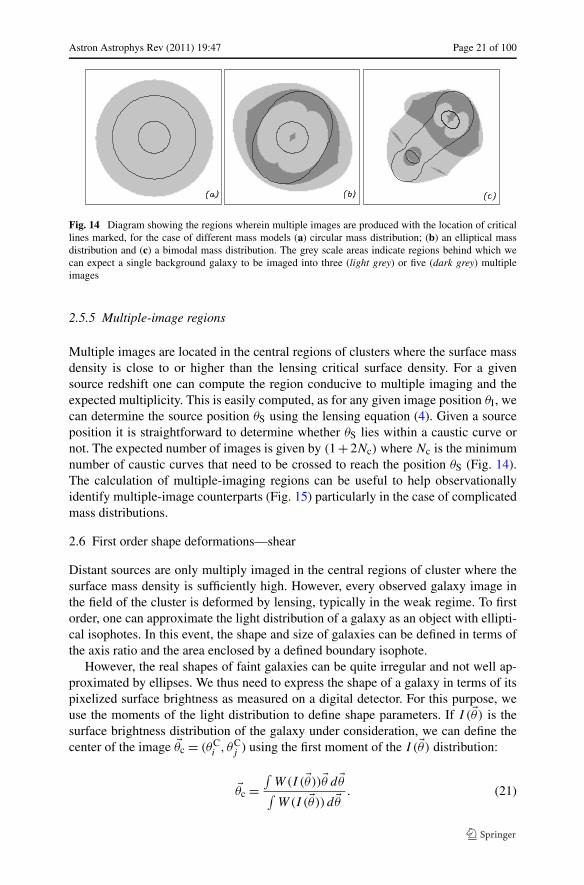
Fig. 14 Diagram showing the regions wherein multiple images are produced with the location of criticallines marked, for the case of different mass models (a) circular mass distribution; (b) an elliptical massdistribution and (c) a bimodal mass distribution. The grey scale areas indicate regions behind which wecan expect a single background galaxy to be imaged into three (light grey) or five (dark grey) multipleimages
2.5.5 Multiple-image regions
Multiple images are located in the central regions of clusters where the surface massdensity is close to or higher than the lensing critical surface density. For a givensource redshift one can compute the region conducive to multiple imaging and theexpected multiplicity. This is easily computed, as for any given image position θI, wecan determine the source position θS using the lensing equation (4). Given a sourceposition it is straightforward to determine whether θS lies within a caustic curve ornot. The expected number of images is given by (1 + 2Nc) where Nc is the minimumnumber of caustic curves that need to be crossed to reach the position θS (Fig. 14).The calculation of multiple-imaging regions can be useful to help observationallyidentify multiple-image counterparts (Fig. 15) particularly in the case of complicatedmass distributions.
2.6 First order shape deformations—shear
Distant sources are only multiply imaged in the central regions of cluster where thesurface mass density is sufficiently high. However, every observed galaxy image inthe field of the cluster is deformed by lensing, typically in the weak regime. To firstorder, one can approximate the light distribution of a galaxy as an object with ellipti-cal isophotes. In this event, the shape and size of galaxies can be defined in terms ofthe axis ratio and the area enclosed by a defined boundary isophote.
However, the real shapes of faint galaxies can be quite irregular and not well ap-proximated by ellipses. We thus need to express the shape of a galaxy in terms of itspixelized surface brightness as measured on a digital detector. For this purpose, weuse the moments of the light distribution to define shape parameters. If I (�θ) is thesurface brightness distribution of the galaxy under consideration, we can define thecenter of the image �θc = (θC
i , θCj ) using the first moment of the I (�θ) distribution:
�θc =∫
W(I (�θ))�θ d �θ∫W(I (�θ)) d �θ . (21)

Page 22 of 100 Astron Astrophys Rev (2011) 19:47
Fig. 15 Hubble ACS color image of Abell 1703 (image shown is from the combination of the F450W,F606W and F850LP filters), showing the location of all the multiply imaged systems. The white cross atthe center of the image marks the location of the brightest cluster galaxy, which has been subtracted fromthis image for clarity. The red dashed line outlines the limit of the region where we expect multiple imagesfrom sources out to z = 6 (figure from Richard et al. 2009)
Note that W(I) is a weight/window function that allows the integrals above to befinite in the case of noisy data. The simplest choice for the function W(I) is theHeaviside step function H(I − Iiso) which is equal to 1 for I (�θ) > Iiso where Iiso isthe isophote limiting the detection of the object, and 0 otherwise. The image centerfound is then taken as the center of the detection isophote. Another popular weightfunction that is frequently adopted is W(I) = I × H(I − Iiso), where the windowfunction is now weighted by the light distribution within the isophote.
The second order moment matrix of the light distribution centered on �θc:
Mij =∫ ∫
W(I (�θ))(θi − θCi )(θj − θC
j ) dθi dθj∫ ∫W(I (�θ)) dθiθj
, (22)

Astron Astrophys Rev (2011) 19:47 Page 23 of 100
Fig. 16 A typical faint galaxy observed on a CCD image (left), and the equivalent ellipse defined fromthe second order moments (right)
allows us to define the size, the axis ratio and the orientation of the correspondingapproximated ellipse. Indeed the moment matrix M is positive definite and can bewritten in its principal axes as
Mij = Rθ
(a2 00 b2
)R−θ , (23)
where a and b are the semi-major and semi-minor axes, respectively, and θ the posi-tion angle of the equivalent ellipse, and Rθ is the rotation matrix of an angle θ . Thusthe moment matrix M contains three parameters: the size of the galaxy, its ellipticityand its orientation (see illustration in Fig. 16).
It is useful to define a complex ellipticity which encodes both the shape parameterand the orientation of an observed galaxy.
There are, however, a number of ways to define the norm of the complex ellipticity,and the lensing community has experimented several notations:
|ε| = a2 − b2
a2 + b2|δ| = a2 + b2
2ab|τ | = a2 − b2
2ab|ε| = a − b
a + b. (24)
With the complex ellipticity defined for example as
ε = |ε|e2iθ . (25)
The notation ε was the first to be introduced, as it emerges naturally from themoment calculation, then τ and δ were introduced in the context of cluster lensingby Kneib (1993) and Natarajan and Kneib (1997). The advantage of this form is thatthe lens mapping can be written as a simple linear transformation from the imageplane to the source plane which is mathematically convenient. Subsequently ε wasadopted, and it has now become the standard definition, essentially because it is adirect estimator (modulo the PSF correction) of the measured quantity, which is thereduced shear g as we show below. All ellipticity parameters are of course linked toeach other, and in particular we have ε = 2ε/(1 + |ε|2).

Page 24 of 100 Astron Astrophys Rev (2011) 19:47
With the various definitions in hand for the relevant parameters, we can now ex-plicitly express the transformation produced by gravitational lensing on the shapeof a background galaxy. First, it can be shown that the image of the center of thesource corresponds to the center of the image in the case where the magnificationmatrix does not change significantly across the size of the image (Kochanek 1990;Miralda-Escudé 1991). This is generally adopted as the definition of the weak lensingregime as such a simplification does not hold in the strong lensing regime. To demon-strate this explicitly, one has to use the fact that the surface brightness is conservedby gravitational lensing as was first demonstrated by Etherington (1933), namely,I (�θI) = I (�θS).
The lens mapping will transform the shape of the galaxy, by magnifying it andstretching it along the shear direction. This transformation can be written in terms ofthe moment matrix MS (for the galaxy in the source plane) and M I (for the galaxy inthe image plane—that is, as observed) as follows:
MS = A−1M I tA−1, (26)
or if the matrix A−1 is not singular:
M I = AMS tA. (27)
Note that tA is the transpose of matrix A.These equations describe how the ellipse defining the source shape is mapped onto
the equivalent ellipse of the image or vice versa. If we consider the size σ = πa × b
of the equivalent ellipse, we can write
σ 2S = detMS = detM I · (detA−1)2 = σ 2
I · μ−2. (28)
Thus the overall size σS of the source is enlarged by the magnification factor μ.Similarly, it is possible to write the lensing transformation for the complex ellipticity,which of course will depend on the ellipticity estimator chosen. For the ellipticity ε,and using the complex notation, we have
εS = εI − g
1 − gεI, for |g| < 1, (29)
which corresponds to the region external to the critical lines, and
εS = 1 − g∗ε∗I
ε∗I − g∗ , for |g| > 1, (30)
which corresponds to the region inside the critical lines (the notation ∗ denotes thetranspose of a complex number).
In the weak regime, where the distortions are small (|g| � 1) the lensing equationsimplifies to
εI = εS + g. (31)

Astron Astrophys Rev (2011) 19:47 Page 25 of 100
Thus the ellipticity of the image is just a linear sum of the intrinsic source ellipticityand the lensing distortion in this limit. Thus averaging the above equation over a num-ber of sources yields the convenient fact that image ellipticities are a direct measureof the reduced shear g. Note, however, that these simplified equations mask observa-tional limitations such as the PSF/seeing convolution and pixelization, all effects thatcontribute to and contaminate observed image shapes.
2.7 Mass-sheet degeneracy
The “mass sheet degeneracy” problem was recognized as soon as mass distributionsbegan to be mapped using lensing observations (e.g. Falco et al. 1985) and the issuehas been discussed in detail in Schneider et al. (1992), Schneider and Bartelmann(1997) and Bradac et al. (2004) in the context of weak lensing mass measurement.This degeneracy arises due to the lack of information needed to calibrate the totalmass of clusters in the absence of a normalization scheme due to the simple factthat the addition of a constant surface mass density sheet leaves the measured shearunaltered.
Expressed mathematically, the magnification and shear are invariant under the fol-lowing transformation:
κ ′ = (1 − λ)κ + λ (32)
and
γ ′ = (1 − λ)γ, (33)
where λ is the mass-sheet (denoting a sheet of constant surface mass density) addedto the lens plane. Expressing the reduced shear with the above two equations we canshow that
g′ = g, (34)
thus the reduced shear is conserved under this transformation. This means that fora given observed reduced shear field, one can only extract the surface mass densitydistribution κ up to a constant factor given by the unknown value of λ.
There are several ways to break the mass sheet degeneracy, the obvious way isto use lensed sources from different source redshift planes. Indeed with, κ(z1) =E (z1)/E (z2)κ(z2), such a transformation is incompatible with the above invariance.Other methods to break the mass-sheet degeneracy, such as the inclusion of con-straints from the strong lensing regime are discussed further in Sect. 3.4.3 on lensmodeling.
2.8 Higher order shape deformations—flexion
The equations in the previous section assume that κ and γ and as a consequencethe reduced shear g are all constant across an image. This assumption fails whenan image is physically large and/or when it is close to critical regions where thelensing distortion is changing rapidly. There are basically two effects that lensingproduces on a background elliptical source: a shift in the peak flux at the center ofthe image compared to that of the fainter isophotes (while still preserving the surface

Page 26 of 100 Astron Astrophys Rev (2011) 19:47
Fig. 17 Decomposition of weak lensing distortions, illustrated for an unlensed Gaussian galaxy with aradius of 1 arcsec. The source has been distorted with 10% convergence/shear, and 0.28 arcsec−1 flexion.The convergence κ , and 2 components of the first flexion (F1 and F2); shear (γ1, γ2); and second flexionG1 and G2 are shown. As mentioned, flexion causes the arciness or elongation of weakly lensed arcs onceone combines F , G and γ (figure from Bacon et al. 2006)
brightness from the source to the image), and the distortion of the elliptical shape intoan extended “banana” shape. Therefore, there is additional, valuable information thatcan be gleaned from higher order lensing effects.
To determine these higher order effects numerically, one needs to use higher or-ders of the lensing transformation using the Taylor expansion of the image shape. Thiswas first investigated by Goldberg and Natarajan (2002), and followed up by Gold-berg and Bacon (2005). A recent summary of the formalism and applications is re-viewed in Bacon et al. (2005). Flexion is the significant third-order weak gravitationallensing effect responsible for the skewed and arc-like appearance of lensed galaxies.Flexion has two components: the first flexion, which is essentially the derivative ofthe shear field which contains local information about the gradient of the matter den-sity (Goldberg and Natarajan 2002) and the second flexion which contains non-localinformation (Bacon et al. 2005 and Fig. 17). Flexion measurements can be used tomeasure density profiles and these reconstructions can be combined with those de-rived from the shear alone. One key advantage of using the flexion estimator is thatit is not plagued by the mass sheet degeneracy as it is a higher order term, while itsdispersion measure is comparable to that of the shear. Recent successful applicationsof flexion to map mass distributions can be found in Okura et al. (2008), Leonardet al. (2011) and Er et al. (2011).
Flexion arises from the fact that the shear and convergence are actually not con-stant within the image, and therefore to derive its explicit form we need to expand tosecond order:
θ ′i � Aij θj + 1
2Dijkθj θk, (35)
with
Dijk = ∂kAij . (36)

Astron Astrophys Rev (2011) 19:47 Page 27 of 100
Using results from Kaiser (1995), we find that
Dij1 =(−2γ1,1 − γ2,2 −γ2,1
−γ2,1 −γ2,2
),
Dij2 =(−γ2,1 −γ2,2
−γ2,2 2γ1,2 − γ2,1
).
(37)
By expanding the surface brightness as a Taylor series and using the relations above,we can approximate the lensed surface brightness of a galaxy in the weak lensingregime as
f (θ) �{
1 +[(A − I )ij θj + 1
2Dijkθj θk
]∂i
}f ′(θ). (38)
This shows that the flexion can be written explicitly in terms of derivatives of theshear field. We define the flexion in terms of these shear derivatives, using the com-bination which is shown by Kaiser (1995) to directly give the gradient of the conver-gence:
F ≡ (γ1,1 + γ2,2)i + (γ2,1 − γ1,2)j (39)
= ∇κ (40)
= |F |eiφ. (41)
Since flexion is defined in terms of derivatives of the shear field, to measure it fromobserved shapes we need to be able to measure these derivatives, γi,j with sufficientaccuracy. This is becoming increasingly feasible with the availability of high qualityimaging data. The first flexion probes the local density via the gradient of the shearfield and quantifies the variation of the center of the different isophotal contours.The second flexion probes the non-local part of the gradient of the shear field andquantifies the shape variation and departure from elliptical symmetry.
Flexion has been incorporated as an additional constraint in the cluster mass re-constructions only recently as extremely high quality data is required to extract theflexion field and this is very challenging (see Leonard et al. 2011 for the case of Abell1689). This higher order shape estimator, however, offers a powerful probe providedit can be measured accurately from observations (Leonard and King 2010; Er et al.2011). As an illustration, we present the calculation of the flexion for the SIS modelin Appendix A.4.
3 Constraining cluster mass distributions
In most cases, intermediate redshift z ∼ 0.2–0.5 massive clusters are the most signifi-cant mass distribution along the line of sight, thus they can be represented by a singlelens plane in concordance with the thin lens approximation. In the �CDM model, theprobability of finding two massive clusters extremely well aligned along the line of

Page 28 of 100 Astron Astrophys Rev (2011) 19:47
sight (albeit separated in redshift) is extremely unlikely as clusters are very rare ob-jects. Lensing deflections and distortions probe the two dimensional projected clustermass along the line of sight. This allows us to constrain the two dimensional New-tonian potential, φ(x, y), resulting from the three-dimensional density distributionρ(x, y, z) projected onto the lens plane. The related projected surface mass densityΣ(x,y) is then given by
4πGΣ(x,y) = ∇2φ(x, y). (42)
Often we are interested in the two-dimensional projected mass inside an apertureradius R (particularly when comparing different mass estimators), which is definedexplicitly as follows:
Maper(R) = 2π
∫ R
0Σ(x)x dx, (43)
and the mean surface density inside the radius R is given by
Σ(R) = 1
πR2
∫ R
02πxΣ(x)dx. (44)
The important quantities for lensing in clusters are primarily the deflection angle�α between the image and the source, the convergence κ, and the shear γ , which canall be conveniently expressed in terms of the projected potential:
⎧⎪⎪⎪⎪⎪⎪⎪⎪⎨⎪⎪⎪⎪⎪⎪⎪⎪⎩
�α(�θ) = �∇�θϕ(�θ),
κ(�θ) = 1
2
(∂2ϕ
∂θ21
+ ∂2ϕ
∂θ22
),
γ 2(�θ) = ∥∥ �γ (�θ)∥∥2 = 1
4
(∂2ϕ
∂θ21
− ∂2ϕ
∂θ22
)2
+(
∂2ϕ
∂θ1 ∂θ2
)2
.
(45)
For a radially symmetric mass distribution, these expressions can be written as
⎧⎪⎪⎪⎪⎪⎪⎪⎪⎨⎪⎪⎪⎪⎪⎪⎪⎪⎩
κ(x) = Σ(x)
Σcrit,
γ (x) = Σ(x) − Σ(x)
Σcrit,
�α(x) = θΣ(x)
Σcrit= θ
(κ(x) + γ (x)
)(46)
where x = DOLθ is the radial physical distance. From this equation, we note thatone can derive γ directly from α and κ . This formulation is particularly useful when

Astron Astrophys Rev (2011) 19:47 Page 29 of 100
trying to compute an analytic expression of the lensing produced by a given massprofile.
3.1 Strong lensing modeling
3.1.1 Modeling approaches
Traditionally, modeling of the cluster mass distribution in the strong lensing regimeis done using “parametric models” (e.g. Kneib et al. 1996; Natarajan and Kneib1997). In these schemes the mass distribution is described by a finite number of massclumps; some small scale (galaxy components) and some large scale (to representthe dark matter, X-ray gas in the Intra-Cluster Medium), each of which are describedin turn by a finite number of parameters contingent upon the choice of mass profiledeployed. The simplest mass distribution that is commonly employed is the circu-lar Singular Isothermal Sphere (SIS), which is described by three parameters. Theparameters are the position of its center (x, y) and the value of the velocity disper-sion σ , which in this case is a constant. Other mass distributions such as the PIEMD(Pseudo Isothermal Elliptical Mass Distribution) or NFW (Navarro–Frenk–White)profiles are often used in lensing analysis and their relevant parameters are describedin the Appendix (see Sects. A.1–A.3).
Using a simple mass model makes sense when there are not many available obser-vational constraints—indeed one needs to balance the number of model parametersto the number of observational constraints available in order to compute a sensiblebest-fit model. However, with recent deep images of cluster cores from HST a verylarge number of multiple images can readily be identified. For instance, more than40 multiple-image systems have been identified in the massive cluster Abell 1689 byLimousin et al. (2007). The discovery and identification of such a large number ofmultiple images has dramatically increased the number of constraints available formass modeling of massive clusters in the last decade. With the availability of a largernumber of multiply imaged systems with redshift measurements, more accurate massmodels (Fig. 18) are now possible.
Therefore, the number of allowable parameters required to describe the mass dis-tribution of a cluster has also increased, leading obviously to a more accurate de-scription of the mass profile in the cluster core. This is for example evident uponcomparing the model of Kneib et al. (1993) with that of Richard et al. (2010) for thecluster Abell 370. In the case of “parametric models”, the increase in the number ofconstraints translates to the fact that cluster mass distributions can now be describedby a larger number of mass clumps and each of these clumps can be more complex(e.g. having elliptical mass distributions rather than circular, and a radial profile de-scribed by more parameters).
The increase in the number of available constraints has also lead to the develop-ment of new “non-parametric” methods, where no (or few) external priors are re-quired to describe the mass distribution of clusters (Diego et al. 2005a; Saha andWilliams 1997; Coe et al. 2010). Generically, in most of these “non-parametric”methods, the mass distribution is typically tessellated into a regular grid of smallermass elements. Further details of such methods are discussed later on in this section.

Page 30 of 100 Astron Astrophys Rev (2011) 19:47
Fig. 18 Relative aperture mass error as a function of the number of multiple images as measured inRichard et al. (2010). Open symbols: clusters observed with WFPC2. Filled symbols: clusters observedwith ACS. Symbols reflect the number of filters used to image the cluster (circle: 1 filter, triangle: 2 filters,diamond: 3 or more filters). One can see that with multi-band ACS data we can uncover more than 10multiple-image systems for the most massive clusters, and thus achieve mass accuracy within 10% or soin cluster cores
3.1.2 From simple to more complex mass determinations
A particularly useful and popular mass estimate in the strong lensing regime is themass enclosed within the Einstein radius θE, given by
M(< θE) = πΣcritD2OLθ2
E, (47)
where θE is the location of the tangential critical line for a circular mass distribution,usually approximated by the tangential arc radius θarc. It is a very handy expressionthat is independent of the mass profile for circularly symmetric cases. However, cau-tion needs to be exercised when using this expression as often the arc used to derivethe mass has an unknown redshift (thus Σcrit is not well defined), or the arc is a sin-gle image and therefore does not trace the Einstein radius or the mass distribution isvery complex with a lot of substructure. Note that, however, for a singular isothermalsphere model, a single image cannot be closer than twice the Einstein radius since itwill then have a counter image. In conclusion, this estimator tends to typically over-estimate the mass in instances where the tangential arc is not multiply imaged or itsredshift is unknown.
The radial critical line can be constrained when a radial arc is observed in thecluster core, this has now been done for a number of cluster lenses (e.g. Fort et al.1992; Smith et al. 2001; Sand et al. 2002; Gavazzi et al. 2003). These features areimportant as they lie very close to the cluster core, and thus provide a unique probeof the surface mass density in the very center. Baryons are highly concentrated in theinner regions of clusters and they are expected to play an important role in possiblymodifying the dark matter distribution on the smallest scales. The scales on whichthese effects are expected are accessible effectively with lensing data. Radial arcshave been used to probe the dark matter slope in the inner most regions of clusters

Astron Astrophys Rev (2011) 19:47 Page 31 of 100
(Sand et al. 2005, 2008; Newman et al. 2011), the results of these studies will bediscussed in detail later on in this review.
The proper way to accurately constrain the mass in cluster cores is thus to usemultiple images with preferably measured spectroscopic redshifts to absolutely cali-brate the mass. To do this, one generally defines a likelihood L for the observed dataD and parameters p of the model:
L = Pr(D|p) =N∏
i=1
1∏ni
j=1 σij
√2π
exp− χ2i2 , (48)
where N is the number of systems, and ni the number of multiple images for thesystem i. The contribution from the multiple-image system i to the overall χ2 can besimply given by
χ2i =
ni∑j=1
[θj
obs − θj (p)]2
σ 2ij
, (49)
where θj (p) is the position of image j predicted by the current model, whose param-eters are p and where σij is the error on the position of image j .
The accurate determination of σij depends on the signal-to-noise of the image S/Nratio. For extended images, a pixellated approach is the only accurate way to take theS/N ratio of each pixel into account (Dye and Warren 2005; Suyu et al. 2006) butthis is not optimal for cluster lenses with a large number of multiple-image systems.However, to a first approximation, the positional error of images can be determinedby fitting a 2D Gaussian profile to the image surface brightness, which assumes thatthe background galaxy is compact and its surface brightness profile is smooth enoughso that the brightest point in the source plane can be reliably matched to the brightestpoint in the image plane.
A major issue in the χ2 computation is how to match the predicted and observedimages one by one. In models producing different configurations of multiple images(e.g. a radial system instead of a tangential system), the χ2 computation will failand the corresponding model will then be rejected. This usually happens when themodel is not yet well determined, and this can slow down the convergence of themodeling significantly. To get around this complexity, one often computes the χ2
in the source plane (by computing the difference in the source position for a givenparameter sample p) instead of doing so in the image plane. The source plane χ2 iswritten as
χ2Si
=ni∑
j=1
[θj
S (p) − 〈θj
S (p)〉]2
μ−2j σ 2
ij
, (50)
where θj
S (p) is the corresponding source position of the observed image j , 〈θj
S (p)〉 isthe barycenter position of all the ni source positions, and μj is the magnification forimage j . Written in this way, there is no need to solve the lensing equation repeatedlyand so the calculation of the χ2 is very fast. However, in the case where only a smallnumber of multiple-image systems are used, source plane optimization may lead to abiased solution, typically favoring mass models with large ellipticity.

Page 32 of 100 Astron Astrophys Rev (2011) 19:47
It is important to use physically well motivated representations of the mass distri-bution and adjust these in order to best reproduce the different families of observedmultiple images (e.g. Kneib et al. 1996; Smith et al. 2001) iteratively. Indeed, oncea set of multiple images is securely identified, other multiple-image systems can inturn be discovered using morphological/color/redshift-photometric criteria, or on thebasis of the lens model predictions. Better data, or data at different wavelengths mayalso bring new information enabling new multiple images to be identified increasingthe number of constraints for modeling and hence the accuracy of mass models.
3.1.3 Modeling the various cluster mass components
In a cluster, the positions of multiple images are known to great accuracy and theyare usually scattered at different locations within the cluster inner regions. A simplemass model with one clump cannot usually successfully reproduce observed imageconfigurations.
We know that galaxies in general are more massive than represented by their stellarcontent alone. In fact, the visible stellar mass represents only a small portion (likely10–20%) of their total mass. The existence of an extended dark matter halo aroundindividual galaxies has been established for disk galaxies with the measurement oftheir flat and spatially extended rotation curves (e.g. van Albada et al. 1985). The ex-istence of a dark matter halo has been accepted for ellipticals only relatively recently(e.g. Kochanek et al. 1995; Rix et al. 1997). These studies found that while the stellarcontent dominates the central parts of galaxies, at distances larger than the effectiveradius the dark matter halo dominates the total mass inventory. What is less obviousin clusters of galaxies, given their dense environments, is how far the dark halos ofindividual early-type galaxies extend. One expects tidal “stripping” of extended darkmatter halos to occur as cluster galaxies fall in and traverse through cluster cores dur-ing the assembly process. This is borne out qualitatively by the strong morphologicalevolution observed in cluster galaxies (e.g. Lewis et al. 2000; Kodama et al. 2002;Treu et al. 2003). In fact, lensing offers a unique probe of the mass distribution onthese smaller scales within cluster environments.
The lensing effects of individual galaxies in clusters was first noted by Kassiolaet al. (1992) who detected that the lengths of the triple arc in Cl0024+1654 can onlybe explained if the galaxies near the ‘B’ image were massive enough. Detailed treat-ment of the individual galaxy contribution to the overall cluster mass distribution be-came critical with the refurbishment of the HST as first shown by Kneib et al. (1996).It was found that cluster member galaxies and their associated individual dark matterhalos need to be taken into account to accurately model the observed strong lensingfeatures in the core of Abell 2218.
The theory of what is now referred to as galaxy–galaxy lensing in clusters wasfirst formulated and discussed in detail by Natarajan and Kneib (1997), and its ap-plication to data followed shortly (Natarajan et al. 1998; and Geiger and Schneider1999). From their detailed analysis of the cluster AC 114, Natarajan et al. (1998)concluded that dark matter distributed on galaxy scales in the form of halos of clustermembers contributes about 10% of the total cluster mass. Analysis of this effect inseveral cluster lenses at various redshifts seems to indicate that tidal stripping does

Astron Astrophys Rev (2011) 19:47 Page 33 of 100
in fact severely truncate the dark matter halos of infalling cluster galaxies. The darkmatter halos of early-type galaxies in clusters is found to be truncated compared tothat of equivalent luminosity field galaxies (Natarajan et al. 2002a, 2002b; Natarajanand Springel 2004). More recent work finds that tidal stripping is on average moreefficient for late-type galaxies compared to early-type galaxies (Natarajan et al. 2009)in the cluster environment.
Lens models need to include the contribution of small scale potentials in clusterslike those associated with individual cluster galaxies to reproduce the observed imageconfigurations and positions. As there are only a finite number of multiple images,the number of constraints is limited. It is therefore important to limit the number offree parameters of the model and keep it physically motivated—as in the end—weare interested in deriving physical properties that characterize the cluster fully.
Generally, in these parametric approaches, the cluster gravitational potential isdecomposed in the following manner:
φtot =∑
i
φci+
∑j
φpj, (51)
where we distinguish smooth, large-scale potentials φci, and the sub-halo potentials
φpjthat are associated with the halos of individual cluster galaxies as providing small
perturbations (Natarajan and Kneib 1997). The smooth cluster-scale halos usuallyrepresent both the dark matter and the intra-cluster gas. However, combining withX-ray observations, each of these two components could in principle be modeledseparately. For complex systems, more than one cluster-scale halo is often needed tofit the data. In fact, this is the case for many clusters: Abell 370, 1689, 2218 to namea few.
The galaxy-scale halos included in the model represent all the massive clustermember galaxies that are roughly within two times the Einstein radius of the cluster.This is generally achieved by selecting galaxies within the cluster red sequence andpicking the brighter ones such that their lensing deflection is comparable to the spatialresolution of the lensing observation. Studies of galaxy–galaxy lensing in the fieldhave shown that a strong correlation exists between the light and the mass profiles ofelliptical galaxies (Mandelbaum et al. 2006). Consequently, to a first approximation,in mass modeling the location, ellipticity and orientation of the smaller galaxy halosare matched to their luminous counterparts.
Except for a few galaxy scale sub-halos that do perturb the locations of multipleimages in their vicinity or alter the multiplicity of lensed images in rare cases, thevast majority of galaxy scale sub-halos act to merely increase the total mass enclosedwithin the Einstein radius. In order to reduce the number of parameters required todescribe galaxy scale halos, well motivated scaling relations with luminosity are oftenadopted. Following the work of Brainerd et al. (1996) for galaxy–galaxy lensing inthe field, galaxy-scale sub-halos within clusters are usually modeled with individualPIEMD potentials. The mass profile parameters for this model are the core radius(rcore), cut-off radius (rcut), and central velocity dispersion (σ0), which are scaled to

Page 34 of 100 Astron Astrophys Rev (2011) 19:47
the galaxy luminosity L in the following way:⎧⎪⎪⎪⎪⎪⎪⎪⎪⎪⎨⎪⎪⎪⎪⎪⎪⎪⎪⎪⎩
σ0 = σ�0
(L
L�
)1/4
,
rcore = r�core
(L
L�
)1/2
,
rcut = r�cut
(L
L�
)α
.
(52)
The total mass of a galaxy scale sub-halo then scales as (Natarajan and Kneib1997):
M = (π/G)(σ�
0
)2r�
cut
(L/L�
)1/2+α, (53)
where L� is the typical luminosity of a galaxy at the cluster redshift. When r�core
vanishes, the potential becomes a singular isothermal potential truncated at the cut-off radius.
In the above scaling relations (52), the velocity dispersion scales with the totalluminosity in agreement with the empirically derived Faber–Jackson relations forelliptical galaxies (for spiral galaxies the Tully–Fisher should be used instead, butthose are not numerous in cluster cores). When α = 0.5, the mass-to-light ratio isconstant and is independent of the galaxy luminosity, however, if α = 0.8, the mass-to-light ratio scales with L0.3 similar to the scaling seen in the fundamental plane(Jorgensen et al. 1996; Halkola et al. 2006). Other scalings are of course permissible,and a particularly interesting one that has been recently explored in field galaxy–galaxy lensing studies, is to scale the sub-halo mass distribution directly with thestellar mass (see Leauthaud et al. 2011).
3.1.4 Bayesian modeling
State of the art parametric modeling is done in the context of a fully Bayesian frame-work (Jullo et al. 2007), where the prior is well defined and the marginalization isdone over all the relevant model parameters that represent the cluster mass distri-bution. Indeed, the Bayesian approach is better suited than regression techniques insituations where the data by themselves do not sufficiently constrain the model. Inthis case, prior knowledge about the Probability Density Function (PDF) of parame-ters helps to reduce degeneracies in the model. The Bayesian approach is well-suitedto strong lens modeling given the few constraints generally available to optimize amodel. The Bayesian approach provides two levels of inference rather efficiently:parameter space exploration, and model comparison. Bayes Theorem can be writtenas
Pr(p|D,M) = Pr(D|p,M)Pr(p|M)
Pr(D|M), (54)
where Pr(p|D,M) is the posterior PDF, Pr(D|p,M) is the likelihood of getting theobserved data D given the parameters p of the model M , Pr(p|M) is the prior PDFfor the parameters, and Pr(D|M) is the evidence.

Astron Astrophys Rev (2011) 19:47 Page 35 of 100
The value of the posterior PDF will be the highest for the set of parameters pwhich gives the best fit and that is consistent with the prior PDF, regardless of thecomplexity of the model M . Meanwhile, the evidence Pr(D|M) is the probability ofgetting the data D given the assumed model M . It measures the complexity of modelM , and, when used in model selection, it acts as Occam’s razor.5
Jullo et al. (2007) have implemented in LENSTOOL6 a model optimization basedon a Bayesian Markov Chain Monte Carlo (MCMC) approach, which is currentlywidely used. Since this approach involves marginalizing over all relevant parameters,it offers a clearer picture of all the model degeneracies.
3.2 Probing the radial profile of the mass in cluster cores
One important prediction from dark matter only numerical simulations of structureformation and evolution in a �CDM Universe, is the value of the slope β of thedensity profile ρdarkmatter ∝ r−β in the central part of relaxed gravitational systems.Although there has been on-going debate for the past decade on the exact value ofthe inner slope (Navarro et al. 1997 (β = 1); Moore et al. 1998 (β = 1.5)), the reallimitation of such predictions is the lack of baryonic matter in these simulations.Baryons dominate the mass budget and the gravitational potential in the inner mostregions of clusters and need to be taken into account while trying to constrain theinner slope of the dark matter density profile. This is expected to change in the nearfuture with better numerical simulations. Even in dark matter only simulations, ithas been found that non-singular three-parameter models, e.g. the Einasto profilehas a better performance than the singular two-parameter NFW model in the fittingof a wide range of dark matter halo structures (Navarro et al. 2010). Nevertheless,the radial slope of the total mass profile is a quantity that lensing observations canuniquely constrain (e.g. Miralda-Escudé 1995). This was first attempted for Abell2218 by Natarajan and Kneib (1996) and subsequently by Smith et al. (2001) for thecluster Abell 383, by modeling the cluster center as the sum of a cD halo and a large-scale cluster component. Abell 383 is an interesting and unique system wherein botha tangential and a radial arc with similar redshift are observed. Such a configurationprovides a particularly good handle on the inner slope (here considered as the sum ofthe stellar and Dark Matter component), which in the case of Abell 383 was found tobe steeper than the NFW prediction.
Once tangential and radial arcs have been identified from HST images (seeFig. 19), the main observational limitation is the measurement of the redshift ofthe multiply imaged arc to firmly constrain the radial mass profile. Large telescopes(Keck/VLT/Gemini/Subaru) have been playing a key role in cluster lensing by mea-suring the redshifts of multiple images. Furthermore, working at high spectral reso-lution allows one to also probe the dynamics of cD galaxies in the core of clusters(Natarajan and Kneib 1996; Sand et al. 2002). Thus combining constraints from stel-lar dynamics, in particular, measurements of the velocity dispersion of stars and cou-pling that with lensing enables the determination of the mass distribution in cluster
5“All things being equal, the simplest solution tends to be the best one.”6LENSTOOL is available at http://lamwws.oamp.fr/lenstool/.

Page 36 of 100 Astron Astrophys Rev (2011) 19:47
Fig. 19 Example of radial arcs found in the 4 cluster AC118, RCS0224, A370 and A383 (from Sand et al.2005). The right side of each panel shows the BCG subtracted images
cores. This combination is very powerful as it weighs the different mass compo-nents individually: stellar mass, X-ray gas and dark matter in the cores of clusters.Sand et al. (2005) applied this technique to the clusters MS2137-23 and Abell 383and found that the dark matter component is best described by a generalized NFWmodel with an inner slope that is shallower than the theoretically predicted canonicalNFW profile. A similar analysis was also conducted by Gavazzi et al. (2003) with thesame result. It must be stressed that the comparison between numerical simulationsand observations is not direct as the stars in the cD galaxies dominate the total massbudget in the very center and the additional contributions of these baryons are notaccounted for in the dark matter only simulations. It is widely believed that the sig-nificant presence of baryons in cluster cores likely modifies the inner density profileslope of dark matter, although there is disagreement at present on how significant thisadiabatic compression is likely to be (Blumenthal et al. 1986; Gnedin et al. 2004;Zappacosta et al. 2006). Radial arcs offer a unique and possible only handle to probethe inner slopes of density profiles. Several other clusters with radial arcs have beendiscovered from HST archives recently, and are currently being followed up spectro-scopically (Sand et al. 2005, 2008).
In a recent paper, Newman et al. (2011) have obtained high accuracy velocitydispersion measurements for the cD galaxy in Abell 383 out to a radius of ∼26 kpcfor the first time in a lensing cluster. Adopting a triaxial dark matter distribution,an axisymmetric dynamical model and using the constraints from both strong andweak lensing, they demonstrate that the logarithmic slope of the dark matter densityat small radii is β < 1.0 (95% confidence), shallower than the NFW prediction (seeFig. 20). Similar analysis of other relaxed clusters, including constraints from smallto large scales will help improve our understanding of the mass distribution in clustercores and help test the assumptions used in numerical simulations where both darkmatter and baryonic matter (stars and X-ray-gas) are explicitly included.

Astron Astrophys Rev (2011) 19:47 Page 37 of 100
Fig. 20 Top: Projected mass for the dark matter and stellar components, as well as the total mass distribu-tion, with tangential reduced shear (g) data inset at the same radial scale for the cluster Abell 383. Bottom:3D Mass, with velocity dispersion data inset and X-ray constraints overlaid. All bands show 68% confi-dence regions. The models acceptably fit all constraints ranging from the smallest spatial scales �2 kpc to�1.5 Mpc. This figure is taken from Newman et al. (2011)
3.3 Non-parametric strong lensing modeling
In addition to the use of the parametric analytic mass models described above,there has been considerable progress in developing non-parametric mass reconstruc-tion techniques in the past decade (e.g. Abdelsalam et al. 1998a, 1998b; Saha andWilliams 1997; Diego et al. 2005a, 2005b; Jullo and Kneib 2009; Coe et al. 2010;Zitrin et al. 2010). Non-parametric cluster mass reconstruction methods have becomemore popular with the increase in available observational constraints from the numer-ous multiple images that are now more routinely found in deep HST data (e.g. Broad-hurst et al. 2005). Non-parametric models have increased flexibility which allowsa more comprehensive exploration of allowed mass distributions. These schemes are

Page 38 of 100 Astron Astrophys Rev (2011) 19:47
particularly useful to model extremely complex mass distributions such as the “BulletCluster” (Bradac et al. 2005).
Contrary to the analytic profile driven“parametric” methods, in “non-parametric”schemes, the mass distribution is generally tessellated into a regular grid of smallmass elements, referred often to as pixels (Saha and Williams 1997; Diego et al.2005a). Alternatively, instead of starting with mass elements, Bradac et al. (2005)prefer tessellating the gravitational potential because its derivatives directly yieldthe surface density and other important lensing quantities that can be related morestraightforwardly to measurements. Pixels can also be replaced by radial basis func-tions (RBFs) that are real-valued functions with radial symmetry. Several RBFs fordensity profiles have been tested so far. Liesenborgs et al. (2007) use Plummer pro-files, and Diego et al. (2007) use RBFs with Gaussian profiles. The properties ofpower law profiles, isothermal profiles as well as Legendre and Hermite polynomi-als have been explored as RBFs. These studies find that the use of compact profilessuch as the Gaussian or Power law profiles are generally preferred as they are moreaccurate in reproducing the surface mass density.
In more recent work, instead of using a regular grid, Coe et al. (2008, 2010) andDeb et al. (2008) use the actual distribution of images as an irregular grid. Then,they either place RBFs on this grid or directly estimate the derivatives of the poten-tial at the location of the images. Whatever their implementation, the reproductionof multiple images is generally greatly improved with respect to traditional “para-metric” modeling with these techniques. However, the robustness of these modelsis still a matter of debate given the current observational constraints available fromdata. Indeed, due to the large amount of freedom that inevitably goes with the largedegree of flexibility afforded by a “non-parametric” approach, many models can fitperfectly the data and discriminating between models is challenging. To identify thebest physically motivated model and eventually learn more about the dark matterdistribution in galaxy clusters, additional external criteria (e.g. mass positivity) orregularization terms (e.g. to avoid unwanted high spatial frequencies) are necessary.Furthermore, galaxy mass scales are usually not taken into account in these non-parametric schemes, despite the fact that successful parametric modeling has clearlydemonstrated that these smaller scale mass clumps do significantly affect the po-sitions of observed multiple images. This is a key limitation of most of the “non-parametric” models.
Jullo and Kneib (2009) [JK09 hereafter] have proposed a novel modeling schemethat includes both a multi-scale grid of RBFs and a sample of analytically definedgalaxy-scale dark matter halos, thus allowing combined modeling of both complexlarge-scale mass components and galaxy-scale halos. In this hybrid scheme, similarto the one adopted by Diego et al. (2005a), JK09 define a coarse multi-scale grid froma pixellated input mass map and recursively refine it in the densest regions. However,in contrast to previous work, they start from a hexagonal grid (composed of triangles),on the grounds that it better fits the generally roundish shapes of galaxy clusters. Fortheir RBF, they use truncated circular isothermal mass models, and truncated PIEMDmodels to explicitly include galaxy-scale halos. Thus both components are modeledwith similar analytical functions which permits a simple combination for ready incor-poration into the Bayesian MCMC optimization scheme built into LENSTOOL. Fig-ure 21 shows the derived S/N convergence map for the model of the cluster A1689.
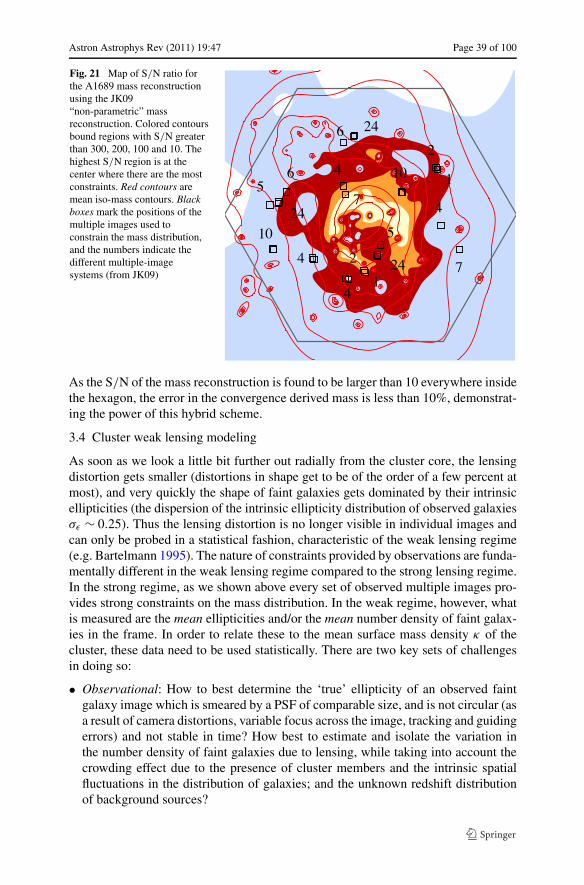
Astron Astrophys Rev (2011) 19:47 Page 39 of 100
Fig. 21 Map of S/N ratio forthe A1689 mass reconstructionusing the JK09“non-parametric” massreconstruction. Colored contoursbound regions with S/N greaterthan 300, 200, 100 and 10. Thehighest S/N region is at thecenter where there are the mostconstraints. Red contours aremean iso-mass contours. Blackboxes mark the positions of themultiple images used toconstrain the mass distribution,and the numbers indicate thedifferent multiple-imagesystems (from JK09)
As the S/N of the mass reconstruction is found to be larger than 10 everywhere insidethe hexagon, the error in the convergence derived mass is less than 10%, demonstrat-ing the power of this hybrid scheme.
3.4 Cluster weak lensing modeling
As soon as we look a little bit further out radially from the cluster core, the lensingdistortion gets smaller (distortions in shape get to be of the order of a few percent atmost), and very quickly the shape of faint galaxies gets dominated by their intrinsicellipticities (the dispersion of the intrinsic ellipticity distribution of observed galaxiesσε ∼ 0.25). Thus the lensing distortion is no longer visible in individual images andcan only be probed in a statistical fashion, characteristic of the weak lensing regime(e.g. Bartelmann 1995). The nature of constraints provided by observations are funda-mentally different in the weak lensing regime compared to the strong lensing regime.In the strong regime, as we shown above every set of observed multiple images pro-vides strong constraints on the mass distribution. In the weak regime, however, whatis measured are the mean ellipticities and/or the mean number density of faint galax-ies in the frame. In order to relate these to the mean surface mass density κ of thecluster, these data need to be used statistically. There are two key sets of challengesin doing so:
• Observational: How to best determine the ‘true’ ellipticity of an observed faintgalaxy image which is smeared by a PSF of comparable size, and is not circular (asa result of camera distortions, variable focus across the image, tracking and guidingerrors) and not stable in time? How best to estimate and isolate the variation inthe number density of faint galaxies due to lensing, while taking into account thecrowding effect due to the presence of cluster members and the intrinsic spatialfluctuations in the distribution of galaxies; and the unknown redshift distributionof background sources?

Page 40 of 100 Astron Astrophys Rev (2011) 19:47
• Theoretical: what is the optimal method to reconstruct the surface mass densitydistribution κ (as a mass map or a radial mass profile) using either the ‘reducedshear field’ �g and/or the amplification?
Various approaches have been proposed to solve these sets of problems, and twodistinct families of methods can be distinguished: direct and inverse methods. Wedescribe them in detail in what follows.
3.4.1 Weak lensing observations
For observers, before any data handling, the first step is to choose the telescope (andinstrument) that will minimize the sources of noise in the determination of the ellip-ticity of faint galaxies. Although HST has the best characteristics in terms of the PSFsize, it has a very limited field of view ∼10 square arcminutes for the ACS camera.Furthermore, Hubble is “breathing” as it is orbiting around the Earth, which affectsthe focus of its instruments, and the most recent ACS imaging data appear to be suf-fering from Charge Transfer Inefficiency (CTI) which needs special post-processingfor removal of these instrumental effects (Massey 2010). Although, as we have seen,HST is ideal for picking out strong lensing features (e.g. Gioia et al. 1998), it is notthe most appropriate instrument to probe the large-scale distribution of a cluster ex-tending out to and beyond the virial radius. Note, however, this limitation becomesless of a problem when observing high-redshift clusters (e.g. Hoekstra et al. 2002;Jee et al. 2005; Lombardi et al. 2005).
On the ground a number of wide-field imaging cameras have been used to conductweak lensing measurements in cluster fields. The most productive ones in the lastdecades have been: the CFHT12k camera (e.g. Bardeau et al. 2007; Hoekstra 2007)and the more recent Megacam camera (e.g. Gavazzi and Soucail 2007, Shan et al.2010) at CFHT, and the Suprimecam on Subaru (e.g. Okabe et al. 2010). However,a number of studies have also been done with other instruments, in particular, theVLT/FORS (e.g. Cypriano et al. 2001, Clowe et al. 2004a, 2004b), 2.2 m/WFI (e.g.Clowe and Schneider 2002), and more recently with the LBT camera (Romano et al.2010).
3.4.2 Galaxy shape measurement
Once the data have been carefully taken either from the ground or space with utmostcare to minimize contaminating distortions and hopefully under the best seeing con-ditions, the next step is to convert the image of the cluster into a catalog where thePSF corrected shapes of galaxies are computed.
Before measuring the galaxy shape a number of steps are usually undertaken:(1) masking of the data and identifying the regions in the image that suffer fromobservational defects: bleeding stars, satellite tracks, hot pixels, spurious reflec-tions; (2) source identification and catalog production—which is usually done us-ing the SEXTRACTOR software (Bertin and Arnouts 1996); (3) identification ofthe stellar objects—in order to accurately compute the PSF as a function of posi-tion in the image. Once this is done, the shapes of the stellar objects and galax-ies can be computed to derive the PSF corrected shapes of galaxies which willthen be used for weak lensing measurements. For accomplishing this crucial next

Astron Astrophys Rev (2011) 19:47 Page 41 of 100
step, a popular and direct approach is often used, to convert galaxy shapes toshear measurements using the IMCAT software package. This implementation isbased on the Kaiser et al. (1995) methodology, but has been subsequently im-proved by various other groups (e.g. Luppino and Kaiser 1997; Rhodes et al. 2000;Hoekstra et al. 2000), providing variants of the original KSB technique. To correct thegalaxy shape from the PSF anisotropy and circularization, the KSB technique usesthe weighted moment of the object’s surface brightness to find its center, and shapeto measure higher order components that can be used to improve the PSF correction.As a result the correction is fast and processing a large amount of data can be doneswiftly and efficiently.
Alternatively, one can use the inverse approach using maximum likelihood meth-ods or Bayesian techniques to find the optimal galaxy shape that when convolvedwith the local PSF best reproduces the observed galaxy shape (e.g. Kuijken 1999;IM2SHAPE: Bridle et al. 2002). A recent implementation of this inverse method isavailable in the LENSFIT software package (Miller et al. 2007; Kitching et al. 2008)and one of its key advantages is that it works directly on the individual exposures ofa given field. LENSFIT has been developed in the context of the CFHT-LS survey, butis flexible and can be easily adapted for use with other observations.
These inverse approaches have the advantage that they provide a direct estimateof the uncertainty in the parameter recovery as illustrated in Fig. 22. Further exten-sion of these inverse techniques, has led to the use of SHAPELETS (Refregier 2003;Refregier and Bacon 2003) that offer a more sophisticated basis set to characterizethe two-dimensional shapes of the PSF and faint galaxies. The versatility of shapeletshas made this technique quite popular for lensing measurements. Nevertheless, ithas been realized that these different shape measurement recipes need to be tuned,compared and calibrated amongst each other in order to obtain accurate, unbiasedand robust shear measurements. This calibration work has been done in the con-text of various numerical challenges, wherein different research groups measure theshapes of the same set of simulated images as part of STEP (Heymans et al. 2006;Massey et al. 2007); the GREAT08 and GREAT10 challenges (Bridle et al. 2010;Kitching et al. 2011). These challenges have proven to be very useful exercises forthe community as they have enabled calibration of the several independent techniquesemployed to derive shear from observed shapes.
3.4.3 From galaxy shapes to mass maps
From the catalog of shape measurements of faint galaxies, a mass map can be de-rived. And here again direct and inverse methods have been explored. The directapproaches are: (i) the Kaiser and Squires (1993) method—this is an integral methodthat expresses κ as the convolution of �γ with a kernel and subsequent refinementsthereof (e.g. Seitz and Schneider 1995, 1996; Wilson et al. 1996); and (ii) a localinversion method (Kaiser 1995; Schneider 1995; Lombardi and Bertin 1998) that in-volves the integration of the gradient of �γ within the boundary of the observed fieldto derive κ . This technique is particularly relevant for datasets that are limited to asmall field of view.
The inverse approach works for both the κ field and the lensing potential ϕ anduses a maximum likelihood (e.g. Bartelmann et al. 1996; Schneider et al. 2000;

Page 42 of 100 Astron Astrophys Rev (2011) 19:47
Fig. 22 Simulated images demonstrating the various sources of noise in weak lensing data: the galaxymodel, the PSF model, the convolution of the two, and the final image when noise is added. Simple simu-lations allow the production of model images that include observational sources of noise and can thereforebe compared directly to the shapes of observed faint galaxies. The best galaxy model is then found bytaking into account the convolution effect of the measured PSF that best fits the data. (Bottom panels):the MCMC samples fitting the final image in terms of its ellipticity vector with coordinates [e+ = e1]and [e× = e2] (on the left) and in terms of the position (x, y) of the image center (right), from which thebest-fit fiducial models with errors can be extracted (black crosses). One of the first implementations ofthis inverse technique was done in the IM2SHAPE software (Bridle et al. 2002)
King and Schneider 2001), maximum entropy method (e.g. Bridle et al. 1998;Marshall et al. 2002) or atomic inference approaches coupled with MCMC optimiza-tion techniques (Marshall 2006) to determine the most likely mass distribution (as a2D mass map or a 1D mass profile) that reproduces the reduced shear field �g and/orthe variation in the faint galaxy number densities. These inverse methods are of greatinterest as they enable quantifying the errors in the resultant mass maps or mass esti-

Astron Astrophys Rev (2011) 19:47 Page 43 of 100
Fig. 23 Maximum entropy mass reconstruction (Marshall et al. 2002; Marshall 2003) of the X-ray lumi-nous cluster MS1054 at z = 0.83 using Hoekstra’s HST dataset (Hoekstra et al. 2000). (Top left) Distribu-tion of the positions of galaxies used in the mass reconstruction. (Top right) Evidence values for differentsizes of the Intrinsic Correlation Function (ICF). (Bottom) Two mass reconstructions illustrate the case of2 different values for the ICF: (left) small ICF with a low evidence value, (right) large ICF with the largestevidence
mates (e.g. Kneib et al. 2003), and in principle, can cope with the addition of furtherexternal constraints from strong lensing or X-ray data simultaneously. Wavelet ap-proaches that use the multi-scale entropy concept have also been extremely powerfulin producing multi-scale mass maps (Starck et al. 2006; Pires et al. 2009).
An important issue for producing mass maps is the resolution at which the 2D lens-ing mass map can be reconstructed. Generally, mass maps are reconstructed on a fixedsize grid, which then automatically defines the minimum mass resolution that can beobtained. By comparing the likelihood of different resolution mass maps, we can cal-culate the Bayesian evidence of each to determine the optimal resolution (Fig. 23).However, it is most likely that the optimal scale to which a mass map can be recon-structed is adaptive, and is determined by the strength of the lensing signal. As weare limited by the width of the intrinsic ellipticity distribution, it is only by averagingover a large number of galaxies that we can reach lower shear levels. Thus low shearlevels can only be probed on relatively large scales by averaging over a large number

Page 44 of 100 Astron Astrophys Rev (2011) 19:47
Fig. 24 The 39 WFPC2/F814W, and the 38 STIS/50CCD pointings sparsely covering the Cl0024+1654cluster. The (red) dashed contours represent the number density of cluster members as derived by Czoskeet al. (2001). The blue solid contour is the mass map built from the joint WFPC2/STIS analysis derivedusing the LensEnt software (Bridle et al. 1998; Marshall et al. 2002)
of galaxies. Furthermore, as the projected surface mass density of clusters on largescales falls off relatively quickly scaling as 1/R to 1/R2, respectively, for an SIS ora NFW profile, mass maps may quickly lose spatial resolution.
Although lensing mass maps may quickly loose information content outside thecluster core, they can be very useful in identifying possible (unexpected) substruc-tures on scales larger than the typical weak lensing smoothing scale (∼1 arcminute).This has been the case for several cluster lenses such as the cluster Cl0024+1654(e.g. Kneib et al. 2003 and Fig. 23; Okabe et al. 2010) and the “Bullet Cluster” (seeFig. 25), and more recently in the so-called “baby bullet” cluster (Bradac 2009).
3.4.4 Measuring total mass and mass profiles
Weak lensing mass maps are useful to determine mass peaks, but they are of limiteduse for the extraction of physical information. If a cluster has a relatively simple

Astron Astrophys Rev (2011) 19:47 Page 45 of 100
Fig. 25 Right panel: Shown in greyscale is the I -band VLT/FORS image of the Bullet cluster used to mea-sure galaxy shapes. Over-plotted in black contours is the weak lensing mass reconstruction with solid con-tours for positive mass, dashed contours for negative mass, and the dash-dotted contour for the zero-masslevel. Left panel: Shown in greyscale is the Chandra X-ray image from Markevitch et al. (2002) with thesame weak lensing contours as in the Right Hand panel. (Figure from Clowe et al. 2004a, 2004b)
geometry (i.e. has a single mass clump in its 2D mass map) one can easily extractthe radial mass profile and compute the total mass enclosed within a given radialaperture. Different approaches are currently available to compute the mass profileand the total mass. The direct method is just to sum up the tangential weak shear asexpressed in the aperture mass densitometry first introduced by Fahlman et al. (1994)and then revised by Clowe et al. (1998). This statistic is quite popular and has beenused in several recent cluster modeling papers, including Hetterscheidt et al. (2005),Hoekstra (2007) and Okabe et al. (2010). Aperture mass densitometry measures themass interior to a given radius following the ζ statistic, defined as
ζ(θ1) = κ(θ < θ1) − κ(θ1 < θ < θmax) = 2
(1 − θ2
1
θ2max
)∫ θmax
θ1
〈γT〉d ln θ, (55)
which provides a lower bound on the mean convergence κ interior to radius θ1. Themass within θ is then just given by
M(< θ) = πD2OLθ2Σcritζ(θ). (56)
This statistic assumes, however, that all background galaxies are at a similar redshift,which can be a strong and severely limiting assumption, particularly for high-redshiftclusters.
Another semi-direct approach is to build the projected surface density contrast�Σ estimator as introduced by Mandelbaum et al. (2005):
�Σ(r) = Σ(< r) − Σ(r) = γT(r)Σcrit(zS). (57)

Page 46 of 100 Astron Astrophys Rev (2011) 19:47
In practice, �Σ is measured by averaging over the galaxies at radius r from thecluster center, and requires some information about the redshift distribution of back-ground galaxies zS. It can then be directly compared to the �Σ(r) computed for agiven parametrized mass model. Mandelbaum et al. (2010) discuss and compare thiscluster mass estimator with other proposed ones. In a recent paper, Gruen et al. (2011)compare the use of various aperture mass estimators to calibrate mass-observable re-lations from weak lensing data.
The alternative method is to directly fit the observables using simple parametricmodels similar to what is done in the strong lensing approach, for example usingradially binned data (e.g. Fischer and Tyson 1997; Clowe and Schneider 2002; Kneibet al. 2003; King et al. 2002). The advantage of adopting such a method lies in itsflexibility, i.e. allowing combination of strong and weak lensing constraints. Thisdirect approach also allows inclusion of external constraints such as those from X-ray data and the redshift distribution of background sources that can be estimatedusing photometric-redshift techniques. Of course, such parametric techniques requireallowing sufficient freedom in the radial profile and the inclusion of substructures(e.g. Metzler et al. 1999, 2001; King et al. 2001) to closely match observed lensingdistortions.
3.5 Cluster triaxiality
As lensing is sensitive to the integrated mass along the line of sight, it is natural toexpect mass overestimates due to fortuitous alignment of mass concentrations notphysically related to the cluster or alternatively departures of the cluster dark matterhalo from spherical symmetry (e.g. Gavazzi 2005). Till recently, most studies of thedark matter distribution and the intra-cluster medium (ICM) in galaxy clusters usingX-ray data have been limited due to the assumption of spherical symmetry. How-ever, the Chandra and XMM-Newton X-ray telescopes have resolved the core of theclusters, and have detected departures from isothermality and spherical symmetry.Evidence for a flattened triaxial dark matter halo around five Abell clusters had beenreported early on by Buote and Canizares (1996). Furthermore, numerical simula-tions of cluster formation and evolution in a cold dark matter dominated Universedo predict that dark matter halos have highly elongated axis ratios (Wang and White2009), disproving the assumption of spherical geometry. In fact the departures fromsphericity of a cluster may help explain the discrepancy observed between clustermasses determined from X-ray and strong lensing observations (Gavazzi 2005). Thissuggests that clusters with observed prominent strong lensing features are likely tobe typically preferentially elongated along the line of sight which might account fortheir enhanced lensing cross sections. This is definitely the case for the extreme stronglenses with large Einstein radii and therefore anomalously high concentrations. Thegalaxy cluster A1689 is a well-studied example with such a mass discrepancy (Ander-sson and Madejski 2004; Lemze et al. 2008; Riemer-Sorensen et al. 2009; Peng et al.2009). In the same vein, large values of the NFW model concentration parametershave also been reported for clusters with prominent strong lensing features (Comer-ford and Natarajan 2007; Oguri et al. 2009). This can again be explained by stronglensing cluster halos having their major axis preferentially oriented toward the line ofsight (Corless et al. 2009).
Astron Astrophys Rev (2011) 19:47 Page 47 of 100
Combining strong lensing constraints with high-resolution images of cluster coresin X-rays obtained with Chandra is an excellent way to probe the triaxiality of themass distribution in cluster cores. Mahdavi et al. (2007) provided a new frameworkfor the joint analysis of cluster observations (JACO) using simultaneous fits to X-ray,Sunyaev–Zel’dovich (SZ), and weak lensing data. Their method fits the mass mod-els simultaneously to all data, provides explicit separation of the gaseous, dark, andstellar components, and allows joint constraints on all measurable physical param-eters. The JACO prescription includes additional improvements to previous X-raytechniques, such as the treatment of the cluster termination shock and explicit inclu-sion of the BCG’s stellar-mass profile. Upon application of JACO to the rich galaxycluster Abell 478 they report excellent agreement among the X-ray, lensing, and SZdata.
Morandi et al. (2010) have used a triaxial halo model for the galaxy clusterMACS J1423.8+2404 to extract reliable information on the 3D shape and physicalparameters, by combining X-ray and lensing measurements. They found that thiscluster is triaxial with dark matter halo axial ratios 1.53 ± 0.15 and 1.44 ± 0.07 onthe plane of the sky and along the line of sight, respectively. They report that such ageometry produces excellent agreement between the X-ray and lensing mass.
These first results are very encouraging and pave the way for a better understand-ing of the 3D distribution of the various mass constituents in clusters. Theoretically,according to the current dark matter dominated cosmological model for structureformation cluster halo shapes ought to be triaxial and a firm prediction is profferedfor the distribution of axis ratios for clusters. More observational work needs to bedone to test these predictions, and ultimately techniques that combine lensing, X-rayand Sunyaev–Zel’dovich decrement data might be able to provide a complete three-dimensional view of clusters.
4 Mass distribution of cluster samples
Although the careful modeling of individual cluster cores and extended regions of-fers a unique way to characterize the mass distribution and understand cluster physicsin detail, analysis of cluster samples provides important insights into cluster as-sembly and evolution. There have been several statistical studies focused on mea-suring cluster masses derived from lensing and comparing these with mass esti-mates from other measurements such as: richness, X-ray luminosity, X-ray tempera-ture, velocity dispersions of cluster galaxies, and the Sunyaev–Zel’dovich decrement.These multi-wavelength comparisons enable a deeper understanding of empiricallyderived scaling relations between key physical properties of clusters (e.g. Luppinoand Gioia 1992; Loeb and Mao 1994; Miralda-Escudé and Babul 1995; Allen 1998;Ota et al. 1998; Ono et al. 1999; Irgens et al. 2002; Huterer and White 2002). Thesestudies also help uncover how mass is partitioned between the different baryonicand non-baryonic components on cluster scales. Studying cluster samples allows theprobing of several fundamental questions with regard to the dynamical state of clus-ters, namely, are clusters relaxed? How much substructure is present in clusters? Howtriaxial are clusters? How recently has a cluster had a major merger with another sub-cluster and what are the signatures of such an event? How important are projection

Page 48 of 100 Astron Astrophys Rev (2011) 19:47
effects in mass estimates? Are clusters in hydrostatic equilibrium? When did clus-ters start to assemble? And how have they evolved? Observationally derived answersto these questions from cluster samples can then be directly compared to numericalsimulations, thus providing insights and tests of the structure formation paradigm.
4.1 Early work
Comprehensive multi-wavelength datasets that ideally span a range of spatial scalesin clusters are needed for such statistical studies. Collecting such datasets is a bigchallenge as it requires coordination between researchers working with a range ofobservational techniques deploying many different resources. Some of the first stud-ies of cluster samples did produce interesting cosmological results, as discussed inLuppino et al. (1999), Allen et al. (2001, 2002), Dahle et al. (2002) and Smith et al.(2003).
One of the key challenges for these statistical studies lies in the very definitionof a sample with robust criteria that will be complete and volume limited and berepresentative to avoid systematic biases. Starting from simple selection criteria istherefore very important. For instance, dramatic lensing clusters imaged by HST arelikely a biased sample of the most massive clusters at any redshift with enhancedstrong lensing cross sections due to an excess of mass along the line of sight fromeither the cluster itself or the presence of other intervening structures. Most frequentlycluster samples are therefore selected on the basis of their X-ray luminosities, whichshould minimize projection effects that typically plague optically selected clusters.Since X-ray luminosity is proportional to the square of the electron density of theIntra-Cluster-Medium (ICM), this selection should pick genuinely virialized clusters,irrespective of the line of sight distribution of cluster member galaxies or additionalbackground structures. One of the first systematic studies that combined X-ray andlensing data was a sample of 12 z ∼ 0.2 X-ray luminous clusters of galaxies selectedfrom the XBACS catalog (see Figs. 26 and 27) with LX > 8 × 1044 erg/s in the0.1–2.4 keV band. These clusters have been imaged with the WFPC2 camera (Smithet al. 2001, 2005). It is found that the fraction of strong lensing clusters in this sampleis 70%. All of the cluster cores also have a significant weak lensing signal, providingindependent lensing constraints on cluster masses.
Smith et al. (2005) defined a number of criteria to characterize whether clustersare relaxed and also quantified the amount of substructure in them. Out of 10 clus-ters, they found that three clusters form a homogeneous sub-sample that have mature,undisturbed gravitational potentials which satisfy the following criteria: a dominantcentral dark matter halo (Mcen/Mtot > 0.95); a dominant central cluster galaxy K-band luminosity fraction (LK,BCG/LK,tot > ∼0.5); close alignment between the cen-ter of the mass distribution and the peak of the X-ray flux (�rpeak < 3 kpc); a sin-gle cluster-scale dark matter halo best fit for the lens model; and circular or mildlyelliptical X-ray flux contours. The remaining seven clusters did not satisfy one ormore of these criteria and were classified as disturbed. The disturbed clusters aremuch more diverse than the undisturbed clusters and typically have a bi- or tri-modaldark matter distribution, irregular X-ray morphology and an offset between X-rayand mass peaks. Comparison of these results with theoretical predictions indicatesthat the multi-modal dark matter distribution in disturbed clusters is due to recent

Astron Astrophys Rev (2011) 19:47 Page 49 of 100
Fig. 26 Cluster samples: 3 of the 12 z ∼ 0.2 X-ray luminous clusters of galaxies selected from the XBACScatalog (Ebeling et al. 1996) observed with the HST/WFPC2 camera. Top row is Abell 68, second row isAbell 209 and last row Abell 267. First column is the weak shear field as measured from the HST data. Thesecond column is a zoom of the cluster cores, and shows for Abell 68 the predicted critical lines (blacklines). The third column is the strong lensing mass reconstruction and last column is the overlay of theChandra X-ray map (Smith et al. 2003)
infall of galaxy groups into the parent cluster since about z = 0.4. The exact scalingrelation between lensing mass and X-ray properties appears to be strongly dependenton the dynamical state of the cluster. Relaxed and unrelaxed clusters appear to followslightly different scaling relations. Furthermore, this sample was also observed withthe wide field CFHT12k camera in three bands (B, R, I) in order to probe the widefield mass distribution using the measured weak lensing shear signal out to the virialradius. However, the comparison of the weak lensing determined mass to the clusterluminosity and X-ray mass estimates reported in Bardeau et al. (2007) (see Fig. 28)does not reveal an obvious difference between relaxed or unrelaxed clusters. Thereare some strong limitations though with this dataset as there were scant constraints onthe redshift distribution of background sources, and some lingering inconsistenciesbetween strong and weak lensing results. These first results with only 10 clusters setthe stage for the need for larger cluster samples to understand the physical origin ofsuch differences.
In a parallel paper, Hoekstra (2007) investigated the lensing versus X-ray massrelations for a sample of 20 clusters including those of Bardeau et al. (2007), althoughtheir cluster selection was primarily driven by X-ray emission. This investigation haslead to a more ambitious project known as the Canadian Cluster Comparison Project
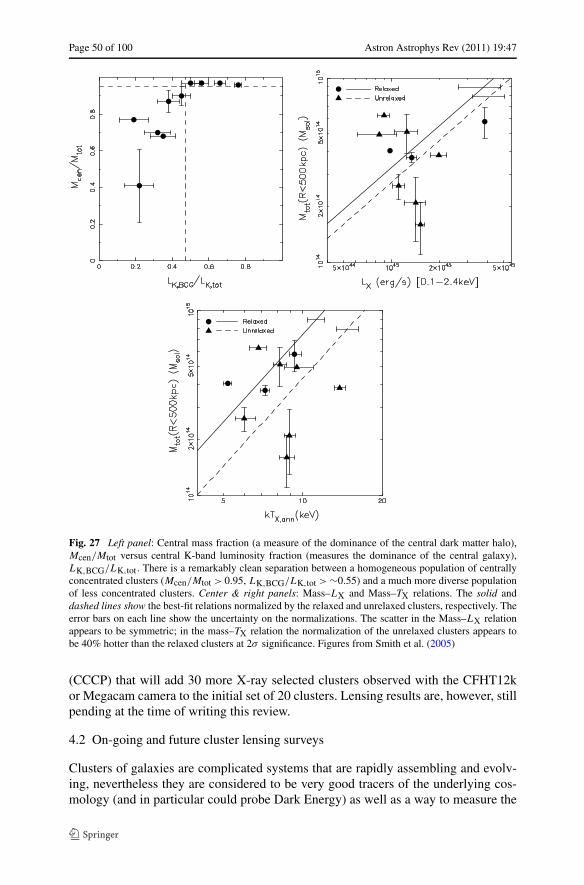
Page 50 of 100 Astron Astrophys Rev (2011) 19:47
Fig. 27 Left panel: Central mass fraction (a measure of the dominance of the central dark matter halo),Mcen/Mtot versus central K-band luminosity fraction (measures the dominance of the central galaxy),LK,BCG/LK,tot. There is a remarkably clean separation between a homogeneous population of centrallyconcentrated clusters (Mcen/Mtot > 0.95, LK,BCG/LK,tot > ∼0.55) and a much more diverse populationof less concentrated clusters. Center & right panels: Mass–LX and Mass–TX relations. The solid anddashed lines show the best-fit relations normalized by the relaxed and unrelaxed clusters, respectively. Theerror bars on each line show the uncertainty on the normalizations. The scatter in the Mass–LX relationappears to be symmetric; in the mass–TX relation the normalization of the unrelaxed clusters appears tobe 40% hotter than the relaxed clusters at 2σ significance. Figures from Smith et al. (2005)
(CCCP) that will add 30 more X-ray selected clusters observed with the CFHT12kor Megacam camera to the initial set of 20 clusters. Lensing results are, however, stillpending at the time of writing this review.
4.2 On-going and future cluster lensing surveys
Clusters of galaxies are complicated systems that are rapidly assembling and evolv-ing, nevertheless they are considered to be very good tracers of the underlying cos-mology (and in particular could probe Dark Energy) as well as a way to measure the

Astron Astrophys Rev (2011) 19:47 Page 51 of 100
Fig. 28 Left panel: Lensing 2D mass versus optical luminosity for the clusters in the Bardeau et al. (2007)sample (12 X-ray bright clusters selected to be at z ∼ 0.2). The lensing mass is computed at the virial radiusr200 derived from the best weak lensing fits. The luminosity is computed in the R band for the cluster redsequence galaxies. Dashed line represents a constant M/L ratio of 133 in solar units. The solid line is thebest-fit power law M ∝ L1.8. Center panel: Weak lensing 3D virial mass M200 versus X-ray luminosity.The best-fit line has a slope α = 1.20±0.16. Right panel: Weak lensing 3D virial mass M200 versus X-raytemperature. The straight line corresponds to a M200 ∝ T 3/2 relation while the dashed line correspondsto the best-fit power law relation M ∝ T 4.6±0.7. Temperatures are derived from XMM data (Zhang et al.2007), including A 2219 from ASCA data (Ota et al. 2004). The 4 clusters with cooling core or relaxedproperties are marked with empty boxes. (From Bardeau et al. 2007)
growth of structure, thus potentially sensitive to gravity and to the nature of DarkMatter. A better understanding of clusters will be possible only with larger clustersamples, as earlier work and conclusions therefrom were limited by statistics. Thenumber of massive clusters with published lensing data is steadily growing, as is thenumber of cosmological surveys in which clusters can be studied with strong and
Page 52 of 100 Astron Astrophys Rev (2011) 19:47
weak lensing techniques, either directly from the survey data or by further follow-ups.
Four techniques are avidly pursued to search for clusters:
• Photometric searches that use wide field imaging surveys such as the Sloan Dig-ital Sky Survey (SDSS), the Red-sequence Cluster Survey (RCS), and the CFHTLegacy Survey (CFHTLS). Furthermore, new photometric surveys have just startedor will start in the next year, namely the VST KIDS survey, the Dark Energy Survey(DES), and the Subaru Hyper-Suprime Camera (HSC) survey.
• X-ray selected cluster searches: (i) based on the follow-up of the ROSAT All SkySurvey: such as the MAssive Cluster Survey (MACS) (Ebeling et al. 2001) and theREFLEX survey (Boehringer et al. 2004) (ii) based on dedicated (or serendipitous)X-ray ROSAT or XMM imaging surveys such as: WARPS (Scharf et al. 1997),SHARC (Collins et al. 1997), the ROSAT Deep Cluster Survey (Rosati et al. 2001),XDCS (the XMM Deep Cluster Survey, see Fassbender et al. 2008), XCS (Romer2008); and XMM-LSS (Pierre et al. 2007).
• SZ searches: e.g. Atacama Cosmology Telescope Cluster Survey (Hincks et al.2010; Marriage et al. 2011; Hand et al. 2011), the South Pole Telescope ClusterSurvey (Chang et al. 2009; Vanderlinde et al. 2010; Plagge et al. 2010) and thePlanck mission (Ade et al. 2011).
• Weak and Strong lensing searches based on photometric surveys, or following upX-ray or SZ selected clusters.
We focus on the latter techniques in the following sub-sections.
4.3 Targeted cluster surveys
4.3.1 The Local Cluster Substructure Survey (LoCuSS)
LoCuSS extends Smith et al.’s (2005) pilot study of 10 X-ray luminous clusters atz = 0.2 to an order of magnitude larger sample at 0.15 < z < 0.3, drawn from theROSAT All-sky Survey Catalogues (Ebeling et al. 1998, 2000, 2004). The mainlensing-related goals of LoCuSS are to measure the mass, internal structure, and ther-modynamics of a complete volume-limited sample of 80 clusters observable fromMauna Kea, and thus to obtain definitive results on the mass-observable scaling re-lations at low redshift. The normalization, shape, scatter (and any structural segrega-tion detected) of these scaling relations will calibrate the properties of low-redshiftclusters as an input to cluster-based cosmology experiments, and to help interprethigh-redshift cluster samples.
To date LoCuSS has published weak lensing analysis of 30 clusters observed withSuprime-CAM on the Subaru 8.2-m telescope (Okabe et al. 2010; see also Oguriet al. 2010). The main results from this statistical study are that (i) a simple color-magnitude selection of background galaxies yields samples that are statistically con-sistent with negligible residual contamination by faint cluster members, albeit withlarge uncertainties, (ii) cluster density profiles are curved (in log–log space), and sta-tistically compatible with the Navarro et al. (1997) profile, and (iii) based on the NFWprofile model fits, the normalization of the mass-concentration relation of X-ray se-lected clusters is consistent with theoretical �CDM-based predictions, although the

Astron Astrophys Rev (2011) 19:47 Page 53 of 100
slope of the observed relation may be steeper than predicted. The last of these resultsis particularly interesting in the context of detailed studies of individual clusters se-lected to have a large Einstein radius. As noted in Sect. 7, such objects are often foundto have concentrations that exceed the CDM prediction by factors of 2–3 (Comerfordand Natarajan 2007; Oguri et al. 2009). Okabe et al.’s results from 30 X-ray-selectedclusters indicate that the large Einstein radius selection in earlier work introduces astrong bias.
Comparison of Okabe et al.’s weak lensing mass measurements with X-ray andSunyaev–Zel’dovich (SZ) effect probes has so far been limited by the presence ofoutlier clusters in the small samples for which the relevant data are available. Forexample, the well-known merging cluster A1914 strongly influences the results inthe X-ray/lensing comparison of 12 clusters for which Subaru and XMM-Newtondata are available (Okabe et al. 2010; Zhang et al. 2010). More recently, Marroneet al. (2011) presented the first weak-lensing-based mass-SZ scaling relation basedon Subaru and Sunyaev–Zel’dovich Array (SZA) observations of 18 clusters. Encour-agingly, this relation is consistent with self-similar predictions, although it presents20% scatter in natural log of mass at fixed integrated Y -parameter—a factor of 2 morescatter than found in studies that use X-ray data and assume hydrostatic equilibriumto infer cluster mass. Indeed, the normalization of the MWL–Y relation at � = 500(roughly 1 Mpc) for undisturbed clusters is 40% higher in mass than that for disturbedclusters. Marrone et al. identified several of the undisturbed clusters as likely prolatespheroids whose major axis is closely aligned with the line of sight as being largelyresponsible for this segregation. These results highlight the feasibility and growingmaturity of lensing-based studies of large cluster samples, and also emphasize thatmuch important work remains to be done to fully understand the optimal methods forcluster mass measurement.
4.3.2 The MAssive Cluster Survey
The MAssive Cluster Survey (MACS) is an on-going project aimed at the compila-tion and characterization of a statistically complete sample of very X-ray luminous(and thus, by inference, massive), distant clusters of galaxies. The primary goal ofMACS was to increase the number of known massive clusters at z > 0.3 from ahandful to a hundred. To achieve these goals, Ebeling et al. (2001) applied an X-rayflux and X-ray hardness-ratio cut to select distant cluster candidates from the ROSATBright Source catalog. Starting from a list of more than 5000 X-ray sources withinthe survey area of 22,735 square degrees they use positional cross-correlations withpublic catalogs of Galactic and extragalactic objects, with reference to APM colors,visual inspection of Digitized Sky Survey images, extensive CCD imaging, and fi-nally spectroscopic observations with the University of Hawaii’s 2.2-m and the Keck10-m telescopes to compile the final cluster sample. The MACS cluster sample com-prises 124 spectroscopically confirmed clusters at 0.3 < z < 0.7 (Fig. 29). Compre-hensive follow-up observations of MACS clusters include: weak lensing mass mea-surements using wide-field SUBARU imaging data, virial mass estimates based oncluster galaxy velocity dispersions measured with the CFHT and Keck, SZ obser-vations with the BIMA mm-wave radio interferometer, measurements of the clus-ter gas and temperature distribution with Chandra, and both deep, multi-passband

Page 54 of 100 Astron Astrophys Rev (2011) 19:47
Fig. 29 The luminosity versus redshift plot comparing the MACS surveys to a number of other X-raysurveys: EMSS, eBCS, WARPS, the 400 square degree survey. It is evident from this figure that MACS isvery efficient in selecting the most massive X-ray clusters at z > 0.3
and snapshot images with HST. A large number of MACS clusters are strong lensesand some of them have been studied in detail: MACS J1206-0847 (Ebeling et al.2009); MACS J1149.5+2223 (Smith et al. 2009); MACS J1423.8+2404 (Limousinet al. 2010; Morandi et al. 2010). MACS J0025.4-1222 (Bradac et al. 2008) was iden-tified as a merging cluster with some similarity to the “Bullet Cluster”. Zitrin et al.(2011a) presented the results of a strong lensing analysis of the complete sample ofthe 12 MACS clusters at z > 0.5 using HST images. The distribution of Einstein radiihas a median value of ∼28 arcseconds (for a source redshift of zS ∼ 2), twice as largeas other lower-z samples, making the MACS sample a truly massive cluster sampleconfirmed by the numerous strong lensing discoveries. One of the most extreme clus-ters known presently is likely MACS J0717.5+3745 (Ebeling et al. 2004) which wasrecognized as a complex merger of four individual substructures, with a long tailedfilamentary structure. The four sub-structures have all been identified in a recent lens-ing mass reconstruction by Limousin et al. (2011) and the filamentary structure wasdirectly measured by weak lensing measurements with a 18-pointing HST mosaic(Jauzac et al. 2011). Horesh et al. (2010), investigated the statistics of strong lensedarcs in the X-ray selected MACS clusters versus the optically selected RCS clusters(see below). They measured the lensed-arc statistics of 97 clusters imaged with HST,identifying lensed arcs using two automated arc-detection algorithms. They compilea catalog of 42 arcs in MACS and seven arcs in the RCS. At 0.3 < z < 0.7, MACSclusters have a significantly higher mean frequency of arcs, 1.2 ± 0.2 per cluster, ver-sus 0.2 ± 0.1 in RCS, which can easily be explained by the nature of the selection ofthese two different cluster samples.
Astron Astrophys Rev (2011) 19:47 Page 55 of 100
4.3.3 ESO distant cluster survey
Nevertheless, optical selection is still common specially for high-redshift clusters(z > 0.6) where X-ray selection is limited. A particular focused and productive surveyis the ESO distant cluster survey (EDiSC, White et al. 2005). EDiSC is a survey of 20fields containing distant galaxy clusters (0.4 < z < 1.0) chosen amongst the brightestobjects identified in the Las Campanas Distant Cluster Survey. They were confirmedby identifying red sequences in moderately deep two color data from VLT/FORS2,and further investigations with VLT in spectroscopy, the ESO Wide Field Imager,and HST/ACS mosaic images for 10 of the most distant clusters. Using the deepVLT/FORS2 data, Clowe et al. (2006) measured the masses for the EDiSC clusters.In particular, they compared the mass measurements of 13 of the EDiSC clusters withluminosity measurements from cluster galaxies selected using photometric redshiftsand find evidence of a dependence of the cluster mass-to-light ratio with redshift.
4.3.4 Red-sequence cluster surveys
Another important optically selected cluster survey is the 100 deg2 Red-SequenceCluster Survey (RCS, Gladders 2002, Gladders and Yee 2005) and its 1000 deg2
RCS-2 extension (Gilbank et al. 2011), which are based on shallow multi-colorimaging with the CFHT12k and Megacam cameras. RCS-2 covers ∼1000 deg2
and includes the first RCS area, it reaches 5σ point-source limiting magnitudes in[g, r, i, z] = [24.4,24.3,23.7,22.8], approximately 1–2 magnitudes deeper than theSDSS. RCS-2 is designed to detect clusters over the redshift range 0.1 < z < 1, build-ing a statistically complete, large (∼104) sample of clusters, covering a sufficientlylong redshift baseline to be able to place constraints on cosmological parametersprobed via the evolution of the cluster mass function. Furthermore, a large sampleof strongly lensed arcs associated with these clusters has been derived (e.g. Gladderset al. 2002, 2003), and weak lensing measurements from the most massive clustersdetected in RCS-2 is likely possible.
4.3.5 The Multi-Cluster Treasury: CLASH survey
The recently approved MCT (Multi-Cluster Treasury) program on HST will achievemulti-band imaging of a sample of 25 X-ray selected clusters (Postman et al. 2011),thus providing detailed photometric-redshift estimates for multiple images. This sam-ple with appropriate ground based follow-up is likely to provide important insightsinto many of the current unsolved problems in cluster assembly and evolution. Ded-icated lensing studies will enable detailed investigation of their mass distributions(Zitrin et al. 2011b, 2011c) and will help find some efficient lenses that can beexploited to study the distant Universe by using them as gravitational telescopes(Richard et al. 2011)—a topic that will be discussed further in the next section.
4.4 Cluster lenses in wide cosmological surveys
The previous sub-section focused on targeted cluster surveys. However, cluster lensescan also be found in wide cosmological surveys (e.g. Wittman et al. 2001, 2003;Hamana et al. 2004; Maturi et al. 2005). We briefly outline some of the most repre-sentative surveys of this decade starting from the widest to the deepest.

Page 56 of 100 Astron Astrophys Rev (2011) 19:47
4.4.1 The Sloan Digital Sky Survey
The Sloan Digital Sky Survey (SDSS) is an imaging and spectroscopic survey cov-ering 10,000 deg2 (Aihara et al. 2011). Although this survey was not designed oroptimized to measure cluster lensing, interesting results have been produced fromdetected strong and weak lensing measurements of clusters. Estrada et al. (2007) in-vestigated the Sloan images of 825 SDSS galaxy clusters searching for giant arcs.Both a visual inspection of the images and an automated search were performed, andno arcs were found. They nevertheless report a serendipitous discovery of a bright arcin the Sloan images of an as yet unknown cluster. Hennawi et al. (2008) presentedthe first results of a strong lensing imaging survey (using the WIYN and UH 2 mtelescope) targeting the richest clusters (with 0.1 < z < 0.6) selected from SDSS.From a total of 240 clusters followed-up, they uncovered 16 new lensing clusterswith definite giant arcs, 12 systems for which the lensing interpretation is very likely,and 9 possible lenses which contain shorter arclets or candidate arcs which requirefurther observations to confirm their lensing origin. The new lenses discovered inthis survey will enable future systematic studies of the statistics of strong lensingand their implications for cosmology and the current structure formation paradigm.Kubo et al. (2009) and then Diehl et al. (2009) identified 10 strongly lensed galaxiesas part of the “Sloan Bright Arcs Survey”. Follow-up imaging identified the lensingsystems as group-scale lenses, an intermediate regime between isolated galaxies andgalaxy clusters (see Cabanac et al. 2007). Bayliss et al. (2011) presented the resultsfrom a spectroscopic program targeting 26 strong lensing clusters (0.2 < z < 0.65)visually identified in SDSS or RCS-2 revealing 69 unique background sources withredshifts as high as z = 5.2, which will enable robust strong lensing mass models tobe constructed for these clusters (some of the most remarkable clusters discoveredare presented in Fig. 30).
On the weak lensing side, the first measurements were conducted by Sheldon et al.(2001). Later on Rykoff et al. (2008) measured the scaling relation between X-rayluminosity and the total mass for 17,000 galaxy clusters in the SDSS maxBCG clustersample. To achieve this, they stacked sub-samples of clusters within fixed ranges ofoptical richness, and they measured the mean X-ray luminosity LX, and the weaklensing mean mass, 〈M200〉. For rich clusters, they found a power law correlationbetween LX and M200 with a slope compatible with previous estimates based on X-ray selected catalogs. Furthermore, Rozo et al. (2010) used the abundance and weaklensing mass measurements of the SDSS maxBCG cluster catalog to simultaneouslyconstrain cosmology and the cluster richness-mass relation. Assuming a flat �CDMcosmology, they found that σ8(Ωm/0.25)0.41 = 0.832 ± 0.033. These constraints arefully consistent with those derived from WMAP five-year data. With this remarkableconsistency they claim that optically selected cluster samples may produce precisionconstraints on cosmological parameters in future wide-field imaging cosmologicalsurveys.
4.4.2 The CFHT-legacy survey
Soon after the first light of the Megacam camera at CFHT, a legacy survey (LS) wasstarted. It comprises a deep u,g, r, i, z (i ∼ 27.5) survey of 4 square degrees in four

Astron Astrophys Rev (2011) 19:47 Page 57 of 100
Fig. 30 SDSS discovered strong lensing clusters—(a) Abell 1703, (b) SDSS J1446+3033, (c) SDSSJ1531+3414, and (d) SDSS J2111-0114. Color composite images are made from g, r, i imaging obtainedwith Subaru/SuprimeCam. All images are 75′′ × 75′′ . Background sources are bracketed by red lines andlabeled. Source labels with the same letter but different numbers (e.g. A1, A2, etc.) have the same redshiftsto within the measurement errors, and are presumed to be the same source, multiply imaged (figure fromBayliss et al. 2011)
independent fields spread across the sky, and a wide synoptic u,g, r, i, z (i ∼ 24.5)survey of 170 square degrees in four patches of 25 to 72 square degrees. Due to theexcellent seeing delivered by CFHT, the Legacy Survey has lead to intensive strongand weak lensing studies.
In particular, Cabanac et al. (2007) have searched for strong lensing arcs and Ein-stein rings around galaxies in both the deep and wide part of the CFHT-LS. Most ofthe systems uncovered have deflection angles ranging between 2 and 15 arcseconds.Such samples have thus uncovered a large population of strong lenses from galaxygroups with typical halo masses of about 1013h−1 M�. The 13 most massive sys-tems have been studied in detail by Limousin et al. (2009), and detailed analysis ofthe mass distribution on small and large scales has been investigated by Suyu andHalkola (2010) and Limousin et al. (2010), respectively. A weak lensing search forgalaxy clusters in the 4 square degrees of the 4 CFHT-LS deep fields was performedand results are presented in Gavazzi and Soucail (2007). Using deep i-band imagesthey performed weak lensing mass reconstructions and identified high convergencepeaks. They used galaxy photometric redshifts to improve the weak lensing analysis.Among the 14 peaks found above 3.5σ , nine were considered as secure detections

Page 58 of 100 Astron Astrophys Rev (2011) 19:47
upon cross-correlation studies with optical and X-ray catalogs. Berge et al. (2008)conducted a joint weak lensing and X-ray analysis of (only) 4 square degrees from theCFHTLS and XMM-LSS surveys. They identified six weak-lensing-detected clustersof galaxies, and showed that their counts can be used to constrain the power-spectrumnormalization σ8 = 0.92+0.26
−0.30 for Ωm = 0.24. They showed that deep surveys shouldbe dedicated to the study of the physics of clusters and groups of galaxies, and widesurveys are preferred for the measurement of cosmological parameters. A first cata-logue of lensing selected cluster has been recently published by Shan et al. (2011)on the CFHT-LS W1 field. They perform a weak lensing mass map reconstructionand identify high signal-to-noise ratio convergence peaks, which were then corre-lated with the optically selected cluster catalogue of Thanjavur et al. (2011). Theythen used tomographic techniques to validate their most significant detections andestimate a tomographic redshift. More weak lensing cluster analyses are expected tobe published from CFHT-LS in the near future.
4.4.3 The COSMOS survey
With only 2 square degrees the COSMOS Survey focused on the relatively high-redshift Universe. Due to the relatively small volume probed, COSMOS is unlikelyto find the most massive structures in the Universe, but it has delivered interestingconstraints on the redshift evolution of clusters and the scaling relations betweenobservables. Thanks to the deep X-ray observation of COSMOS fields, clusters canbe efficiently selected in principle out to z ∼ 2. Taking advantage of the X-ray se-lected catalog, Leauthaud et al. (2010) have investigated the scaling relation betweenX-ray luminosity (LX) and the weak lensing halo mass (M200) for about 200 X-ray-selected galaxy groups. Weak lensing profiles and halo masses were derived fornine sub-samples, narrowly binned in luminosity and redshift. The COSMOS dataalone are well fit by a power law, M200 ∝ Lα
X, with a slope α = 0.66 ± 0.14. Theseobservations significantly extend the dynamic range for which the halo masses ofX-ray-selected structures have been measured with weak gravitational lensing asshown in Fig. 31. Combining with other measurements demonstrates that the M–LX relation is well described by a single power law with α = 0.64 ± 0.03, over twodecades in mass: M200 ∼ 1013.5–1015.5h−1
72 M�. These results confirm that clustersdo not follow the self-similar evolution model with α = 0.75 proposed by Kaiser(1986).
5 Cluster lenses as nature’s telescopes
5.1 Magnification due to gravitational lensing
Cluster lenses magnify and distort the shapes of distant galaxies that lie behind them.For strong lensing clusters, the amplification factor can in principle be infinite if thesource is compact enough and is located exactly behind the caustic, of course such anevent is infinitely rare! Nevertheless, in several strong lensing clusters, amplificationfactors larger than 40× (∼4 magnitudes) have been measured (Seitz et al. 1998), and

Astron Astrophys Rev (2011) 19:47 Page 59 of 100
Fig. 31 The COSMOS M–LX relation from Leauthaud et al. (2010). Dark blue diamonds show individu-ally detected clusters from Hoekstra et al. (2006) with updated masses from Madhavi et al. (2008). Siennacross symbols show data points from Bardeau et al. (2007). Light blue plus symbols represent the Rykoffet al. (2008) results from a stacked analysis in the SDSS and black diamonds take into account a recentcorrection to these masses due to a new calibration of the source distribution. The upper error bars havebeen adjusted to account for the redshift uncertainty. Green asterisks show four data points at intermediatemasses from Berge et al. (2008). Finally, the red squares depict our COSMOS results which extend previ-ous results to lower masses and to higher redshifts. Three arrows highlight the highest redshift COSMOSdata points. The grey shaded region shows the upper and lower envelope of the ensemble of lines with aslope and intercept that lie within the 68 percent confidence region
in fact, amplification factors larger than 4× (∼1.5 magnitudes) are quite common(Richard et al. 2011). It is thus not surprising that “Cluster Lenses” are often referredto as “Nature’s Telescopes” or “Cosmic Telescopes” and have been rather effectivelyused to discover and study the most distant galaxies that lie behind them.
The regions with the largest magnification are the regions closest to the criticallines in the image plane (typically less than 1 square arcminute), and closest to thecaustic line in the source plane (typically a few tens to hundreds square arcsecond).The cross section for high amplification will vary from cluster to cluster and de-pends on the detailed mass distribution. To first order, the cross-section scales withthe square of the Einstein radius as well as with the ellipticity or anisotropy of theprojected mass distribution on the sky.
As the magnification is wavelength independent, the benefit of using cluster lensesas cosmic telescopes has been exploited at various wavelengths, from X-ray to theradio domain. Lensing clusters were first used as cosmic telescopes in the opti-cal/NIR domain, where a large population of the most distant galaxies (at theirtime of discovery) were found behind these cluster magnified regions (e.g. Yeeet al. 1996; Franx et al. 1997; Ellis et al. 2001; Hu et al. 2002; Kneib et al. 2004;Richard et al. 2011). Lensing clusters were also used at longer wavelengths in sub-

Page 60 of 100 Astron Astrophys Rev (2011) 19:47
millimeter using SCUBA at JCMT (e.g. Smail et al. 1998) and in the mid-infrareddomain using the ESA ISO space telescope (Altieri et al. 1999; Metcalfe et al. 2003;Coia et al. 2005a, 2005b) and now in the far-infrared using the Herschel space obser-vatory (Egami et al. 2010; Altieri et al. 2010).
There are two important and unprecedented advantages that cluster lenses offer ascosmic telescopes as they provide the largest field of view with high magnification:
• the potential discovery of the most distant objects and low-luminosity objects thatwould otherwise remain undetected with similar blank field imaging,
• the possibility to study the morphology of distant galaxies which otherwise wouldnot be resolved and explore their physical properties that would otherwise be im-possible to characterize.
Furthermore, we note that as cluster lenses magnify they also distort the shapesof distant galaxies. In general, the further the sources, the stronger the distortions.Hence to first order, the shape of a lensed galaxy (assuming it can be resolved), andwhether it is multiply imaged or not, can be used as a good distance indicator.
5.2 Cosmic telescope surveys
Rather similar to other galaxy surveys two distinct observational strategies that trade-off depth with area have been explored thus far:
(1) deep mapping (in imaging or spectroscopy) of a few well modeled lensing clus-ters to search for distant lensed sources—this allows us to probe down the lumi-nosity function of the targeted distant source population,
(2) shallow mapping on a large cluster sample to search for rare highly magni-fied background sources (e.g. Fig. 32), with the idea to thereafter conduct de-tailed follow-up observations of these sources benefiting from the high amplifica-tion/magnification to constrain important physical and morphological propertiesof high-redshift sources (e.g. Lemoine-Busserolle et al. 2003).
As the strong magnification region covers typically at most about a few squarearcminutes, surveys through cluster lenses are particularly adapted to those instru-ments/telescopes that have an instantaneous field of view comparable to the stronglensing region. The HST cameras are particularly well matched to cluster strong lens-ing regions and are thus very well adapted to use for the search and study of distantsources. Incidentally, this was also the case for the SCUBA instrument on JCMT, aswell as the ISOCAM on the ISO space mission. In the near future ALMA, MUSE(the one square arcminute integral field unit on the VLT), and the forthcoming JWSTinstruments are all facilities that will most effectively exploit lensing magnification.
Of course when conducting a detailed follow-up study of highly magnifiedsources, the most effective instruments are high-resolution imagers and spectro-graphs. In particular, because of the extended nature of the most amplified sources,integral field spectrographs are more adapted compared to long-slit instruments, andit is thus natural to conduct follow-up studies with instruments such as SINFONI onVLT or OSIRIS on Keck for the extremely magnified, rare, lensed sources.
Finally, an other particular observation strategy of cosmic telescope is that of “crit-ical line mapping”. In this case, one specifically targets regions near the critical lines

Astron Astrophys Rev (2011) 19:47 Page 61 of 100
Fig. 32 Newly discovered giant arcs or multiple images as part at the SNAPSHOT HST observations(PI. H. Ebeling) of the MACS cluster sample. These images show the diversity of morphology for theseserendipitously discovered strongly lensed galaxies (figure is from Richard et al. private communication)
using dedicated instruments such as a long-slit spectrograph (e.g. Santos et al. 2004;Stark et al. 2007), an integral field spectrograph (Clement et al. 2011) or a millimeterwave interferometer to blindly probe the distant Universe. In this case the effectivefield of view of the instrument is small compared to the critical region, thus requiringa mapping strategy to cover the region with the highest amplification.
5.3 “Lens redshift” measurement
As lensing distortion and magnification are a function of the redshift of the back-ground sources, once a cluster mass distribution is well known, the lens model can

Page 62 of 100 Astron Astrophys Rev (2011) 19:47
be used to predict the redshifts for the newly identified multiple systems (e.g. Kneibet al. 1993; Natarajan et al. 1998; Ellis et al. 2001) as well as for the arclets (Kneibet al. 1994, 1996).
For multiple-image systems, the relative positions of the different images is astrong function of the redshift of the background source. Although the redshift sen-sitivity decreases with the redshift of the background source (because the DLS/DSvariation is smaller with increasing redshift) it can nevertheless be used to easilydistinguish between low- and high-redshift solution. In this respect, one can eas-ily discriminate z ∼ 1–2 obscured galaxies from z > 4 high-redshift lensed galax-ies, and this property has been used many times very effectively (Ellis et al. 2001;Kneib et al. 2004; Richard et al. 2008, 2011). For the arclets, the redshift predictionis based on the fact that on average a distant galaxy is randomly orientated, and itsellipticity follows a relatively peaked ellipticity distribution (σε ∼ 0.25). Hence, byconducting high-resolution imaging (e.g. with Hubble), and by measuring the ellip-ticity and orientation of the background lensed sources in the core of massive clusterlenses, one can statistically derive the redshift distribution of the background lensedpopulation. Such measurements were first introduced by Kneib et al. (1993), and de-veloped further in Kneib et al. (1996). These predictions were tested and verifiedby Ebbels et al. (1998) using spectroscopy in the case of the lensing cluster Abell2218. Despite the successful demonstration of the technique, it never became pop-ular due to the following limitations. First, the derived probability distribution p(z)
distribution is relatively broad, particularly, at high redshift. Therefore the method isnot really competitive with photometric-redshift determinations, except may be fordisentangling catastrophic photometric redshifts. Second, the cluster galaxy contam-ination is high in the optical/near-infrared domain and statistical estimates alwayshave limited utility. Third, galaxy sizes decrease rapidly with redshift, and accuratemeasurement of the galaxy shape can only be done efficiently with deep Hubbleimaging yet again limiting the use of this technique. Finally, as there are many othergood science drivers to obtain multi-band information on these massive clusters, andas photometric-redshift determination methods are rapidly improving, the statisticallens redshift measurements never became attractive and/or popular.
5.4 Lensing surveys in the sub-millimeter
The SCUBA (the JCMT Submillimeter Common-User Bolometer Array) Lensingsurvey was likely one of the first systematic surveys to exploit distant lensed galaxiesusing massive clusters. This survey first started with the mapping of two massiveclusters: Abell 370 at z = 0.37 and Cl 2244-02 at z = 0.33 (Smail et al. 1997) andcontinued to map the region behind five similarly massive clusters covering a totalarea of 0.01 square degree (Smail et al. 1998). Each SCUBA continuum map fromthis cluster lens survey covered a total area of about 5 square arcminutes to 1σ noiselevels less than 14 mJy/beam and 2 mJy/beam at 450 and 850 micron wavelengths,respectively.
Since SCUBA was a new instrument that achieved a sensitivity 2–3 orders ofmagnitude deeper than was previously possible and thanks to the cluster magnifica-tion, Smail et al. (1997) were the first to find the distant sub-millimeter (sub-mm)

Astron Astrophys Rev (2011) 19:47 Page 63 of 100
selected galaxy population. In total 17 sources brighter than the 50% completenesslimits (10 brighter than the 80% limit) were discovered (Smail et al. 1998). The sub-millimeter spectral properties of these first sources indicated that the majority lieat high redshift (1 < z < 5.5), which was confirmed later with redshift measure-ments. Measured redshifts for a large number of these sub-mm-selected galaxiesplaced the bulk of this population at z ∼ 2.5 (Ivison et al. 1998; Barger et al. 2002;Chapman et al. 2005).
The use of cluster lenses in the case of the sub-millimeter high-redshift searcheswas strongly motivated by the fact that cluster galaxy members are not sub-millimetersources and are therefore transparent at this wavelength, making clusters perfect tele-scopes to preferentially probe the distant galaxy population (Blain 1997). Impor-tantly, the use of cluster lenses increases the sensitivity of sub-mm maps and reducesthe effects of source confusion (which plagues bolometer surveys in sub-mm andmm wavelengths) due to the dilution produced by lensing clusters. With accuratelens models Blain (1998) first corrected the observed sub-mm source counts for lens-ing amplification using the SCUBA lensing survey data on the first seven clusters,thus pushing the 850 micron counts down below the SCUBA confusion limit; forexample at 1 mJy, 7900 ± 3000 galaxies per square degree were found. Down to the0.5 mJy limit, the resolved 850 micron background radiation intensity was measuredto be (5 ± 2) × 10−10 W m−2 sr−1, comparable to the current COBE estimate of thebackground, indicating for the first time that the bulk of the 850 micron backgroundradiation is effectively produced by distant ultra-luminous galaxies. These first sub-mm galaxy counts were confirmed later with a larger sample of clusters mapped bySCUBA (Cowie et al. 2002; Knudsen et al. 2008) reaching a lens-corrected flux limitof 0.1 mJy. The first sub-mm multiple images were found in Abell 2218 (Kneib et al.2004) and MS0451-03 (Borys et al. 2004) identified at z = 2.516 and z ∼ 2.9, respec-tively. In particular, the source SMM J16359+6612 is gravitationally lensed by Abell2218 into three discrete images with a total amplification factor of ∼45, implying thatthis galaxy has an unlensed 850-micron flux density of only 0.8 mJy. Furthermore,SMM J16359+6612 shows a complex morphology with three sub-components argu-ing for either a strong dust (lane) absorption or a merger. Interestingly, these sub-mmsources are surrounded by two other highly amplified galaxies at almost identicalredshifts within a ∼100-kpc region suggesting this sub-mm galaxy is located in adense high-redshift group (see Fig. 33). Further mapping at the IRAM Plateau deBure interferometer indicated that this source is a compact merger of two typicalLyman-break galaxies with a maximal separation between the two nuclei of about3 kpc, thus it bears a close similarity to comparable luminosity, dusty starbursts thatresult from lower-mass mergers in the local Universe.
However, the most spectacular lensed sub-mm galaxy is certainly the recently dis-covered SMMJ2135-0102 at redshift z = 2.3259 that is gravitationally magnified bya factor of 32 by the massive cluster MACSJ2135-010217 (Swinbank et al. 2010;Fig. 34). This large magnification, when combined with high-resolution sub-mmimaging, resolves the star-forming regions at a linear scale of just ∼100 parsec. Theluminosity densities of these star-forming regions are comparable to the dense coresof giant molecular clouds in the local Universe, but they are ∼100× larger and 107
times more luminous. The star formation processes at z ∼ 2 in this vigorously star-

Page 64 of 100 Astron Astrophys Rev (2011) 19:47
Fig. 33 (Left) A true-color image of the core of A 2218 (blue: HST F450W, green: HST F814W and red:WHT/INGRID Ks). The 850 µm sub-mm image from SCUBA is overlayed as white contours. The threeimages of the multiply imaged sub-mm galaxy are annotated as A, B and C. The sub-mm contour at thetop left corresponds to a z = 4.04 sub-mm galaxy discussed in Knudsen et al. (2010). Two other galaxiesat z ∼ 2.5, are identified: the single-image #273 and the fold-image #384 and its counter image #468. Theyellow line shows the critical line at z = 2.515. (Right) Panel of 10′′ × 10′′ images showing the INGRIDKs-band (left column) and HST true-color image from F450W/F606W/F814W (right column) of the foursub-mm sources in the core of A 2218. Note how each of the sub-mm sources, SMM J16359+6612.6,SMM J16359+6612.4 and SMM J16358+6612.1, comprises a NIR source (γ ) which is bracketed by twofeatures in the F814W image (α and β). (From Kneib et al. 2004)
forming galaxy appear to be similar to those seen in local galaxies even though theenergetics are unlike anything found in the present-day Universe.
In the sub-mm domain, lensing has proven to be truly useful in revealing detailsabout high-redshift sources that would otherwise be impossible, even with the nextgeneration of large aperture telescopes.
5.5 Mid-infrared lensing survey
In the late 1990s, the ISOCAM camera on the ESA Infrared Space Observatory (ISO)targeted a number of massive cluster lenses. The motivation for these observationswas to probe the faint and distant Mid-Infrared galaxy population and their contri-bution to the cosmic mid-infrared background radiation. In particular a few well-known massive cluster lenses were imaged deeply by ISO at 7 and 15 micron. Thedeepest ISO observation of a cluster targeted Abell 2390 (Altieri et al. 1999). Cross-identification of the numerous mid-infrared sources with optical and near-infrareddata showed that almost all 15 micron sources were identified as lensed distant galax-ies. These observations allowed the computation of number counts in both the 7 and15 micron bands and led to the ruling out of non-evolutionary models, and favoring

Astron Astrophys Rev (2011) 19:47 Page 65 of 100
Fig. 34 (Left) Hubble Space Telescope V, I -band color image of MACSJ2135-010217 with white con-tours denoting the 870 micron emission of SMMJ2135-0102 with flux 106.0 ± 7.0 mJy as observed byAPEX/LABOCA. The optical counterpart is faint with IAB = 23.6 ± 0.2. The solid red lines denote thez = 2.326 radial and tangential critical curves from the best-fit lens model. (Center) True color IRAC3.6, 4.5, 8.0 micron image of the cluster core with contours denoting the 350 micron emission fromAPEX/LABOCA. The mid-infrared counterpart is clearly visible as an extended red galaxy centered atthe sub-mm position. (Right) SMA 870 micron image of the galaxy. The map shows eight individual com-ponents, separated by up to 4′′ in projection. The red line is the same z = 2.326 radial critical curve.Components (A, B, C, D) represent two mirror images of the galaxy, each comprising four separate emis-sion regions reflected about the lensing critical curve. Figure from Swinbank et al. (2010)
very strong number count evolution. By combining the data on three massive clus-ters (Abell 370, Abell 2218 and Abell 2390), Metcalfe et al. (2003) detected a totalof 145 mid-infrared sources, and after a very careful lensing correction derived theintrinsic counts of the background source population. It was found that roughly 70%of the 15 micron sources are lensed background galaxies. Of sources detected onlyat 7 micron, 95% are cluster galaxies in this sample. Of the 15 sub-mm sources al-ready identified within the mapped regions of the three clusters, 7 were detected at15 micron. Flux selected subsets of the field sources above the 80% and 50% com-pleteness limits were used to derive source counts to a lensing corrected sensitivitylevel of 30 micro-Jy at 15 micron, and 14 micro-Jy at 7 micron. The source counts,corrected for the effects of completeness, contamination by cluster sources and lens-ing, confirmed and extended earlier findings of an excess by a factor of ten in the 15micron population with respect to source models with no evolution, with a redshiftdistribution that spans between z = 0.4 and z = 1.5.
5.6 Lensed extremely red objects
The benefits of lensing have also been used to search for Extremely Red Objects(EROs) behind a sample of 10 X-ray luminous galaxy clusters (Smith et al. 2002a,2002b) imaged by both the WFPC2 camera (using F702W filter) and UKIRT in theK-band. EROs are galaxies with R −K > 5.3 as defined by Daddi et al. (2000) as thecriterion to select distant elliptical galaxies. The other more stringent definition withR − K > 6 was adopted by Thompson et al. (1999). In these clusters a total of about60 EROs have been identified so far allowing the number counts of these rare objectsto be computed down to about 2 magnitudes fainter than previous work published atthat time. The exploitation of the lensing effect has also permitted a more accurate

Page 66 of 100 Astron Astrophys Rev (2011) 19:47
Fig. 35 True color R,K view(50′′ × 50′′) of the Abell 68cluster core (combining HSTand near-infrared UKIRT data).The bright elliptical galaxy inthe center of the frame is thecentral galaxy of the cluster.Three images of ERO J003707are clearly visible and aremarked as A, B and C. Eachimage comprises a central red“bulge”, surrounded bynumerous fainter blue knots ofcurrent or recent star formation(from Smith et al. 2002a)
study of the morphology of these peculiar galaxies, revealing in some cases spectacu-lar disky components already in place at fairly early times (Fig. 35). In particular, forthe case of the multiply imaged ERO J003707, morphological and photometric anal-yses reveal an L∗ early-type disk-galaxy. It has been estimated that ∼10% of EROswith R − K > 5.3 and K < 21 have similar properties. The unique association ofpassive EROs with elliptical galaxies therefore appears to be too simplistic and hasbeen reconsidered. More recent work on searching for lensed EROs was conducted inA1835 and AC114 (Schaerer et al. 2007) taking advantage of complete wavelengthcoverage including HST, ground based and Spitzer data. They found in these obser-vations that most of the EROs were, in fact, young dusty starbursts at z ∼ 2–3.
5.7 Lensed Lyman-α emitters
One of the exciting current ventures is to map the critical region of massive clusters(Fig. 36) in order to search for Lyman-alpha emitters at very high redshifts (z > 4),compute their number density, derive their luminosity function and therefore charac-terize this population. By pushing to very high redshift z > 7 one should get closerto re-ionization, and the increase in neutral gas content of the Universe should blockLyman-α photons. Thus at some point one should expect a strong evolution of theLyman-α emitter luminosity function. Two approaches have been pursued in thesearch for Lyman-α emitters, a direct search through intense spectroscopy, and anindirect one that relies on conducting narrow-band imaging searches in which thewavelength range is tuned to probe a specific redshift window.

Astron Astrophys Rev (2011) 19:47 Page 67 of 100
Fig. 36 The high magnification critical region in the core of the massive cluster Abell 1689. Red lines arethe critical line for z = 7 (both radial and tangential lines are shown) and the yellow contours delimit theregions of the sky having a magnification larger than a factor of ten
5.7.1 Spectroscopic critical line mapping
The first dedicated critical line mapping using spectroscopy was conducted at Keck,using the long-slit mode of LRIS (Sand et al. 2004). Nine intermediate redshift, mas-sive clusters with good lensing mass models were carefully selected, and a num-ber of long-slit observations was conducted, sliding the long slit across the criticalline region thus achieving magnification factors generally greater than 10. Elevenemission-line candidates were located in the range 2.2 < z < 5.6 with Lyman-α asthe line identification. The selection function of the survey takes into account thevarying intrinsic Lyman-α line sensitivity as a function of wavelength and sky posi-tion. By virtue of the strong magnification factor, these measurements provide con-straints on the Lyman-α luminosity function to unprecedented limits of 1040 erg/s,corresponding to a star formation rate of 0.01 M�/yr. Combining these lensing re-sults with other surveys, limited to higher luminosities, Sand et al. (2004) argue thatthere exists evidence for the suppression of star formation in low-mass halos, as pre-dicted in popular models of galaxy formation. The highest redshift Lyman-α emitterdiscovered in this survey is the z = 5.576 pair in the cluster Abell 2218 (Ellis et al.2001). High-resolution spectroscopic follow-up confirmed the lensing hypothesis ofthe LRIS discovery by identifying the second image. The unlensed source appears tobe a very faint source with (I ∼ 30) and is compact in nature (<150h−1
65 pc). Thissource is a promising candidate for an isolated ∼106 M� system seen likely produc-ing its first generation of stars close to the epoch of re-ionization.

Page 68 of 100 Astron Astrophys Rev (2011) 19:47
Pushing to higher redshifts than z > 7 requires an infrared spectrograph. In a chal-lenging experiment, Stark et al. (2007) blindly surveyed the critical line region ofnine massive clusters using the Keck/NIRSPEC long slit. The magnification boostranges from 10 to 50× for a background galaxy between ∼8 < z < ∼10, thus pushingthe sensitivity limits to unprecedented low fluxes (1041–1042 erg/s) for this redshiftrange. This survey identified six promising (>5 σ ) candidate Lyman-α emitters thatlie between z = 8.7 and z = 10.2. Lower redshift line interpretations were mostlyexcluded through the non-detection of secondary emission in further spectroscopyundertaken with LRIS and NIRSPEC. Nonetheless, it is considered plausible thatat least two of the candidates are likely at z ∼ 9. If true, then given the small vol-ume surveyed, this suggests there is an abundance of low-luminosity star-formingsources at z ∼ 8–10, which could provide a significant proportion of the UV pho-tons necessary for cosmic re-ionization. A parallel study was conducted using theSINFONI 3D spectrograph at VLT, and three of the Keck/NIRSPEC candidates werere-observed—as part of the SINFONI critical line mapping program. However, noconfirmation of the Keck/NIRSPEC detected lines was found, casting some doubton the real redshifts of these particular sources. The results of this survey are pre-sented in Clement et al. (2011). Future 8–10 m class instruments such as MUSE inthe visible and MOSFIRE, KMOS and EMIR in the near infrared should, thanks totheir higher multiplexing, provide new opportunities to further conduct critical linesurveys and find more robustly numerous high-redshift Lyman-α emitters.
5.7.2 Narrow-band searches
An alternative to direct spectroscopy of Lyman-α emitters, is to conduct narrow-band imaging. Although this technique has been very popular in blank fields, onlya few such observations have been conducted in the direction of cluster cores. Huet al. (2002) have discovered a redshift z = 6.56 galaxy lying behind the clusterAbell 370 (Fig. 37). The object nicknamed HCM-6A was found in a narrow-bandimaging survey using a 118 Å bandpass filter centered at 9152 Å using LRIS onthe Keck telescope. At the time of discovery, HCM-6A was the first galaxy to beconfirmed at redshift z > 6 (its observed equivalent width is 190 Å, with a flux of2.7 × 10−17 erg/cm2/s). Using the detailed lensing model of this cluster, a lensingamplification factor of 4.5 was estimated as the source is situated about 1 arcminuteaway from the cluster center. This discovery suggested that the re-ionizing epoch ofthe Universe lies beyond z ∼ 6.6. Follow-up of this source with Spitzer (Chary et al.2005) and in millimeter with MAMBO-2 (Boone et al. 2007, which provided an up-per limit at 1.2 mm) have helped derive some physical parameters with relativelyhigh accuracy considering the distance of this source. Even more ambitious was thenarrow J-band filter NB119 survey (corresponding to Lyman-α at z ∼ 9) nicknamedthe ‘z equals nine’ (ZEN) survey conducted toward three massive lensing clusters:Abell clusters A1689, A1835 and AC114 (Willis et al. 2008). However, no sourcesconsistent with a narrow-band excess were found and no detection in bluer deep opti-cal was reported. The total coverage of the ZEN survey sampled a volume at z ∼ 9 ofapproximately 1700 co-moving Mpc3 to a Ly-α emission luminosity of 1043 erg/s.The limits from this survey still offer the best constraints at this redshift.

Astron Astrophys Rev (2011) 19:47 Page 69 of 100
Fig. 37 HST (ACS+WFC3) color V, I, J view of the HCM-6A z = 6.56 Lyman-α emitter located nearthe core of the Abell 370 cluster. Note the strong detection in the F110W (J-band) filter and its bimodallight distribution. The region shown covers 60′′ × 20′′
5.8 Lyman-break galaxies
As the number density of Lyman-break galaxies (at 3 < z < 3.5) is typically half agalaxy per square arcminute down to R = 25 (Steidel et al. 1996), a massive clusterwill likely magnify one of them, and if we consider a wider range in redshift, the prob-ability that one of them is multiply imaged is almost guaranteed. The first giant arcin Cl 2244-04 at z = 2.24 is considered to be the first Lyman-break galaxy detectedin a cluster lens, although at the time of its discovery in the late 1980s, this galaxywas not classified as such. As part of the CNOC survey, Yee et al. (1996) identified a“proto-galaxy” at z = 2.72, the galaxy cB58 in the cluster MS1512+36. Interestingly,they assumed that this object although being very close to the cluster center wasunlikely to be lensed. But soon after, Seitz et al. (1998) demonstrated that cB58 washighly lensed, magnified by more than a factor of 50, thanks to the identification of itscounter image. The estimate of such a high magnification led to a number of follow-up studies at high spectral resolution to further constrain the physical properties ofthis high-redshift galaxy (e.g. Pettini et al. 2002). At about the same time, the triplearc at z = 2.515 in Abell 2218 (Ebbels et al. 1996) was the first recognized Lyman-break galaxy lensed by a massive cluster, however, its magnification is only ∼15×,much less than that of cB58. Shortly afterward in the course of a spectroscopic clustergalaxy survey of MS1358+62, Franx et al. (1997) discovered a Lyman-break galaxyat z = 4.92 multiply imaged by the cluster. Further study and modeling by Swinbanket al. (2010) derived a magnification factor for the brightest image of 12.5 ± 2. At thetime of discovery the arc in MS1358+62 was the most distant galaxy known. In themassive cluster Abell 2390, Frye and Broadhurst (1998) and Pelló et al. (1999) inde-pendently found a z = 4.04 pair, strongly lensed by the cluster. These high-redshiftdiscoveries have demonstrated the potential of discovering even higher redshift galax-ies lensed by massive clusters. Thanks to deep F850LP/ACS data, following up thez = 5.56 Lyman-α galaxy pair of Ellis et al. (2001), Kneib et al. (2004) found ani-band dropout detected in z-band (see Fig. 38). Detection with NICMOS confirmeda z ∼ 6.8 redshift, however, a NIRSPEC/Keck spectrum failed to detect a Lyman-αline, but Spitzer IRAC 3.6 and 4.5 micron detections (Egami et al. 2005) providedstrong constraints on the age of the underlying stellar population, making it one ofthe best studied objects at this redshift.

Page 70 of 100 Astron Astrophys Rev (2011) 19:47
Fig. 38 HST ACS color V, I, z view of Abell 2218 showing the triply imaged Lyman-break galaxy atz ∼ 6.8 (Kneib et al. 2004)
Using the ESO/VLT instruments FORS and ISAAC, a deep imaging survey ofthe clusters AC114 and A1835 was conducted by Richard et al. (2006) to search forlensed optical and near-infrared dropout galaxies. In this work, they identified 26 op-tical dropout candidates in both A1835 and AC114 (with H ∼ 23.5–24.0). Half ofthese candidates show an SED compatible with star-forming galaxies at z > 6, and6 of them are likely intermediate-redshift extremely red objects based on luminosityconsiderations. With this dataset a first attempt was made to characterize the luminos-ity function of these high-redshift galaxies, which are not well constrained by deeperHST/NICMOS observations of the HUDF (Hubble Ultra Deep Field). This work leadto the study by Richard et al. (2008) of a further six massive clusters with HST usingthe NICMOS camera and complemented by Spitzer observations. The survey yielded10 z-band and 2 J-band dropout candidates to photometric limits of J110 ∼ 26.2 AB(5σ ). By taking into account the magnifications afforded by the clusters, they probedthe presence of z > 7 sources to unlensed limits of J110 ∼ 30 AB, fainter than thosecharted in the HUDF. Taking into account the various limitations of this work, theyconcluded that about half of the sample of z-band dropouts are at high redshift. Anambitious infrared spectroscopic campaign undertaken with the NIRSPEC spectro-graph at the Keck Observatory for seven of the most promising candidates failed todetect any Ly-α emission.

Astron Astrophys Rev (2011) 19:47 Page 71 of 100
Behind Abell 1689, using HST/NICMOS Bradley et al. (2008) found a brightH = 24.7 z ∼ 7.6 galaxy candidate: A1689-zD1. This source is 1.3 mag brighterthan any known z850-dropout galaxy (thanks to a cluster magnification factor of∼9.3×). Nevertheless, no spectroscopic observations have yet confirmed the red-shift of this candidate. In the more recent years, discoveries have been reportedusing either the ground based ESO/Hawk-I infrared imager (Laporte et al. 2011)or the new WFC3 camera installed in May 2009 onboard HST (Bradley et al.2011; Kneib et al. 2011; Paraficz et al. 2011). In the long term, the James WebbSpace Telescope (JWST) and the Extremely Large Telescopes will uncover largenumbers of these very high-redshift systems, enabling the study of their sizes,morphologies and physical parameters (e.g. Wyithe et al. 2011; Salvaterra et al.2011).
5.9 Far infrared lensing surveys
With the launch of the Herschel Space Observatory in May 2009, a new window tothe Universe has been opened. The Herschel Lensing Survey (HLS) conducted deepPACS and SPIRE imaging of 44 massive clusters of galaxies. These observationscomplement the observation of 10 massive clusters by the GTO teams. In particular,it is foreseen that the strong gravitational lensing power of these clusters will enablepenetration through the confusion noise, which sets the ultimate limit on our abilityto probe the Universe with Herschel. Although the analysis of this large dataset isstill in progress, some early results were presented in the AandA Herschel specialissue in spring 2010. In particular, Egami et al. (2010) summarized the major resultsfrom the science demonstration phase observations of the Bullet cluster (z = 0.297).The study of two strongly lensed and distorted galaxies at z = 2.8 and 3.2 and thedetection of the Sunyaev–Zel’dovich (SZ) effect increment of the cluster with theSPIRE data have been reported.
By looking at Abell 2218, Altieri et al. (2010) studied the population of in-trinsically faint infrared galaxies that lie below the sensitivity and confusion lim-its using ultra-deep PACS 100 and 160 micron observations (Fig. 39). They de-rived (unlensed) source counts down to a flux density of 1 mJy at 100 micronand 2 mJy at 160 micron. In particular, the slope of the counts below the turnoverof the Euclidean-normalized differential curve could be constrained in both bandsand was found to be consistent with most of the recent evolutionary models. Byintegrating the number counts over the flux range accessed by exploiting lensingby Abell 2218 they retrieved a cosmic infrared background surface brightness of∼8.0 and ∼9.9 nW/m2/sr, in the 110 and 160 micron bands, respectively. By com-bining the Abell 2218 results with wider/shallower fields, the source fluxes cor-respond to ∼60% and ∼90% of the DIRBE cosmic infrared background at 100and 160 micron. These first Herschel results from HLS and the GTO sample willcertainly expand as the data are getting analyzed and we can envision numerousfollow-up observations at optical and near-infrared wavelengths as well as withALMA.
As part as the second call for observations another interesting lensing search hasbeen implemented in the Herschel observing program to find a larger number of ex-ceptionally bright lensed galaxies such as the one found by Swinbank et al. (2010).

Page 72 of 100 Astron Astrophys Rev (2011) 19:47
Fig. 39 (Left) PACS 100 ?m map toward Abell 2218 with lensed and foreground sources marked with bluecircles, other sources are identified cluster members. Overlaid contours in black show the rms contours at0.7, 1.0, 2.0 and 4.0 mJy. (Right) Number counts at 100 micron with lensing correction (red filled circles),normalized to the Euclidean slope, against the prediction of various synthetic counts models. Errors referto pure Poisson statistics at 68% C.L. GOODS-N counts are contrasted in the shaded area (from Bertaet al. 2010). (Figures from Altieri et al. 2010)
This project is aiming to conduct a SPIRE snapshot survey of ∼300 X-ray-selectedmassive galaxy clusters to discover the few extreme magnified objects that will thenbe very easy to follow-up at various wavelengths for an in-depth study. Although thissurvey is not yet finished, a number of highly amplified SPIRE sources have beenidentified, and intensive multi-wavelength follow-up are in progress.
5.10 Cluster lensed supernovae
In the last two decades, Supernovae (SNe) have been used for several astro-physical and cosmological applications. In particular, core collapse SNe trace thestar formation history while the standard candle property of Type Ia SNe can beused for probing the expansion history of the Universe (e.g. Riess et al. 1998;Perlmutter et al. 1999; Amanullah et al. 2010). One of the focus on current SNeresearch is to probe the distant Universe. However, one strong limitation is the lightcollecting power of existing telescopes.
A possible alternative to current investigation is to target these SNe in the fieldof view of massive clusters. Although the idea is not new and was first discussed byNarasimha and Chitre (1988) and then by Kovner and Paczynski (1988), it is onlyrecently that SNe observations in cluster fields has become more popular (Kolatt andBartelmann 1998; Sullivan et al. 2000; Gal-Yam et al. 2002). The most interestinglocations are of course the strong lensing regions of clusters where the amplificationis the largest, and were SNe could be multiply imaged offering the possibility tomeasure the time delay between the different images.
At first SN searches were done at optical wavelengths where SNe typically emitmost of their light. For example, Gal-Yam et al. (2002) using archival HST imagingof 9 clusters, in which they discovered two or three likely cluster SNe and three otherSNe, with one background to a cluster at redshift z = 0.985. More recently, Sharon

Astron Astrophys Rev (2011) 19:47 Page 73 of 100
et al. (2010) in a dedicated SNe HST multi-epoch ACS I -band survey of 16 massiveclusters (ranging from z = 0.5 to z = 0.9) have discovered 24 SNe, with eight of thembeing background to these clusters (the highest SN redshift found is at z = 1.12).However, none of those lensed SNe are in the regions of multiple images. At evenhigher cluster redshift z ∼ 1, the Supernova Cosmology Project (PI: Perlmutter) hastargeted 25 clusters through an HST multi-epoch program in which nine clusters andtwenty other (foreground or background) SNe have been discovered (Dawson et al.2009). However, the main focus of these cluster multi-epoch surveys was essentiallygeared toward the discovery and study of cluster type Ia SNe, and thus were notoptimized to benefit from the cluster lens magnification.
On the contrary, Gunnarsson and Goobar (2003) presented the feasibility of de-tecting high-z SNe along the line of sight of massive clusters, in particular focusingon the SNe detection in the near infrared. Using a dedicated VLT/ISAAC multi-epochSN survey, Stanishev et al. (2009) and Goobar et al. (2009) reported the discovery ofa highly amplified SN at z ∼ 0.6 behind the well-studied Abell 1689 cluster. Morerecently, using the new VLT/Hawk-I infrared camera, Amanullah et al. (2011) foundone of the most distant SNe ever found at z = 1.703 (measured through X-Shooterspectroscopy of the galaxy host) thanks to the large magnification (∼4.3±0.3) of themassive cluster Abell 1689. This study demonstrated that further SNe follow-up maylead to important new discoveries.
6 Cosmological constraints from cluster lensing
In this section, we discuss three powerful cluster lensing based methods at variousstages of development and application that may provide competitive and importantconstraints on cosmological parameters. These are: cosmography using several setsof multiple images lensed by the same cluster; the abundance of arcs and the statis-tics of lensed image triplets. For cosmography and triplet statistics purely geometricconstraints are obtained via the ratio of angular diameter distances, whereas the abun-dance of arcs provides potentially strong constraints on the growth of structures andprimordial non-Gaussianity.
6.1 Cosmography with multiple images
Measurements of the Hubble diagram for Type Ia Supernovae (SNIa) (Riess et al.1998; Perlmutter et al. 1999) combined with constraints from the Wilkinson Mi-crowave Anisotropy Probe (WMAP5) (Spergel et al. 2003), cosmic shear observations(Bacon et al. 2000; Kaiser et al. 2000; van Waerbeke et al. 2000; Wittman et al. 2000;Semboloni et al. 2006), cluster baryon fraction (Allen et al. 2004), cluster abundances(Vikhlinin et al. 2009) and baryon acoustic oscillations (BAO) from galaxy surveys(Efstathiou et al. 2002; Seljak et al. 2005; Eisenstein et al. 2005) suggest that ∼72%of the total energy density of the Universe is in the form of an unknown constituentwith negative pressure—the so-called dark energy, which powers the measured ac-celerating expansion. These observations probe the equation-of-state parameter wX,defined as the ratio of pressure to energy density, through its effect on the expansionhistory of the Universe and the growth of structures.

Page 74 of 100 Astron Astrophys Rev (2011) 19:47
Constraining the geometry and matter content of the Universe using multiple setsof arcs has been explored in cluster lenses using different techniques (Paczynski andGorski 1981; Link and Pierce 1998; Cooray 1999a, 1999b; Golse et al. 2002; Sereno2002; Sereno and Longo 2004; Soucail et al. 2004; Dalal et al. 2005; Meneghetti et al.2005a, 2005b; Maccio 2005; Gilmore and Natarajan 2009; Jullo et al. 2010).
As shown in Sect. 1, the lensing deflection produced in the image of a backgroundsource depends on the detailed mass distribution of the cluster as well as on theratio of angular diameter distances. The cosmological dependence arises from theangular diameter distance ratios that encapsulate the geometry of the Universe andare a function of both Ωm and ΩX .
The most promising technique, is using multiple sets of arcs with measured red-shifts. By taking the ratio of their respective Einstein radii and marginalizing overparameters of the mass distribution, one can in principle constrain the cosmologicalparameters Ωm and ΩX . In this method, the angular diameter distance ratios for twoimages from different sources defines the ‘family ratio’ Ξ , from the cosmologicaldependence of which constraints on Ωm and wX are extracted:
Ξ(zL, zs1, zs2;Ωm,ΩX,wX) = D(zL, zs1)
D(0, zs1)
D(0, zs2)
D(zL, zs2), (58)
where zL is the lens redshift, zs1 and zs2 are the two source redshifts, and D(z1, z2)
is the angular diameter distance.Link and Pierce (1998) showed that the cosmological sensitivity of the angular
size-redshift relation could be exploited using sources at distinct redshifts and de-veloped a methodology to simultaneously invert the lens and derive cosmologicalconstraints. Golse et al. (2002) using simulated cluster data, showed that the recoveryof cosmological parameters was feasible with at least three sets of multiple imagesfor a single cluster. Soucail et al. (2004) then applied the technique to the lensingcluster Abell 2218 using 4 systems of multiple images at distinct redshifts, and found(Ωm < 0.37, wX < −0.80) assuming a flat Universe.
Jullo et al. (2010) have presented the results of the first application of this methodto the massive lensing cluster Abell 1689 at z = 0.184 (see Fig. 40). Based on imagesfrom the Advanced Camera for Surveys (ACS) aboard the Hubble Space Telescope(HST) this cluster has 114 multiple images from 34 unique background galaxies, 24of which have secure spectroscopic redshifts (ranging from z ∼ 1 to z ∼ 5) obtainedwith the Very Large Telescope (VLT) and Keck Telescope spectrographs (Broadhurstet al. 2005; Limousin et al. 2007). Their parametric model has a total of 21 freeparameters consisting of two large-scale potentials, a galaxy-scale potential for thecentral brightest cluster galaxy (BCG), and includes the modeling of 58 of the bright-est cluster galaxies. The contribution of substructure in the lens plane and along theline of sight is explicitly included (see D’Aloisio and Natarajan 2011a, 2011b for adetailed discussion of the systematics). Combining the lensing derived cosmologicalconstraints with those from X-ray clusters and the Wilkinson Microwave AnisotropyProbe 5-year data gives Ωm = 0.25 ± 0.05 and wX = −0.97 ± 0.07 which are con-sistent with results from other methods (see Fig. 41). Inclusion of this work with allother techniques available brings down the current 2σ contours on the dark energyequation of state parameter wX by about 30%.

Astron Astrophys Rev (2011) 19:47 Page 75 of 100
Fig. 40 The critical lines for a source at z = 3 are over-plotted in yellow on the HST ACS image ofAbell 1689. The lensing mass model used is the one from which we derived cosmological constraints.In addition to two large-scale clumps and the BCG, this model includes the contribution of 58 clustergalaxies. The positions of cluster galaxies are marked with green crosses. Over-plotted in white are the28 multiple images arising from 12 families used in their work; the red circles mark the positions of therejected images (figure from Jullo et al. 2010)
As with all techniques, an accurate inventory of the key systematics and theircontribution to the error budget is also the challenge for this technique. The twosignificant current limitations arise from: (i) accounting appropriately for the lensingeffect of the uncorrelated line of sight substructure (see schematic in Fig. 42) and(ii) the simplifying scaling relations assumed to relate galaxy total mass to galaxylight. However, the results from Abell 1689 are extremely encouraging and the future

Page 76 of 100 Astron Astrophys Rev (2011) 19:47
Fig. 41 The currentcosmological constraints in the(Ωm, Ωλ) based on the best-fitmodel of Abell 1689 from Julloet al. (2010): the results fromcombining cosmologicalconstraints from WMAP5 +evolution of X-ray clusters +cluster strong lensing (clusteronly methods); the 1 and 2σ
contours are plotted, bluecontours constraints fromWMAP5, pink contours X-rayclusters, orange contours clusterstrong lensing
prospects for this method look promising due to the power from combining severalclusters at various redshifts.
6.2 Arc statistics and primordial non-Gaussianity
The production of giant arcs by lensing clusters is ubiquitously observed. The abun-dance of massive clusters available to do so is sensitive both to the expansion historyand initial conditions of the Universe. Given the scaling of the lensing efficiency withredshift, it is known that the frequency of giant-arc formation depends on the abun-dance and characteristics of galaxy-clusters roughly half-way to the sources. Clusterphysics, cosmological effects and the properties of the high-redshift source popula-tion all play a role in determining the abundance of giant arcs, however, isolatingthese effects is difficult. It was originally claimed by Bartelmann et al. (1998) thatthe �CDM model predicted approximately an order of magnitude fewer arcs thanseen in observations. Subsequent studies (e.g. Zaritsky and Gonzalez 2003; Glad-ders et al. 2003) substantiated this claim of a ‘giant-arc problem’. This mis-matchbetween observations and the concordance cosmological model predictions suggestthat either the Bartelmann et al. (1998) analysis was lacking a crucial component ofproperties exhibited by real cluster lenses and the source population (Williams et al.1999) or that the concordance cosmology is in fact inconsistent with the observedabundance of giant arcs. A significant amount of effort has been expended towardunderstanding the most important characteristics of arc-producing clusters, and howthey may not be typical of the general cluster population (e.g. Hennawi et al. 2007;Meneghetti et al. 2010; Fedeli et al. 2010). Other studies focused on effects thatwere not captured in early simulations. The mass contribution of central galax-ies appears to have a significant effect, though not enough to entirely resolve theBartelmann et al. (1998) disagreement alone (Meneghetti et al. 2003a, 2003b; Dalalet al. 2004). The probability of giant-arc formation increases with source redshift,

Astron Astrophys Rev (2011) 19:47 Page 77 of 100
Fig. 42 Schematic diagram illustrating the creation of lens planes to quantify the lensing effects of halosalong the line of sight. A rectangular slice of the Millennium Simulation box is taken and the locationsof halos are projected along the long axis and analytic NFW potentials are placed on those positions. TheNFW parameters are obtained through scaling relations with mass and redshift. The lens plane is insertedat the appropriate redshift and a multi-plane lensing algorithm is used to trace rays. Many lens planesbetween z = 0 and z = 5 are used to estimate the systematic errors at the positions of multiple imagesfrom the structure along the line of sight
therefore the overall abundance is sensitive to uncertainties in the high-redshifttail of the source–redshift distribution (Wambsganss et al. 2004; Dalal et al. 2004;Li et al. 2005). However, none of these effects can account for the observed discrep-ancy. On the other hand, taking into account a realistic source population and obser-

Page 78 of 100 Astron Astrophys Rev (2011) 19:47
vational effects, Horesh et al. (2005) claimed that the clusters predicted by �CDMhave the same arc production efficiency as the observed clusters. The effects of bary-onic physics, such as cooling and star formation, on central mass distributions havealso been investigated (Meneghetti et al. 2010).
The amplitude of the linear matter power spectrum plays a critical role in de-termining how severe and if there is a giant-arc problem or not. Observationsseem to be converging on σ8 ≈ 0.8 (Fu and Stockton 2008; Vikhlinin et al. 2009;Komatsu et al. 2011), while most numerical studies on the giant-arc abundance todate have assumed σ8 = 0.9. It is likely that adjusting σ8 from 0.9 to 0.8 will lowerthe predicted giant-arc abundance significantly, increasing tension with observations(Li et al. 2006; Fedeli et al. 2008). The cosmological model may play a role here.In arguing that the giant-arc problem may be unavoidable if σ8 ≈ 0.8, Fedeli et al.(2008) mention in passing that early dark energy or non-Gaussian initial conditionsmay provide “a way out.” The effects of dark energy on giant-arc statistics have beeninvestigated in Bartelmann et al. (2003), Maccio (2005), Meneghetti et al. (2005a,2005b), and Fedeli and Bartelmann (2007). On the other hand, the possible effectsof non-Gaussian initial conditions have only been explored recently by D’Aloisioand Natarajan (2011a, 2011b). They argue that primordial non-Gaussianity (PNG)can affect the probability of giant-arc formation in at least two ways.7 First, PNGcan lead to an enhanced or diminished abundance of galaxy clusters, depending onthe particular model (e.g. Matarrese et al. 2000; Lo Verde et al. 2008; Dalal et al.2008), which would lead to a change in the number of supercritical lenses that areavailable in the appropriate redshift range. Secondly, PNG is expected to influencethe central densities of halos (Avila-Reese et al. 2003; Oguri and Blandford 2009;Smith et al. 2010). Since lensing cross sections are sensitive to central densities, weexpect corresponding changes in them as well. If a cluster lens cannot produce arcswith length-to-width ratios above some threshold, then its cross section for giant-arcproduction is zero. Roughly speaking, this corresponds to a minimum mass requiredto produce giant arcs. Owing to the effects on central densities, we expect PNG toalter this minimum mass threshold as well.
D’Aloisio and Natarajan (2011a, 2011b) quantify the impact of non-Gaussian ini-tial conditions with the local bispectrum shape on the predicted frequency of giantarcs. Non-Gaussianity is generally expressed in terms of fNL that characterizes theamplitude of non-Gaussianity in the primordial curvature perturbation (Komatsu andSpergel 2001). Using a path-integral formulation of the excursion set formalism, ex-tending a semi-analytic model for calculating halo concentrations to the case of PNG,they show that massive halos tend to collapse earlier in models with positive fNL, rel-ative to the Gaussian case, leading to enhanced concentration parameters. The con-verse is true for fNL < 0. In addition to these effects, which change the lensing crosssections, non-Gaussianity also modifies the abundance of supercritical clusters avail-able for lensing. These combined effects work together to either enhance (fNL > 0) orsuppress (fNL < 0) the probability of giant-arc formation (see Fig. 43). Using the bestvalue and 95% confidence levels currently available from the Wilkinson Microwave
7The PNG model considered here is the simplest one that gives rise to a non-zero 3-point correlationfunction.

Astron Astrophys Rev (2011) 19:47 Page 79 of 100
Fig. 43 The ratio of giant-arccross sections in the case ofnon-Gaussian and Gaussianinitial conditions. Halos haveenhanced central densities inmodels with fNL > 0. Theirgiant-arc cross sections aretherefore increased relative tothe Gaussian case and vice versa(figure from D’Aloisio andNatarajan 2011a, 2011b)
Anisotropy Probe, they report that the giant-arc optical depth for sources at zs ∼ 2 isenhanced by ∼20% and ∼45% for fNL = 32 and 74, respectively. Conversely theyreport a suppression of ∼5% for fNL = −10. These differences translate to similarrelative changes in the predicted all-sky number of giant arcs. Ideally the goal is touse giant-arc statistics to constrain small scale PNG. The prospects are extremelypromising given upcoming all sky surveys planned by future deep wide-field imag-ing surveys such as foreseen by the Dark Energy Survey (DES), the Large SynopticSurvey Telescope (LSST) and future wide-field space mission (e.g. EUCLID).
6.3 Triplet statistics
Triplet statistics offer an interesting geometrical method that uses the weak gravita-tional lensing effects of clusters to constrain the cosmological parameters Ωm andΩ� (Gautret et al. 2000). For each background galaxy, a foreground lensing clusterinduces a magnification that depends on the local convergence κ and shear terms γ1and γ2 and on the cosmological parameters through the angular diameter distanceratio DLS/DOS. To disentangle the effects of these three quantities, the ellipticitiesof each triplet of galaxies located at about the same apparent position in the lensplane (although at three distinct redshifts) needs to be compared. The simultaneousknowledge of ellipticities and redshifts of each triplet enable the building of a purelygeometrical estimator G(Ωm,Ω�) that is independent of the lens potential. This es-timator G has the simple form of the determinant of a 3 × 3 matrix built with thetriplet values of DLS/DOS and observed ellipticities.
When G is averaged over many triplets of galaxies, it provides a global functionwhich converges to zero for the true values of the cosmological parameters. However,in order to apply this method the various sources of statistical noise need to be quan-tified. The linear form of G with respect to the measured ellipticity of each galaxy

Page 80 of 100 Astron Astrophys Rev (2011) 19:47
implies that the different sources of noise contributing to G decrease as 1/√
N , whereN is the total number of observed lensed galaxies. From simulations that incorporaterealistic geometries and convergences for lensing clusters and a redshift distributionfor galaxies, the results are promising for a sample of 100 clusters. These 100 clus-ters essentially need to be imaged in multiple bands to obtain accurate photometricredshifts for the triplets. With next generation cosmological surveys the observationaldata needed for this sample size would not be impossible to obtain.
7 Comparison of observed lensing cluster properties with theoreticalpredictions
With the growing success of gravitational lensing analysis of clusters, it has becomepossible to compare and test theoretical predictions against observations. With therapid progress in high-resolution cosmological simulations of dark matter we nowhave a unique opportunity to directly compare properties of cluster dark matter halosderived from lensing studies. Many important physical questions with regard to theinternal structures of halos, their dynamical evolution and the granularity of dark mat-ter can now be tackled: the assembly process (role of merging sub-clusters); lensingcross sections; efficiency of lensing and super-lenses; selection effects; mass profiles;density profiles; ellipticity; alignments; abundances, and the mass concentration. Webriefly outline below the results of recent studies on this topic.
7.1 Internal structure of cluster halos
In cosmological simulations of structure formation it is found that the density profilesof dark matter halos are well fit over many decades in mass from cluster mass scalesdown to dwarf galaxy scales by the Navarro–Frenk–White profile (see Appendix A.3for details). By combining strong and weak lensing constraints, as discussed above ithas become possible to probe the mass profile of the clusters on scales of 0.1–5 Mpc,thus providing a valuable test of the universal form proposed by NFW on large scales(e.g. Okabe et al. 2010; Umetsu et al. 2011). As for the inner density profile slopesthere appears to be similarly a large degree of variation, some like Cl0024+1654(Kneib et al. 2003; Tu et al. 2008; Limousin et al. 2008) adequately fit the NFW form,others like RXJ1347-11 are found to have slopes shallower than the NFW prediction(Newman et al. 2011; Umetsu et al. 2011), while others like MS2137-23 are foundto have steeper slopes (Sand et al. 2004). One caveat with the NFW prediction is thatthe functional form is derived from dark matter only simulations, whereas in reality itis clear that baryons in the inner regions close to the cD/BCG play a significant roleboth in terms of the mass budget and modifications to density profile slopes in thevery center.
Lensing clusters are preferentially more significantly concentrated than all clus-ters (see Fig. 44 and Comerford and Natarajan 2007; but also: Broadhurst et al. 2008;Oguri et al. 2009 and Meneghetti et al. 2011) and they typically tend to be outlierson the concentration-mass relationship predicted for clusters in the �CDM model.The origin of this enhanced concentration parameter is likely due to: (i) high inci-dence of projected line of sight structures for massive lensing clusters; (ii) elongated

Astron Astrophys Rev (2011) 19:47 Page 81 of 100
Fig. 44 Observed clusterconcentrations and virial massesderived from lensing (filledcircles) and X-ray (open circles)measurements. For reference,the solid lines depict the best-fitpower law to our completesample and its 1-σ scatter. Thelensing concentrations appearsystematically higher than theX-ray concentrations, and aKolmogorov–Smirnov testconfirms that the lensing resultslikely belong to a differentparent distribution. This figure isfrom Comerford and Natarajan(2007)
shapes that enhance lensing efficiency, factors that might observationally bias lensingselection; (iii) baryons that could play an important role in the inner regions.
7.2 Mass function of substructure in cluster halos
Combining observed strong and weak lensing and exploiting galaxy–galaxy lensinginside clusters, it has been possible to map the granularity of the dark matter dis-tribution (Natarajan and Kneib 1997; Natarajan and Springel 2004; Natarajan et al.2007) in clusters and compare them to predictions from the Millennium cosmologicalsimulation (Springel et al. 2005). This is done by attributing local anisotropies in theobserved shear field to the presence of dark matter sub-halos (Natarajan et al. 2009).The mass function thus derived for several clusters agrees well with that predictedentirely independently from high-resolution cosmological simulations of structureformation in the standard �CDM paradigm over the mass range 1011–1013 M�. Thecomparison was made with clusters that form in the Millennium Simulation (Springelet al. 2005). This excellent agreement of the mass function derived from these twoindependent methods demonstrates that there is no substructure problem (which wasclaimed earlier) on cluster scales in �CDM. This is a significant result as a substruc-ture crisis has been claimed on galaxy scales. Since �CDM is a self-similar theory,if the substructure problem had been endemic to the model, it would have been repli-cated on cluster scales. This suggests that the substructure discrepancy on galaxyscales arises from the galaxy formation process or from some hitherto undiscoveredcoupling between baryons and dark matter particles. Therefore, lensing clusters haveprovided unanticipated insights into the dark matter model. Moving on from the Mil-lennium Simulation, state of the art at the present time is the Mare Nostrum simu-lation which is promising in terms of mass resolution and larger volume probed and

Page 82 of 100 Astron Astrophys Rev (2011) 19:47
offers a new test-bed for comparison with lensing data from cluster surveys like theCLASH Hubble survey (Meneghetti et al. 2011).
7.3 Dynamical evolution of cluster halos
Exploiting strong and weak gravitational lensing signals inferred from panoramicHubble Space Telescope imaging data, high-resolution reconstructions of the massdistributions are now available for clusters ranging from z = 0.2–0.5. Applyinggalaxy–galaxy lensing techniques inside clusters the fate of dark matter sub-haloscan now be tracked as a function of projected cluster-centric radius out to 1–5 Mpc,well beyond the virial radius in some cases. There is now clear detection of thestatistical lensing signal of dark matter sub-halos associated with both early-typeand late-type galaxies in clusters. In fact, it appears now that late-type galaxies inclusters (which dominate the numbers in the outskirts but are rare in the inner re-gions of the cluster) also possess individual dark matter halos (Treu et al. 2002;Limousin et al. 2005, 2007; Moran et al. 2006; Natarajan et al. 2009). In the caseof the cluster Cl0024+1656 that has been studied to beyond the virial radius, themass of a fiducial dark matter halo that hosts an early-type L∗ galaxy varies fromM = 6.3 ± 2.7 × 10¹¹ M� within r < 0.6 Mpc, to 1.3 ± 0.8 × 10¹² M� withinr < 2.9 Mpc, and increases further to M = 3.7 ± 1.4 × 10¹² M� in the outskirts.The mass of a typical dark matter sub-halo that hosts an L∗ galaxy increases withprojected cluster-centric radius in line with expectations from the tidal stripping hy-pothesis. Early-type galaxies appear to be hosted on average in more massive darkmatter sub-halos compared to late-type galaxies. Early-type galaxies also trace theoverall mass distribution of the cluster whereas late-type galaxies are biased tracers.The findings in this cluster and others are interpreted as evidence for the active re-distribution of mass via tidal stripping in galaxy clusters. Upon comparison of themasses of dark matter sub-halos as a function of projected cluster-centric with theequivalent mass function derived from clusters in the Millennium Run very goodagreement is found (see Fig. 45 and Natarajan et al. 2007). However, simulated sub-halos appear to be more efficiently stripped than lensing observations suggest (seeFig. 46). This is likely an artefact of comparison with a dark matter only simulation.Future simulations that simultaneously follow the detailed evolution of the baryoniccomponent during cluster assembly will be needed for a more detailed comparison.Lensing has proved to be a powerful probe of how clusters assemble and grow, andit appears that our findings ratify the �CDM paradigm, hierarchical growth of struc-ture, and the key role played by tidal stripping during cluster assembly.
7.4 Constraints on the nature of dark matter
While it is clear that clusters are vast repositories of dark matter, the nature of darkmatter remains elusive. A plethora of astronomical observations from the early Uni-verse to the present time are consistent with the dark matter being a cold, collision-less fluid that does not couple to baryons. However, there is potential for dark matterself-interactions and lensing observations offer a unique window to probe this further(e.g. Miralda-Escudé 2002). Limits on the dark matter interaction cross section can be

Astron Astrophys Rev (2011) 19:47 Page 83 of 100
Fig. 45 Comparison between substructure mass function retrieved from the galaxy–galaxy lensing anal-ysis (red shaded histograms) and results from haloes selected from the Millennium Simulation. The blacksolid line in each panel represents the average sub-halo mass function of haloes selected at the redshift ofthe observed lensing cluster (see text for details). The grey shaded region represents, for each value of thesub-halo mass, the min-max number of substructures found in the simulated haloes (figure from Natarajanet al. 2007)
placed from lensing observation of clusters, however, these are currently not partic-ularly constraining or illuminating. Two distinct arguments have been used to obtainlimits that strongly support the collision-less nature of dark matter. One involves thedistribution of the sizes of tidally truncated sub-halos in clusters (Natarajan et al.2002a, 2002b); and the second involves estimates from the separation between thedark matter and X-ray gas in the extreme merging system, the Bullet Cluster (Cloweet al. 2006; Bradac et al. 2006) wherein they find σ/m < 4 g m−1 cm2 assuming thatthe two colliding sub-clusters experienced a head-on collision in the plane of thesky. Similar results were also found from the so-called “Baby Bullet” cluster (Bradacet al. 2008). Exploring these merging clusters is certainly an avenue where lensingobservations may provide constraints and insights on the nature of dark matter.
8 Future prospects
Since the discovery of giant arcs in the late 1980s gravitational lensing by clusters ofgalaxies has now become a powerful cosmological tool.
We list below some possible new avenues for the next exciting discoveries in thecoming years using gravitational lensing in clusters, assuming improvements in thedata quality and data volume:

Page 84 of 100 Astron Astrophys Rev (2011) 19:47
Fig. 46 Variation of the mass of a dark matter sub-halo that hosts an early-type L∗ galaxy as a functionof cluster-centric radius. The results from the likelihood analysis are used to derive the sub-halo mass forthe galaxy–galaxy lensing results and the counterparts are derived from the Millennium Simulation withan embedded semi-analytic galaxy formation model. This enables selection of dark matter halos that hosta single L∗ galaxy akin to our assumption in the lensing analysis. The solid circles are the data points fromthe galaxy–galaxy lensing analysis and the solid squares are from the Millennium Simulation. The uppersolid square in the core region marks the value of the sub-halo mass with correction by a factor of 2 asfound in Natarajan et al. (2007). The solid triangle is the galaxy–galaxy lensing data point for the sub-haloassociated with a late-type L∗ galaxy. The radial trend derived from lensing is in very good agreement withsimulations and demonstrate that tidal stripping is operational with higher efficiency in the central regionsas expected
• Dedicated lensing surveys of well defined massive cluster samples can probe in asystematic way the cluster mass distribution at high resolution from galaxy scalesout to the virial radius using both weak and strong lensing. In particular, we canhope to study the build-up of the mass in clusters as a function of time and disen-tangle the time scales on which the segregation between the different mass com-ponents occurs during the assembly process. One could also envision being ableto systematically trace the filamentary structures linking massive clusters that aresimply the nodes of the cosmic web seen in numerical simulations of the formationand evolution of structure in the Universe.
• From wide field imaging surveys: mass selected clusters can be identified, butlikely the more interesting prospect is the ability to investigate the dark mattermass versus stellar-mass relation and its evolution with time, thus providing usefulcosmological constraints on the growth of structure in the Universe, as well as onthe underlying geometric cosmological parameters.
• With larger cluster samples, better constraints will be obtained on density profileslopes in the inner and outer regions of clusters thus permitting to robustly testtheoretical predictions of the �CDM model.
• Using numerous multiple images with measured redshifts in a number of massiveclusters, we should be able to provide geometrical constraints of Dark Energy in acomplementary way to other cosmological probes.
• Measuring the time delays of temporally variable phenomena such as Supernovaeor AGN when observed behind well-known massive lensing clusters, will lead to

Astron Astrophys Rev (2011) 19:47 Page 85 of 100
measurement of the Hubble parameter H(z), in a similar way as multiple quasarsbehind galaxies, but with much improved accuracy. However, in order to have atime delay of a limited number of years, these transients event must be locatedclose to the critical lines. While the likelihood of detecting multiple images ofsuch transient phenomena is extremely low, it is not insignificant provided there isa steady increase in the volume of the Universe probed with time.
• Finally, massive cluster lenses will always be the unique places to probe the high-redshift Universe, as they offer enhanced sensitivities at all wavelengths and en-able mapping the detailed morphology and physical properties of the most distantgalaxies in the Universe.
In the near future lensing observations will likely be geared toward opticaland near-infrared imaging exploiting the next generation of ground based exper-iments (DES, LSST, TMT, E-ELT), and spaced based observatories (JWST, EU-CLID/WFIRST).
However, in the long run, it is not too unreasonable to think that cluster lensingobservations may be well conducted in the radio domain. In such an event we foreseeup to an order of magnitude improvement in lensing measurement that will resultfrom combining information on galaxy shapes with velocity field data (Blain 2002;Morales 2006). Such preliminary developments will certainly come first with ALMA,but only centimeter radio interferometers such as SKA (Square Kilometer Array) willallow the exploration of these techniques on cosmological scales.
Acknowledgements The phenomenon of gravitational lensing is one of the most beautiful predictionsof Einstein’s Theory of General Relativity. We feel very privileged to have had the opportunity to workand contribute to this area. In particular, during and since the start of our scientific collaboration, ourgoal has been to inter-weave the observational and theoretical aspects of lensing by clusters to enable theexploitation of the potency of this technique. Much of the work reviewed here is heavily based and biasedtoward recent results, those obtained since JPK’s PhD thesis on cluster lenses in 1993; and PN’s work onvarious theoretical aspects of cluster lenses during and since her PhD in 1999. This review consolidatesthe rapid progress made thus far and provides a snap shot of this exciting field as it stands today. We wouldlike to thank our many colleagues for the interesting work and fruitful discussions at various conferences,workshops and meetings over the past decade that have provided us a better understanding of our Universeand have transformed cluster lenses into a powerful cosmological tool. JPK acknowledges support fromCNRS. PN acknowledges the John Simon Guggenheim Foundation for a Guggenheim Fellowship and theRockefeller Foundation for a residency at the Bellagio Rockefeller Center during the tenure of which thisreview was completed. She would also like to thank the Institute for Theory and Computation at HarvardUniversity for hosting her during her fellowship year.
Open Access This article is distributed under the terms of the Creative Commons Attribution Noncom-mercial License which permits any noncommercial use, distribution, and reproduction in any medium,provided the original author(s) and source are credited.
Appendix: Parametric mass distributions used to model clusters
Parametric profiles have been extremely successful in modeling cluster mass distri-butions derived from observed lensing data. A key advantage of parametric models istheir flexibility, as they can be used to probe the granularity of the mass distributionon a range of spatial scales. For the case of clusters, this enables combining strong andweak lensing data that derive from different regions of clusters in an optimal fashion.

Page 86 of 100 Astron Astrophys Rev (2011) 19:47
Below we outline the lensing properties of three most commonly used mass distri-butions: the circular Singular Isothermal Sphere [SIS]; the truncated isothermal massdistribution with a core that can be easily extended to the elliptical case [PIEMD]and the Navarro–Frenk–White [NFW] profile. While most mass distributions can begeneralized to the elliptical case, there are not always simple and convenient analyticexpressions available for lensing quantities as readily as for the PIEMD model. Theavailability of analytic expressions for the surface mass density, shear and magnifica-tion have made the PIEMD a popular choice for modeling lensing clusters.
A.1 The singular isothermal sphere
The primary motivation for the circular singular isothermal sphere (SIS) profile de-rives from the good fit that it provides to the observed approximately flat rotationcurves of disk galaxies. Flat rotation curves can be reproduced with a model densityprofile that scales as ρ ∝ r−2. Such a profile with a constant velocity dispersion asa function of radius appears to provide a good fit to cluster scale halo lenses as well(see e.g. Binney and Tremaine 1987 for more details). The projected surface massdensity of the SIS is given by
Σ(R) = σ 2v
2GR, (59)
where R is the distance from the center of the lens in the projected lens plane andwhere σv is the one-dimensional velocity dispersion of ‘particles’ that trace the grav-itational potential of the mass distribution. The dimensionless surface mass densityor convergence is defined in the usual way in units of the critical surface density. Forthe case of the SIS we have
κ(θ) = θE
2θ; γ (θ) = θE
2θ, (60)
where θ = R/DOL is the angular distance from lens center in the sky plane and whereθE is the Einstein deflection angle, defined as
θE = 4π
(σv
c
)2DLS
DOS. (61)
Lensing properties of SIS lens model in a nutshell:
• The magnification and the shear are of the same magnitude; κ = γ and evaluatedat the Einstein radius κ = γ = 1
2 .• The tangential critical line is the Einstein ring, and the radial critical line is reduced
to the central point.• The central mass density is infinite, and the total mass is also infinite.
A.2 Truncated isothermal distribution with a core
Although the SIS is the simplest mass distribution, it is unphysical as it has an infi-nite central density, an infinite total mass, and therefore cannot adequately match true

Astron Astrophys Rev (2011) 19:47 Page 87 of 100
mass distributions. More complex mass distributions have therefore been developedto provide more realistic fits to observed clusters. The Truncated Isothermal Distribu-tion with a Core, which has finite mass and a finite central density is quite popular asa lensing model, and one that we have used extensively and successfully in modelingcluster lenses.
The density distribution for this model is given by
Σ(R) = Σ0R0Rt
Rt − R0
(1√
R20 + R2
− 1√R2
t + R2
), (62)
with a model core radius R0 and a truncation radius Rt � R0.The useful feature of this model, is the ability to reproduce a large range of mass
distributions from cluster scales to galaxy scales by varying only the ratio η, whichis defined as η = Rt/R0. There also exists a simple relation between the truncationradius of the mass distribution and the effective radius Re of the light distribution forthe case of elliptical galaxies:
Rt ∼ 4
3Re. (63)
Furthermore, this simple circular model can be easily generalized to the ellipticalcase (Kassiola and Kovner 1993; Kneib et al. 1996) by re-defining the radial coordi-nate R as follows:
R2 =(
x2
(1 + ε)2+ y2
(1 − ε)2
); ε = a − b
a + b. (64)
Interestingly, all the lensing quantities can be expressed analytically (although usingcomplex numbers) and the expressions for the same were first derived in Kassiolaand Kovner (1993).
The mass enclosed within radius R for the model is given by
M(R) = 2πΣ0R0Rt
Rt − R0
[√R2
0 + R2 −√
R2t + R2 + (Rt − R0)
], (65)
and the total mass, which is finite, is
M∞ = 2πΣ0R0Rt. (66)
Calculating κ , γ and g, we have
κ(R) = κ0R0
(1 − R0/Rt)
(1√
(R20 + R2)
− 1√(R2
t + R2)
), (67)
with
2κ0 = Σ04πG
c2
DLSDOL
DOS, (68)

Page 88 of 100 Astron Astrophys Rev (2011) 19:47
where DLS, DOS and DOL are, respectively, the lens–source, observer–source andobserver–lens angular diameter distances.
To obtain the reduced shear g(R), given the magnification κ(R), we solveLaplace’s equation for the projected potential ϕ, and evaluate the components of theamplification matrix following which we can proceed to solve directly for γ (R), andthen g(R).
ϕ = 2κ0
[√R2
0 + R2 −√
R2t + R2 + (R0 − Rt) lnR
− R0 ln[R2
0 + R0
√R2
0 + R2]+ Rt ln
[R2
t + Rt
√R2
t + R2]]
. (69)
We can then derive the shear γ (R):
γ (R) = κ0
[− 1√
R2 + R20
+ 2
R2
(√R2 + R2
0 − R0
)
+ 1√R2 + R2
t
− 2
R2
(√R2 + R2
t − Rt
)]. (70)
Scaling this relation by Rt gives for R0 < R < Rt
γ (R/Rt) ∝ Σ0
η − 1
Rt
R∼ σ 2
R, (71)
where σ is the velocity dispersion (note this is similar to the SIS case).At larger radius, for R0 < Rt < R
γ (R/rt) ∝ Σ0
η
Rt2
R2∼ Mtot
R2, (72)
where Mtot is the total mass. In the limit that R � Rt, we have
γ (R) = 3κ0
2R3
[R2
0 − R2t
] + 2κ0
R2[Rt − R0]. (73)
Lensing properties of the truncated isothermal distribution with a core in a nut-shell:
• κ �= γ .• The tangential critical line once again corresponds to the Einstein ring, and the
radial critical line is a circle interior to the Einstein ring.• The central mass density is finite, and the total mass is also finite.
A.3 The Navarro–Frenk–White model
Although the truncated isothermal distribution with a core is very popular, it hasnever been fitted to the results of numerical simulations, in contrast to the universal

Astron Astrophys Rev (2011) 19:47 Page 89 of 100
“NFW” density profile (Navarro et al. 1997). In simulations of structure formationand evolution in the Universe, the NFW profile was found to be a good fit for a widerange of dark matter halo masses from 109–1015 M�. The spherical NFW densityprofile has the following form:
ρ(r) = ρs
(r/rs)(1 + r/rs)2, (74)
where ρs and rs are free parameters. It is often convenient to characterize the profilewith the concentration parameter, cvir = rvir/rs where rvir is the virial radius. Byintegrating the profile out to rvir and using mvir = 200ρc(z) 4πr3
vir/3, where mviris defined to be the virial mass and ρc is the critical density of the universe, theconcentration parameter can be related to ρs.
We now proceed to calculate the lensing properties of the NFW profile (moredetails can be found in Wright and Brainerd 2000). In the thin lens approximation, z isdefined as the optical axis and Φ(R,z) the three-dimensional Newtonian gravitationalpotential, where r = √
R2 + z2. The reduced two-dimensional lens potential in theplane of the sky is given by
ϕ(�θ) = 2
c2
DLS
DOLDOS
∫ +∞
−∞Φ(DOLθ, z) dz, (75)
where �θ = (θ1, θ2) is the angular position in the image plane.For convenience we introduce the dimensionless radial coordinates �x = (x1, x2) =
�R/rs = �θ/θs where θs = rs/DOL. In the case of an axially symmetric lens, the rela-tions become simpler, as the position vector can be replaced by its norm. The surfacemass density then becomes
Σ(x) =∫ +∞
−∞ρ(rsx, z) dz = 2ρcrsF(x), (76)
with
F(x) =
⎧⎪⎪⎪⎨⎪⎪⎪⎩
1x2−1
(1 − 1√1−x2
arcch 1x) (x < 1),
13 (x = 1),
1x2−1
(1 − 1√x2−1
arccos 1x) (x > 1)
and the mean surface density inside the dimensionless radius x is
Σ(x) = 1
πx2
∫ x
02πxΣ(x)dx = 4ρcrs
g(x)
x2, (77)
with
g(x) =
⎧⎪⎪⎪⎨⎪⎪⎪⎩
ln x2 + 1√
1−x2arcch 1
x(x < 1),
1 + ln 12 (x = 1),
ln x2 + 1√
x2−1arccos 1
x(x > 1).

Page 90 of 100 Astron Astrophys Rev (2011) 19:47
The lensing functions �α,κ and γ also have simple expressions:⎧⎪⎪⎪⎪⎪⎪⎪⎪⎨⎪⎪⎪⎪⎪⎪⎪⎪⎩
�α(x) = θΣ(x)
Σcrit= 4κs
θ
x2g(x)�ex,
κ(x) = Σ(x)
Σcrit= 2κsF(x),
γ (x) = Σ(x) − Σ(x)
Σcrit= 2κs
(2g(x)
x2− F(x)
)(78)
with κs = ρcrsΣ−1crit . Noting �∇�xα(x) = (∂x1α, ∂x2α) and φ = arctan(x2/x1), we obtain
some useful relations for the following that hold for any circular mass distribution(Golse and Kneib 2002):
⎧⎪⎪⎪⎪⎪⎪⎪⎪⎪⎪⎪⎪⎨⎪⎪⎪⎪⎪⎪⎪⎪⎪⎪⎪⎪⎩
κ(x) = 1
2θs
(α(x)
x+ ∂x1α(�x)
cosφ
)0,
γ (x) = 1
2θs
(α(x)
x− ∂x1α(�x)
cosφ
),
∂x1α(�x)
cosφ= ∂x2α(�x)
sinφ,
κ(x) + γ (x) = α(x)
θsx.
(79)
By integrating the deflection angle we obtain the lens potential ϕ(x):
ϕ(x) = 2κsθ2s h(x), (80)
where
h(x) ={
ln2 x2 − arcch2 1
x(x < 1),
ln2 x2 + arccos2 1
x(x ≥ 1).
(81)
The velocity dispersion σ(r) of this potential, computed with the Jeans equationfor an isotropic velocity distribution, gives an unrealistic central velocity dispersionσ(0) = 0. In order to compare the pseudo-elliptical NFW potential with other po-tentials, we define a scaling parameter vc (characteristic velocity) in terms of theparameters of the NFW profile as follows:
v2c = 8
3Gr2
s ρc. (82)
Using the value of the critical density for closure of the Universe ρcrit = 3H 20 /8πG,
we find
ρc
ρcrit= v2
c
H 20 r2
s
= 1.8 103h−2 ×(
rs
150 kpc
)−2(vc
2000 km s−1
)2
.
Lensing properties of the NFW model in a nutshell:

Astron Astrophys Rev (2011) 19:47 Page 91 of 100
Fig
.47
(Lef
t):C
ompa
riso
nof
the
mag
nitu
deof
first
flexi
ondu
eto
aN
FWan
da
SIS
halo
ofM
200
=1
×10
12h−1
M�
atre
dshi
ftz
lens
=0.
35.(
Rig
ht):
The
mag
nitu
deof
Fle
xion
2fo
ra
NFW
and
aSI
Sha
loof
M20
0=
1×
1012
h−1
M�,
whe
reth
edo
ublin
gin
scal
eof
the
angu
lar
sepa
ratio
nax
ishi
ghlig
hts
the
larg
erra
nge
and
ampl
itude
ofth
ese
cond
flexi
on(fi
gure
from
Bac
onet
al.2
006)

Page 92 of 100 Astron Astrophys Rev (2011) 19:47
• κ �= γ .• The tangential critical line is the Einstein ring radius, and the radial critical line is
a circle interior to the Einstein ring.• The central mass density is infinite, and the total mass is also infinite (however,
only the virial mass is of interest and that is calculable), and the central velocitydispersion is vanishing at the center.
A.4 Flexion for the singular isothermal sphere
For example, consider a Schwarzschild lens: the first flexion is by definition zeroeverywhere except at the origin, as the gradient of the convergence is zero every-where except at the origin. However, there is certainly “arciness” generated by such alens; this is described by the second flexion. We will provide explicit expressions forthe first and second flexion generated by the simple mass distribution of a singularisothermal sphere. The flexion caused by the SIS at an angular vector displacement,θ , from the lens center on the sky plane is thus simply
F = −[
θE
2θ2
]eiφ, (83)
where φ is the position angle around the lens, and in this case also gives the directionof the flexion. The first flexion F for this profile is therefore circularly symmetric and(expressed as a vector) directed radially inwards toward the lens center, as would beexpected.
Similarly, the second flexion G is
G = 3θE
2θ2e3iφ. (84)
This has a larger maximum amplitude than the first flexion for this lens profile, fadesoff with the same power law index away from the lens, and oscillates around the lensas a spin-3 quantity rather than a spin-1 quantity. For the explicit derivation of theflexion for more complicated density profiles, namely the softened isothermal sphereand the cosmologically motivated Navarro–Frenk–White profile, see Fig. 47 for acomparison as well as Bacon et al. (2006).
References
Abdelsalam H et al (1998a) Astron J 116:1541Abdelsalam HM, Saha P, Williams LLR (1998b) Mon Not R Astron Soc 294:734Ade PAR et al (2011) Astron Astrophys (in press). arXiv:1101.2024Aihara H et al (2011) Astrophys J Suppl Ser 195:26Allen SW (1998) Mon Not R Astron Soc 296:392Allen SW, Schmidt RW, Fabian AC (2001a) Mon Not R Astron Soc 328:L37Allen SW, Schmidt RW, Fabian AC (2002) Mon Not R Astron Soc 334:L11Allen SW, Schmidt RW, Ebeling H, Fabian AC, van Speybroeck L (2004) Mon Not R Astron Soc 353:457Altieri B et al (1999) Astron Astrophys 343:L65Altieri B et al (2010) Astron Astrophys 518:17Amanullah R et al (2010) Astrophys J 716:712

Astron Astrophys Rev (2011) 19:47 Page 93 of 100
Amanullah R, Goobar A, Clément B et al. (2011). arXiv:1109.4740Andersson K, Madejski G (2004) Astrophys J 607:190Avila-Reese V, Colin P, Piccinelli G, Firmani C (2003) Astrophys J 598:36Bacon D, Refregier A, Ellis RS (2000) Mon Not R Astron Soc 318:625Bacon DJ et al (2005) Mon Not R Astron Soc 363:723Bacon DJ, Goldberg DM, Rowe BTP, Taylor AN (2006) Mon Not R Astron Soc 365:414Bahcall J, Sarazin C (1977) Astrophys J 213:99Bardeau S, Kneib J-P, Czoske O, Soucail G, Smail I, Ebeling H, Smith GP (2005) Astron Astrophys
434:433Bardeau S, Soucail G, Kneib J-P, Czoske O, Ebeling H, Hudelot P, Smail I, Smith G (2007) Astron Astro-
phys 470:449Barger AJ et al (2002) Astron J 124:1839Barnothy JM (1965) Astrophys J 70:666Bartelmann M (1995) Astron Astrophys 303:643Bartelmann M et al (1996) Astrophys J 446:L115Bartelmann M, Huss A, Colberg J, Jenkins A, Pearce FR (1998) Astron Astrophys 330:1Bartelmann M, Meneghetti M, Perrotta F, Baccigalupi C, Moscardini L (2003) Astron Astrophys 409:449Bautz LP, Morgan WW (1970) Astrophys J 162:L149Bayliss M, Hennawi J, Gladders M, Koester B, Sharon K, Dahle H, Oguri M (2011) Astrophys J Suppl
Ser 193:8Berge J et al (2008) Mon Not R Astron Soc 385:695Berta S et al (2010) Astron Astrophys 518:30Bertin E, Arnouts S (1996) Astron Astrophys Suppl Ser 117:393Bezecourt J et al (1999) Astron Astrophys 347:21Binney J, Tremaine S (1987) Galactic dynamics. Princeton University Press, PrincetonBlain AW (1997) Mon Not R Astron Soc 290:553Blain AW (1998) MNPvAS 295:92Blain A (2002) Astrophys J Lett 570:51Blain A, Smail I, Ivison R, Kneib J-P, Frayer D (2002) Phys Res 369:111Blandford RD, Narayan R (1986) Astrophys J 310:568Blandford RD, Kochanek C, Kovner I, Narayan R (1989) Science 245:824Blumenthal GR, Faber SM, Primack J, Rees MJ (1984) Nature 311:517Blumenthal GR, Faber SM, Flores R, Primack J (1986) Astrophys J 301:27Boehringer H et al (2004) Astron Astrophys 425:367Bonnet H, Mellier Y, Fort B (1994) Astrophys J 427:83Boone F, Schaerer D, Pelló R, Combes F, Richard J (2007) Astron Astrophys 475:513Borys C et al (2004) Mon Not R Astron Soc 352:759Borys C et al (2005) ESASP 577:275Bradac M (2009) Nucl Phys B, Proc Suppl 194:17Bradac M, Lombardi M, Schneider P (2004) Astron Astrophys 424:13Bradac M, Schneider P, Lombardi M, Erben T (2005) Astron Astrophys 437:49Bradac M et al (2006) Astrophys J 652:937Bradac M et al (2008) Astrophys J 687:959Bradley LD et al (2008) Astrophys J 678:647Bradley LD et al. (2011) Preprint. arXiv:1104.2035Brainerd T, Blandford R, Smail I (1996) Astrophys J 466:623Bridle S et al (1998) Mon Not R Astron Soc 299:895Bridle S et al (2002) In: Natarajan P (ed) The shapes of galaxies and their dark halos, Yale cosmology
workshop. World Scientific, Singapore, p 38Bridle S et al (2010) Mon Not R Astron Soc 405:2044Broadhurst T, Benitez N, Coe D et al (2005) Astrophys J 621:53Broadhurst T, Umetsu K, Medezinski E, Oguri M, Rephaeli Y (2008) Astrophys J 685:L9Buote D, Canizares C (1996) Astrophys J 457:565Burke WL (1981) Astrophys J Lett 244:1Cabanac R et al (2007) Astron Astrophys 461:813Campusano LE, Pelló R, Kneib J-P, Le Borgne J-F, Fort B, Ellis R, Mellier Y, Smail I (2001) Astron
Astrophys 378:394Cavaliere A, Fusco-Femiano R (1978) Astron Astrophys 70:677

Page 94 of 100 Astron Astrophys Rev (2011) 19:47
Chang CL et al (2009) AIPC 1185:475Chapman S, Lewis G, Scott D, Borys C, Richards E (2002) Astrophys J 570:557Chapman S, Blain A, Smail I, Ivison R (2005) Astrophys J 622:772Chary R, Stern D, Eisenhardt P (2005) Astrophys J Lett 635:5Clement B et al (2011) Preprint. arXiv:1105.4072Clowe D, Schneider P (2001) Astron Astrophys 379:384Clowe D, Schneider P (2002) Astron Astrophys 395:385Clowe D, Luppino GA, Kaiser N, Henry JP, Gioia IM (1998) Astrophys J Lett 497:L61Clowe D, Gonzalez A, Markevitch M (2004a) Astrophys J 604:596Clowe D, De Lucia G, King L (2004b) Mon Not R Astron Soc 350:1038Clowe D, Bradac M, Gonzalez AH, Markevitch M, Randall S, Jones C, Zaritsky D (2006) Astrophys J
648:L109Coe D, Fuselier E, Benitez N, Broadhurst T, Frye B, Ford H (2008) Astrophys J 681:814Coe D et al (2010) Astrophys J 723:1678Coia D et al (2005a) Astron Astrophys 431:433Coia D et al (2005b) Astron Astrophys 430:59Collins CA, Burke DJ, Romer AK, Sharples RM, Nichol RC (1997) Astrophys J 479:L117Comerford J, Natarajan P (2007) Mon Not R Astron Soc 379:190Cooray AR (1999a) Astron Astrophys 341:653Cooray AR (1999b) Mon Not R Astron Soc 305:412Corless V, King L, Clowe D (2009) Mon Not R Astron Soc 393:1235Cowie LL, Barger AJ, Kneib J-P (2002) Astron J 123:2197Crittenden R, Natarajan P, Pen U, Theuns T (2001) Astrophys J 559:552Crittenden R, Natarajan P, Pen U, Theuns T (2002) Astrophys J 568:20Cypriano ES, Sodré LJ, Campusano LE, Kneib J-P, Giovanelli R, Haynes MP, Dale DA, Hardy E (2001)
Astron J 121:10Czoske O et al (2001) Astron Astrophys 372:391Daddi E et al (2000) Astron Astrophys 361:535Dahle H, Kaiser N, Irgens RJ, Lilje PB, Maddox SJ (2002) Astrophys J Suppl Ser 139:313Dalal N, Holder G, Hennawi J (2004) Astrophys J 609:50Dalal N, Hennawi JF, Bode P (2005) Astrophys J 622:99Dalal N, Dore O, Huterer D, Shirokov A (2008) Phys Rev D 77:123514D’Aloisio A, Natarajan P (2011a) Mon Not R Astron Soc 411:1628D’Aloisio A, Natarajan P (2011b) Mon Not R Astron Soc (in press). arXiv:1102.5097Dawson KS et al (2009) Astron J 138:1271Deb S, Goldberg D, Ramdass V (2008) Astrophys J 687:39Diego J, Protopapas P, Sandvik H, Tegmark M (2005a) Mon Not R Astron Soc 360:477Diego J, Sandvik H, Protopapas P, Tegmark M, Benitez N, Broadhurst T (2005b) Mon Not R Astron Soc
362:1247Diego J, Tegmark M, Protopapas P, Sandvik HB (2007) Mon Not R Astron Soc 375:958Diehl HT et al (2009) Astrophys J 707:686Dressler A (1980) Astrophys J 236:351Dye S, Warren S (2005) Astrophys J 623:31Ebbels T et al (1996) Mon Not R Astron Soc 281:L75Ebbels T et al (1998) Mon Not R Astron Soc 295:75Ebeling H et al (1996) Mon Not R Astron Soc 281:799Ebeling H et al (1998) Mon Not R Astron Soc 301:881Ebeling H et al (2000) Astrophys J 534:133Ebeling H et al (2001) Astrophys J 553:668Ebeling H, Barrett E, Donovan D (2004) Astrophys J 609:L49Ebeling H et al (2009) Mon Not R Astron Soc 395:1213Efstathiou G, Moody S, Peacock JA et al (2002) Mon Not R Astron Soc 330:L29Egami E et al (2005) Astrophys J Lett 618:5Egami E et al (2010) Astron Astrophys 518:12Eisenstein D et al (2005) Astrophys J 633:560Ellis R, Santos MR, Kneib J-P, Kuijken K (2001) Astrophys J Lett 560:L119Er X, Li G, Schneider P (2011) Astron Astrophys (in press). arXiv:1008.3088Erdl H, Schneider P (1993) Astron Astrophys 268:453

Astron Astrophys Rev (2011) 19:47 Page 95 of 100
Estrada J et al (2007) Astrophys J 660:1176Etherington I (1933) Philos Mag 15:761Fahlman G, Kaiser N, Squires G, Woods D (1994) Astrophys J 437:56Falco EE, Gorenstein MV, Shapiro II (1985) Astrophys J Lett 289:L1Fassbender R, Böhringer H, Santos J, Lamer G, Mullis C, Schuecker P, Schwope A, Rosati P (2008) In:
Conf proc relativistic astrophysics legacy and cosmology, ESO astrophysics symposia, p 307Fedeli C, Bartelmann M (2007) Astron Astrophys 461:49Fedeli C, Bartelmann M, Meneghetti M, Moscardini L (2008) Astron Astrophys 486:35Fedeli C, Meneghetti M, Gottlober S, Yepes G (2010) Astron Astrophys 519:A91Fischer P, Tyson JA (1997) Astron J 114:14Fort B et al (1992) Astrophys J 399:L125Franx M et al (1997) Astrophys J 486:L75Frayer D, Ivison R, Scoville N, Yun M, Smail I, Blain A, Kneib J-P (1998) Astrophys J 506:7Frye B, Broadhurst T (1998) Astrophys J Lett 499:L115Fu H, Stockton A (2008) Astrophys J 677:79Gal-Yam A, Maoz D, Sharon K (2002) Mon Not R Astron Soc 332:37Gautret L, Fort B, Mellier Y (2000) Astron Astrophys 353:10Gavazzi R (2005) Astron Astrophys 443:793Gavazzi R, Soucail G (2007) Astron Astrophys 462:459Gavazzi R, Fort B, Mellier Y, Pelló R, Dantel-Fort M (2003) Astron Astrophys 403:11Geiger B, Schneider P (1999) Mon Not R Astron Soc 302:118Gilbank D, Gladders M, Yee H, Hsieh B (2011) Astron J 141:94Gilmore J, Natarajan P (2009) Mon Not R Astron Soc 396:354Gioia IM, Shaya EJ, Le Fevre O, Falco EE, Luppino GA, Hammer F (1998) Astrophys J 497:573Gladders M (2002) PhD thesis, University of Toronto, Toronto, CanadaGladders M, Yee H (2005) Astrophys J Suppl Ser 157:1Gladders MD, Yee HKC, Ellingson E (2002) Astron J 123:1Gladders M, Hoekstra H, Yee HK, Hall PB, Barrientos L (2003) Astrophys J 593:48Gnedin O, Kravtsov AV, Klypin AA, Nagai D (2004) Astrophys J 616:16Goldberg D, Bacon D (2005) Astrophys J 619:741Goldberg D, Natarajan P (2002) Astrophys J 564:65Golse G, Kneib J-P (2002) Astron Astrophys 390:821Golse G, Kneib J-P, Soucail G (2002) Astron Astrophys 387:788Golse G, Kneib J-P, Soucail G (2004) Astron Astrophys 417:33Goobar A et al (2009) Astron Astrophys 507:71Gruen D, Bernstein GM, Lam TY, Seitz S (2011) Mon Not R Astron Soc 416:1392Gull S, Northover KJE (1976) Nature 283:572Gunnarsson C, Goobar A (2003) Astron Astrophys 405:859Halkola A, Seitz S, Pannella M (2006) Mon Not R Astron Soc 372:1425Hamana T, Takada M, Yoshida N (2004) Mon Not R Astron Soc 350:893Hand N et al (2011) Astrophys J 736:39Hennawi J, Dalal N, Bode P, Ostriker J (2007) Astrophys J 654:714Hennawi J et al (2008) Astron J 135:664Hetterscheidt M, Erben T, Schneider P (2005) Baryons in dark matter halosHeymans C et al (2006) Mon Not R Astron Soc 371:60Hincks AD et al (2010) Astrophys J Suppl Ser 191:423Hoekstra H (2007) Mon Not R Astron Soc 379:317Hoekstra H, Franx M, Kuijken K (2000) Astrophys J 532:88Hoekstra H, Franx M, Kuijken K, van Dokkum PG (2002) Mon Not R Astron Soc 333:911Hoekstra H et al (2006) Astrophys J 647:116Hoessl JG, Gunn JE, Thuan TX (1980) Astrophys J 241:486Horesh A, Ofek E, Maoz D, Bartelmann M, Meneghetti M, Rix H-W (2005) Astrophys J 633:768Horesh A, Maoz D, Ebeling H, Seidel G, Bartelmann M (2010) Mon Not R Astron Soc 406:1318Hu E et al (2002) Astrophys J 586:L75Hubble EP (1929) Leafl, Astron Soc Pac 1:93Hubble E (1931) Astrophys J 74:43Huterer D, White M (2002) Astrophys J Lett 578:L95Irgens RJ, Lilje PB, Dahle H, Maddox SJ (2002) Astrophys J 579:227

Page 96 of 100 Astron Astrophys Rev (2011) 19:47
Ivison R et al (1998) MNPvAS 298:583Ivison R et al (2002) Mon Not R Astron Soc 337:1Jauzac A et al. (2011) submittedJee MJ, White RL, Benítez N, Ford HC, Blakeslee JP, Rosati P, Demarco R, Illingworth GD (2005) Astro-
phys J 618:46Joffre M et al (2000) Astrophys J Lett 534:L131Jorgensen I, Franx M, Kjaergaard P (1996) Mon Not R Astron Soc 280:167Jullo E, Kneib J-P (2009) Mon Not R Astron Soc 395:1319Jullo E, Kneib J-P, Limousin M, Elíasdóttir Á, Marshall PJ, Verdugo T (2007) New J Phys 9:447Jullo E, Natarajan P, Kneib J-P, D’Alosio A, Limousin M, Richard J, Schimd C (2010) Science 329:924Kaiser N (1986) Mon Not R Astron Soc 222:323Kaiser N (1992) Astrophys J 388:272Kaiser N (1995) Astrophys J Lett 439:L1Kaiser N, Squires G (1993) Astrophys J 404:441Kaiser N et al (1995) Astrophys J 449:460Kaiser N et al (1998) A photometric and weak lensing analysis of the z = 0.42 supercluster MS0302+17.
astro-ph/9809268Kaiser N, Wilson G, Luppino G (2000) Preprint. arXiv:astro-ph/0003338Kassiola A, Kovner I (1993) Astrophys J 417:450Kassiola A et al (1992) Astrophys J 400:41. (1997) Astron Astrophys Suppl Ser 122:471King LJ, Schneider P (2001) Astron Astrophys 369:1King LJ, Schneider P, Springel V (2001) Astron Astrophys 378:748King LJ, Clowe DI, Schneider P (2002) Astron Astrophys 383:118Kitching TD, Miller L, Heymans C, van Waerbeke L, Heavens AF (2008) Mon Not R Astron Soc 390:149Kitching T, Heavens A, Miller L (2011) Mon Not R Astron Soc 413:2923Kneib J-P (1993) PhD thesis, Universite Paul Sabatier, Toulouse, FranceKneib J-P, Mellier Y, Fort B, Mathez G (1993) Astron Astrophys 273:367Kneib J-P, Melnick J, Gopal-Krishna (1994) Astron Astrophys 290:L25Kneib J-P, Ellis RS, Smail I, Couch WJ, Sharples RM (1996) Astrophys J 471:643Kneib J-P et al (2003) Astrophys J 598:804Kneib J-P, Ellis RS, Santos MR, Richard J (2004) Astrophys J 607:697Kneib J-P, Neri R, Smail I, Blain A, Sheth K, van der Werf P, Knudsen K (2005) Astron Astrophys 434:819Kneib J-P et al (2011) in preparationKnudsen K et al (2005) Astrophys J 632:9Knudsen K, van der Werf P, Kneib J-P (2008) Mon Not R Astron Soc 384:1611Knudsen K, Kneib J-P, Richard J, Petitpas G, Egami E (2010) Astrophys J 709:210Kochanek CS (1990) Mon Not R Astron Soc 247:135Kochanek C, Apostolakis J (1988) Mon Not R Astron Soc 235:1073Kochanek C et al (1995) Astrophys J 445:549Kodama T, Smail I, Nakata F, Okamura S, Bower RG (2002) ASPC 268:301Kolatt TS, Bartelmann M (1998) Mon Not R Astron Soc 296:763Komatsu E, Spergel DN (2001) Phys Rev D 63:063002Komatsu E et al (2011) Astrophys J Suppl Ser 192:18Kovner I, Paczynski B (1988) Astrophys J Lett 335:L9Kubo JM et al (2009) Astrophys J Lett 702:110Kuijken K (1999) Astron Astrophys 352:355Laporte N et al (2011) Astron Astrophys 531:74Lea S, Silk J, Kellogg E, Murray S (1973) Astrophys J Lett 184:L105Leauthaud A et al (2010) Astrophys J Lett 709:97Leauthaud A et al. (2011) Preprint. arXiv:1104.0928Leir A, van den Bergh S (1977) Astrophys J Suppl Ser 34:381Lemaître G (1931) Mon Not R Astron Soc 91:483Lemoine-Busserolle M, Contini T, Pelló R, Le Borgne J-F, Kneib J-P, Lin C (2003) Astron Astrophys
397:839Lemze D, Barkana R, Broadhurst T, Rephaeli Y (2008) Mon Not R Astron Soc 386:1092Leonard A, King L (2010) Mon Not R Astron Soc 405:1854Leonard A, King L, Goldberg D (2011) Mon Not R Astron Soc 413:789Lewis J, Smail I, Couch W (2000) Astrophys J 528:118

Astron Astrophys Rev (2011) 19:47 Page 97 of 100
Li G, Mao S, Jing Y-P, Bartelmann M, Kang X, Meneghetti M (2005) Astrophys J Lett 635:795Liesenborgs J, de Rijcke S, Dejonghe H, Bekaert P (2007) Mon Not R Astron Soc 380:1729Limousin M, Kneib J, Natarajan P (2005) Mon Not R Astron Soc 356:309Limousin M, Kneib J-P, Bardeau S, Natarajan P, Czoske O, Smail EH, Smith G (2007) Astron Astrophys
461:881Limousin M et al (2008) Astron Astrophys 489:23Limousin M et al (2009) Astron Astrophys 502:445Limousin M et al (2010) Astron Astrophys 524:95Limousin M et al (2011) Astron Astrophys (submitted). arXiv:1109.3301Link R, Pierce M (1998) Astrophys J 502:63Loeb A, Mao S (1994) Astrophys J Lett 435:L109Lombardi M, Bertin G (1998) Astron Astrophys 335:1Lombardi M et al (2005) Astrophys J 623:42Lo Verde M, Miller A, Shandera S, Verde L (2008) J Cosmol Astropart Phys 4:14Luppino GA, Gioia IM (1992) Astron Astrophys 265:L9Luppino GA, Kaiser N (1997) Astrophys J 475:20Luppino GA, Gioia IM, Hammer F, Le Fèvre O, Annis JA (1999) Astron Astrophys Suppl Ser 136:117Lynds R, Petrosian V (1989) Astrophys J 336:L1Maccio A (2005) Mon Not R Astron Soc 361:1250Madhavi A, Hoekstra H, Babul A, Henry JP (2008) MNPvAS 384:1567Mahdavi A, Hoekstra H, Babul A, Balam D, Capak P (2007) Mon Not R Astron Soc 380:437Mandelbaum R et al (2005) Mon Not R Astron Soc 361:1287Mandelbaum R, Seljak U, Kauffmann G, Hirata C, Brinkmann J (2006) Mon Not R Astron Soc 368:715Mandelbaum R, Seljak U, Baldauf T, Smith R (2010) Mon Not R Astron Soc 405:2078Markevitch M, Gonzalez A, David L, Vikhlinin A, Murray S, Forman W, Jones C, Tucker W (2002)
Astrophys J Lett 567:27Marriage T et al (2011) Astrophys J 732:44Marrone D et al. (2011) Preprint. arXiv:1107.5115Marshall P (2003) PhD thesis, University of Cambridge, UKMarshall P (2006) Mon Not R Astron Soc 372:1289Marshall P, Hobson M, Gull S, Bridle S (2002) Mon Not R Astron Soc 335:1037Massey R (2010) Mon Not R Astron Soc 409:109Massey R et al (2007) Mon Not R Astron Soc 376:13Matarrese S, Verde L, Jimenez R (2000) Mon Not R Astron Soc 316:283Maturi M, Bartelmann M, Meneghetti M, Moscardini L (2005) Astron Astrophys 436:37Mellier Y et al (1993) Astrophys J 407:33Meneghetti M, Bartelmann M, Moscardini L (2003a) Mon Not R Astron Soc 340:105Meneghetti M, Bartelmann M, Moscardini L (2003b) Mon Not R Astron Soc 346:67Meneghetti M, Jain B, Bartelmann M, Dolag K (2005a) Mon Not R Astron Soc 362:1301Meneghetti M, Bartelmann M, Dolag K, Perrotta F, Baccigalupi C, Moscardini L, Tormen G (2005b) New
Astron Rev 49:111Meneghetti M, Fedeli C, Pace F, Gottloeber S, Yepes G (2010) Astron Astrophys 519:A90Meneghetti M, Fedeli C, Zitrin A, Bartelmann M, Broadhurst T, Gottloeber S, Moscardini L, Yepes G
(2011) Astron Astrophys 530:17Metcalfe L et al (2003) Astron Astrophys 407:791Metzler CA, White M, Norman M, Loken C (1999) Astrophys J Lett 520:L9Metzler CA, White M, Loken C (2001) Astrophys J 547:560Miller L, Kitching TD, Heymans C, Heavens AF, van Waerbeke L (2007) Mon Not R Astron Soc 382:315Miralda-Escudé J (1991) Astrophys J 370:1Miralda-Escudé J (1995) Astrophys J 438:514Miralda-Escudé J (2002) Astrophys J 564:60Miralda-Escudé J, Babul A (1995) Astrophys J 449:18Miralda-Escudé J, Fort B (1993) Astrophys J Lett 417:L5Moore B et al (1998) Astrophys J 499:L5Morales M (2006) Astrophys J Lett 650:21Moran S et al (2006) Astrophys J 641:L97Morandi A, Pedersen K, Limousin M (2010) Astron Astrophys 527:124Narayan R, Blandford R, Nityananda R (1984) Nature 310:112

Page 98 of 100 Astron Astrophys Rev (2011) 19:47
Narasimha D, Chitre SM (1988) Astrophys J 332:75Natarajan P, Kneib J-P (1996) Mon Not R Astron Soc 283:1031Natarajan P, Kneib J-P (1997) Mon Not R Astron Soc 287:833Natarajan P, Springel V (2004) Astrophys J 617:L13Natarajan P, Kneib J, Smail I, Ellis RS (1998) Astrophys J 499:600Natarajan P, Kneib J, Smail I (2002a) Astrophys J Lett 580:L11Natarajan P, Loeb A, Kneib J-P, Smail I (2002b) Astrophys J Lett 580:L17Natarajan P, DeLucia G, Springel V (2007) Mon Not R Astron Soc 376:180Natarajan P, Kneib J-P, Smail I, Treu T, Ellis RS, Moran S, Limousin M, Czoske O (2009) Astrophys J
693:970Navarro J, Frenk C, White S (1997) Astrophys J 490:493Navarro J et al (2010) Mon Not R Astron Soc 402:21Neri R et al (2003) Astrophys J Lett 597:113Newman A, Treu T, Ellis R, Sand D (2011) Astrophys J Lett 728:39Oguri M, Blandford RD (2009) Mon Not R Astron Soc 392:930Oguri M et al (2009) Astrophys J 699:1038Oguri M, Takada M, Okabe N, Smith G (2010) Mon Not R Astron Soc 405:2215Okabe N, Zhang Y, Finoguenov A, Takada M, Smith G, Umetsu K, Futamase T (2010) Astrophys J
721:875Okura Y, Umetsu K, Futamase T (2008) Astrophys J 680:1Ono T, Masai K, Sasaki S (1999) Publ Astron Soc Jpn 51:91Orban de Xivry G, Marshall P (2009) Mon Not R Astron Soc 399:2Ota N, Mitsuda K, Fukazawa Y (1998) Astrophys J 495:170Ota N, Pointecouteau E, Hattori M, Mitsuda K (2004) Astrophys J 601:120Paczynski B (1987) Nature 325:572Paczynski B, Gorski K (1981) Astrophys J 248:L101Paraficz D et al (2011) in preparationPelló R, Sanahuja B, Le Borgne J, Soucail G, Mellier Y (1991) Astrophys J 366:405Pelló R et al (1999) Astron Astrophys 346:359Pelló R et al (2001) Astrophys Space Sci Suppl 277:547Peng E-H, et al (2009) Astrophys J 701:1283. doi:10.1088/0004-637X/701/2/1283Perlmutter S et al (1999) Astrophys J 517:565Pettini M, Steidel CS, Adelberger K, Dickinson M, Giavalisco M (2000) Astrophys J 528:96Pettini M, Rix S, Steidel C, Hunt M, Shapley A, Adelberger K (2002) Astrophys Space Sci 281:461Pierre M et al (2007) Mon Not R Astron Soc 382:278Pires S, Starck J-L, Amara A, Teyssier R, Refregier A, Fadili J (2009) Mon Not R Astron Soc 395:1265Plagge T et al (2010) Astrophys J 716:1118Postman M et al (2011) arXiv:1106.3328Pyne T, Birkinshaw M (1996) Astrophys J 458:46Refregier A (2003) Mon Not R Astron Soc 338:35Refregier A, Bacon D (2003) Mon Not R Astron Soc 338:48Refsdal S (1964a) Mon Not R Astron Soc 128:295Refsdal S (1964b) Mon Not R Astron Soc 128:307Richard J, Pello R, Scharer D, Le Borgne J-F, Kneib J-P (2006) Astron Astrophys 456:861Richard J, et al (2008) Astrophys J 685:705Richard J, Pei L, Limousin M, Jullo E, Kneib J-P (2009) Astron Astrophys 498:37Richard J et al (2010) Mon Not R Astron Soc 404:325Richard J et al (2011) Mon Not R Astron Soc 414:L31Riemer-Sorensen S, Paraficz D, Ferreira DDM, Pedersen K, Limousin M, Dahle H (2009) Astrophys J
693:1570Riess A et al (1998) Astron J 116:1009Rix HW et al (1997) Astrophys J 448:702Rhodes J et al (2000) Astrophys J 536:79Romano A et al (2010) Astron Astrophys 514:88Romer K (2008) In: Conf proc “The X-ray Universe 2008”, Granada, Spain, p 200Rosati P, Stanford A, Lidman C, Mainieri V, Eisenhardt P (2001) In: Cristiani S, Renzini A, Williams RE
(eds) Conf proc “Deep Fields” ESO workshop, Garching, Germany, p 179Rozo E et al (2010) Astrophys J 708:645

Astron Astrophys Rev (2011) 19:47 Page 99 of 100
Rykoff E et al (2008) Astrophys J 675:1106Saha P, Williams LLR (1997) Mon Not R Astron Soc 292:148Salvaterra R, Ferrara A, Dayal P (2011) Mon Not R Astron Soc 414:847Sand D et al (2002) Astrophys J 574:L129Sand DJ, Treu T, Smith GP, Ellis RS (2004) Astrophys J 604:88Sand D, Treu T, Ellis R, Smith G (2005) Astrophys J 627:32Sand D, Treu T, Ellis RS, Smith GP, Kneib J-P (2008) Astrophys J 674:711Sandage A (1976) Astrophys J 205:6Santos M, Ellis R, Kneib J-P, Richard J, Kuijken K (2004) Astrophys J 606:683Schaerer D et al (2007) Astron Astrophys 476:97Scharf CA, Jones LR, Ebeling H, Perlman M, Malkan M, Wegner G (1997) Astrophys J 477:79Schneider P (1984) Astron Astrophys 140:119Schneider P (1995) Mon Not R Astron Soc 302:639Schneider P, Bartelmann M (1997) Mon Not R Astron Soc 286:696Schneider P, Ehlers J, Falco E (1992) Gravitational lenses. Springer, BerlinSchneider P et al (2000) Astron Astrophys 353:41Seitz C, Schneider P (1995) Astron Astrophys 297:287Seitz S, Schneider P (1996) Astron Astrophys 305:383Seitz S, Saglia R, Bender R, Hopp U, Belloni P, Ziegler B (1998) Mon Not R Astron Soc 298:945Seljak U et al (2005) Phys Rev D 71:103515Semboloni E et al (2006) Astron Astrophys 452:51Sereno M (2002) Astron Astrophys 393:757Sereno M, Longo G (2004) Mon Not R Astron Soc 354:1255Serlemistos PJ, Smith BW, Boldt EA, Holt SS, Swank JH (1977) Astrophys J 211:L63Shan H-Y, Kneib J-P, Tao C et al (2011) Astrophys J (submitted). arXiv:1108.1981Sharon K, Gal-Yam A, Maoz D et al (2010) Astrophys J 718:876Sheldon ES et al (2001) Astrophys J 554:881Sheth K, Blain A, Kneib J-P, Frayer D, van der Werf P, Knudsen K (2004) Astrophys J Lett 614:5Smail I, Dickinson M (1995) Astrophys J Lett 455:L99Smail I, Couch WJ, Ellis RS, Sharples RM (1995) Astrophys J 440:501Smail I, Ivison RJ, Blain AW (1997) Astrophys J Lett 490:L5Smail I et al (1998) Astrophys J 507:L21Smail I, Ivison R, Blain A, Kneib J-P (2002) Mon Not R Astron Soc 331:495Smail I et al (2007) Astrophys J Lett 654:33Smith GP, Kneib J-P, Ebeling H, Czoske O, Smail I (2001) Astrophys J 552:493Smith GP et al (2002a) Mon Not R Astron Soc 330:1Smith GP, Smail I, Kneib J-P, Davis CJ, Takamiya M, Ebeling H, Czoske O (2002b) Mon Not R Astron
Soc 333:L16Smith GP, Edge AC, Eke VR, Nichol RC, Smail I, Kneib J-P (2003) Astrophys J Lett 590:L79Smith GP, Kneib J-P, Smail I, Mazzotta P, Ebeling H, Czoske O (2005) Mon Not R Astron Soc 359:417Smith GP et al (2009) Astrophys J 707:L163Smith GP et al (2010) Mon Not R Astron Soc 409:169Soucail G et al (1987) Astron Astrophys 172:L14Soucail G, Mellier Y, Fort B, Mathez G, Cailloux M (1988) Astron Astrophys 199:13Soucail G, Kneib J-P, Bézecourt J, Metcalfe L, Altieri B, Le Borgne J-F (1999) Astron Astrophys 343:L70Soucail G, Kneib J-P, Golse G (2004) Astron Astrophys 417:L33Spergel DN et al (2003) Astrophys J Suppl Ser 148:175Springel V et al (2005) Nature 435:629Stanishev V et al (2009) Astron Astrophys 507:61Starck J-L, Piers S, Refregier A (2006) Astron Astrophys 451:1139Stark D, Ellis R, Richard J, Kneib J-P, Smith G, Santos M (2007) Astrophys J 663:10Steidel C, Giavalisco M, Dickinson M, Adelberger K (1996) Astron J 112:352Sullivan M, Ellis R, Nugent P, Smail I, Madau P (2000) Mon Not R Astron Soc 319:549Suyu S, Halkola A (2010) 524:94Suyu S, Marshall P, Hobson M, Blandford R (2006) Mon Not R Astron Soc 371:983Swinbank A et al (2007) Mon Not R Astron Soc 376:479Swinbank AM et al (2010) Nature 464:733Thanjavur K, Willis J, Crampton D (2011) Astrophys J 706:571

Page 100 of 100 Astron Astrophys Rev (2011) 19:47
Thom (1989) Structural stability and morphogenesis: an outline of a general theory of models. Addison-Wesley, Reading. ISBN 0-201-09419-3
Thompson RI et al (1999) Astron J 117:17Treu T et al (2002) ASPC 268:277Treu T et al (2003) Astrophys J 591:53Tu H, Limousin M, Fort B, Shu CG, Sygnet JF, Jullo E, Kneib J-P, Richard J (2008) Mon Not R Astron
Soc 386:1169Tyson JA, Wenk RA, Valdes F (1990) Astrophys J Lett 349:L1Umetsu K, Broadhurst T, Zitrin A, Medezinski E, Hsu L-Y (2011) Astrophys J 729:127van Albada T, Bahcall JN, Begeman K, Sancisi R (1985) Astrophys J 295:305van Waerbeke L et al (2000) Astron Astrophys 358:30Vanderlinde K et al (2010) Astrophys J 722:1180Vikhlinin A et al (2009) Astrophys J 692:1060Walsh D, Carswell RF, Weymann RJ (1979) Nature 279:381Wambsganss J, Bode P, Ostriker J (2004) Astrophys J Lett 606:93Wang J, White SDM (2009) Mon Not R Astron Soc 396:709Weinberg NN (1992) Mon Not R Astron Soc 254:315White SDM et al (2005) Astron Astrophys 444:365Williams LLR, Navarro JF, Bartelmann M (1999) Astrophys J 527:535Willis J, Courbin F, Kneib J-P, Minniti D (2008) Mon Not R Astron Soc 384:1039Wilson G, Cole S, Frenk CS (1996) Mon Not R Astron Soc 280:199Wittman D, Tyson JA, Kirkman D, Dell’Antonio I, Bernstein G (2000) Nature 405:143Wittman D et al (2001) Astrophys J 557:L89Wittman D, Margoniner VE, Tyson JA, Cohen JG, Becker AC, Dell’Antonio IP (2003) Astrophys J
597:218Wright C, Brainerd T (2000) Astrophys J 534:34Wyithe S, Oh P, Pindor B (2011) Mon Not R Astron Soc 414:209Yee H, Ellingson E, Bechtold J, Carlberg R, Cuillandre J-C (1996) Astron J 111:1783Young P, Gunn JE, Oke JB, Westphal JA, Kristian J (1980) Astrophys J 241:507Zappacosta L, Buote DA, Gastaldello F, Humphrey PJ, Bullock J, Brighenti F, Mathews W (2006) Astro-
phys J 650:777Zaritsky D, Gonzalez AH (2003) Astrophys J 584:691Zeeman (1977) Catastrophe theory—selected papers 1972–1977. Addison-Wesley, ReadingZhang Y, Finoguenov A, Bohringer H, Kneib J-P, Smith G, Czoske O, Soucail G (2007) Astron Astrophys
467:437Zhang Y et al (2010) Astrophys J 711:1033. doi:10.1088/0004-637X/711/2/1033Zitrin A et al (2010) Mon Not R Astron Soc 408:1916Zitrin A, Broadhurst T, Barkana R, Rephaeli Y, Benítez N (2011a) Mon Not R Astron Soc 410:1939Zitrin A, Rosati P, Nonino M et al (2011b). arXiv:1107.2649Zitrin A, Broadhurst T, Coe D et al (2011c). arXiv:1103.5618Zwicky F (1933) Helv Phys Acta 6:110Zwicky F (1937) Astrophys J 86:217