mapping substructure in the hst frontier fields cluster ... · mapping substructure in the hst...
TRANSCRIPT

MNRAS 000, 1–?? (0000) Preprint 28 February 2017 Compiled using MNRAS LATEX style file v3.0
Mapping substructure in the HST Frontier Fields cluster lenses andin cosmological simulations
Priyamvada Natarajan1?, Urmila Chadayammuri1, Mathilde Jauzac2,3,4, Johan Richard5,Jean-Paul Kneib6, Harald Ebeling7, Fangzhou Jiang1,8, Frank van den Bosch1,Marceau Limousin9, Eric Jullo9, Hakim Atek1,10, Annalisa Pillepich11, Cristina Popa12,Federico Marinacci13, Lars Hernquist11, Massimo Meneghetti14 and Mark Vogelsberger13
1Department of Astronomy, 52 Hillhouse Avenue, Steinbach Hall, Yale University, New Haven, CT 06511, USA2 Centre for Extragalactic Astronomy, Department of Physics, Durham University, Durham DH1 3LE, U.K.3Institute for Computational Cosmology, Durham University, South Road, Durham DH1 3LE, U.K.4Astrophysics and Cosmology Research Unit, School of Mathematical Sciences, University of KwaZulu-Natal, Durban 4041, South Africa5CRAL, Observatoire de Lyon, Universite Lyon 1, 9 Avenue Ch. Andre, 69561 Saint Genis Laval Cedex, France6Laboratoire d’Astrophysique, Ecole Polytechnique Federale de Lausanne (EPFL), Observatoire de Sauverny, CH-1290 Versoix, Switzerland7Institute for Astronomy, University of Hawaii, 2680 Woodlawn Drive, Honolulu, Hawaii 96822, USA8The Hebrew University, Jerusalem 91904, Israel9Laboratoire d’Astrophysique de Marseille - LAM, Universite d’Aix-Marseille & CNRS, UMR7326, 38 rue F. Joliot-Curie, 13388 Marseille Cedex 13, France10Institut d’Astrophysique de Paris, 98 bis bd Arago, F-75014 Paris, France11Harvard-Smithsonian Center for Astrophysics, 60 Garden Street, Cambridge, MA 02138, USA12Physics Department, Harvard University, Cambridge, MA, 0213813Department of Physics, Kavli Institute for Astrophysics and Space Research, Massachusetts Institute of Technology, Cambridge, MA 02139, USA14Osservatorio Astronomico di Bologna, INAF, via Ranzani 1, 40127, Bologna, Italy
00 Jul 2016
ABSTRACTWe map the lensing-inferred substructure in the first three clusters observed by the HubbleSpace Telescope Frontier Fields Initiative (HSTFF): Abell 2744 (z=0.308), MACSJ 0416,(z=0.396) and MACSJ 1149 (z=0.543). Statistically resolving dark-matter subhaloes downto ∼109.5 M�, we compare the derived subhalo mass functions (SHMFs) to theoretical pre-dictions from analytical models and with numerical simulations in a Lambda Cold Dark Mat-ter (LCDM) cosmology. Mimicking our observational cluster member selection criteria inthe HSTFF, we report excellent agreement in both amplitude and shape of the SHMF overfour decades in subhalo mass (109−13 M�). Projection effects do not appear to introducesignificant errors in the determination of SHMFs from simulations. We do not find evidencefor a substructure crisis, analogous to the missing satellite problem in the Local Group, oncluster scales, but rather excellent agreement of the count-matched HSTFF SHMF down toMsubhalo/Mhalo∼10−5. However, we do find discrepancies in the radial distribution of subhaloes inferred from HSTFF cluster lenses compared to determinations from simulated clus-ters. This suggests that although the selected simulated clusters match the HSTFF sample inmass, they do not adequately capture the dynamical properties and complex merging mor-phologies of these observed cluster lenses. Therefore, HSTFF clusters are likely observed ina transient evolutionary stage that is presently insufficiently sampled in cosmological simula-tions. The abundance and mass function of dark matter substructure in cluster lenses continuesto offer an important test of the LCDM paradigm, and at present we find no tension betweenmodel predictions and observations.
Key words: cosmology: theory, dark matter, large scale structure of the Universe, galaxies:haloes, galaxies: clusters: general galaxies: substructure
? E-mail: [email protected]
1 INTRODUCTION
While the bulk of the matter content of our Universe is inventoriedto be dark matter – cold, collisionless particles that drive the for-
c© 0000 The Authors
arX
iv:1
702.
0434
8v2
[as
tro-
ph.G
A]
26
Feb
2017

2 Natarajan, et al.
mation of all observed structure – its nature remains elusive. Fortu-nately, observational cosmology provides us with luminous probesthat nonetheless enable us to map dark matter on a range of scales,namely galaxies that reside at the centers of dark-matter halos. Thegravitational influence exerted by dark matter, as reflected dynam-ically (in the motions of stars in a galaxy or galaxies in a cluster)and in the deflection of light rays from distant sources, yields in-sights into its spatial distribution and role in structure formation inthe universe. In particular gravitational lensing offers a unique andpowerful probe of the detailed distribution of dark matter, as it isachromatic and independent of the dynamical state of the objectproducing the lensing. Lensing of faint, distant background galax-ies by clusters of galaxies, the most recently assembled massivestructures that are extremely dark-matter dominated (∼90% of theircontent), results in dramatic observational effects that can be stud-ied in two regimes. Strong lensing – which creates highly distorted,magnified and occasionally multiple images of a single source –and weak lensing – which results in modestly yet systematically de-formed shapes of background galaxies – provide robust constraintson the projected distribution of dark matter within lensing clus-ters (Natarajan & Kneib 1997; Bradac et al. 2005; Limousin et al.2007b; Merten et al. 2009; Umetsu et al. 2016). Lensing by clus-ters has many other applications, as it allows, in combination withmulti-wavelength data, studies of the masses and assembly historyof clusters (Clowe et al. 2004; Merten et al. 2011; Eckert et al.2015), and probes faint, distant galaxy populations that would oth-erwise be inaccessible to observation. The luminosity function ofgalaxies at very high redshift derived from lensing has been instru-mental for studies of the re-ionization of the universe; for a statusreport see the review by Finkelstein (2015) and references therein;as well as recent results in Bradac et al. (2014); Atek et al. (2014);Bouwens et al. (2014); Coe et al. (2015); Laporte et al. (2015);McLeod et al. (2016). In addition, cosmography – mapping the ge-ometry of the universe – has been demonstrated to be another pow-erful application of gravitational lensing that provides constraintson dark energy complementary to those from other probes (Julloet al. 2010; D’Aloisio & Natarajan 2011; Caminha et al. 2015). Ex-ploiting strong gravitational lensing, we here present a test of thecurrently accepted Lambda Cold Dark Matter (LCDM) paradigmand its implementation in cosmological simulations from the abun-dance and properties of substructure in massive clusters.
The high-resolution of the imaging cameras aboard the Hub-ble Space Telescope (HST) has transformed this field in the lasttwo decades (detailed in a review by Kneib & Natarajan 2011), al-lowing the secure identification of multiply imaged systems thatprovide critical constraints on the mass model, from deep imagingdata. While data from the Advanced Camera for Surveys (ACS) andthe Wide-Field Planetary Camera-2 (WFPC-2) tremendously ad-vanced early studies of gravitational lensing by clusters comparedto groundbased work, HST’s on-going Frontier Fields (HSTFF)programme has truly revolutionized this area of research (Lotz2015). As part of the HSTFF program six clusters ranging in red-shift from z=0.3 to 0.55 have been selected for a total of 140 orbitobservations per cluster with the ACS in the F435W, F606W, andF814W, as well as with WFC3/IR in the F105W, F125W, F140W,and F160W passbands. In addition to these multi-filter data, coor-dinated observational efforts in other wavelengths with dedicatedSpitzer and Chandra programs coupled with ground-based spec-troscopic follow-up of cluster galaxies and lensed images are in
the process of compiling exquisite and comprehensive data sets forthese cluster lenses.1
In this paper, we study the detailed distribution of substructurederived directly from mass models constrained by more than a hun-dred lensed images each gleaned from the HSTFF imaging data forAbell 2744, MACSJ 0416.1–2403 (hereafter MACSJ 0416; Mann& Ebeling 2012) and 65 images for MACSJ 1149.5+2223 (here-after MACSJ 1149; Ebeling et al. 2010). These three clusters, span-ning a redshift range 0.308-0.554, also represent various stages ofcluster mass assembly. All three clusters have complex mass distri-butions involving the on-going merger of several sub-components(Jauzac et al. 2014; Lam et al. 2014; Diego et al. 2015; Wang et al.2015; Jauzac et al. 2015b; Medezinski et al. 2016; Jauzac et al.2016). Merging clusters with complex interaction geometries likein these three cases turn out to be more efficient as lenses comparedto relaxed clusters, as they generate a larger number of multiplylensed systems (Owers et al. 2011; Wong et al. 2012, 2013). Whilelensing is independent of the dynamical state of the cluster, the ef-ficiency of lensing is enhanced when sub-clusters merge due to theresultant higher surface mass densities produced (Natarajan et al.1998; Torri et al. 2004). The positions, magnitudes and multiplici-ties of lensed images provide strong constraints for the mass mod-eling of cluster lenses. In addition, to calibrate the strength of thelensing signal, the redshifts of the images need to be known eitherspectroscopically or photometrically. In the case of highly magni-fied objects the HSTFF filter set choice provides photometric red-shifts with reasonable accuracy. Follow-up spectroscopy by severalindependent groups has been on-going for the bright, highly mag-nified multiple images in these clusters as well as for faint objectswith GTO/MUSE observations for Abell 2744 and MACSJ 0416.In this paper, we present the best-to-date model for the mass distri-bution in these three clusters from which we derive properties of thedark matter substructure content. The inferred substructure - alsoreferred to as the subhalo mass function (SHMF thereafter) - is thencompared with mimicked ”measurements” from simulated clustersin the Illustris cosmological boxes (Vogelsberger et al. 2014a, de-tails are available at http://www.illustris-project.org/); as well asanalytic estimates that take halo-to-halo scatter into account. Thisexercise offers a concrete and powerful test of the standard LCDMmodel, its implementation in cosmological simulations and our an-alytic calculational framework.
The motivation for this entire exercise is to carefully examineif any gaps emerge between theoretical predictions in LCDM andthe observationally inferred degree of substructure. Earlier work onlower mass scales - namely galaxy scales - had claimed a crisis inLCDM due to the discrepancy in abundance between predicted andobserved substructure (Moore et al. 1999; Klypin et al. 1999). Con-vincing resolutions to this ”crisis” have since been proposed, thatimplicate the paucity of observed substructures to their intrinsicfaintness as well as our lack of understanding of the efficiency ofstar formation in the smallest dark-matter haloes (Read & Gilmore2005; Pontzen & Governato 2014; Di Cintio & Lelli 2016; Wet-zel et al. 2016) reflecting our ignorance of the detailed relationshipbetween baryons and dark matter. Alternative, less persuasive ex-planations for the mismatch challenging the collisionless nature ofdark matter have also been proposed (Rocha et al. 2013; Lovellet al. 2014). Given that LCDM is a hierarchical theory it is imper-ative to explore if any such discrepancy is replicated on the next
1 For further details see http://www.stsci.edu/hst/campaigns/frontier-fields/
MNRAS 000, 1–?? (0000)

Substructure in HSTFF clusters 3
higher mass scale, on that of clusters. For this purpose, the HSTFFdata-set offers unique leverage due to the large range in the SHMFthat it permits scrutiny of. Utilizing strong lensing to reconstruct thedetailed mass distribution of clusters, here we present the detailedsubstructure distribution in the first three HSTFF clusters, Abell2744, MACSJ 0416 and MACSJ 1149. In this work, we derive themass function of subhalos from the lensing data and compare theseresults with those obtained from the high-resolution Illustris cos-mological N-body simulations and analytic predictions. Here wepresent the detailed comparison with zoom-in simulations of twoclusters that are as massive – with a virial mass of ∼1015M� –as the HSTFF targets considered here. These Ilustris clusters willhereafter be referred to as iCluster Zooms, specifically the one witha mass of ∼1015.3M� as iCluster Zoom 1 and the one with mass∼ 1014.8M� as iCluster Zoom 2. We also include in our study alarger sample of less massive simulated clusters with masses be-tween 1014 and 1015M� that form in the small box size of theIllustris suite. We will refer to these systems as the 1014 IllustrisHaloes. We chose the Illustris simulations for comparison with re-sults from our lensing data because they represent the state of the artregarding the treatment of baryonic physics. Morever, they allow usto mimic several key aspects of the observations, thereby enablinga detailed and robust comparison. We note, however, the importantcaveat is that the massive, actively merging cluster lenses targetedby the HSTFF project are in a dynamical state for which there isno equal in any of the currently simulated volumes. We also com-pare our lensing determined SHMF to the analytical prediction forparent halos with masses of∼1015M� to understand the impact ofcosmic variance. The HSTFF data allow probing the SHMFs downto several orders of magnitude below previous studies and offer thebest current tests of the abundance and properties of substructure inthe LCDM model.
This paper is structured as follows: in Section 2, we describethe predictions for substructure in the LCDM model; followed bya synopsis of previous work in Section 3. In Section 4, the gen-eral methods we employ to derive SHMFs are described, afterwhich the overall mass models for Abell 2744, MACSJ 0416 andMACSJ 1149 inferred from the HSTFF are described in Section 5.In Section 6, we present and discuss the derived SHMFs. We thenprovide a brief description of the Illustris suite of simulations inSection 7, before detailing the comparison of the lensing derivedsubhalo properties with those from the simulations and analyticmethods (in Section 8). We close the paper in Section 9 with adiscussion of the implications of our results for the LCDM model.
2 LCDM SUBSTRUCTURE PREDICTIONS
Cold dark matter predicts the existence of copious substructurewithin collapsed halos of all masses. As a description of the un-derlying world model that best describes our universe, the LCDMmodel has been incredibly successful, tested with several obser-vational probes ranging from the measured properties of the fluc-tuations in the Cosmic Microwave Background Radiation to theobserved abundance, clustering and properties of galaxy popula-tions. Precision measurements of cosmological parameters havenow determined that we appear to live in a collisionless, cold darkmatter dominated, dark energy driven accelerating expanding uni-verse (Hinshaw et al. 2013). However, despite this highly success-ful paradigm for structure formation, in the past two decades at-tention has been drawn to challenges on ”small scales” where dis-crepancies between the theory and observations appeared to lurk.
There are two related small scale problems that continue to be ac-tive areas of study. The first pertains to the long-standing and de-bated question of whether the rotation curves of low surface bright-ness galaxies are compatible with the LCDM model and the secondconcerns the abundance of substructure on galaxy scales. The workpresented in this paper addresses the second issue. The substruc-ture crisis, as it was originally referred to, noted that the amountof dark matter substructure theoretically predicted on Milky Wayscale galaxies was highly discrepant with the number of observa-tionally detected satellites - believed to be hosted by dark mattersubhaloes - in the Local Group. Interestingly, both the substructureproblem and the mismatch of rotation curves of low surface bright-ness galaxies came to the fore only when high resolution N-bodysimulations could be performed with sub-kpc to parsec scale spatialresolutions. These higher resolution simulations in which the in-ner profile of dark matter halos could also be studied revealed thatthese dark matter halos on galaxy, group and cluster mass scaleswere filled with a large number of self-bound dark matter satel-lites. This plethora of clumpy structure had not been seen in earlierlower resolution studies in which all halos appeared to be signifi-cantly smoother (Madau et al. 2008; Helmi et al. 2011). We nowknow that in fact the existence of vast amounts of substructure isa generic prediction of hierarchical structure formation in LCDMmodels where assembly of collapsed mass structures occurs via amerging hierarchy during which a large fraction of the infallingdense clumps survive as dynamically distinct substructures insidevirialized halos until late times albeit after dynamical modificationvia tidal stripping, tidal heating and dynamical friction. And clus-ters of galaxies as the most recently assembled mass structures re-tain copious amounts of bound substructures within them.
Recent work comparing the abundance of simulated satellitesto those observationally detected in the Milky Way (with a mass of∼1012M�), do suggest that we have detected all the substructureassociated with the most massive subhaloes bound to the MilkyWay halo and what we might be missing are likely only the ex-tremely faint galaxy population - though an increasing number ofthese are also being found in deeper images (Torrealba et al. 2016;Deason et al. 2014). The paucity of the detection of these galaxiescan be explained by a combination of factors: their faintness makesthem observationally challenging to detect and the efficiency of starformation in such low mass dark matter host halos might be sup-pressed due to baryonic physics. The leading hypothesis is that thereason for the existence of a sea of low mass dark matter halosbeing largely devoid of stars has to do with the physics of feed-back processes in galaxy formation. For instance, feedback pro-cesses wherein the photo-ionizing UV background or the expellingof gas via strong, powerful supernovae winds leads to highly inef-ficient star formation can and are largely believed to explain awaythe substructure problem on galaxy scales (Wetzel et al. 2016). In-dependent of prior disagreements on galaxy scales, the shape andamplitude of the SHMF within clusters offers a powerful probe ofthe LCDM model. Any deviations from theoretical predictions ofLCDM on these scales could be used as a diagnostic of the na-ture of dark matter and perhaps signal new physics. In the LCDMmodel, structure aggregates via gravity and is essentially scale-free,and the best-fit functional form to the sub halo abundance per unitparent halo mass can be written as:
dn
dm= 10−3.2 (
m
M�h−1)−1.9 (1)
(Gao et al. 2004; van den Bosch et al. 2005). Since abundant sub-structure is endemic to LCDM, if there was a real substructure
MNRAS 000, 1–?? (0000)

4 Natarajan, et al.
problem on galaxy scales, it is expected to be replicated on clusterscales. Therefore, testing substructure predictions on cluster scalesoffers an extremely critical analysis of the LCDM model. The subhalo mass range over which such an inventory can be performeddirectly impacts the degree of accuracy to which the LCDM modelcan be tested. To perform this test, here we obtain the mass spec-trum of clumps in these HSTFF lensing clusters. These observa-tionally determined quantities are directly compared with resultsof cosmological simulations and analytic estimates from theoret-ical calculations. Contrary to galaxy scales, in clusters we expectmany more dark matter substructures to host visible galaxies, mak-ing the comparison of the SHMF less sensitive to uncertainties inthe physics of galaxy formation. All the while, we however need tokeep in mind that dynamically similar counter-parts to the HSTFFclusters are not available either in the Illustris volume or in anyother simulated volume at present, even if comparable mass clus-ters like iCluster Zooms are available. The veracity of this expec-tation is also tested in our analysis here. Despite this, full consis-tency with the abundance of optically detected member galaxies,substructures in the LCDM simulations and subhaloes detected bylensing can be expected and asked for; and finding strong concor-dance can be viewed as a stringent test of the LCDM paradigm.This is precisely what we attempt in this paper.
In earlier analytic work on the calculation of the SHMFs in thecontext of hierarchical CDM theories van den Bosch et al. (2005)have computed the substructure content on cluster mass scales.Their work and findings are relevant here for the interpretation ofour results of the lensing determined SHMF and comparison withthose derived from the Illustris iCluster Zooms and the 1014IllustrisClusters samples. In a two-step process that takes into account theassembly of clusters, (van den Bosch et al. 2005) first derive themasses of sub haloes at the time of their initial accretion usingMonte Carlo realizations of their merger histories. Subsequent tobeing accreted these sub haloes are subject to a variety of processesthat lead to mass loss, namely dynamical friction, tidal strippingand tidal heating. While the detailed mass loss is apt to dependon the motions of individual sub haloes within the cluster, they findthat an average mass loss rate can be computed by simply averagingover all possible orbital configurations. Coupled with the additionalassumption that the distribution of orbits is actually independent ofthe host/parent halo mass, they express the average mass loss rateas a function of two key variables: the mass ratio of the subhalo tothe parent halo and redshift. This result is natural as it intuitivelysuggests that the formation time of the massive parent halo is animportant variable. Comparing the predictions of this model withhigh-resolution dark matter only cosmological simulations to cal-ibrate this picture, they found that contrary to earlier claims, theSHMF does depend on the mass of the parent halo. Both the slopeand the normalization of the SHMF depend on the formation timeof the parent halo, and explicitly depend on the ratio of the parenthalo mass to the characteristic non-linear mass scale. Therefore,in early assembling clusters, in-falling sub haloes are subject to dy-namical modification for longer and since the most massive clustersform later in hierarchical CDM, their sub haloes experience lessstripping. One of the advantages of this formalism is the ability toeasily compute and quantify the halo-to-halo variation that can beexpected in absence of an ensemble of simulated clusters to aver-age over. Estimating cosmic variance is challenging for simulationsthat are limited by the essential compromise between box size andresolution which results in the paucity of high mass clusters. Theestimated halo-to-halo variance depends as expected on the detailedmass accretion history during the process of cluster assembly. Dur-
ing the assembly of massive clusters there are two effects that needto be understood - the mass loss suffered by individual infalling subhaloes all the while as the parent host halo itself gains mass due tocosmic accretion as part of its growth in a dark matter dominateduniverse. van den Bosch et al. (2005) find that the recent cosmicaccretion history is what is most relevant, in fact, cosmic accretionin the previous Gyr or so. As predicted by their model, this depen-dence is what is reflected in the observed halo-to-halo scatter. Thepredictions of this model for LCDM are specially salient to exam-ine the trends with parent halo mass and we compare our lensingderived SHMFs with these analytic predictions.
3 DERIVING SUBSTRUCTURE FROM CLUSTERLENSING DATA
In order to derive the SHMF from lensing data, we adopt themethodology that we have developed over the last decade for ana-lyzing cluster lensing data. We start with modeling the mass distri-bution in the cluster with a set of large and small scale self-similarparametric mass profiles. The cluster itself is visualized as a com-posite of large-scale smooth mass components with several small-scale sub clumps, which are both modeled with the analytic PIEMD(pseudo-isothermal elliptical mass distribution) profile (Natarajan& Kneib 1997; Limousin et al. 2007b). The small scale subhaloesin our conception of the cluster are associated with the locationsof bright, early-type cluster galaxies under the explicit assump-tion that light traces mass. This is entirely akin to the process bywhich we will derive the substructure for the iCluster Zooms aswell as the Illustris 1014 Illustris Haloes as described below. Thelocation, brightness and redshifts of the magnified, multiply im-aged background sources are used in Abell 2744, MACSJ 0416 andMACSJ 1149 to statistically quantify the masses of sub-clumps us-ing a Bayesian scheme. Deploying an MCMC method we are thenable to derive a family of best-fit models modulo the assumed pri-ors for the choice of parametric profiles including the self-similarscaling and the association of mass with light. In this work, we alsoexplore a couple of distinct scaling relations to characterize the re-lation between mass and light for cluster galaxies to examine thedependence of these assumptions on our final results.
3.1 Determination of cluster members
Cluster membership for galaxies in these clusters was determinedusing methods described in detail in Richard et al. (2014). Here wesummarise the key steps. Galaxy catalogs were first generated us-ing SExtractor (Bertin & Arnouts 1996) and cluster membershipwas assigned using complementary colour-magnitude diagrams(mF606W−mF814W versusmF814W andmF435W−mF606W ver-sus mF814W). Spectroscopically confirmed cluster members wereused to identify the red sequence; cluster membership was assignedto all galaxies that lie within 3σ of a linear fit to the red sequence.We used a fixed value for the dispersion, obtained by collapsing thered sequence along the best linear fit down to the (preset) limitingmagnitude. We are thus effectively fitting a superposition of manyGaussians of ever increasing width with a single Gaussian. We notethat a moving sigma that becomes smaller as we move along thered sequence toward the BCG would not result in a very differ-ent galaxy selection: usually the gap between the red sequence andthe green valley galaxies widens too. For MACS J0416, we usedthe cluster member catalogue of Grillo et al. (2015) which com-prises 175 galaxies, 63 of them spectroscopically identified and
MNRAS 000, 1–?? (0000)

Substructure in HSTFF clusters 5
the remaining 112 selected using a spectro-photometric method de-scribed in detail in their paper (see also Rosati et al. 2014; Balestraet al. 2016). This catalogue was provided to the lens-modeling com-munity by C. Grillo and the CLASH collaboration in the contextof the magnification map-making project in September 20152. ForAbell 2744 and MACSJ 1149, our selection is based on spectro-scopically confirmed members from Owers et al. (2011) and Ebel-ing et al. (2014), respectively. For all three clusters, the selectiontechnique adopted to select cluster members from our galaxy cat-alogues extends to a uniform limiting bolometric luminosity of0.01L∗. Despite this uniform cut, we find that this yields a dif-fering number of cluster galaxies for each of the clusters due tothe range that they span in redshift. For MACS J0416, note that weused the catalogue of mostly spectroscopically confirmed galaxiesprovided by Grillo and co-workers.
The F814W magnitudes of the resulting set of cluster mem-bers range from 18.49 to 26.3 in Abell 2744 (563 galaxies), from19.04 to 23.91 in MACS J0416 (175 galaxies), and from 18.96 to25.66 in MACS J1149 (217 galaxies). The galaxies thus selectedwere included as small-scale perturbers in our high-fidelity lens-ing models. The details of these mass models are given in Jauzacet al. (2015b) for Abell 2744, Jauzac et al. (2014) for MACS J0416,and Jauzac et al. (2016) for MACS J1149. We note that the mod-els for Abell 2744 and MACS J0416 have been updated since theirpublication as part of the 2015 mass-mapping effort using newspectroscopic redshifts for multiple-image systems, and the clustermember catalogue of Grillo et al. (2015). We describe the resultingchanges in detail in the following section. In addition, as part ofthe data-sharing for this map-making project we have used spectro-scopic redshifts for multiple-image families in these clusters thatwere provided by other teams including the GLASS collaborationand K. Sharon’s team (Johnson et al. 2014; Schmidt et al. 2014;Treu et al. 2016). Our cluster member selection is by constructionincomplete at large cluster-centric radii and at low luminosities asoutlined above.
3.2 Mass Modeling: Methodology
In this section, we outline the modeling framework, and note thatfurther details can be found in several earlier papers (Natarajan &Kneib 1997; Natarajan et al. 1998) and a more recent review (Kneib& Natarajan 2011). In order to extract the properties of the popula-tion of subhaloes in cluster lenses, as mentioned above, the rangeof mass scales is modeled using a parametric form for the surfacemass density profile of the lens. Motivated by the regularity of X-ray surface brightness maps of clusters we envision the cluster ascomposed of a super-position of several smooth large-scale grav-itational potentials and smaller scale perturber potentials that areassociated with the locations of bright early-type cluster members:
φtot = Σi φsi + Σn φpn , (2)
where φsi are the gravitational potentials of the smooth componentsand φpn are the potentials of the n subhaloes associated with then cluster galaxies treated as perturbers. The lensing amplificationmatrix A−1 can also be decomposed into contributions from themain clump and the perturbing potentials:
A−1 = (1 − Σiκsi − Σnκp) I − ΣiγsiJ2θsi (3)
−Σn γpnJ2θpn;
2 https://archive.stsci.edu/prepds/frontier/
where κ is the magnification and γ the shear. The quantity rele-vant to lensing is the projected surface mass density. The distortioninduced by the overall potential with the smooth and individualgalaxy-scale halos modeled self-similarly as linear superpositionof two PIEMD distributions, has the following form:
Σ(R)
Σ0=
r01− r0/rt
(1√
r20 +R2− 1√
r2t +R2
), (4)
with a model core-radius r0 and a truncation radius rt � r0. Theprojected coordinate R is a function of x, y and the ellipticity,
R2 =x2
(1 + ε)2+
y2
(1− ε)2 , where ε =a− ba+ b
. (5)
Coupling these analytic forms with further assumptions aboutthe fidelity with which mass traces light described in the next sub-section, the SHMF is derived using strong lensing constraints fromthe HSTFF observations for these three clusters.
3.3 Relating Mass to Light
One of the key features and facilities of parametric modeling is theflexibility afforded in modeling the precise relationship betweenmass and light. Guided by empirically observed correlations be-tween internal properties of individual, bright, early-type clustergalaxies we adopt those to couple the mass of the dark matter sub-halo to the properties of the galaxy it hosts in our modeling scheme.In addition, we also assume that the ellipticity and the orientation ofthe dark matter subhaloes associated with early-type cluster mem-bers is aligned with that of the galaxies themselves. These simpleassumptions are inputs while generating the best-fit lensing massmodel for the cluster. The adopted set of physically motivated, em-pirically determined scaling laws for relating the dark matter distri-bution of the subhaloes to the light distribution of the cluster galax-ies are:
σ0
σ0∗=
(L
L∗
) 14
;r0r0∗
=
(L
L∗
) 12
;rtrt∗
=
(L
L∗
)α. (6)
These scalings lead to a set of models for cluster members wherethe total mass Map enclosed within an aperture rt∗ and the totalmass-to-light ratio M/L scale with the total luminosity as:
Map ∝ σ20∗rt∗
(L
L∗
) 12+α
, Map/L ∝ σ20∗ rt∗
(L
L∗
)α−1/2
,(7)
where α determines the typical size scale of the galaxy halo. Fora value of α = 0.5, the model galaxy has constant mass to lightratio with luminosity though not as a function of radius within.Here we first explore α = 0.5 as in previous work, as this leadsto a scaling law that is empirically motivated by the Kormendy andthe Faber-Jackson relations for early-type galaxies (Faber & Jack-son 1976; Kormendy 1977; Natarajan et al. 2009; Limousin et al.2007a). The Kormendy relation relates the spatial scale to the lumi-nosity, while the more general form of the Faber-Jackson relation isused to relate the velocity dispersion to the luminosity. In practice,the constant mass to light ratio relation for α = 0.5 has proven toprovide a good fit, and so far strong lensing data have not ruled outthis hypothesis. With a choice of α = 0.8, we would have ended upwith the fundamental plane relation M/L ∼ L0.3 (Halkola et al.2006; Jorgensen et al. 1996). In recent work, however, modelingcluster galaxies similarly using data of the lensing cluster Abell383 and combining with measured values for the central velocity
MNRAS 000, 1–?? (0000)
6 Natarajan, et al.
dispersion for a handful of galaxies, Monna et al. (2015) report rea-sonable agreement with α = 0.5 in the case of one galaxy. In morerecent work, with velocity dispersion measurements for 5 galax-ies near a strongly lensed arc in the cluster Abell 611, they reportdeparture from scaling relations indicated by the galaxy to galaxyvariation in the estimated truncation radii (Monna et al. 2017). Theconclusion is that the efficiency for tidal stripping varies for galax-ies, in fact, such a systematic difference between early and late-types was found for cluster galaxies in the merging lensing clusterCl 0024+14 by Natarajan et al. (2009). We explore α = 0.5 as wellas the scaling between mass and light that is found in the Illustrissimulation with the assumed sub-grid models for modeling galaxyformation. In this paper, in addition to using the scalings impliedby the Faber-Jackson & Kormendy laws, we also derive the SHMFfrom observational data under the assumption that light traces massas it does in the Illustris full physics run. Writing out the generalscaling relations as: σ ∝ La and rt ∝ Lb and M/L ∝ Lc; theFaber-Jackson case corresponds to: a = 0.25; b = 0.5; c = 1 andin Illustris we find a = 0.18; b = 0.16; c = 0.49. Adopting thisnew set of scaling laws, we re-ran LENSTOOL to obtain the best-fitmass distribution for all three clusters and extracted the resultantSHMF. In the results section of the paper, we plot the SHMFs de-rived for both these sets of assumed scaling laws. We are thus ableto assess if and how this assumption of how light traces mass im-pacts our results. We note that the evidence thus far from other inde-pendent studies of the relationship between mass and light stronglysupport the fact that light traces mass effectively both on clusterscales (Kneib et al. 2003) and on galaxy scales (Mandelbaum et al.2006; Newman et al. 2015). The Bayesian evidence for the best-fitmass models for these two sets of scaling laws are virtually indis-tinguishable. This suggests that the SHMF we have derived evenfrom the high quality HSTFF data is not very sensitive to our de-tailed assumption of how light traces mass.
4 PREVIOUS LENSING SUBSTRUCTURE TESTS OFLCDM CLUSTERS
In earlier work, we quantified substructure derived from WFPC-2 observations of lensing clusters and compared results with cos-mological simulations. The results of the first attempt to do sowere presented in Natarajan & Springel (2004) and subsequentlyin Natarajan et al. (2007). Results reported in both these papersused HST WFPC-2 imaging and a comparison with the Millenniumsimulation. In the first paper, results of the direct comparison ofthe lensing derived substructure mass function with that obtainedfrom the simulated clusters using only dark matter particles wasperformed. In the second paper, a semi-analytic model for galaxyformation was painted on to the dark matter only Millennium Sim-ulation that enabled mimicking of the selection criteria adoptedin the lensing analysis. That is, the dark matter halos hosting thebrightest cluster members were extracted from the simulation afterthe semi-analytic model had been implemented to ”form” realisticgalaxies.
In Natarajan et al. (2007), we presented high resolution massmodels for five HST cluster lenses, and performed a detailed com-parison of the SHMF, the velocity dispersion and aperture radiifunction with an ensemble of cluster–sized haloes selected fromthe Millennium Simulation including an implementation of a semi-analytic model for the galaxy formation detailed in De Lucia et al.(2006). The construction of the mass models combining strong andweak lensing data for these massive clusters was performed using
the same galaxy-galaxy lensing techniques outlined in the method-ology section here. As described above, the goal was to quantifysubstructure under the assumption that bright early-type clustergalaxies are robust tracers. We derived the SHMF within a limitedmass range 1011−1012.5M� in the inner regions of these clusters.Upon detailed comparison with simulated Millennium clusters, re-markably we found consistency with the abundance of substructuregiven that they are completely independently determined. For thecases of clusters that were active mergers the match with simula-tions was less good.
In both earlier works discussed above, we were sensitive onlyto substructures in a small mass range ∼ 1011 − 1012.5M�. Themass spectrum of substructure over this mass range, and other subhalo properties retrieved from the lensing data were found to beconsistent with the theoretical predictions of LCDM from the simu-lations. While this agreement suggested that there was no substruc-ture ”crisis” as claimed earlier in LCDM per se, to draw a morerobust conclusion, a wider range of sub halo mass scales needed tobe probed. And this is precisely what the HSTFF data affords us aswe report below.
5 HST FRONTIER FIELDS CLUSTER-LENS MASSMODELS
Using the extremely deep and high resolution HSTFF datafor the massive lensing clusters Abell 2744, MACSJ 0416 andMACSJ 1149 that were made publicly available on the MASTArchive 3 at the Space Telescope Science Institute as part of theFrontier Fields Initiative, our collaboration CATS (Clusters AsTelescopeS) identified all the multiple image systems and con-structed comprehensive mass distributions for all three clusters in-cluding small scale clumps modeled as described above. Includingthe positions, brightnesses and measured spectroscopic redshiftswhere available for the lensed images in the ACS field of view, allour constructed mass models have already been published (Jauzacet al. 2014, 2015a, 2016), and were built using the LENSTOOL soft-ware in its parametric mode (Jullo et al. 2007). Below, we providea synopsis of the features of these mass models along with updatessince their publication in order to illustrate the high data qualityand resultant unprecedented precision of these models. The gainin precision of the overall mass model also enables more accuratecharacterization of the subhalo masses.
5.1 Mass distribution in Abell 2744
We constructed a high-precision mass model of galaxy clusterAbell 2744 at z = 0.308, based on a strong- gravitational-lensinganalysis of the entire HSTFF imaging data set, that includes boththe ACS and WFC-3 observations. With the depth of this dataset inthe visible and near-infrared, we identified 34 new multiply imagedbackground galaxy systems listed in Jauzac et al. (2015b), bringingthe total up to 61, leading to a final tally of 181 individual lensedimages. While doing so, we corrected earlier erroneous identifica-tions and inaccuracies in the positions of multiple systems in thenorthern part of the cluster core, namely the image System #3). Wethen culled the multiple images that were less reliable after whichrunning LENSTOOL with 54 multiply-imaged systems (154 totalimages) that were determined to be the most secure ones amongst
3 URL: https://archive.stsci.edu/prepds/frontier/
MNRAS 000, 1–?? (0000)

Substructure in HSTFF clusters 7
Component #1 #2 L∗ elliptical galaxy∆ RA −4.8+0.2
−0.1 −15.5+0.1−0.2 –
∆ DEC 4.0+0.2−0.1 −17.0+0.2
−0.1 –e 0.30 ±0.004 0.60 ± 0.01 –θ 64.2+0.3
−0.2 40.5+0.4−0.5 –
rcore (kpc) 205.0+1.3−1.5 39.6+0.8
−0.6 [0.15]rcut (kpc) [1000] [1000] 18.0+0.6
−1.0
σ (km s−1) 1296+3−5 564+2
−2 154.3± 1.8
Table 1. Abel 2744 best-fit PIEMD parameters for the two large-scale dark-matter halos, as well as for the L∗ elliptical galaxy. The model is built us-ing 113 multiple images, includes 563 galaxy-scale perturbers. The best-fit RMS is 0.70 ′′. Coordinates are quoted in arcseconds with respect toα = 3.586259, δ = −30.400174. Error bars correspond to the 1σ confi-dence level. Parameters in brackets are not optimised. The reference mag-nitude for scaling relations is magF814W = 19.44.
the 61 listed in Jauzac et al. (2015b). We modeled the cluster withtwo large-scale dark matter halos plus smaller galaxy-scale per-turber halos associated with 733 individual cluster member galax-ies. Our best-fit model, which only uses strong-lensing constraints,predicts image positions with an RMS error of 0.79′′, that corre-sponds to an improvement of almost a factor of two over previ-ous modeling attempts for this cluster. We find the total projectedmass inside a 200 kpc aperture to be 2.162 ± 0.005 × 10¹⁴M�.This gain in the accuracy of the mass modeling translates directlyinto an overall improvement of a factor 4 in the derived magnifica-tion map for the high-redshift lensed background galaxies that arebrought into view by the cluster lens. Further details of this best-fit model can be found in Jauzac et al. (2015b). We note that thismodel reconstruction extends radially out only to a fraction of thevirial radius of Abell 2744 to ∼ 0.5Rvir. Table 1 below lists thedetails of the best-fit lensing mass model for Abell 2744.
In September 2015, several selected independent lensingteams were asked to provide HFF mass models to the communitythrough a mass mapping challenge. For this purpose, data wereshared, including a large number of spectroscopic redshifts fromWang et al. (2015), as well as new measurements from K. Sharon’steam (Johnson et al. 2014). With this additional data, we revised ourpreviously published mass model described above, after a groupvote to select multiply imaged families, only keeping the most se-cure ones (voted as Gold, Silver and Bronze by all lensing teams)and more securely identified cluster members. While our overallmass model model did not change much from the one presentedby Jauzac et al. (2015b), we now include only 113 multiple imagesfor the modeling. The best-fit mass model for the cluster comprisestwo cluster-scale halos as before, and 563 galaxy-scale perturbers.This final model predicts image positions with an even lower globalRMS error of 0.70′′, with similar mass estimation and precision onboth mass and magnification as our initial HSTFF model. The viralradius for Abell 2744 lies at ∼ 2 Mpc and our mass model relianton the HSTFF data extends out only to∼ 0.5 Rvir Substructure de-rived from this updated model is used here in our comparison withthe iCluster Zooms as well as the Illustris 1014 Illustris Haloes andanalytic predictions.
5.2 Mass distribution in MACSJ 0416
MACSJ 0416 (at z = 0.397) was discovered as part of the MAssiveCluster Survey (MACS; Ebeling et al. 2001) and is classified as amerging system based on its double-peaked X-ray surface bright-
Figure 1. Low luminosity cluster member galaxies that are included in themodeling as they are required to reproduce the observed multiple imageconfigurations. Here we show 3 panels with examples from each of the 3clusters lenses studied here Abell 2744, MACSJ 0416 and MACSJ 1149.The deeper HSTFF data reveal fainter cluster members as well as fainterlensed sources.
ness distribution (Mann & Ebeling 2012). Due to its exceedinglylarge Einstein radius, MACSJ 0416 was selected as one of the fivehigh-magnification clusters in the Cluster Lensing And Supernovasurvey with Hubble (CLASH; Postman et al. 2012), thus provid-ing HST imaging in 16 bands from the UV to the near-IR, witha typical depth of 1 orbit per passband. As expected for a highlyelongated mass distribution quite typical of merging clusters, manymultiple-image systems are produced and detected. The first de-tailed mass model of this complex merging cluster system wasbased on CLASH data, and was published by Zitrin et al. (2013).This cluster was then selected as one of the six HSTFF targets.We constructed a high-precision mass model of the galaxy clusterMACSJ 0416, based on a strong gravitational-lensing analysis ofthe HSTFF imaging data. Taking advantage of the unprecedenteddepth provided by HST/ACS observations in three passbands, weidentified 51 new multiply imaged galaxies, quadrupling the pre-vious census and bringing the grand total to 68, yielding a totalof 194 individual lensed images. Having selected a subset of the 57most securely identified multiply imaged systems, we obtain a best-fit mass model for the inner core of the cluster, consisting of twolarge-scale dark-matter halos and 98 accompanying galaxy-scalehalos (Jauzac et al. 2014). This model predicts image positionswith an RMS error of 0.68′′, which constitutes an improvementof almost a factor of two over previous, pre-HFF mass models ofthis cluster. We find the total projected mass inside a 200 kpc aper-ture to be (1.60 ± 0.01) × 1014M�, a measurement that offers athree-fold improvement in precision from Jauzac et al. (2014). Thevirial radius of MACSJ 0416 extends out to ∼ 2.3 Mpc, here wenote that the lens model reconstruction using HSTFF data extendsradially out only to a fraction of the virial radius to ∼ 0.3Rvir.
MNRAS 000, 1–?? (0000)
8 Natarajan, et al.
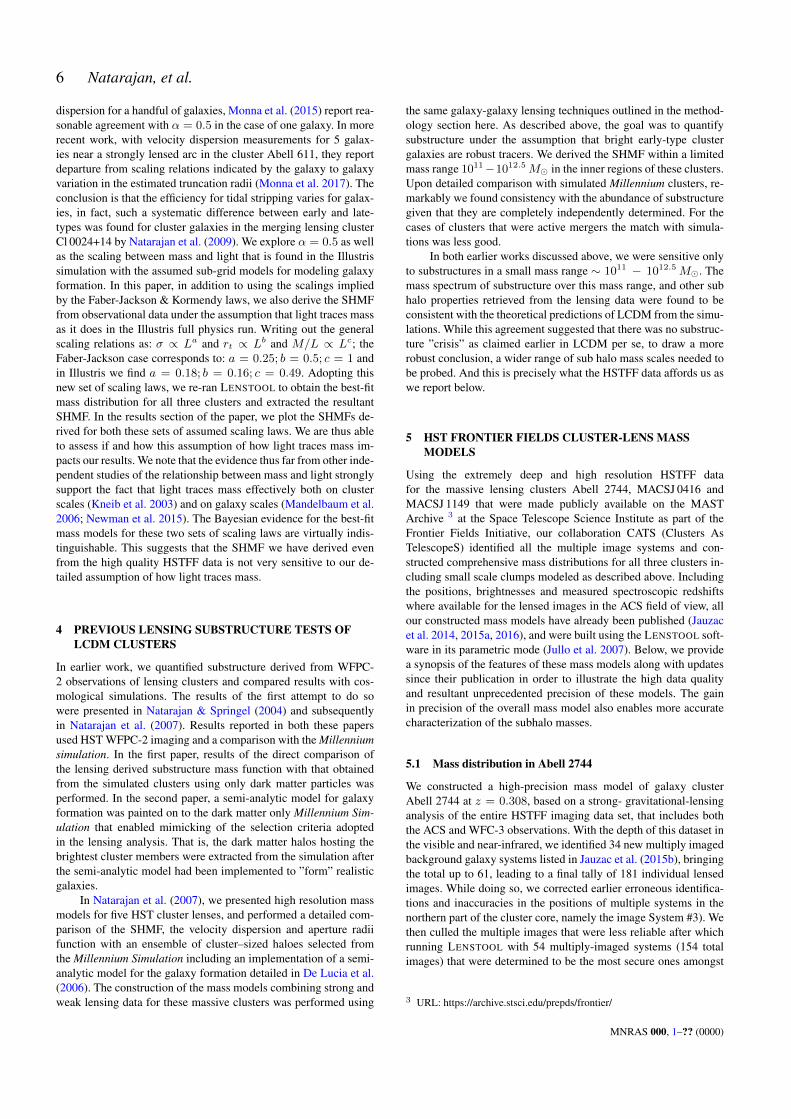
Component #1 #2 L∗ elliptical galaxy∆ RA −5.9+0.4
−0.4 23.6+0.3−0.2 –
∆ DEC 3.5+0.3−0.3 −43.4+0.2
−0.4 –e 0.77 ±0.01 0.64± 0.01 –θ 147.3+0.6
−0.7 126.8+0.3−0.3 –
rcore (kpc) 72.8+3.5−2.5 95.8+2.8
−2.5 [0.15]rcut (kpc) [1000] [1000] 27.5+4.6
−4.1
σ (km s−1) 729+16−9 974+13
−8 190.9± 7.3
Table 2. MACSJ0416 best-fit PIEMD parameters for the two large-scaledark-matter halos, as well as for the L∗ elliptical galaxy. The model is builtusing 139 multiple images, includes 175 galaxy-scale perturbers. The best-fit RMS is 0.54 ′′. Coordinates are quoted in arcseconds with respect toα = 64.0381013, δ = −24.0674860. Error bars correspond to the 1σ
confidence level. Parameters in brackets are not optimised. The referencemagnitude for scaling relations is magF814W = 19.8.
Table 2 below lists the details of the best-fit lensing mass model forMACSJ 0416.
As for the case of Abell 2744, we revised our publishedstrong-lensing mass model taking advantage of spectroscopic red-shifts provided by the GLASS collaboration (Hoag et al. 2016,Wang et al. in prep.) as well as considering the votes from all otherlensing teams on the selection of secure multiple images. We alsoreplaced our initial colour-magnitude selected cluster member cat-alogue with the Grillo et al. (2015) catalogue as mentioned ear-lier. Our current mass model from which we derive the SHMF pre-sented here now includes 139 multiple images. Our best-fit massmodel comprises 2 cluster-scale halos, combined with 175 galaxy-scale perturbers, and predicts the image positions with an RMS er-ror of 0.54′′. In a recent preprint, Caminha et al. (2016) presentan updated mass model that includes additional spectroscopic red-shifts from archival Multi-User Spectroscopic Explorer (MUSE)data, and they report that the cluster galaxy catalog and the inferredsub-halo population are in good agreement with their earlier cata-log that we have used here.
5.3 Mass distribution in MACSJ 1149
For the cluster MACSJ 1149 at z=0.545 our current model best-fitto the HSTFF lensing observations includes 12 new multiply im-aged galaxies, bringing the total to only 22, comprising thereforea total of 65 individual lensed images. Unlike the first two HFFclusters, Abell 2744 and MACSJ 0416, MACSJ 1149 does not ap-pear to be as powerful a lens (see Jauzac et al. 2016, for a moredetailed discussion). As suggested in our pre-HFF models of thecluster (Richard et al. 2014), the inferred mass distribution here isexceedingly complex requiring 5 separate large-scale componentswhose spatial distribution and low masses make this cluster theleast efficient and the least well constrained lens of the sample con-sidered here. Our best-to-date model, which is due for significantimprovements comprises of 5 large-scale clumps and 217 galaxyscale mass components. Our best-fit model predicts image posi-tions with an RMS of 0.91′′ which is larger than the RMS for ourreconstructions of the mass in Abell 2744 and MACSJ 0416. Weestimate the total projected mass inside a 200 kpc aperture to be(1.840±0.006)×1014M�. The integrated mass however reachescomparable precision with our models of the other two clusters.Off-set from the center, the supernova SN Refsdal was detectedin this cluster. Models from several independent groups includingours predicted that six multiple images would be produced (Kelly
et al. 2015; Rodney et al. 2015; Sharon & Johnson 2015; Grilloet al. 2015). The mass model used to infer the SHMF here suc-cessfully predicted the appearance of the one of the multiple im-ages seen in December 2015. The virial radius of MACSJ 1149is ∼ 2 Mpc and we note here that our lensing model reconstruc-tion extends radially out only to a fraction of the virial radius to∼ 0.3Rvir. Table 3 below lists the details of the best-fit lensingmass model for MACSJ 1149.
6 MAPPING SUBSTRUCTURE IN ABELL 2744,MACSJ 0416 AND MACSJ 1149
With the exquisite data from the HSTFF program for these clus-ters, and during the process of constructing the highest resolutionmass models to date, we obtained constraints on subhalos associ-ated with cluster member galaxies. Using the LENSTOOL software,the mass is partitioned into the large-scale clumps and galaxy-scalesubhaloes as permitted by the input observed lensing constraints.LENSTOOL uses a Bayesian scheme with an MCMC algorithm toprovide the best-fit suite of models given the priors while delineat-ing the degeneracies amongst model parameters (Jullo et al. 2007).
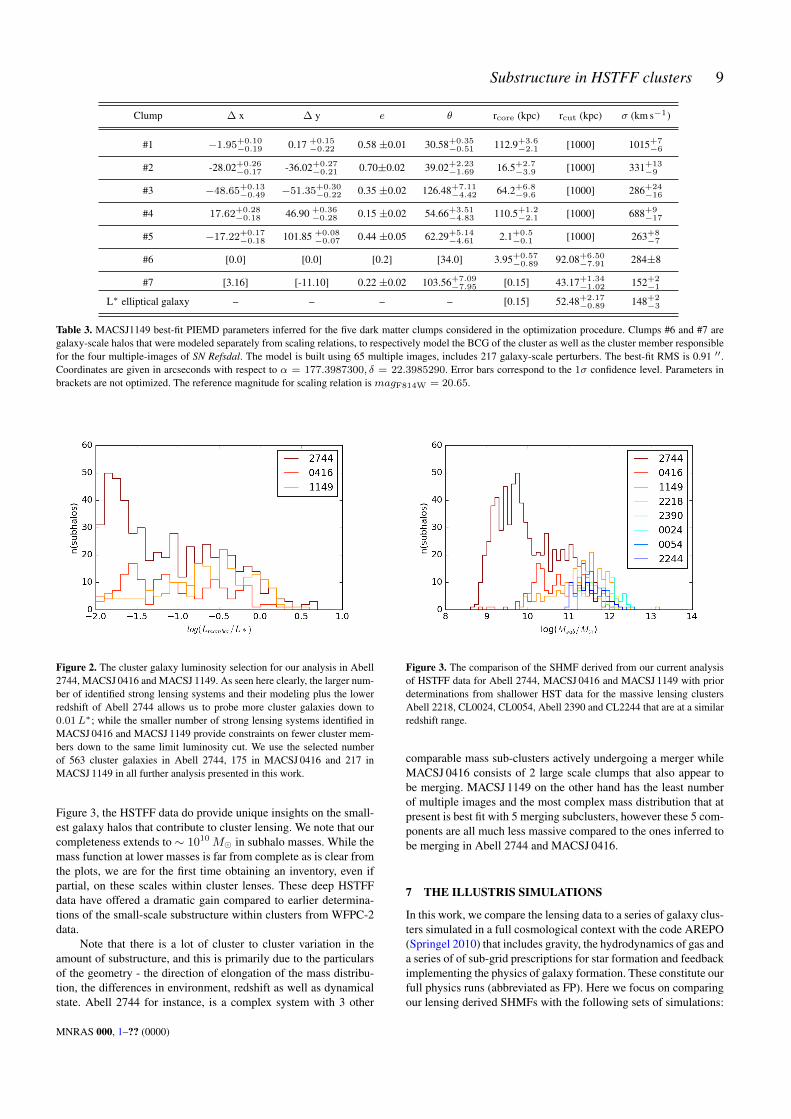
In Figure 2, we plot the luminosity distribution of the selectedcluster members in all 3 clusters. We adopted a uniform luminositycut and selected all cluster members with L > 0.01L∗. This how-ever yields different numbers for each cluster given their redshifts.With HSTFF data and our selected perturbing cluster members, weare able to now push down to two orders of magnitudes in massbelow previous work in the determination of the SHMF. Here wepresent in Figure 3 the derived mass function of substructure over amass range that spans∼ 109.5−1013M� derived from the HSTFFdata. This is remarkable as the 109.5M� clumps correspond to thedark matter halos associated with extremely low luminosity clustermembers that are essentially dwarf galaxies.
In Figure 1, we explicitly show thumbnails of low-luminositycluster members that lie close to mulitple image systems in allthree clusters. In many instances (of which only 3 are shown inFigure 1), these low luminosity cluster galaxies that lie in closeproximity to multiply imaged systems are needed to accurately re-produce the geometry of some of the lensed images. Therefore, weinclude all low-luminosity cluster members down to 0.01L∗ in thelens modeling in our catalog of cluster members. And these clearlyget folded in and contribute to output of our Bayesian analysis.This mass range of galaxies has not been accessible with any priordata-set of cluster lenses (Morishita et al. 2016). We have also de-termined and overplot the errors arising from modeling in the de-rived SHMF for all three clusters. To compute these we used thestandard deviation on the derived output values of the fiducial pa-rameters (rt∗ and σ0∗) for each cluster member from large numberof models rather than just the best-fit model from the bayesian anal-ysis. In Figure 2, we plot the luminosity distribution of the selectedcluster members in all 3 clusters. We adopted a uniform luminositycut and selected all cluster members with L > 0.01L∗. This how-ever yields different numbers for each cluster given their redshifts.With HSTFF data and our selected perturbing cluster members, weare able to now push down to two orders of magnitudes in massbelow previous work in the determination of the SHMF. Here wepresent in Figure 3 the derived mass function of substructure over amass range that spans∼ 109.5−1013M� derived from the HSTFFdata. This is remarkable as the 109.5M� clumps correspond to thedark matter halos associated with extremely low luminosity clustermembers that are essentially dwarf galaxies. As is apparent from
MNRAS 000, 1–?? (0000)
Substructure in HSTFF clusters 9
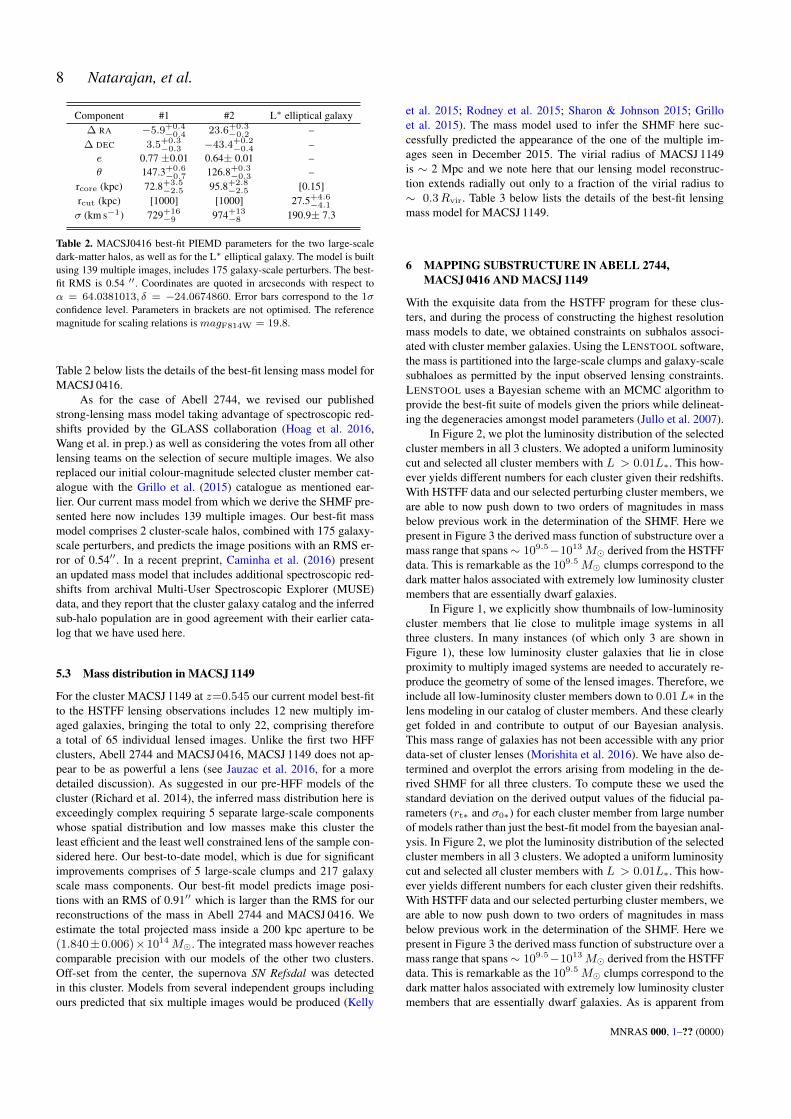
Clump ∆ x ∆ y e θ rcore (kpc) rcut (kpc) σ (km s−1)
#1 −1.95+0.10−0.19 0.17 +0.15
−0.22 0.58 ±0.01 30.58+0.35−0.51 112.9+3.6
−2.1 [1000] 1015+7−6
#2 -28.02+0.26−0.17 -36.02+0.27
−0.21 0.70±0.02 39.02+2.23−1.69 16.5+2.7
−3.9 [1000] 331+13−9
#3 −48.65+0.13−0.49 −51.35+0.30
−0.22 0.35 ±0.02 126.48+7.11−4.42 64.2+6.8
−9.6 [1000] 286+24−16
#4 17.62+0.28−0.18 46.90 +0.36
−0.28 0.15 ±0.02 54.66+3.51−4.83 110.5+1.2
−2.1 [1000] 688+9−17
#5 −17.22+0.17−0.18 101.85 +0.08
−0.07 0.44 ±0.05 62.29+5.14−4.61 2.1+0.5
−0.1 [1000] 263+8−7
#6 [0.0] [0.0] [0.2] [34.0] 3.95+0.57−0.89 92.08+6.50
−7.91 284±8
#7 [3.16] [-11.10] 0.22 ±0.02 103.56+7.09−7.95 [0.15] 43.17+1.34
−1.02 152+2−1
L∗ elliptical galaxy – – – – [0.15] 52.48+2.17−0.89 148+2
−3
Table 3. MACSJ1149 best-fit PIEMD parameters inferred for the five dark matter clumps considered in the optimization procedure. Clumps #6 and #7 aregalaxy-scale halos that were modeled separately from scaling relations, to respectively model the BCG of the cluster as well as the cluster member responsiblefor the four multiple-images of SN Refsdal. The model is built using 65 multiple images, includes 217 galaxy-scale perturbers. The best-fit RMS is 0.91 ′′.Coordinates are given in arcseconds with respect to α = 177.3987300, δ = 22.3985290. Error bars correspond to the 1σ confidence level. Parameters inbrackets are not optimized. The reference magnitude for scaling relation is magF814W = 20.65.
Figure 2. The cluster galaxy luminosity selection for our analysis in Abell2744, MACSJ 0416 and MACSJ 1149. As seen here clearly, the larger num-ber of identified strong lensing systems and their modeling plus the lowerredshift of Abell 2744 allows us to probe more cluster galaxies down to0.01L∗; while the smaller number of strong lensing systems identified inMACSJ 0416 and MACSJ 1149 provide constraints on fewer cluster mem-bers down to the same limit luminosity cut. We use the selected numberof 563 cluster galaxies in Abell 2744, 175 in MACSJ 0416 and 217 inMACSJ 1149 in all further analysis presented in this work.
Figure 3, the HSTFF data do provide unique insights on the small-est galaxy halos that contribute to cluster lensing. We note that ourcompleteness extends to ∼ 1010M� in subhalo masses. While themass function at lower masses is far from complete as is clear fromthe plots, we are for the first time obtaining an inventory, even ifpartial, on these scales within cluster lenses. These deep HSTFFdata have offered a dramatic gain compared to earlier determina-tions of the small-scale substructure within clusters from WFPC-2data.
Note that there is a lot of cluster to cluster variation in theamount of substructure, and this is primarily due to the particularsof the geometry - the direction of elongation of the mass distribu-tion, the differences in environment, redshift as well as dynamicalstate. Abell 2744 for instance, is a complex system with 3 other
Figure 3. The comparison of the SHMF derived from our current analysisof HSTFF data for Abell 2744, MACSJ 0416 and MACSJ 1149 with priordeterminations from shallower HST data for the massive lensing clustersAbell 2218, CL0024, CL0054, Abell 2390 and CL2244 that are at a similarredshift range.
comparable mass sub-clusters actively undergoing a merger whileMACSJ 0416 consists of 2 large scale clumps that also appear tobe merging. MACSJ 1149 on the other hand has the least numberof multiple images and the most complex mass distribution that atpresent is best fit with 5 merging subclusters, however these 5 com-ponents are all much less massive compared to the ones inferred tobe merging in Abell 2744 and MACSJ 0416.
7 THE ILLUSTRIS SIMULATIONS
In this work, we compare the lensing data to a series of galaxy clus-ters simulated in a full cosmological context with the code AREPO(Springel 2010) that includes gravity, the hydrodynamics of gas anda series of of sub-grid prescriptions for star formation and feedbackimplementing the physics of galaxy formation. These constitute ourfull physics runs (abbreviated as FP). Here we focus on comparingour lensing derived SHMFs with the following sets of simulations:
MNRAS 000, 1–?? (0000)

10 Natarajan, et al.
(i) a sample of cluster scale haloes with masses of about 1014M�(in fact, we select halos with masses > 1014M� extracted from theIllustris Simulation (Vogelsberger et al. 2014a; Genel et al. 2014;Nelson et al. 2015); and (ii) zoom simulations of two massive clus-ter haloes with masses of 7 × 10¹⁴M� and 2 × 10¹⁵M� respec-tively, chosen from the iCluster Simulation Suite (Popa et al. inprep; Pillepich et al. in prep). These will be referred to hereafteras 1014 Illustris Haloes and iCluster Zooms. Both sets follow col-lisionless dark-matter and an equal initial number of baryons, andinclude an identical set of physically motivated sub-grid modelsto implement galaxy formation (Vogelsberger et al. 2014b; Tor-rey et al. 2014). In both instances, the simulations have been setupand run with cosmological parameters consistent with WMAP9 re-sults (Hinshaw et al. 2013), from an initial redshift of z = 126to z = 0. In this work, we will also make use of the correspond-ing dark-matter only runs (DM), with identical initial conditionsas the full physics runs described above but performed by takingonly gravity into account. Illustris represents a state-of-the-art sim-ulation of a 106.5 Mpc3 cosmological box and it is currently oneof the highest resolution cosmological runs which simultaneouslyfollows the evolution of haloes and galaxies all the way up to ob-jects with total mass of about 2 × 10¹⁴M� (with a gravitationalspatial resolution of about 1kpc and dark-matter mass resolution ofabout 6× 10⁶M�). From these runs 136 snapshots of output dataare available, 36 of which are at redshift z < 0.6 and with an aver-age time resolution of about 150−200 Myrs. More information onthe Illustris Simulation Suite can be found at http://www.illustris-project.org.
The iCluster Zooms extend the massive range of the Ilustrisbox to haloes of about 1015M�. To compare with the HSTFFcluster lenses, here we use the 1015.3M� [iCluster Zoom 1] andthe 1014.8M� [iCluster Zoom 2]. These iCluster Zooms that wereselected from the Millennium XXL simulation box (with a size of4.1 Gpc a side) and then re-simulated with AREPO and WMAP9-consistent cosmology with the so-called zoom technique utilizingthe same Illustris galaxy formation model (Angulo et al. 2012, seePopa et al in prep.; Pillepich et al. in prep. for more details). Forthese runs 256 output snapshots are available, with 73 snapshotsbelow z ∼ 0.6 with an average time spacing of about 70-80 Myrs.Cluster scale haloes in both the Illustris and iClusters Simulationsare identified using the Friends-of-Friends algorithm (Davis et al.(1985)); bound sub-haloes within them are then identified using theSUBFIND algorithm (Springel et al. 2001), which in turn providessub halo catalogs for the numerically determined SHMFs. The keymotivation to choose the 1014 Illustris Haloes and iCluster Zoomsfor comparison to HSTFF data derives from the fact that they havebeen generated using a state-of-the-art baryonic and galaxy forma-tion model which has been shown to reproduce fairly realistic pop-ulations of galaxies and which therefore allows us to straightfor-wardly mimic the luminosity selection criteria applied to the ob-servational data. By contrast, in earlier such comparison work withcosmological simulations utilizing the Millennium run, we had tocontend with post-hoc semi-analytic prescriptions for galaxy for-mation to replicate our selection criteria. Moreover, current avail-ability of the full physics runs as well as the dark-matter only coun-terparts in the Illustris suite also offer us a unique handle to assessthe effects of baryonic physics on the underlying SHMFs.
The lensing derived enclosed mass within an aperture of 200kpc is ∼ 2.1 × 10¹⁴M� for Abell 2744; mass within an apertureof 200 kpc is ∼ 1.6 × 10¹⁴M� for MACSJ 0416 and within 200kpc is ∼ 1.8 × 10¹⁴M� for MACSJ 1149. Only the 1015.3 iClus-ter Zoom run is truly comparable in terms of mass, and indeed in
what follows the comparison between the FF data and simulationswill be mostly focused on substructure derived from this halo. Yet,despite the overall mis-match in cluster masses of the Illustris boxhaloes, the 1014Illustris clusters sample can provide a sense for thestatistics as it comprises a total of 325 clusters across the entireredshift range z = 0.2− 0.6, which we analyze and compare withthe HSTFF sample to study the dependence of the SHMF on parenthalo mass.
The iCluster Zooms employ a fixed co-moving softeninglength for the highest resolution dark matter particles εDM =2.84kpc; a softening length for baryonic collisionless particles(stars and black holes) that is capped at a maximum value ofεbaryon = 1.42kpc. An adaptive softening scheme is adopted forthe gas cells, wherein the softening length is proportional to thecell size. The mass resolution for the gas cells located in the highresolution region are successively refined to lie within a factor of2 of the mass of baryonic particles (roughly 107M� while themasses of the high resolution dark matter particles are kept fixedat ∼ 5.8 × 10⁷M�. An appropriately cascading scale is adoptedfor the medium and low resolution dark matter particles that get re-fined at subsequent levels. Details of the refinement scheme and there-simulation methodology can be found in Popa et al. (in prepara-tion) and Pillepich et al. (in preparation).
Cataloging the abundance and mass spectrum of sub haloesbound to these selected cluster scale halos, we compare theseLCDM predicted properties to those derived directly from thelensing data. For each selected simulated cluster from the1014 IllustrisHaloes , the SHMF was computed and the mean andstandard deviation computed for the entire sample of clusters. Inorder to estimate the variance from the iCluster Zooms, we com-puted the dispersion adopting the following method. We computethe SHMF for each zoom cluster at ≈ 20 snapshots, correspondingto the zcluster ± 0.1. Each SHMF is then scaled by the ratio of thehalo mass at the cluster redshift snapshot to that at the given i-thsnapshot, thus correcting for evolution with halo mass. The min-imum and maximum SHMF thus obtained define the boundariesof the scatter that is plotted. Given that we have only two massiveclusters that are truly comparable to the HSTFFs, this is the schemewe adopted to at arrive a rough estimate of the scatter.
From the 1014 Illustris Haloes and iCluster Zooms, we se-lected only the subhaloes that hosted luminous cluster members.We compare the data and simulations within the same projectedarea as spanned by the HSTFF lens models. he lens models extendout only to a fraction of the virial radius to only about∼ 30−50%.Within this region we then count match by mimic-ing the selectionof the same number of bright galaxies from the simulation and con-struct the mass function of their host dark matter sub haloes. TTheresults of the comparisons of the count-matched sub haloes are de-tailed in the next section. In order to make an abundance matchedcomparison with our HSTFF datasets, we selected the subhaloesthat hosted the 733 brightest galaxies in the iCluster Zooms andthe 1014 Illustris Haloes for Abell 2744, 175 galaxies for compari-son with MACSJ 0416 and 217 for MACSJ 1149. Ideally, we wouldhave liked to adopt the same magnitude cut for cluster members inIllustris as done with the observational data in the K-band to se-lect the equivalent simulated cluster members. However, since theIllustris simulations are unable to match the observed luminosityfunction of cluster galaxies at these epochs we do not adopt thisscheme. Work to improve the match with observed cluster galax-ies is actively on-going within the Illustris collaboration (Pillepichet al., private communication). Instead, what we do is simply se-lect the dark matter sub haloes that host the equivalent number of
MNRAS 000, 1–?? (0000)

Substructure in HSTFF clusters 11
brightest cluster galaxies to compare with the lensing data. This inturn best mimics our observational selection. An important pointhas been made recently in the literature about the systematics in-troduced by the choice of halo-finder algorithm used in the de-termination of bound sub haloes from simulations and thereforethe SHMF. Onions et al. (2012), Knebe et al. (2013) and van denBosch & Jiang (2016) have shown that SHMFs determined by dif-ferent halo-finders agree only to within ∼ 20% at the low massend. At the massive end of the SHMF, they report that sub halofinders that identify using density criteria in configuration spacecan under-predict by more than an order of magnitude. We need tobe attentive to these systematic effects arising from different meth-ods used to identify sub haloes while interpreting our results. It isknown that there is evolution in the properties of bound subhaloeswith parent halo mass (van den Bosch et al. 2005). Therefore, toillustrate this dependence on cluster mass, we also examined thesubhalo properties in Illustris clusters with lower masses in therange of 1013.5 − 1014M�, even lower than those considered inthe 1014 Illustris Haloes. In order to understand the effect of halo-to-halo variance on the high mass end of the SHMFs we we usedanalytic predictions for a cluster halo with mass∼ 1015M� withinthe equivalent spatial region that best reflects the FOV of HSTFFdata.
Finally, it has to be noted that highly efficient massive lenseslike those selected in the HSTFF sample tend to have complicatedmass distributions, enhanced surface mass densities due to interac-tions and on-going mergers that in fact make them desirable targetsfor study. The peculiar dynamics of these merging sub-clusters,with several components interacting, reflect rare geometries andphase-space configurations: that are not available in the entire Il-lustris box and amongst the iCluster Zooms even though the zoomruns have comparable masses to the HSTFF clusters studied here.
8 COMPARISON WITH ILLUSTRIS SIMULATIONS
To compare the results of the lensing analysis with Illustris simu-lations, we focus primarily on the iCluster Zooms, particularly onthe more massive iCluster Zoom 1. A dark matter only run as wellas one implementing the full physics was performed for the iClus-ter Zooms. We also study the 1014 Illustris Haloes in the box, withM > 1014M� within δz ± 0.1 in redshift of each of the HSTFFclusters (z ∼ 0.3 − 0.6). Our analysis is centered on comparisonwith the iCluster Zooms.
First, we compare the lensing derived SHMFs for each of thethree HSTFF clusters studied here with that derived from iClusterZoom 1 over the same projected area as the data at the appropri-ate redshift. The ACS image footprint corresponds in radius to ap-proximately one third to one half the viral radius for these clusters.We select sub haloes in iCluster Zoom 1 and for the 1014 IllustrisHaloes from within the corresponding projected radii correspond-ing to the ACS footprint for each cluster. We then proceed to makea member galaxy count-matched comparison after imposing thisradial cut. This selection of sub haloes associated with the num-ber of brightest cluster galaxies in each of these cluster lenses isreferred to as the count-matched SHMF hereafter. We caution herethat it is known that the luminosity function of real clusters is notappropriately reproduced by these simulations at the present time.
Substructure is ubiquitous in the iCluster Zooms as well asin the 1014 Illustris Haloes clusters and the SHMF as predicted byLCDM is dominated by low mass halos in terms of their abundance.The HSTFF data have helped us push the mass scale of detected
Figure 4. Comparison of the SHMF derived for Abell 2744 (with overplot-ted modeling errors derived from the dispersion in N-Bayesian realizationsfor the key fiducial parameters rt∗ and σ0∗) with Dark Matter only andFull Physics Illustris iCluster Zooms: The SHMF derived from the HST FFdata (red histogram) for Abell 2744 is plotted along with that derived fromthe iCluster Zooms. The dark matter only run is plotted as a solid blackhistogram with the dispersion marked in the dark grey band and the fullphysics run (grey histogram) and corresponding dispersion shown as thelight grey band. Sub haloes within 0.5Rvir that corresponds to the FOVof ACS over which the lensing model has been reconstructed are extractedfrom iCluster Zoom 1. The full physics run of iCluster Zoom 1 includessub-grid models for the physical processes that are relevant to galaxy for-mation. From the full physics run we have selected only sub haloes that hosta stellar component.
subhaloes down by two orders of magnitude. However, we still havea resolution limit of 109.5M�, even prior to which incompletenessstarts to set in as seen in Figure 3. In simulated LCDM clusters,the substructure mass function extends well below this limit thanwe cannot probe in these cluster lenses even at this exquisite depth.Given this we make two kinds of selections within simulations: (i)an abundance/count matched version - wherein we select the darkmatter subhaloes associated with the brightest 563, 175 and 217cluster galaxies as in Abell 2744, MACSJ 0416 and MACSJ 1149respectively; and (ii) a selection that includes all subhaloes withmasses M > 109M� that contain a luminous component. In theIllustris 1014 Illustris Haloes (run that includes the full sub-gridphysics) we have 137 clusters at the redshift (z ∼ 0.3) of Abell2744; 117 clusters at the redshift (z ∼ 0.4) of MACSJ 0416 and66 clusters at the redshift (z ∼ 0.5) of MACSJ 1149. We now pro-ceed compare the SHMF derived from the HSTFF data with thosederived from the appropriate redshift iCluster Zoom 1 snapshot foreach of the three clusters.
Firstly, we find that the SHMFs derived within 0.5Rvir fromthe dark matter only iCluster Zoom 1 snapshot and the full physicsiCluster Zoom 1 snapshot shown in Figure 4 are remarkably sim-ilar over the mass scales probed here. Both these SHMFs derivedfrom the iCluster Zoom 1 run are also in very good agreement withthe lensing derived SHMF for Abell 2744 at the high-mass end andthe diverge at the masses below 1010M� due to the incomplete-ness in the lensing data. Further as seen in Figure 5, the lensingderived SHMFs with different assumptions for the fidelity of howlight traces masses are also fairly similar. This suggests that giventhe current quality of data in the HSTFFs, the SHMF is fairly robustand cannot constrain the details of how galaxies populate dark mat-ter halos for sub haloes more massive than 1010M�. Differences
MNRAS 000, 1–?? (0000)

12 Natarajan, et al.
Figure 5. Comparing lensing derived SHMFs (with estimated model errors)for different assumptions relating mass to light: here we plot the SHMFs de-rived from the best-fit lensing model for Abell 2744 using the Faber-Jacksonand Kormendy luminosity scaling laws (FJ scaling), with that derived forthe best-fit lens model using the scaling laws from the full physics run ofthe Illustris simulations (Illustris scaling).
start to appear at lower sub halo masses. In Figure 6, we note thatthe count-matched SHMFs from Abell 2744 and iCluster Zoom 1are in excellent agreement both in amplitude and shape over 4 or-ders of magnitude in sub halo mass, from 109−13M�, with a slightexcess seen at ∼ 1011M�, which we show can be completely ac-counted for when cosmic variance can be more accurately takeninto account with the analytic calculation of the SHMF.
In Figure 7, we plot the SHMF derived for the cluster lensAbell 2744 for the two scaling laws; that derived from iClusterZoom 1 as well as the analytically calculated SHMF for a 1015M�cluster halo that now includes an estimate of the halo-to-halo scat-ter shown as the dull green band in Figure 7. We note the excellentagreement between the various independently determined SHMFsconsistent with our estimate of cosmic variance.
We now examine the dependence of the SHMF on parent halomass using the 1014 Illustris Haloes in Figure 8. As expected theo-retically from the work of van den Bosch et al. (2005), the peak ofthe SHMF is sensitive to parent halo mass and tends to shift towardhigher sub halo masses for more massive parent halos. The slope atthe high mass end, however, appears to converge independent of theparent halo mass. The trends clearly show that the SHMF for Abell2744 agrees best with that derived from the equivalent total masscluster - the iCluster Zoom 1 run. We investigate the role of variousprojections from the iCluster Zoom 1 run to assess their contribu-tion to the error budget in the derived SHMFs. For Abell 2744 asshown in Figure 9, we note that the SHMF derived from 3 inde-pendent projections from the iCluster Zoom 1 snapshot convergefor sub halo masses > 1010.5M� and the agreement in both slopeand amplitude are excellent at the high mass end. Although theiCluster Zoom 1 snapshot at z ∼ 0.3 clearly offers the appropriatemass equivalent for the cluster lens Abell 2744, we find that thereis considerable discrepancy when comparing the radial distributionof sub halos, shown in Figure 10. Simulated galaxies and conse-quently their host sub haloes appear to be much less concentratedin the inner regions compared to the real galaxies in Abell 2744.The mis-match in the radial distribution suggests that mass segre-gation is more efficient in observed cluster lenses while tidal strip-ping, tidal heating and dynamical friction might be over-efficient in
Figure 6. Comparison of the count-matched SHMF derived for Abell 2744:the SHMF from the HST FF data (red histogram) and the count-matchedSHMF from iCluster Zoom 1 are plotted. Here mimicking the observationalselection, only the dark matter subhaloes associated with the brightest 563cluster galaxies that lie within 0.5Rvir in the snapshot at z ∼ 0.3 of iClus-ter Zoom 1 are plotted.
Figure 7. Comparison with the analytically predicted SHMF: the lensingderived SHMF (with model errors) for the two independent scaling laws isoverplotted along with the analytically calculated SHMF for a cluster halowith mass equivalent to that of Abell 2744. This analytic estimate includesthe halo-to-halo scatter that is shown in the dull green band.
simulations, leading to the dramatic reduction in the masses of in-falling sub haloes. Some of this disagreement could also arise fromsystematics introduced by algorithmic limitations of sub halo find-ers as noted earlier. What is clear though is that the HSTFF clustersrepresent transitory merging states of massive clusters that are notcaptured in simulation outputs. While the lensing signal itself is in-dependent of the dynamical state of a cluster, the transient complexdynamics during an on-going merging event appears to alter the ra-dial distribution of substructure significantly. In order to probe therole of the dynamical state, in future work, we intend to performzoom-in runs while tracking the anatomy of the merger process bywriting out output files more densely sampled in time, in particularjust prior to and right after major sub-cluster mergers.
The mass distribution for MACSJ 0416 is the best constrainedof the 3 HSTFF clusters studied here since cluster membership hasbeen largely spectroscopically determined. Abell 2744 has a larger
MNRAS 000, 1–?? (0000)

Substructure in HSTFF clusters 13
Figure 8. Comparison of the SHMF derived for Abell 2744 (count-matched) with that of the SHMF derived from simulated massive clusters inIllustris to show dependence on parent halo mass. Here we plot the SHMFfrom the HST FF data (red histogram) and the count-matched SHMF fromthe two simulated zoomed in massive clusters with masses of 1015.3M�iCluster Zoom 1 and 1014.5M� iCluster Zoom 2 as well as from a largersample of 137 1014M� Illustris clusters. Once again mimicking the ob-servational selection, only the dark matter subhaloes associated with thebrightest 563 cluster galaxies that lie within 0.5Rvir - count matched tothe HFF derived SHMF for Abell 2744 - are plotted.
Figure 9. Projection Effects on the derived SHMF from simulations: herewe plot the SHMF derived from the zoomed in Illustris cluster iClusterZoom 1 derived by projecting along three distinct axes within 0.5Rvir.Note that the dispersion arising from projection effects is negligible.
number of identified cluster members (namely 563), though fewerof them are spectroscopically confirmed, while for MACSJ 0416despite having fewer selected cluster galaxies (numbering 175),they are all spectroscopically confirmed to be in the cluster. Pro-ceeding to compare the overall abundance and count matched ver-sion of the SHMF for MACSJ 0416, once again we find excellentagreement with the appropriate redshift snapshot over the equiv-alent projected area corresponding to within 0.3Rvir of iClusterZoom 1 grown in an LCDM cosmology. Once again at the highmass end of the SHMF, both the dark matter only snapshot and thefull physics snapshot from iCluster Zoom 1 agree rather well withthe lensing derived SHMF (Figure 11). We note for MACSJ 0416as well, the weak dependence of the lensing derived SHMFs on the
Figure 10. Radial distribution of the SHMF derived from iCluster Zoom 1compared to that of the lensing derived SHMF for Abell 2744 from the HSTFF data (red histogram). The snapshot was selected from the full physics runof iCluster Zoom 1. We clearly see that galaxies in iCluster Zoom 1 are notas centrally concentrated as Abell 2744.
assumed scaling laws that are adopted to relate light and mass inthe lensing inversion (Figure 12). There is once again, as for Abell2744, strikingly good agreement between observations and simu-lations when we select dark matter sub haloes associated with theequivalent number of brightest cluster galaxies. In Figure 6, theSHMF derived from iCluster Zoom 1 is number matched with theobservational selection for Abell 2744 and includes only the DMhaloes that host the brightest 563 cluster galaxies. The same is donewith the appropriate redshift snapshot of iCluster Zoom 1, whereinonly dark matter sub haloes hosting the brightest 175 galaxieswithin 0.3Rvir are selected for comparison with the MACSJ 0416data, shown in Figure 13. The match is again excellent overall, andhere too, we note a slight excess in the number of sub haloes de-rived from the HSTFF data compared to those selected from iClus-ter Zoom 1 at ∼ 1011M� as in the case for Abell 2744. However,upon overplotting the analytically determined SHMF that includesan estimate of the halo-to-halo scatter (Figure 14), the excess is en-tirely consistent with what is expected from cosmic variance. Wefind the same trends and dependence of the SHMF with parent halomass for MACSJ 0416 (Figure 15) as we did for Abell 2744. Andonce again projection effects do not scupper the robustness of theSHMF as a diagnostic of the underlying cosmological model (Fig-ure 16). The radial distribution of sub haloes, that is essentiallythe radial distribution of early-type bright galaxies in MACSJ 0416is not reproduced by the simulated cluster iCluster Zoom 1. Onceagain, we find that sub haloes are more diffusely distributed iniCluster Zooms compared to the more concentration distributionseen in MACSJ 0416 (Figure 17).
In recently published work, Grillo et al. (2015) independentlydetermined substructure properties for MACSJ 0416 employing thesame methodology outlined here. The pre-HSTFF data mass modelthat they construct for this cluster using shallower CLASH sur-vey data includes far fewer strong lensing constraints compared toour analysis here. However, for our analysis of the HSTFF dataof MACSJ 0416 presented here, we have used their cluster galaxycatalog as mentioned earlier. Adopting the same modeling method-ology as us using LENSTOOL, their best-fit mass model also com-prised of 2 large scale components and 175 galaxy scale compo-nents. Upon comparison of the derived mass function of dark mat-
MNRAS 000, 1–?? (0000)
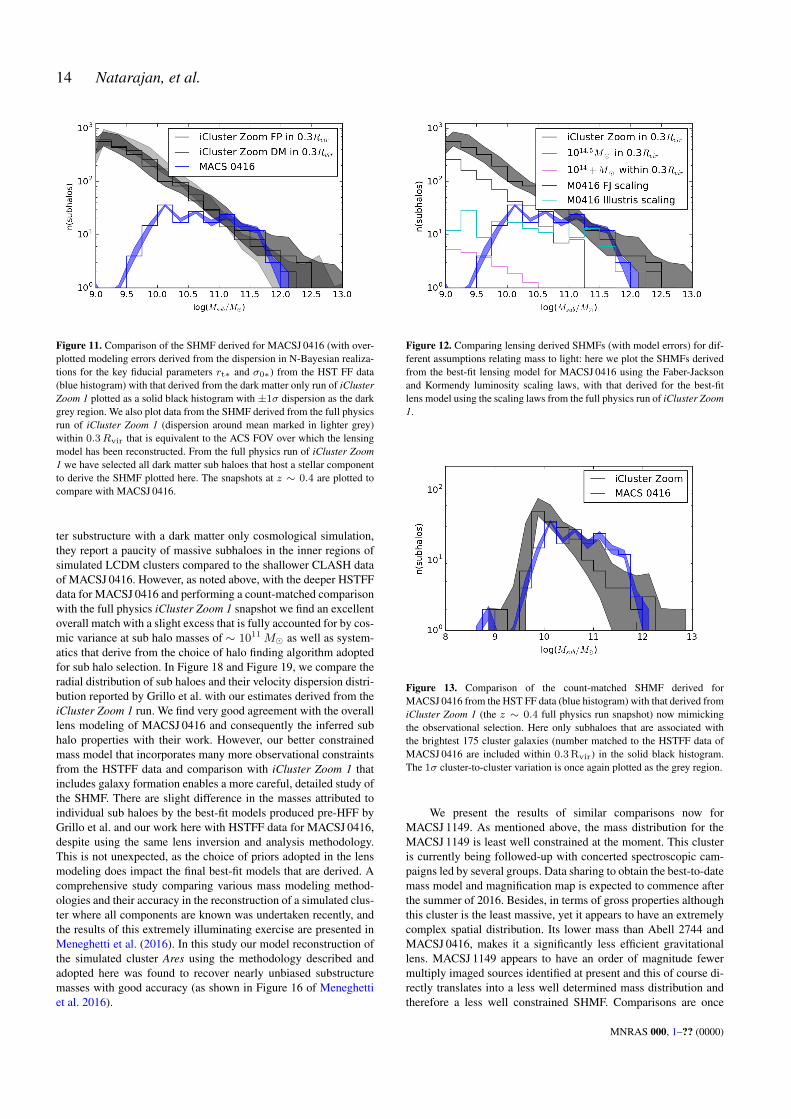
14 Natarajan, et al.
Figure 11. Comparison of the SHMF derived for MACSJ 0416 (with over-plotted modeling errors derived from the dispersion in N-Bayesian realiza-tions for the key fiducial parameters rt∗ and σ0∗) from the HST FF data(blue histogram) with that derived from the dark matter only run of iClusterZoom 1 plotted as a solid black histogram with ±1σ dispersion as the darkgrey region. We also plot data from the SHMF derived from the full physicsrun of iCluster Zoom 1 (dispersion around mean marked in lighter grey)within 0.3Rvir that is equivalent to the ACS FOV over which the lensingmodel has been reconstructed. From the full physics run of iCluster Zoom1 we have selected all dark matter sub haloes that host a stellar componentto derive the SHMF plotted here. The snapshots at z ∼ 0.4 are plotted tocompare with MACSJ 0416.
ter substructure with a dark matter only cosmological simulation,they report a paucity of massive subhaloes in the inner regions ofsimulated LCDM clusters compared to the shallower CLASH dataof MACSJ 0416. However, as noted above, with the deeper HSTFFdata for MACSJ 0416 and performing a count-matched comparisonwith the full physics iCluster Zoom 1 snapshot we find an excellentoverall match with a slight excess that is fully accounted for by cos-mic variance at sub halo masses of ∼ 1011M� as well as system-atics that derive from the choice of halo finding algorithm adoptedfor sub halo selection. In Figure 18 and Figure 19, we compare theradial distribution of sub haloes and their velocity dispersion distri-bution reported by Grillo et al. with our estimates derived from theiCluster Zoom 1 run. We find very good agreement with the overalllens modeling of MACSJ 0416 and consequently the inferred subhalo properties with their work. However, our better constrainedmass model that incorporates many more observational constraintsfrom the HSTFF data and comparison with iCluster Zoom 1 thatincludes galaxy formation enables a more careful, detailed study ofthe SHMF. There are slight difference in the masses attributed toindividual sub haloes by the best-fit models produced pre-HFF byGrillo et al. and our work here with HSTFF data for MACSJ 0416,despite using the same lens inversion and analysis methodology.This is not unexpected, as the choice of priors adopted in the lensmodeling does impact the final best-fit models that are derived. Acomprehensive study comparing various mass modeling method-ologies and their accuracy in the reconstruction of a simulated clus-ter where all components are known was undertaken recently, andthe results of this extremely illuminating exercise are presented inMeneghetti et al. (2016). In this study our model reconstruction ofthe simulated cluster Ares using the methodology described andadopted here was found to recover nearly unbiased substructuremasses with good accuracy (as shown in Figure 16 of Meneghettiet al. 2016).
Figure 12. Comparing lensing derived SHMFs (with model errors) for dif-ferent assumptions relating mass to light: here we plot the SHMFs derivedfrom the best-fit lensing model for MACSJ 0416 using the Faber-Jacksonand Kormendy luminosity scaling laws, with that derived for the best-fitlens model using the scaling laws from the full physics run of iCluster Zoom1.
Figure 13. Comparison of the count-matched SHMF derived forMACSJ 0416 from the HST FF data (blue histogram) with that derived fromiCluster Zoom 1 (the z ∼ 0.4 full physics run snapshot) now mimickingthe observational selection. Here only subhaloes that are associated withthe brightest 175 cluster galaxies (number matched to the HSTFF data ofMACSJ 0416 are included within 0.3 Rvir) in the solid black histogram.The 1σ cluster-to-cluster variation is once again plotted as the grey region.
We present the results of similar comparisons now forMACSJ 1149. As mentioned above, the mass distribution for theMACSJ 1149 is least well constrained at the moment. This clusteris currently being followed-up with concerted spectroscopic cam-paigns led by several groups. Data sharing to obtain the best-to-datemass model and magnification map is expected to commence afterthe summer of 2016. Besides, in terms of gross properties althoughthis cluster is the least massive, yet it appears to have an extremelycomplex spatial distribution. Its lower mass than Abell 2744 andMACSJ 0416, makes it a significantly less efficient gravitationallens. MACSJ 1149 appears to have an order of magnitude fewermultiply imaged sources identified at present and this of course di-rectly translates into a less well determined mass distribution andtherefore a less well constrained SHMF. Comparisons are once
MNRAS 000, 1–?? (0000)
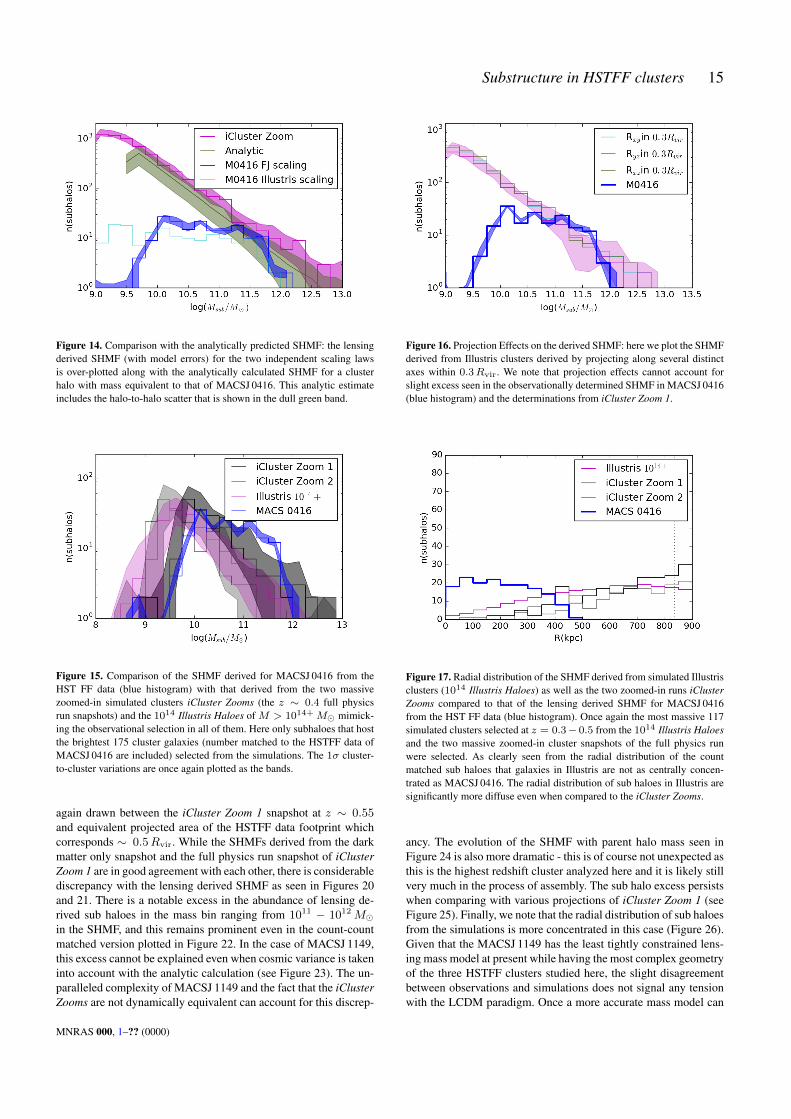
Substructure in HSTFF clusters 15
Figure 14. Comparison with the analytically predicted SHMF: the lensingderived SHMF (with model errors) for the two independent scaling lawsis over-plotted along with the analytically calculated SHMF for a clusterhalo with mass equivalent to that of MACSJ 0416. This analytic estimateincludes the halo-to-halo scatter that is shown in the dull green band.
Figure 15. Comparison of the SHMF derived for MACSJ 0416 from theHST FF data (blue histogram) with that derived from the two massivezoomed-in simulated clusters iCluster Zooms (the z ∼ 0.4 full physicsrun snapshots) and the 1014 Illustris Haloes of M > 1014+M� mimick-ing the observational selection in all of them. Here only subhaloes that hostthe brightest 175 cluster galaxies (number matched to the HSTFF data ofMACSJ 0416 are included) selected from the simulations. The 1σ cluster-to-cluster variations are once again plotted as the bands.
again drawn between the iCluster Zoom 1 snapshot at z ∼ 0.55and equivalent projected area of the HSTFF data footprint whichcorresponds ∼ 0.5Rvir. While the SHMFs derived from the darkmatter only snapshot and the full physics run snapshot of iClusterZoom 1 are in good agreement with each other, there is considerablediscrepancy with the lensing derived SHMF as seen in Figures 20and 21. There is a notable excess in the abundance of lensing de-rived sub haloes in the mass bin ranging from 1011 − 1012M�in the SHMF, and this remains prominent even in the count-countmatched version plotted in Figure 22. In the case of MACSJ 1149,this excess cannot be explained even when cosmic variance is takeninto account with the analytic calculation (see Figure 23). The un-paralleled complexity of MACSJ 1149 and the fact that the iClusterZooms are not dynamically equivalent can account for this discrep-
Figure 16. Projection Effects on the derived SHMF: here we plot the SHMFderived from Illustris clusters derived by projecting along several distinctaxes within 0.3Rvir. We note that projection effects cannot account forslight excess seen in the observationally determined SHMF in MACSJ 0416(blue histogram) and the determinations from iCluster Zoom 1.
Figure 17. Radial distribution of the SHMF derived from simulated Illustrisclusters (1014 Illustris Haloes) as well as the two zoomed-in runs iClusterZooms compared to that of the lensing derived SHMF for MACSJ 0416from the HST FF data (blue histogram). Once again the most massive 117simulated clusters selected at z = 0.3− 0.5 from the 1014 Illustris Haloesand the two massive zoomed-in cluster snapshots of the full physics runwere selected. As clearly seen from the radial distribution of the countmatched sub haloes that galaxies in Illustris are not as centrally concen-trated as MACSJ 0416. The radial distribution of sub haloes in Illustris aresignificantly more diffuse even when compared to the iCluster Zooms.
ancy. The evolution of the SHMF with parent halo mass seen inFigure 24 is also more dramatic - this is of course not unexpected asthis is the highest redshift cluster analyzed here and it is likely stillvery much in the process of assembly. The sub halo excess persistswhen comparing with various projections of iCluster Zoom 1 (seeFigure 25). Finally, we note that the radial distribution of sub haloesfrom the simulations is more concentrated in this case (Figure 26).Given that the MACSJ 1149 has the least tightly constrained lens-ing mass model at present while having the most complex geometryof the three HSTFF clusters studied here, the slight disagreementbetween observations and simulations does not signal any tensionwith the LCDM paradigm. Once a more accurate mass model can
MNRAS 000, 1–?? (0000)

16 Natarajan, et al.
Figure 18. Comparison of sub halo properties in MACSJ 0416 inferredfrom lens modeling in this work and from the CLASH collaboration (Grilloet al. 2015) with that derived from the 1015M� cluster from the Illustrissuite - the radial distribution of subhaloes.
Figure 19. Comparison of sub halo properties in MACSJ 0416 inferredfrom lens modeling in this work and from the CLASH collaboration (Grilloet al. 2015) with that derived from the 1015M� cluster from the Illustrissuite - the velocity dispersion function of subhaloes. We find very goodagreement between the 2 best-fit mass models and the iCluster Zooms
.
be constructed, it would be instructive to re-do the above analysis,which we hope to tackle in future work once spectroscopic data isavailable to tighten model constraints.
Finally, we present the 3-dimensional visualization of the sub-structure distribution derived from the HSTFF data for all threeclusters in Figures 27-29.
9 DISCUSSION AND CONCLUSIONS
One of the key predictions of the standard LCDM model is thepresence of abundant substructure within collapsed, virialized ha-los. The SHMF and other substructure properties like their radialdistribution and velocity dispersion functions can be determinedboth analytically and derived from high resolution N-body simula-tions. Despite gaps in our understanding of the physics of galaxyformation, translating from observations of galaxies in clusters to
Figure 20. Comparison of the SHMF derived for MACSJ 1149 (with over-plotted modeling errors derived from the dispersion in N-Bayesian realiza-tions for the key fiducial parameters rt∗ and σ0∗) from the HST FF data(green histogram) with that derived from the dark matter only snapshot ofiCluster Zoom 1 plotted as a solid black histogram with ±1σ dispersion asthe grey region. The z ∼ 0.55 snapshot of iCluster Zoom 1 was chosento match the redshift of MACSJ 1149. We also plot data of the SHMF de-rived from the full physics run of iCluster Zoom 1 (dispersion around meanmarked in lighter grey) within 0.5Rvir that is equivalent to the ACS FOVover which the lensing model has been reconstructed.
Figure 21. Comparing lensing derived SHMFs for different assumptionsrelating mass to light: here we plot the SHMFs (with model errors) derivedfrom the best-fit lensing model for MACSJ 1149 using the Faber-Jacksonand Kormendy luminosity scaling laws, with that derived for the best-fitlens model using the scaling laws from the full physics run of iCluster Zoom1.
the derived dark matter substructure using cluster lenses has of-fered an important test of the LCDM paradigm. Several criteriamust be met by a large-scale numerical simulation of structure for-mation in order to permit a meaningful comparison with observa-tions like the ones discussed by us here. Specifically, the compari-son of a lensing-derived SHMF with dark-matter-only simulations(as performed in previous works) does not enable robust testingof the predictions of the LCDM paradigm. For the analysis pre-sented in this paper, it was thus crucial to choose simulations thatself-consistently include the effects of baryonic physics. We chosethe Illustris suite of simulations which deploys the moving-meshcode AREPO and includes sub-grid models for galaxy formation
MNRAS 000, 1–?? (0000)
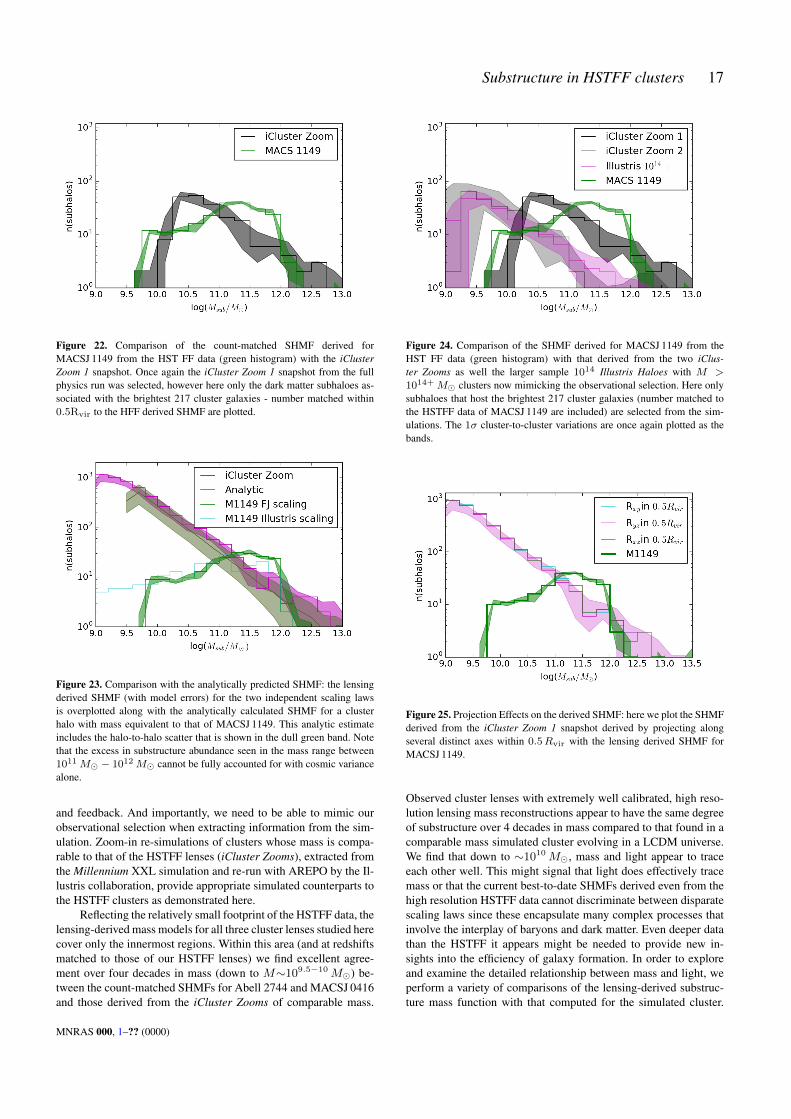
Substructure in HSTFF clusters 17
Figure 22. Comparison of the count-matched SHMF derived forMACSJ 1149 from the HST FF data (green histogram) with the iClusterZoom 1 snapshot. Once again the iCluster Zoom 1 snapshot from the fullphysics run was selected, however here only the dark matter subhaloes as-sociated with the brightest 217 cluster galaxies - number matched within0.5Rvir to the HFF derived SHMF are plotted.
Figure 23. Comparison with the analytically predicted SHMF: the lensingderived SHMF (with model errors) for the two independent scaling lawsis overplotted along with the analytically calculated SHMF for a clusterhalo with mass equivalent to that of MACSJ 1149. This analytic estimateincludes the halo-to-halo scatter that is shown in the dull green band. Notethat the excess in substructure abundance seen in the mass range between1011M� − 1012M� cannot be fully accounted for with cosmic variancealone.
and feedback. And importantly, we need to be able to mimic ourobservational selection when extracting information from the sim-ulation. Zoom-in re-simulations of clusters whose mass is compa-rable to that of the HSTFF lenses (iCluster Zooms), extracted fromthe Millennium XXL simulation and re-run with AREPO by the Il-lustris collaboration, provide appropriate simulated counterparts tothe HSTFF clusters as demonstrated here.
Reflecting the relatively small footprint of the HSTFF data, thelensing-derived mass models for all three cluster lenses studied herecover only the innermost regions. Within this area (and at redshiftsmatched to those of our HSTFF lenses) we find excellent agree-ment over four decades in mass (down to M∼109.5−10M�) be-tween the count-matched SHMFs for Abell 2744 and MACSJ 0416and those derived from the iCluster Zooms of comparable mass.
Figure 24. Comparison of the SHMF derived for MACSJ 1149 from theHST FF data (green histogram) with that derived from the two iClus-ter Zooms as well the larger sample 1014 Illustris Haloes with M >
1014+M� clusters now mimicking the observational selection. Here onlysubhaloes that host the brightest 217 cluster galaxies (number matched tothe HSTFF data of MACSJ 1149 are included) are selected from the sim-ulations. The 1σ cluster-to-cluster variations are once again plotted as thebands.
Figure 25. Projection Effects on the derived SHMF: here we plot the SHMFderived from the iCluster Zoom 1 snapshot derived by projecting alongseveral distinct axes within 0.5Rvir with the lensing derived SHMF forMACSJ 1149.
Observed cluster lenses with extremely well calibrated, high reso-lution lensing mass reconstructions appear to have the same degreeof substructure over 4 decades in mass compared to that found in acomparable mass simulated cluster evolving in a LCDM universe.We find that down to ∼1010M�, mass and light appear to traceeach other well. This might signal that light does effectively tracemass or that the current best-to-date SHMFs derived even from thehigh resolution HSTFF data cannot discriminate between disparatescaling laws since these encapsulate many complex processes thatinvolve the interplay of baryons and dark matter. Even deeper datathan the HSTFF it appears might be needed to provide new in-sights into the efficiency of galaxy formation. In order to exploreand examine the detailed relationship between mass and light, weperform a variety of comparisons of the lensing-derived substruc-ture mass function with that computed for the simulated cluster.
MNRAS 000, 1–?? (0000)

18 Natarajan, et al.
Figure 26. Radial distribution of the sub halo mass function derived fromsimulated Illustris clusters and iCluster Zoom 1 compared to that of thelensing derived SHMF for MACSJ 1149 from the HST FF data (green his-togram). Once again the most massive 66 simulated clusters with M >
1014+M� were selected at z = 0.45 − 0.65 from the Illustris simula-tion box comprising the 1014 Illustris Haloes were selected from the fullphysics run of Illustris. We also plot the radial distribution of the countmatched sub haloes from two iCluster Zooms. We clearly see in this casethat surprisingly, galaxies in the simulations do better mimic the distributionin MACSJ 1149 in the inner regions than for the other two HSTFF clusterlenses.
Figure 27. 3D visualization of the lensing derived substructure distributionfor Abell 2744.
We note a small excess in the abundance of subhalos at massesM∼1011M� for all three clusters studied here; in the case of Abell2744 and MACSJ 0416 this mild discrepancy can be entirely ac-counted for by cosmic variance, as evidenced in the comparisonwith the analytic prediction that estimates the halo-to-halo scatterand expected systematics arising from the choice of halo-finding al-gorithms. The agreement with simulations is poorer for the HSTFFtarget MACSJ 1149, possibly because the mass distribution for thiscomplex assembling structure is significantly less well constrainedby the existing lensing data, which show fewer strong-lensing fea-tures, with less comprehensive spectroscopic confirmation than isavailable for the two other clusters studied here. Despite its scale-free nature, in LCDM the SHMF depends on the total mass of the
Figure 28. 3D visualization of the lensing derived substructure distributionfor MACSJ 0416.
Figure 29. 3D visualization of the lensing derived substructure distributionfor MACSJ 1149.
parent halo, a trend demonstrated clearly by us over a range of red-shifts from z∼0.3 to 0.55.
The observed radial distribution of subhaloes, however, is dis-crepant with predictions of simulations for all three of our targetclusters. Possible reasons for this mismatch are limitations arisingfrom approximations and assumptions made in sub-grid physicsmodels, for example over-efficient AGN feedback that may pref-erentially suppress star formation in more massive halos and over-efficient tidal stripping of infalling galaxies. We stress again thatselection for maximal lensing strength (as applied for the HSTFF)strongly favours dynamically complex and extremely massive sys-tems. Our careful comparison of subhalo properties suggests thatthe single iCluster Zoom run used in the comparison fails to fullycapture the dynamical complexity of disturbed, merging systemswith rapidly evolving geometries. In fact we suspect that suit-able counterparts (i.e., systems that match the HSTFF clusters inmass and explore the full range of dynamical states) do not existin any available simulation volume. Most importantly, our anal-ysis demonstrates that the HSTFF clusters are likely observed in
MNRAS 000, 1–?? (0000)
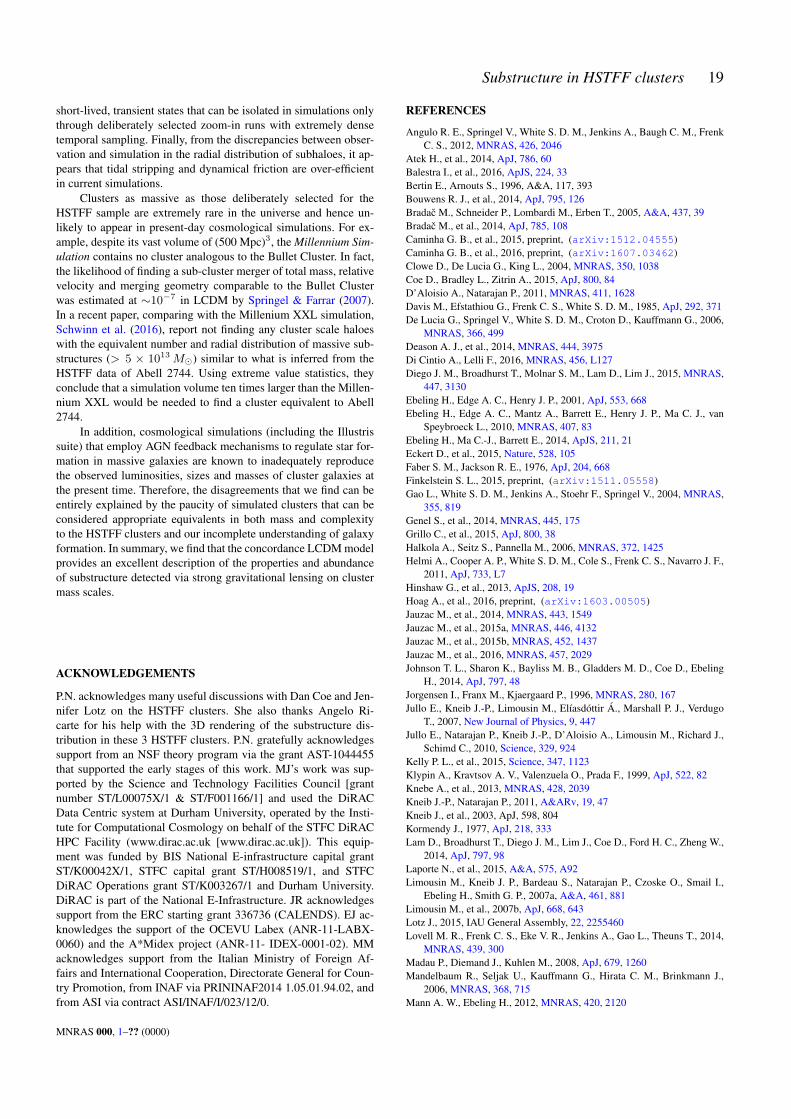
Substructure in HSTFF clusters 19
short-lived, transient states that can be isolated in simulations onlythrough deliberately selected zoom-in runs with extremely densetemporal sampling. Finally, from the discrepancies between obser-vation and simulation in the radial distribution of subhaloes, it ap-pears that tidal stripping and dynamical friction are over-efficientin current simulations.
Clusters as massive as those deliberately selected for theHSTFF sample are extremely rare in the universe and hence un-likely to appear in present-day cosmological simulations. For ex-ample, despite its vast volume of (500 Mpc)3, the Millennium Sim-ulation contains no cluster analogous to the Bullet Cluster. In fact,the likelihood of finding a sub-cluster merger of total mass, relativevelocity and merging geometry comparable to the Bullet Clusterwas estimated at ∼10−7 in LCDM by Springel & Farrar (2007).In a recent paper, comparing with the Millenium XXL simulation,Schwinn et al. (2016), report not finding any cluster scale haloeswith the equivalent number and radial distribution of massive sub-structures (> 5 × 10¹³M�) similar to what is inferred from theHSTFF data of Abell 2744. Using extreme value statistics, theyconclude that a simulation volume ten times larger than the Millen-nium XXL would be needed to find a cluster equivalent to Abell2744.
In addition, cosmological simulations (including the Illustrissuite) that employ AGN feedback mechanisms to regulate star for-mation in massive galaxies are known to inadequately reproducethe observed luminosities, sizes and masses of cluster galaxies atthe present time. Therefore, the disagreements that we find can beentirely explained by the paucity of simulated clusters that can beconsidered appropriate equivalents in both mass and complexityto the HSTFF clusters and our incomplete understanding of galaxyformation. In summary, we find that the concordance LCDM modelprovides an excellent description of the properties and abundanceof substructure detected via strong gravitational lensing on clustermass scales.
ACKNOWLEDGEMENTS
P.N. acknowledges many useful discussions with Dan Coe and Jen-nifer Lotz on the HSTFF clusters. She also thanks Angelo Ri-carte for his help with the 3D rendering of the substructure dis-tribution in these 3 HSTFF clusters. P.N. gratefully acknowledgessupport from an NSF theory program via the grant AST-1044455that supported the early stages of this work. MJ’s work was sup-ported by the Science and Technology Facilities Council [grantnumber ST/L00075X/1 & ST/F001166/1] and used the DiRACData Centric system at Durham University, operated by the Insti-tute for Computational Cosmology on behalf of the STFC DiRACHPC Facility (www.dirac.ac.uk [www.dirac.ac.uk]). This equip-ment was funded by BIS National E-infrastructure capital grantST/K00042X/1, STFC capital grant ST/H008519/1, and STFCDiRAC Operations grant ST/K003267/1 and Durham University.DiRAC is part of the National E-Infrastructure. JR acknowledgessupport from the ERC starting grant 336736 (CALENDS). EJ ac-knowledges the support of the OCEVU Labex (ANR-11-LABX-0060) and the A*Midex project (ANR-11- IDEX-0001-02). MMacknowledges support from the Italian Ministry of Foreign Af-fairs and International Cooperation, Directorate General for Coun-try Promotion, from INAF via PRININAF2014 1.05.01.94.02, andfrom ASI via contract ASI/INAF/I/023/12/0.
REFERENCES
Angulo R. E., Springel V., White S. D. M., Jenkins A., Baugh C. M., FrenkC. S., 2012, MNRAS, 426, 2046
Atek H., et al., 2014, ApJ, 786, 60Balestra I., et al., 2016, ApJS, 224, 33Bertin E., Arnouts S., 1996, A&A, 117, 393Bouwens R. J., et al., 2014, ApJ, 795, 126Bradac M., Schneider P., Lombardi M., Erben T., 2005, A&A, 437, 39Bradac M., et al., 2014, ApJ, 785, 108Caminha G. B., et al., 2015, preprint, (arXiv:1512.04555)Caminha G. B., et al., 2016, preprint, (arXiv:1607.03462)Clowe D., De Lucia G., King L., 2004, MNRAS, 350, 1038Coe D., Bradley L., Zitrin A., 2015, ApJ, 800, 84D’Aloisio A., Natarajan P., 2011, MNRAS, 411, 1628Davis M., Efstathiou G., Frenk C. S., White S. D. M., 1985, ApJ, 292, 371De Lucia G., Springel V., White S. D. M., Croton D., Kauffmann G., 2006,
MNRAS, 366, 499Deason A. J., et al., 2014, MNRAS, 444, 3975Di Cintio A., Lelli F., 2016, MNRAS, 456, L127Diego J. M., Broadhurst T., Molnar S. M., Lam D., Lim J., 2015, MNRAS,
447, 3130Ebeling H., Edge A. C., Henry J. P., 2001, ApJ, 553, 668Ebeling H., Edge A. C., Mantz A., Barrett E., Henry J. P., Ma C. J., van
Speybroeck L., 2010, MNRAS, 407, 83Ebeling H., Ma C.-J., Barrett E., 2014, ApJS, 211, 21Eckert D., et al., 2015, Nature, 528, 105Faber S. M., Jackson R. E., 1976, ApJ, 204, 668Finkelstein S. L., 2015, preprint, (arXiv:1511.05558)Gao L., White S. D. M., Jenkins A., Stoehr F., Springel V., 2004, MNRAS,
355, 819Genel S., et al., 2014, MNRAS, 445, 175Grillo C., et al., 2015, ApJ, 800, 38Halkola A., Seitz S., Pannella M., 2006, MNRAS, 372, 1425Helmi A., Cooper A. P., White S. D. M., Cole S., Frenk C. S., Navarro J. F.,
2011, ApJ, 733, L7Hinshaw G., et al., 2013, ApJS, 208, 19Hoag A., et al., 2016, preprint, (arXiv:1603.00505)Jauzac M., et al., 2014, MNRAS, 443, 1549Jauzac M., et al., 2015a, MNRAS, 446, 4132Jauzac M., et al., 2015b, MNRAS, 452, 1437Jauzac M., et al., 2016, MNRAS, 457, 2029Johnson T. L., Sharon K., Bayliss M. B., Gladders M. D., Coe D., Ebeling
H., 2014, ApJ, 797, 48Jorgensen I., Franx M., Kjaergaard P., 1996, MNRAS, 280, 167Jullo E., Kneib J.-P., Limousin M., Elıasdottir A., Marshall P. J., Verdugo
T., 2007, New Journal of Physics, 9, 447Jullo E., Natarajan P., Kneib J.-P., D’Aloisio A., Limousin M., Richard J.,
Schimd C., 2010, Science, 329, 924Kelly P. L., et al., 2015, Science, 347, 1123Klypin A., Kravtsov A. V., Valenzuela O., Prada F., 1999, ApJ, 522, 82Knebe A., et al., 2013, MNRAS, 428, 2039Kneib J.-P., Natarajan P., 2011, A&ARv, 19, 47Kneib J., et al., 2003, ApJ, 598, 804Kormendy J., 1977, ApJ, 218, 333Lam D., Broadhurst T., Diego J. M., Lim J., Coe D., Ford H. C., Zheng W.,
2014, ApJ, 797, 98Laporte N., et al., 2015, A&A, 575, A92Limousin M., Kneib J. P., Bardeau S., Natarajan P., Czoske O., Smail I.,
Ebeling H., Smith G. P., 2007a, A&A, 461, 881Limousin M., et al., 2007b, ApJ, 668, 643Lotz J., 2015, IAU General Assembly, 22, 2255460Lovell M. R., Frenk C. S., Eke V. R., Jenkins A., Gao L., Theuns T., 2014,
MNRAS, 439, 300Madau P., Diemand J., Kuhlen M., 2008, ApJ, 679, 1260Mandelbaum R., Seljak U., Kauffmann G., Hirata C. M., Brinkmann J.,
2006, MNRAS, 368, 715Mann A. W., Ebeling H., 2012, MNRAS, 420, 2120
MNRAS 000, 1–?? (0000)
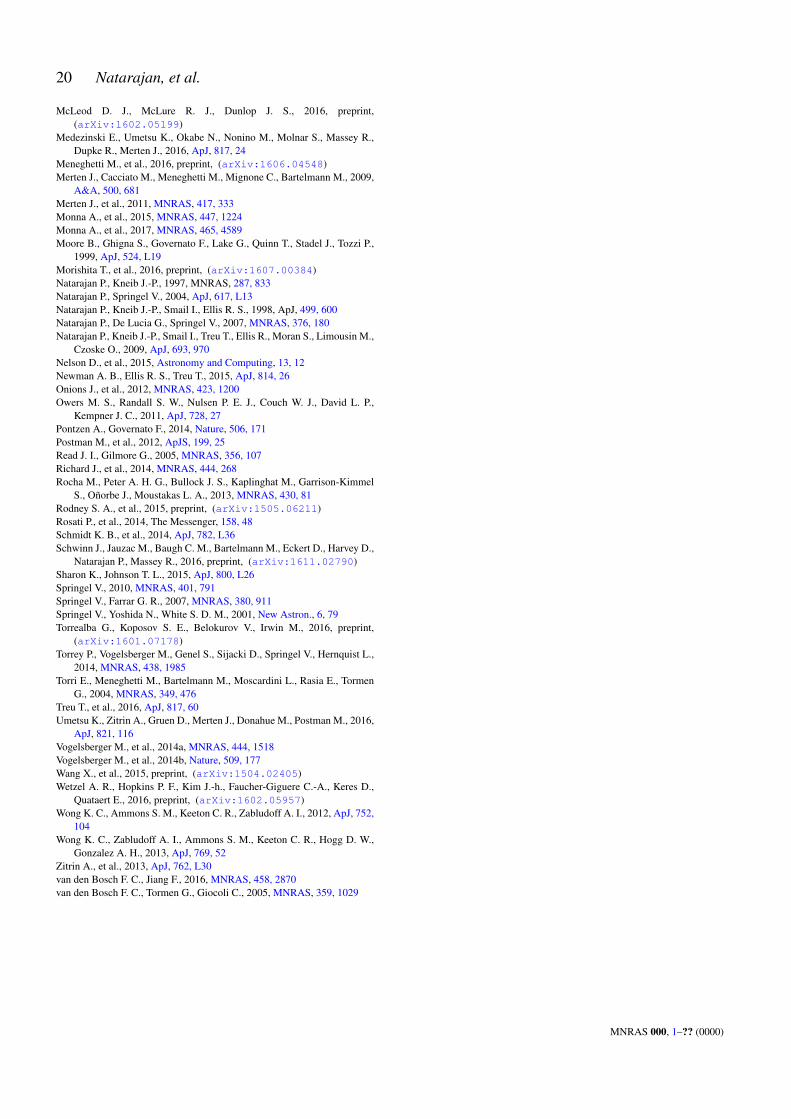
20 Natarajan, et al.
McLeod D. J., McLure R. J., Dunlop J. S., 2016, preprint,(arXiv:1602.05199)
Medezinski E., Umetsu K., Okabe N., Nonino M., Molnar S., Massey R.,Dupke R., Merten J., 2016, ApJ, 817, 24
Meneghetti M., et al., 2016, preprint, (arXiv:1606.04548)Merten J., Cacciato M., Meneghetti M., Mignone C., Bartelmann M., 2009,
A&A, 500, 681Merten J., et al., 2011, MNRAS, 417, 333Monna A., et al., 2015, MNRAS, 447, 1224Monna A., et al., 2017, MNRAS, 465, 4589Moore B., Ghigna S., Governato F., Lake G., Quinn T., Stadel J., Tozzi P.,
1999, ApJ, 524, L19Morishita T., et al., 2016, preprint, (arXiv:1607.00384)Natarajan P., Kneib J.-P., 1997, MNRAS, 287, 833Natarajan P., Springel V., 2004, ApJ, 617, L13Natarajan P., Kneib J.-P., Smail I., Ellis R. S., 1998, ApJ, 499, 600Natarajan P., De Lucia G., Springel V., 2007, MNRAS, 376, 180Natarajan P., Kneib J.-P., Smail I., Treu T., Ellis R., Moran S., Limousin M.,
Czoske O., 2009, ApJ, 693, 970Nelson D., et al., 2015, Astronomy and Computing, 13, 12Newman A. B., Ellis R. S., Treu T., 2015, ApJ, 814, 26Onions J., et al., 2012, MNRAS, 423, 1200Owers M. S., Randall S. W., Nulsen P. E. J., Couch W. J., David L. P.,
Kempner J. C., 2011, ApJ, 728, 27Pontzen A., Governato F., 2014, Nature, 506, 171Postman M., et al., 2012, ApJS, 199, 25Read J. I., Gilmore G., 2005, MNRAS, 356, 107Richard J., et al., 2014, MNRAS, 444, 268Rocha M., Peter A. H. G., Bullock J. S., Kaplinghat M., Garrison-Kimmel
S., Onorbe J., Moustakas L. A., 2013, MNRAS, 430, 81Rodney S. A., et al., 2015, preprint, (arXiv:1505.06211)Rosati P., et al., 2014, The Messenger, 158, 48Schmidt K. B., et al., 2014, ApJ, 782, L36Schwinn J., Jauzac M., Baugh C. M., Bartelmann M., Eckert D., Harvey D.,
Natarajan P., Massey R., 2016, preprint, (arXiv:1611.02790)Sharon K., Johnson T. L., 2015, ApJ, 800, L26Springel V., 2010, MNRAS, 401, 791Springel V., Farrar G. R., 2007, MNRAS, 380, 911Springel V., Yoshida N., White S. D. M., 2001, New Astron., 6, 79Torrealba G., Koposov S. E., Belokurov V., Irwin M., 2016, preprint,
(arXiv:1601.07178)Torrey P., Vogelsberger M., Genel S., Sijacki D., Springel V., Hernquist L.,
2014, MNRAS, 438, 1985Torri E., Meneghetti M., Bartelmann M., Moscardini L., Rasia E., Tormen
G., 2004, MNRAS, 349, 476Treu T., et al., 2016, ApJ, 817, 60Umetsu K., Zitrin A., Gruen D., Merten J., Donahue M., Postman M., 2016,
ApJ, 821, 116Vogelsberger M., et al., 2014a, MNRAS, 444, 1518Vogelsberger M., et al., 2014b, Nature, 509, 177Wang X., et al., 2015, preprint, (arXiv:1504.02405)Wetzel A. R., Hopkins P. F., Kim J.-h., Faucher-Giguere C.-A., Keres D.,
Quataert E., 2016, preprint, (arXiv:1602.05957)Wong K. C., Ammons S. M., Keeton C. R., Zabludoff A. I., 2012, ApJ, 752,
104Wong K. C., Zabludoff A. I., Ammons S. M., Keeton C. R., Hogg D. W.,
Gonzalez A. H., 2013, ApJ, 769, 52Zitrin A., et al., 2013, ApJ, 762, L30van den Bosch F. C., Jiang F., 2016, MNRAS, 458, 2870van den Bosch F. C., Tormen G., Giocoli C., 2005, MNRAS, 359, 1029
MNRAS 000, 1–?? (0000)