clough global long/short fund – second quarter 2018 ......jun 30, 2018 · expenses fell 5%. the...
TRANSCRIPT

Visit Ü www.cloughglobal.com or 1-855-425-6844
CLOI XCLOAXCLOVXCLOCX 2Q 2018
FUND COMMENTARY
For the second quarter of 2018, the Clough Global Long/Short Fund (the “Fund”) had a total return of 4.10% for Class I compared to 3.43% for the S&P 500 and 0.84% for the HFRI Equity Hedge Index. See total returns chart for performance for all other share classes.
For the quarter, the Fund outperformed its long/short benchmark, the HFRI Equity Hedge Index by 325 basis points, and outperformed its long-only benchmark, the S&P 500 Index, by 66 basis points. The Fund carried an average long exposure of 85%, and an average short exposure of 21% for the quarter, which resulted in an average net investment level for the Fund of approximately 64%.
The Fund finished Q2 in the top decile of its Morningstar Long/Short Equity category, outperforming the peer group average by 396 basis points. The Fund is also in the top decile of its Morningstar category on a year-to-date basis, outperforming the average by 661 basis points. On a one-year trailing basis through Q2, the Fund is in the top percentile of its category, outperforming the average by 11.5%.
With continued equity market volatility during the quarter, the long book contributed 368 basis points to returns while the short book contributed an additional 71 basis points to returns.
By region, the portfolio had meaningful gains from the United States, Europe and India. The countries which negatively impacted performance in the quarter were Japan and China. By sector, the greatest contributions to returns were from Health Care, Consumer Discretionary, Industrials, Energy, and Consumer Staples. Telecom Services, Materials and Real Estate were the sectors that most negatively impacted performance in the quarter.
The following is a summary of the key themes currently expressed in the Fund:
Consumer Dynamism in AsiaThe Fund’s average exposure to Emerging Markets (primarily China and India) during the quarter was 18%. Despite increased tensions for emerging market investors and a broad sell-off (the MSCI Emerging Markets Index was down 7.89% in the quarter) the Fund managed to limit emerging market losses to just 27 basis points.
A strong dollar, rising interest rates and trade war concerns have dominated sentiment for emerging markets, but we think that is a near-sighted perspective. We are not tone deaf to the negative news flow and our exposure has been tactically reduced, but we think a buying opportunity is emerging, particularly in India and China.
The most serious concern we hear expressed is that excessive Fed-tightening may cause an emerging market crisis which spreads to other markets worldwide. Today, most emerging economies run current account surpluses or modest deficits. Outliers like Argentina and Turkey run 4% to 9% deficits and they are clearly under pressure, but India runs a current account deficit which amounts to a modest
1.5% of gross domestic product. Across much of Asia, inflation and credit spreads are low and many Asian economies are net creditors. Asia is a continent with a young population, and an increasingly wealthy one. We think economies like India and China represent the only secular growth stories on the planet and, unlike in the West, millennials there are optimistic about life’s prospects. We believe the current sell-off is a buying opportunity.
India’s stock market suffered a currency driven sell off in the second quarter as rising oil prices threatened a wider current account deficit. But Indian stocks subsequently rebounded and in currency adjusted terms the market is at its high at this writing. The economy’s recovery from demonetization and the adjustment to the new tax system are well along and despite these headwinds, India’s economy grew 7.7% in the first quarter. India has many advantages. One is a depth of entrepreneurial talent; another is that unlike the case in China, flows into equities are picking up.
We think business profits may grow rapidly in India. First, the Goods and Services Tax, which replaces twenty-nine individual state tax regimes with a national tax system, is igniting a productivity boom. Now that trucks can roam the country freely, falling transport costs and emerging supply chains will allow larger production runs and reduce production costs.
Secondly, banking system solvency is being restored in India. The public sector banks have a history of poor governance, rife with non-performing loans and frauds. We think the rise in reported bad loans in India is more indicative of an increased recognition of bad loans, rather than a reflection of increased credit deterioration.
One of the most promising investments on the global stage could be in the better-capitalized private companies that will finance India’s housing boom. Housing expenditures are estimated to rise from 7 trillion rupees to 17 trillion rupees by 2024. If 70% of those are financed, mortgage credit will triple, a 17% annual compound growth rate. We believe that private banks are likely to gain share as public banks restructure and shrink.
Biotechnology and PharmaceuticalsThe Fund’s exposure to the healthcare sector added 271 basis points to performance during the second quarter, on an average net exposure of 15% for the period.
Biotechnology is an example of a theme in the portfolio where, following years of industry research, multiple investment opportunities are being created. We see ample opportunities on the long side driven by tax reform and the associated repatriation of offshore cash - important fuel for an improved mergers and acquisitions (“M&A”) environment.
We remain focused on investing in biotech companies which we believe are potential targets for larger companies. We find these currently in the cash pay medical device arena as well as the mid-cap
Clough Global Long/Short Fund – Second Quarter 2018 Portfolio Commentary
Visit Ü www.cloughglobal.com or 1-855-425-6844
CLOI XCLOAXCLOVXCLOCX 2Q 2018
FUND COMMENTARY
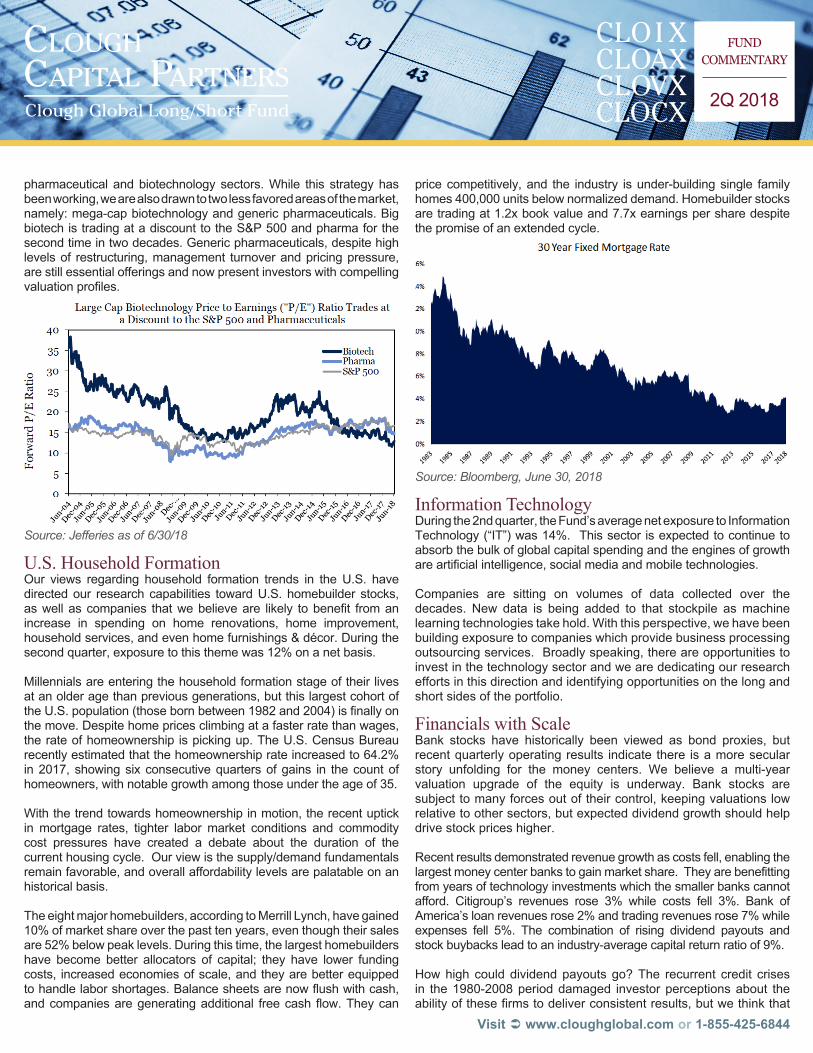
pharmaceutical and biotechnology sectors. While this strategy has been working, we are also drawn to two less favored areas of the market, namely: mega-cap biotechnology and generic pharmaceuticals. Big biotech is trading at a discount to the S&P 500 and pharma for the second time in two decades. Generic pharmaceuticals, despite high levels of restructuring, management turnover and pricing pressure, are still essential offerings and now present investors with compelling valuation profiles.
Source: Jefferies as of 6/30/18
U.S. Household Formation Our views regarding household formation trends in the U.S. have directed our research capabilities toward U.S. homebuilder stocks, as well as companies that we believe are likely to benefit from an increase in spending on home renovations, home improvement, household services, and even home furnishings & décor. During the second quarter, exposure to this theme was 12% on a net basis.
Millennials are entering the household formation stage of their lives at an older age than previous generations, but this largest cohort of the U.S. population (those born between 1982 and 2004) is finally on the move. Despite home prices climbing at a faster rate than wages, the rate of homeownership is picking up. The U.S. Census Bureau recently estimated that the homeownership rate increased to 64.2% in 2017, showing six consecutive quarters of gains in the count of homeowners, with notable growth among those under the age of 35.
With the trend towards homeownership in motion, the recent uptick in mortgage rates, tighter labor market conditions and commodity cost pressures have created a debate about the duration of the current housing cycle. Our view is the supply/demand fundamentals remain favorable, and overall affordability levels are palatable on an historical basis.
The eight major homebuilders, according to Merrill Lynch, have gained 10% of market share over the past ten years, even though their sales are 52% below peak levels. During this time, the largest homebuilders have become better allocators of capital; they have lower funding costs, increased economies of scale, and they are better equipped to handle labor shortages. Balance sheets are now flush with cash, and companies are generating additional free cash flow. They can
price competitively, and the industry is under-building single family homes 400,000 units below normalized demand. Homebuilder stocks are trading at 1.2x book value and 7.7x earnings per share despite the promise of an extended cycle.
Source: Bloomberg, June 30, 2018
Information TechnologyDuring the 2nd quarter, the Fund’s average net exposure to Information Technology (“IT”) was 14%. This sector is expected to continue to absorb the bulk of global capital spending and the engines of growth are artificial intelligence, social media and mobile technologies.
Companies are sitting on volumes of data collected over the decades. New data is being added to that stockpile as machine learning technologies take hold. With this perspective, we have been building exposure to companies which provide business processing outsourcing services. Broadly speaking, there are opportunities to invest in the technology sector and we are dedicating our research efforts in this direction and identifying opportunities on the long and short sides of the portfolio.
Financials with ScaleBank stocks have historically been viewed as bond proxies, but recent quarterly operating results indicate there is a more secular story unfolding for the money centers. We believe a multi-year valuation upgrade of the equity is underway. Bank stocks are subject to many forces out of their control, keeping valuations low relative to other sectors, but expected dividend growth should help drive stock prices higher.
Recent results demonstrated revenue growth as costs fell, enabling the largest money center banks to gain market share. They are benefitting from years of technology investments which the smaller banks cannot afford. Citigroup’s revenues rose 3% while costs fell 3%. Bank of America’s loan revenues rose 2% and trading revenues rose 7% while expenses fell 5%. The combination of rising dividend payouts and stock buybacks lead to an industry-average capital return ratio of 9%.
How high could dividend payouts go? The recurrent credit crises in the 1980-2008 period damaged investor perceptions about the ability of these firms to deliver consistent results, but we think that

Visit Ü www.cloughglobal.com or 1-855-425-6844
CLOI XCLOAXCLOVXCLOCX 2Q 2018
FUND COMMENTARY
will change. Loan quality is not likely to be this cycle’s problem. Borrowing has grown slower than the economy throughout the expansion and mortgage borrowing has been particularly slow to recover. If the money centers can move towards paying out even 50% of forward earnings in the form of dividends, the meaningfully higher yields will likely persuade investors to bid up stock prices.
The Short BookFor the quarter, short positions carried an average weighting of -21% in the Fund, which helped to lower overall volatility and contributed 71 basis points to returns. With equities elevated and short positioning in poor repute, we are compelled to point out there is no shortage of companies that are structurally disadvantaged and/or sporting bad balance sheets.
Several of Europe’s banks remain troubled and opaque, weighed down by distressed assets and no clear path to profitability. Nobody fully understands the severity of bad loans in Europe, are there appears to no government-directed plan to confront the issue. Any moves by these financial institutions to sell assets deplete equity and threaten solvency. Their depressed stock prices simply impair their ability to lend.
Lithium mining companies are bringing online what may become excess capacity from Latin America to China. Two Chinese lithium miners are about to list shares in Hong Kong, potentially accelerating the rate of capital into this area. Yes, electronic vehicles will grow in number and the demand for lithium as a component for batteries will also grow, but probably not fast enough to use upcoming supplies at current prices. We think this supply/demand imbalance is creating short opportunities among lithium miners.
Technological innovation creates an array of investment opportunities on both the long and short sides. From our perspective, several legacy tech companies which generate revenues by maintaining legacy systems are in a state of decline. Their franchises, whether in hardware or software, are eroding. They may claim opportunities in the cloud, but too often they are in no position to compete with the likes of Amazon, Google or Microsoft.
Within healthcare, Amazon’s long shadow had been at the door of the drug supply chain and prescription origination market. They officially entered in June, when the company made a more decisive move into the channel through its acquisition of PillPack, an innovative online pharmacy delivery service. Amazon’s presence in a high margin corner of the drug supply chain, combined with its brick & mortar footprint via its Whole Foods acquisition, could present major disruptions. This perspective underpins our short positions in the major drug distributors and large pharmacy chains.
In ConclusionDuring the second quarter of 2018 and year-to-date, the Fund has meaningfully outperformed its long-only benchmark and its hedged benchmark.
The gross exposure of the Fund (longs + shorts) tends to be over 100%, which we view as our elevated opportunity to seek to generate non-systemic risk (or alpha) for investors. The long book (typically 85-95%) alongside an actively managed short book (typically 15-25%) translates to a lower “net” exposure for the Fund (generally around 65% net exposure). This reduced net exposure can serve to lower systemic risk (or beta) and may provide investors with a degree of insulation from broad-based equity market corrections.
Equity indexes are 2-3% off their highs in the face of relentlessly negative trade, inflation and interest rate news. The collapse in commodity prices and the strength in bonds suggest the inflation news will get better, and while the economy may come off its first half boil partly a result of tax reform, profits and cash flows should remain strong and fiscal stimulus will take a while to work off.
Index investing has been successful in recent years because it has been getting inflows. Algorithmic strategies have been piling on top of one another, mimicking one another’s strategies, a trend we see as unsustainable given the amount of funds in those strategies. News reports suggest that the intense flows into the ETF and private equity space are faltering.
We follow an analytical approach to stock selection on the belief that profits and stock performance are correlated, and over time that has been the case. Our investment process is based, in part, on identifying major profit cycles and organizing the portfolio around a select few. These profit cycles may form in industries that have suffered from a period of under-investment causing shortages to emerge, as is the case with residential housing in the U.S. today. Profit cycles may emerge following long stretches of intensive investment, when returns on these investments are ripe for harvest, which we think is the case in biotechnology. Industries under consolidation, leaving a few companies positioned to capture economies of scale can offer a profit cycle. The U.S. money center banks are a good example of this. We also seek profit cycles outside the U.S., drawing us to India and China, where enormous & young populations are entering the middle-class consumption experience. Finally, stocks which control the process of digital disruption, where new entrants use Internet savvy to deliver goods and services far cheaper and more conveniently than incumbents are major sources of profits.
As the financial markets begin to reward companies with rising return on investments and punish those without, we believe that our fundamental style of investing should perform. During the second quarter of 2018, year-to-date, for the trailing one-year period, and since the beginning of 2017 the Fund has meaningfully outperformed both its long-only benchmark (the S&P 500 Index) and its hedged benchmark (the HFRI Equity Hedge Index).
Charles I. Clough, Jr. Vincent M. Lorusso, Jr.

Visit Ü www.cloughglobal.com or 1-855-425-6844
CLOI XCLOAXCLOVXCLOCX 2Q 2018
FUND COMMENTARY
CLS000223 10/31/2018
As of the latest prospectus, the gross expense ratio for the Fund’s Class INV, Class C, and Class I shares is 4.00%, 4.52%, and 3.41%, net expense ratio is 2.51%, 3.16% and 2.16% and net expense ratio excluding acquired fund fees and expenses and dividend and interest expenses on short sales is 1.95%, 2.60% and 1.60%, respectively. Clough Capital Partners L.P. (the “Adviser”) has agreed contractually to limit the operating expenses of each class of the Fund (excluding Rule 12b-1 Distribution and Service Fees, Shareholder Services Fees, acquired fund fees and expenses, interest, taxes, brokerage costs and commissions, dividend and interest expense on short sales, and litigation, indemnification and extraordinary expenses as determined under generally accepted accounting principles) to an annual rate of 1.60% through February 28, 2020. 1 The performance data quoted for periods prior to September 30, 2015 is that of an unregistered investment fund (the “Predecessor Fund”) that was managed by the
Adviser and was reorganized into the Fund as of the date the Fund commenced investment operations. The Predecessor Fund was not a registered mutual fund and therefore was not subject to the same investment and tax restrictions as the Fund. Performance information reflects all fees and expenses incurred by the Predecessor Fund, and has not been adjusted to reflect Fund expenses. If it had been so adjusted, the Predecessor Fund’s performance might have been higher or lower for a given period depending on the amount of such expenses incurred for any given period. Performance information for Class A and Class C have been adjusted to reflect 12b-1 fees and shareholder services fees, as applicable. The Predecessor Fund commenced operations on January 2, 2015.
2 Total return for periods greater than one year are annualized 3 Sources: Hedge Fund Research, Inc., Bloomberg. The “HFRI” returns shown herein are those of the HFRI Equity Hedge (Total) Index, which is an index designed by
Hedge Fund Research, Inc. to represent the performance of investment managers who maintain positions both long and short in primarily equity and equity derivative securities. A wide variety of investment processes can be employed by such managers to arrive at an investment decision, including both quantitative and fundamental techniques; strategies can be broadly diversified or narrowly focused on specific sectors and can range broadly in terms of levels of net exposure, leverage employed, holding period, concentrations of market capitalizations and valuation ranges of typical portfolios. The S&P 500 tracks the performance of the equity securities of a representative sample of 500 U.S. based large-cap companies. The S&P 500 is an unmanaged, market-value weighted index with each stock’s weight in the index proportionate to its market value. S&P 500 reflects the reinvestment of dividends. Both indices referenced herein reflect the reinvestment of dividends. It is not possible to invest directly in an index.
The performance data quoted represents past performance. Past performance does not guarantee future results and current performance may be lower or higher than the performance quoted. Performance reflects the deduction of management fees and other applicable expenses. For the most current month-end performance data please call 1-855-425-6844. Maximum Offering Price (MOP) for Class A shares includes the Fund’s maximum sales charge of 5.50%. On December 1, 2017 Class A shares were renamed Investor Class shares and such shares are offered without an initial sales charge or a contingent deferred sales charge. Contingent Deferred Sales Charge (CDSC) performance for Class C shares includes a 1% CDSC on C shares redeemed within 12 months of purchase. Performance shown at Net Asset Value (NAV) does not include these sales charges and would have been lower had it been taken into account. Investment returns and value of the Fund shares will fluctuate so that an investor’s shares, when sold, may be worth more or less than their original cost. Effective December 1, 2017, Class A shares of the Clough Global Long/Short Fund were renamed Investor Class shares and such shares will be offered without an initial sales charge or a contingent deferred sales charge. Contingent Deferred Sales Charge (CDSC) performance for Class C shares includes a 1% CDSC on C shares redeemed within 12 months of purchase. Performance shown at Net Asset Value (NAV) does not include these sales charges and would have been lower had it been taken into account.Effective June 29, 2018, Class A shares of the Clough Global Long/Short Fund were added as a new available share class. Performance for Class A Shares prior to June 29, 2018 reflects the historical performance of the respective Fund’s Investor Class Shares, calculated using the fees and expense of Class A Shares. An investor cannot invest in an index. Past performance is not a guarantee of future returns. This letter has been prepared by Clough Capital Partners L.P. (“Clough Capital”). This letter is not an offer to sell, nor a solicitation of an offer to buy any security in the Funds, or any other investment product. Offers to sell or solicitations to invest in either of the Funds are made only by means of a prospectus and in accordance with applicable securities laws. Prospective investors should review the prospectus for a Fund before any investment is made (including, without limitation, the information therein with respect to investment strategy, conflicts of interest and risk factors). If there is any inconsistency between any information in this letter and in a Fund’s prospectus, the latter will govern. The information in this letter represents the opinions of the Portfolio Managers and is not intended to be a forecast of future events, a guarantee of future results, or investment advice. This letter has been prepared from original sources and data believed to be reliable. However no representations are made as to the accuracy or completeness thereof. The information set forth in this letter, including, without limitation, information relating to the investment themes and portfolio allocations of the Fund, is subject to change at any time without notice to the recipients of this letter. An investment in the Fund involves a high degree of risk and is suitable only for sophisticated investors. No guarantee or representation is made that the Funds’ investment program, including, without limitation, their investment objectives, will be successful. Risks An investor should consider investment objectives, risks, charges and expenses carefully before investing. To obtain a prospectus, annual report or semi-annual report which contains this and other information visit www.cloughglobal.com or call 1-855-425-6844. Read them carefully before investing. Investing involves risks, including loss of principal. The Fund’s use of derivatives (which may include forward foreign currency contracts, futures, participation notes, and swaps) may reduce the Fund’s returns and/or increase the volatility of the Fund’s net asset value. Foreign investing involves special risks such as currency fluctuations and political uncertainty. S&P 500: The Standard & Poor’s composite index of 500 stocks, a widely recognized, unmanaged index of common stock prices. Index performance does not reflect fund performance. An investor cannot invest directly in an index. HFRI Equity Hedge (Total) Index (HFRI): An index designed by Hedge Fund Research, Inc. to represent the performance of investment managers who maintain positions both long and short in primarily equity and equity derivative securities. A wide variety of investment processes can be employed by such managers to arrive at an investment decision, including both quantitative and fundamental techniques; strategies can be broadly diversified or narrowly focused on specific sectors and can range broadly in terms of levels of net exposure, leverage employed, holding period, concentrations of market capitalizations and valuation ranges of typical portfolios. The HFRI family of indices reserves the right to revise historical performance data for a period of up to four months following the as of date. The performance shown was calculated using current, available data at the time of publication, but is subject to change outside of the control of the Fund and its affiliates. An investor cannot invest directly in an index. ALPS Portfolio Solutions Distributor, Inc. is the distributor for the Clough Global Long/Short Fund. Clough Capital Partners L.P. is the Investment Adviser.
Total Returns (As of 6/30/20181,2)Q2 2018 YTD 1 YEAR SINCE INCEPTION
Clough Global Long/Short Fund - I 4.10% 5.94% 16.94% 4.95%Clough Global Long/Short Fund - Investor (NAV) 4.04% 5.81% 16.65% 4.62%Clough Global Long/Short Fund - A (NAV) 4.04% 5.81% 16.65% 4.62%Clough Global Long/Short Fund - A (MOP) -1.66% 0.00% 10.24% 2.94%Clough Global Long/Short Fund - C (NAV) 3.83% 5.42% 15.89% 4.04%Clough Global Long/Short Fund - C (CDSC) 2.83% 4.42% 14.89% 4.04%S&P 500 Index3 3.43% 2.65% 14.37% 10.54%HFRI Equity Hedge (Total) Index3 0.84% 1.16% 8.22% 5.28%