clinical trials -...
TRANSCRIPT

115
Type 2 diabetes mellitus (T2DM) is a growing worldwide health problem, with an estimated 439 million people liv-
ing with diabetes mellitus in 20301. The lifelong incidence of vascular complications is extremely high, and >80% of patients with diabetes will die from a vascular cause.2 Blood pressure (BP) is strongly related to nonfatal vascular events, vascular, and all-cause mortality in patients with T2DM.3 The risk asso-ciated with BP already starts well below the BP level used to
define hypertension, and BP-lowering agents have been shown to reduce vascular risk in patients with and without hypertension by an average of ≈15%.4–6 Yet, based on benefit and costs con-siderations, treatment with BP-lowering medication is only rec-ommended according to guidelines if BP is >140/90 mm Hg.7–9 This BP threshold serves as a marker to identify patients who potentially benefit from treatment.10 However, even above this threshold, individual patients vary greatly in the combinations
Abstract—Blood pressure–lowering treatment reduces cardiovascular risk in patients with diabetes mellitus, but the effect varies between individuals. We sought to identify which patients benefit most from such treatment in a large clinical trial in type 2 diabetes mellitus. In Action in Diabetes and Vascular Disease: Preterax and Diamicron MR Controlled Evaluation (ADVANCE) participants (n=11 140), we estimated the individual patient 5-year absolute risk of major adverse cardiovascular events with and without treatment by perindopril–indapamide (4/1.25 mg). The difference between treated and untreated risk is the estimated individual patient’s absolute risk reduction (ARR). Predictions were based on a Cox proportional hazards model inclusive of demographic and clinical characteristics together with the observed relative treatment effect. The group-level effect of selectively treating patients with an estimated ARR above a range of decision thresholds was compared with treating everyone or those with a blood pressure >140/90 mm Hg using net benefit analysis. In ADVANCE, there was wide variation in treatment effects across individual patients. According to the algorithm, 43% of patients had a large predicted 5-year ARR of ≥1% (number-needed-to-treat [NNT
5] ≤100) and 40%
had an intermediate predicted ARR of 0.5% to 1% (NNT5=100–`200). The proportion of patients with a small ARR of
≤0.5% (NNT5≥200) was 17%. Provided that one is prepared to treat at most 200 patients for 5 years to prevent 1 adverse
outcome, prediction-based treatment yielded the highest net benefit. In conclusion, a multivariable treatment algorithm can identify those individuals who benefit most from blood pressure–lowering therapy in terms of ARR of major adverse cardiovascular events and may be used to guide treatment decisions in individual patients with diabetes.
Clinical Trial Registration—URL: http://www.clinicaltrials.gov. Unique identifier: NCT00145925. (Hypertension. 2015;65:115-121. DOI: 10.1161/HYPERTENSIONAHA.114.04421.) • Online Data Supplement
Key Words: antihypertensive agents ■ diabetes mellitus ■ individualized medicine ■ medical decision making, computer-assisted
Received August 11, 2014; first decision August 30, 2014; revision accepted September 18, 2014.From the Department of Vascular Medicine (J.v.d.L., F.L.J.V.), Julius Centre for Health Sciences and Primary Care (Y.v.d.G., D.E.G.), University
Medical Centre Utrecht, Utrecht, The Netherlands; The George Institute for Global Health, University of Sydney, Sydney, Australia (M.W., S.Z., A.P.K., S.M., J.C.); NCRP for Cardiovascular and Metabolic Diseases, South African Medical Research Council and University of Cape Town, Cape Town, South Africa (A.P.K.); Centre for Research on Evidence Based Practice, Bond University, Robina, Queensland, Australia (P.G.); Centre Hospitalier de L’Université de Montréal, Montréal, Canada (P.H.); University of Oxford, Oxford, United Kingdom (S.M.); and Imperial College London, London, United Kingdom (N.P.).
The online-only Data Supplement is available with this article at http://hyper.ahajournals.org/lookup/suppl/doi:10.1161/HYPERTENSIONAHA. 114.04421/-/DC1.
Correspondence to Frank L.J. Visseren, Department of Vascular Medicine, University Medical Centre Utrecht, PO Box 85500, 3508GA Utrecht, The Netherlands. E-mail [email protected]
Predicting the Effects of Blood Pressure–Lowering Treatment on Major Cardiovascular Events for Individual
Patients With Type 2 Diabetes MellitusResults From Action in Diabetes and Vascular Disease: Preterax and
Diamicron MR Controlled Evaluation
Joep van der Leeuw, Frank L.J. Visseren, Mark Woodward, Sophia Zoungas, Andre Pascal Kengne, Yolanda van der Graaf, Paul Glasziou, Pavel Hamet, Stephen MacMahon,
Neil Poulter, Diederick E. Grobbee, John Chalmers
© 2014 American Heart Association, Inc.
Hypertension is available at http://hyper.ahajournals.org DOI: 10.1161/HYPERTENSIONAHA.114.04421
Clinical Trials
by guest on July 9, 2018http://hyper.ahajournals.org/
Dow
nloaded from
by guest on July 9, 2018http://hyper.ahajournals.org/
Dow
nloaded from
by guest on July 9, 2018http://hyper.ahajournals.org/
Dow
nloaded from
by guest on July 9, 2018http://hyper.ahajournals.org/
Dow
nloaded from
by guest on July 9, 2018http://hyper.ahajournals.org/
Dow
nloaded from
by guest on July 9, 2018http://hyper.ahajournals.org/
Dow
nloaded from
by guest on July 9, 2018http://hyper.ahajournals.org/
Dow
nloaded from
by guest on July 9, 2018http://hyper.ahajournals.org/
Dow
nloaded from
by guest on July 9, 2018http://hyper.ahajournals.org/
Dow
nloaded from
by guest on July 9, 2018http://hyper.ahajournals.org/
Dow
nloaded from
by guest on July 9, 2018http://hyper.ahajournals.org/
Dow
nloaded from
by guest on July 9, 2018http://hyper.ahajournals.org/
Dow
nloaded from

116 Hypertension January 2015
of characteristics that affect the amount of benefit they will receive from treatment.11–13 The absolute risk reduction (ARR) of BP-lowering treatment for individual patients depends not only on baseline BP but also on baseline risk, which is determined by the combined actions of multiple risk factors, such as age, cho-lesterol, and BP14. Patients with high baseline risk tend to benefit more in terms of ARR.15,16 In addition, subgroup analyses have pointed out some characteristics that might influence the rela-tive efficacy of treatment, such as age and pretreatment BP.17,18 Although some benefit from BP lowering may be seen across the entire range of background risk, it is to be expected that, in some cases, this benefit may be reduced by costs or adverse effects.19 Clinicians thus need to identify those individual patients where benefit from BP-lowering therapy outweighs potential treatment disadvantages, such as cough and hypotension, the inconve-nience of daily taking a drug and the monetary costs of treatment. In the present study, we sought to predict the individual absolute effect of BP-lowering on the occurrence of major cardiovascular events in patients with T2DM using routine clinical data. For this purpose, we used data from the Action in Diabetes and Vascular Disease: Preterax and Diamicron MR Controlled Evaluation (ADVANCE) trial20 that randomly assigned patients with T2DM to receive a fixed combination of perindopril and indapamide. The effect of treatment for individual patients could then be esti-mated using a newly developed risk score and the relative treat-ment effect observed in the trial. These individualized estimates of treatment effect may help to guide treatment decisions in indi-vidual patients with T2DM in clinical practice.
MethodsThe design, rationale, and outcomes of the ADVANCE trial have been described elsewhere.20,21 Briefly, the ADVANCE study was a factorial randomized controlled trial evaluating the effect of intensive glucose control therapy and routine BP-lowering therapy with a fixed com-bination of perindopril and indapamide (4/1.25 mg) or placebo on vascular events and death. From 215 collaborating centers in 20 coun-tries from Asia, Australasia, Europe, and North America, 11 140 par-ticipants diagnosed with T2DM and aged ≥55 years were included. Eligible patients also needed to have a history of macrovascular or microvascular disease or ≥1 risk factor. There were no BP criteria for inclusion. The end point of interest was major adverse cardiovascular events (MACE; ie, cardiovascular death, nonfatal myocardial infarc-tion, or nonfatal stroke). Approval for the trial was obtained from the institutional ethics committee of each center, and all participants pro-vided written informed consent. Data were missing in 4.5% of par-ticipants for urinary albumin/creatinine ratio and in <1% for all other covariables. Missing data were reduced by single imputation methods using predictive mean matching.22,23
Model DerivationWe developed a new Cox proportional hazards model based on a set of clinical characteristics together with a treatment status covariable (placebo versus active treatment). The prespecified predictors were sex, age, diabetes mellitus duration, systolic BP, history of treated hypertension, current smoking, HbA1c, total cholesterol, high-den-sity lipoprotein -cholesterol, waist circumference, urinary albumin/creatinine ratio, estimated glomerular filtration rate, history of major macrovascular disease, retinopathy, ethnicity, and treatment status. Ethnicity was classified into Asian and non-Asian because further sub-division would produce categories with too few participants. Diabetic retinopathy was defined as fundoscopic evidence of background or proliferative retinopathy, previous laser retinal therapy, macular edema, or blindness. Estimated glomerular filtration rate was calcu-lated by the Chronic Kidney Disease Epidemiology Collaboration
equation.24 Potential interactions between treatment and age, systolic BP, currently treated hypertension, estimated glomerular filtration rate, and baseline risk were considered.25 Continuous predictors were truncated at the 1st and 99th percentile to limit the effect of outliers.23 Restricted cubic splines were used to assess the linearity assumption for continuous predictors.23 As a result, estimated glomerular filtra-tion rate was included both as a linear and as a squared term, and urinary albumin/creatinine ratio was natural log-transformed.
First, treatment interactions with a conditional likelihood ratio P value of ≥0.05 were removed from the starting model. Next, the mod-el was further simplified by stepwise backward selection based on Akaike’s Information Criterion. To correct for overoptimism, 1000-fold bootstrap resampling was used and a factor of 0.967 was derived to shrink the model coefficients except for treatment uniformly.22 The proportional hazard assumption was verified by testing the correla-tion between scaled Schoenfeld’s residuals and time: no violations were observed. The final model was used to calculate the risk of MACE, with and without treatment, for every participant by fixing the treatment variable to placebo and active treatment, respectively. The difference is the individual patient’s ARR and can be translated to a patient-specific number-needed-to-treat (NNT=100/ARR). This individual NNT reflects the number of patients with exactly similar characteristics that need to be treated to prevent 1 event. The model was fitted for the prediction of 4.4-year (median follow-up) risk and extrapolated to yield 5-year estimates through exponentiation.
Sensitivity analyses encompassed the evaluation of individual treatment effect based on 2 existing risk algorithms (ADVANCE risk engine26 and recalibrated U.K. Prospective Diabetes Study [UKPDS] score)27 together with the observed overall relative risk reduction from ADVANCE. Because these algorithms were constructed for the use in patients without previous cardiovascular disease, these analy-ses were conducted in the subgroup of patients free from macrovas-cular disease at baseline.
Assessment of Model PerformanceCalibration was assessed by plotting observed 5-year event-free sur-vival against the average predicted 5-year event-free survival within groups defined by the deciles of predicted risk and by the Gronnesby and Borgan test.28 Discrimination was assessed by Harrell c-statistic and the optimism-corrected c-statistic was obtained by 1000-fold bootstrap resampling.29
Distribution of Individual Treatment Effect and Net BenefitThe distributions of estimated individual 5-year ARR of MACE are displayed in histograms. Next, we evaluated the group-level conse-quences of applying a prediction-based treatment strategy in clini-cal practice using the net benefit method.30 Net benefit is found from weighing the positive and negative effects of treatment and uses observed event rates and treatment rates in trial participants. The equipoise between benefit and disadvantages of treatment may be expressed by a threshold NNT. For example, a 5-year threshold NNT (NNT
5) of 50 implies that the disadvantages of treating 50 patients
for 5 years are considered to be well balanced by the benefit obtained by preventing one outcome. Net benefit is calculated as the observed ARR in patients for whom the treatment recommended by the decision strategy is congruent with randomized allocation minus the disadvan-tages of treatment. The disadvantages are expressed as the proportion of treated patients weighted by the inverse of the threshold NNT:
Net benefit = ARR–Ptreated
*(1/threshold NNT).Net benefit can be interpreted as the excess number of events pre-
vented per 100 patients on top of the minimally required number of events prevented to offset treatment disadvantages. We considered the following treatment decision strategies at a threshold NNT
5 between
25 and infinity: (1) treat everyone, (2) prediction-based treatment (ie, selective treatment of patients whose predicted individual treatment effect exceeds the specified threshold NNT), or (3) treat those with a BP>140/90 mm Hg. A detailed calculation example is provided in the online-only Data Supplement. Finally, we tabulated the clinical implications of prediction-based treatment on treatment rate and the
by guest on July 9, 2018http://hyper.ahajournals.org/
Dow
nloaded from
van der Leeuw et al Individual Effects of BP-Lowering Treatment 117
average NNT. Statistical analyses were conducted in R, version 3.0.3 (R Development Core Team, Vienna, Austria).
Results
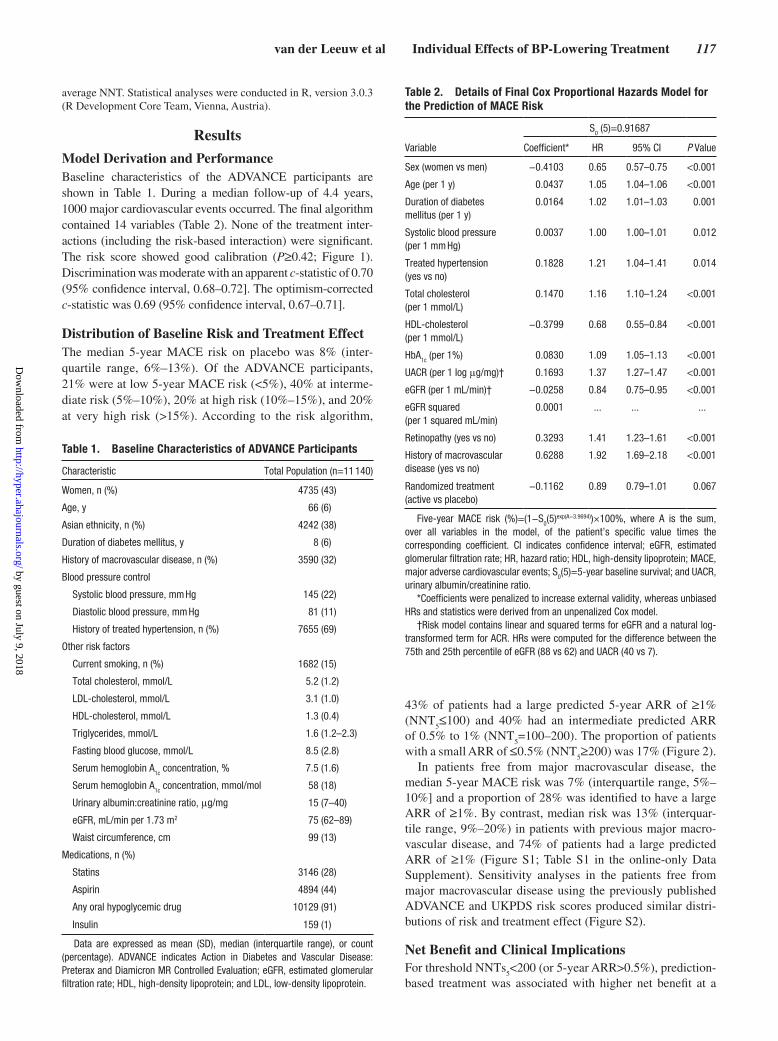
Model Derivation and PerformanceBaseline characteristics of the ADVANCE participants are shown in Table 1. During a median follow-up of 4.4 years, 1000 major cardiovascular events occurred. The final algorithm contained 14 variables (Table 2). None of the treatment inter-actions (including the risk-based interaction) were significant. The risk score showed good calibration (P≥0.42; Figure 1). Discrimination was moderate with an apparent c-statistic of 0.70 (95% confidence interval, 0.68–0.72]. The optimism-corrected c-statistic was 0.69 (95% confidence interval, 0.67–0.71].
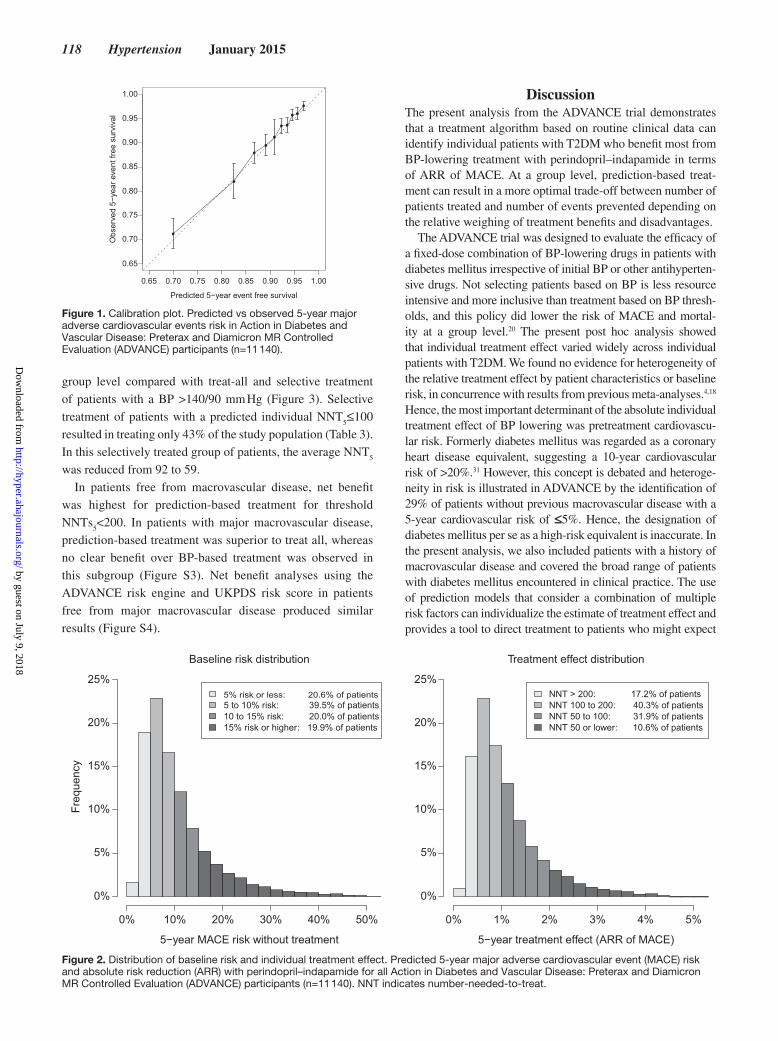
Distribution of Baseline Risk and Treatment EffectThe median 5-year MACE risk on placebo was 8% (inter-quartile range, 6%–13%). Of the ADVANCE participants, 21% were at low 5-year MACE risk (<5%), 40% at interme-diate risk (5%–10%), 20% at high risk (10%–15%), and 20% at very high risk (>15%). According to the risk algorithm,
43% of patients had a large predicted 5-year ARR of ≥1% (NNT
5≤100) and 40% had an intermediate predicted ARR
of 0.5% to 1% (NNT5=100–200). The proportion of patients
with a small ARR of ≤0.5% (NNT5≥200) was 17% (Figure 2).
In patients free from major macrovascular disease, the median 5-year MACE risk was 7% (interquartile range, 5%–10%] and a proportion of 28% was identified to have a large ARR of ≥1%. By contrast, median risk was 13% (interquar-tile range, 9%–20%) in patients with previous major macro-vascular disease, and 74% of patients had a large predicted ARR of ≥1% (Figure S1; Table S1 in the online-only Data Supplement). Sensitivity analyses in the patients free from major macrovascular disease using the previously published ADVANCE and UKPDS risk scores produced similar distri-butions of risk and treatment effect (Figure S2).
Net Benefit and Clinical ImplicationsFor threshold NNTs
5<200 (or 5-year ARR>0.5%), prediction-
based treatment was associated with higher net benefit at a
Table 1. Baseline Characteristics of ADVANCE Participants
Characteristic Total Population (n=11 140)
Women, n (%) 4735 (43)
Age, y 66 (6)
Asian ethnicity, n (%) 4242 (38)
Duration of diabetes mellitus, y 8 (6)
History of macrovascular disease, n (%) 3590 (32)
Blood pressure control
Systolic blood pressure, mm Hg 145 (22)
Diastolic blood pressure, mm Hg 81 (11)
History of treated hypertension, n (%) 7655 (69)
Other risk factors
Current smoking, n (%) 1682 (15)
Total cholesterol, mmol/L 5.2 (1.2)
LDL-cholesterol, mmol/L 3.1 (1.0)
HDL-cholesterol, mmol/L 1.3 (0.4)
Triglycerides, mmol/L 1.6 (1.2–2.3)
Fasting blood glucose, mmol/L 8.5 (2.8)
Serum hemoglobin A1c concentration, % 7.5 (1.6)
Serum hemoglobin A1c
concentration, mmol/mol 58 (18)
Urinary albumin:creatinine ratio, μg/mg 15 (7–40)
eGFR, mL/min per 1.73 m2 75 (62–89)
Waist circumference, cm 99 (13)
Medications, n (%)
Statins 3146 (28)
Aspirin 4894 (44)
Any oral hypoglycemic drug 10129 (91)
Insulin 159 (1)
Data are expressed as mean (SD), median (interquartile range), or count (percentage). ADVANCE indicates Action in Diabetes and Vascular Disease: Preterax and Diamicron MR Controlled Evaluation; eGFR, estimated glomerular filtration rate; HDL, high-density lipoprotein; and LDL, low-density lipoprotein.
Table 2. Details of Final Cox Proportional Hazards Model for the Prediction of MACE Risk
S0 (5)=0.91687
Variable Coefficient* HR 95% CI P Value
Sex (women vs men) −0.4103 0.65 0.57–0.75 <0.001
Age (per 1 y) 0.0437 1.05 1.04–1.06 <0.001
Duration of diabetes mellitus (per 1 y)
0.0164 1.02 1.01–1.03 0.001
Systolic blood pressure (per 1 mm Hg)
0.0037 1.00 1.00–1.01 0.012
Treated hypertension (yes vs no)
0.1828 1.21 1.04–1.41 0.014
Total cholesterol (per 1 mmol/L)
0.1470 1.16 1.10–1.24 <0.001
HDL-cholesterol (per 1 mmol/L)
−0.3799 0.68 0.55–0.84 <0.001
HbA1c
(per 1%) 0.0830 1.09 1.05–1.13 <0.001
UACR (per 1 log μg/mg)† 0.1693 1.37 1.27–1.47 <0.001
eGFR (per 1 mL/min)† −0.0258 0.84 0.75–0.95 <0.001
eGFR squared (per 1 squared mL/min)
0.0001 ... ... ...
Retinopathy (yes vs no) 0.3293 1.41 1.23–1.61 <0.001
History of macrovascular disease (yes vs no)
0.6288 1.92 1.69–2.18 <0.001
Randomized treatment (active vs placebo)
−0.1162 0.89 0.79–1.01 0.067
Five-year MACE risk (%)=(1−S0(5)exp(A−3.9694))×100%, where A is the sum,
over all variables in the model, of the patient’s specific value times the corresponding coefficient. CI indicates confidence interval; eGFR, estimated glomerular filtration rate; HR, hazard ratio; HDL, high-density lipoprotein; MACE, major adverse cardiovascular events; S
0(5)=5-year baseline survival; and UACR,
urinary albumin/creatinine ratio.*Coefficients were penalized to increase external validity, whereas unbiased
HRs and statistics were derived from an unpenalized Cox model.†Risk model contains linear and squared terms for eGFR and a natural log-
transformed term for ACR. HRs were computed for the difference between the 75th and 25th percentile of eGFR (88 vs 62) and UACR (40 vs 7).
by guest on July 9, 2018http://hyper.ahajournals.org/
Dow
nloaded from
118 Hypertension January 2015
group level compared with treat-all and selective treatment of patients with a BP >140/90 mm Hg (Figure 3). Selective treatment of patients with a predicted individual NNT
5≤100
resulted in treating only 43% of the study population (Table 3). In this selectively treated group of patients, the average NNT
5
was reduced from 92 to 59.In patients free from macrovascular disease, net benefit
was highest for prediction-based treatment for threshold NNTs
5<200. In patients with major macrovascular disease,
prediction-based treatment was superior to treat all, whereas no clear benefit over BP-based treatment was observed in this subgroup (Figure S3). Net benefit analyses using the ADVANCE risk engine and UKPDS risk score in patients free from major macrovascular disease produced similar results (Figure S4).
DiscussionThe present analysis from the ADVANCE trial demonstrates that a treatment algorithm based on routine clinical data can identify individual patients with T2DM who benefit most from BP-lowering treatment with perindopril–indapamide in terms of ARR of MACE. At a group level, prediction-based treat-ment can result in a more optimal trade-off between number of patients treated and number of events prevented depending on the relative weighing of treatment benefits and disadvantages.
The ADVANCE trial was designed to evaluate the efficacy of a fixed-dose combination of BP-lowering drugs in patients with diabetes mellitus irrespective of initial BP or other antihyperten-sive drugs. Not selecting patients based on BP is less resource intensive and more inclusive than treatment based on BP thresh-olds, and this policy did lower the risk of MACE and mortal-ity at a group level.20 The present post hoc analysis showed that individual treatment effect varied widely across individual patients with T2DM. We found no evidence for heterogeneity of the relative treatment effect by patient characteristics or baseline risk, in concurrence with results from previous meta-analyses.4,18 Hence, the most important determinant of the absolute individual treatment effect of BP lowering was pretreatment cardiovascu-lar risk. Formerly diabetes mellitus was regarded as a coronary heart disease equivalent, suggesting a 10-year cardiovascular risk of >20%.31 However, this concept is debated and heteroge-neity in risk is illustrated in ADVANCE by the identification of 29% of patients without previous macrovascular disease with a 5-year cardiovascular risk of ≤5%. Hence, the designation of diabetes mellitus per se as a high-risk equivalent is inaccurate. In the present analysis, we also included patients with a history of macrovascular disease and covered the broad range of patients with diabetes mellitus encountered in clinical practice. The use of prediction models that consider a combination of multiple risk factors can individualize the estimate of treatment effect and provides a tool to direct treatment to patients who might expect
5−year MACE risk without treatment
Freq
uenc
y
5% risk or less: 20.6% of patients5 to 10% risk: 39.5% of patients10 to 15% risk: 20.0% of patients15% risk or higher: 19.9% of patients
Baseline risk distribution
0% 10% 20% 30% 40% 50%
0%
5%
10%
15%
20%
25%
5−year treatment effect (ARR of MACE)
NNT > 200: 17.2% of patientsNNT 100 to 200: 40.3% of patientsNNT 50 to 100: 31.9% of patientsNNT 50 or lower: 10.6% of patients
Treatment effect distribution
0% 1% 2% 3% 4% 5%
0%
5%
10%
15%
20%
25%
Figure 2. Distribution of baseline risk and individual treatment effect. Predicted 5-year major adverse cardiovascular event (MACE) risk and absolute risk reduction (ARR) with perindopril–indapamide for all Action in Diabetes and Vascular Disease: Preterax and Diamicron MR Controlled Evaluation (ADVANCE) participants (n=11 140). NNT indicates number-needed-to-treat.
0.65 0.70 0.75 0.80 0.85 0.90 0.95 1.00
0.65
0.70
0.75
0.80
0.85
0.90
0.95
1.00
Predicted 5−year event free survival
Obs
erve
d 5−
year
eve
nt fr
ee s
urvi
val
Figure 1. Calibration plot. Predicted vs observed 5-year major adverse cardiovascular events risk in Action in Diabetes and Vascular Disease: Preterax and Diamicron MR Controlled Evaluation (ADVANCE) participants (n=11 140).
by guest on July 9, 2018http://hyper.ahajournals.org/
Dow
nloaded from

van der Leeuw et al Individual Effects of BP-Lowering Treatment 119
the most benefit from treatment. Furthermore, providing patients with individualized estimates of treatment effect can enhance knowledge translation and engage patients in shared decision making by raising awareness of their individualized risks and benefits of treatment.32
Furthermore, this individualized approach could replace the sole reliance on BP levels to decide on treatment initiation or
intensification. Current guidelines recommend medical treatment of BP values >140/90 mm Hg in patients with diabetes mellitus, falsely suggesting that risk suddenly increases when BP reaches this specific cutoff.3,8 Given that the ultimate goal of BP-lowering treatment is to reduce cardiovascular risk, BP levels are best viewed in the broader context of the individual patient’s cardio-vascular risk. For example, BP-lowering treatment of a high-risk patient with an systolic BP of 135 mm Hg can produce a large ARR of 1.8%, whereas treatment of a low-risk patient with an systolic BP of 155 mm Hg would result in a small ARR of 0.4% (Table 4). Ideally, this individualized assessment of BP-lowering medication on cardiovascular outcomes would be part of a per-sonalized strategy to manage all major cardiovascular risk factors.
We used net benefit analyses to evaluate the application of treatment effect prediction models in clinical practice. Notably, net benefit does not refer to treatment decisions for specific patients but evaluates the consequences of applying a treatment strategy to a whole population. Selective treat-ment of patients will inevitably result in a small increase in event rate that is balanced by a reduction in treatment rate. The choice of an appropriate treatment threshold can be difficult. The ADVANCE trial evaluated a combination of 2 drugs at lower dose that was suggested to cause fewer side effects.33 Indeed, active treatment was well tolerated, and the most fre-quent reasons for study discontinuation were cough (excess risk, 2.0%; 95% confidence interval, 1.4–2.6) and hypoten-sion or dizziness (excess risk, 0.8%; 95% confidence interval, 0.5–1.2).20 Nevertheless, other negative effects of treatment, such as the inconvenience of daily taking a drug and mon-etary costs, merit consideration. We displayed net benefit across a range of treatment thresholds to allow for a differ-ent appraisal of positive and negative effects of treatment. We did not provide confidence limits for the net benefit curves because for medical decision making the point estimates is guiding. That is, even if a certain strategy were better in only 51% of times, this strategy would still be preferable over the
−0.5
0.0
0.5
1.0
Net
Ben
efit
(%)
Infinite 100 50 33 25
5−year threshold NNT (baseline risk)
0% 9% 18% 27% 36%
Treat noneTreat allPrediction−basedBP 140/90
Figure 3. Net benefit of different treatment strategies applied to the Action in Diabetes and Vascular Disease: Preterax and Diamicron MR Controlled Evaluation (ADVANCE) study population. Net benefit is calculated as the observed absolute risk reduction of major adverse cardiovascular events (%) in patients whose randomized allocation is in accordance with the treatment recommended by the prediction score (ie, active or placebo) minus the disadvantages of treatment. Disadvantages are expressed as the proportion of patients receiving treatment weighted by the threshold number-needed-to-treat (NNT). First, a threshold NNT (corresponding to baseline risk) should be determined, and next the strategy associated with the highest net benefit for this specific threshold can be extracted from the graph. The threshold NNT may vary among clinicians and patients. The treat-all line originates at the average ARR observed in the trial because the disadvantages of treatment are assumed to be zero at an infinitely high threshold NNT5. Treat none is the reference line associated with zero net benefit.
Table 3. Group-Level Effect of Selectively Treating ADVANCE Participants Based on a Prediction Score Using Different Treatment Thresholds
5-y Threshold NNT
Treatment Strategy
Treatment Rate*, %
Average 5-y ARR†, %
Average 5-y NNT†
Infinite Treat all 100 1.1 92
200 Prediction based
83 1.2 81
100 Prediction based
43 1.7 59
50 Prediction based
11 2.7 37
*Percentage of population treated with perindopril–indapamide.†Predicted average absolute risk reduction (ARR) or number-needed-to-treat
(NNT) with treatment in the selected group of patients with a predicted ARR exceeding the decision threshold. ADVANCE indicates Action in Diabetes and Vascular Disease: Preterax and Diamicron MR Controlled Evaluation.
Table 4. Predicted 5-Year Absolute Risk Reduction of Major Adverse Cardiovascular Events With Perindopril–Indapamide Treatment for 2 Distinct Patient Profiles
Profile Characteristics
5-Year ARR With BP-Lowering
Treatment
Patient A A 65-year old male patient with a known history of diabetes for 1 year, an untreated SBP of 155 mmHg, an HbA1c of 7%, a total cholesterol of 5 mmol/L an HDL cholesterol of 1.2 mmol/L, an eGFR of 70 mL/min and an UACR of 2 μg/mg without retinopathy or
previous macrovascular disease.
0.4% (individual
NNT5= 227)
Patient B A 65-year old male patient with a known history of diabetes for 15 years, an untreated SBP of 135 mmHg, an HbA1c of 8%, a total cholesterol of 6 mmol/L, an HDL cholesterol of 1.0 mmol/L, an eGFR of 50 mL/min and an UACR of 45 μg/mg with retinopathy but without previous macrovascular disease.
1.8% (individual NNT
5= 56)
ARR indicates absolute risk reduction; BP, blood pressure; eGFR, estimated glomerular filtration rate; HDL, high-density lipoprotein; NNT, number-needed-to-treat; SBP, systolic blood pressure; and UACR, urinary albumin/creatinine ratio.
by guest on July 9, 2018http://hyper.ahajournals.org/
Dow
nloaded from

120 Hypertension January 2015
alternative.34 For a range of treatment thresholds that might be considered acceptable in clinical practice (ie, threshold NNT
5<200), prediction-based treatment was associated with
the highest net benefit. If resources would be unrestricted and one is inclined to maximize the number of events prevented regardless of the number of patients that must be treated (ie, threshold NNT
5>200), the appropriate strategy would be to
treat every patient with T2DM. After stratification by history of macrovascular disease, we observed the largest benefit of prediction-based treatment in patients free from macrovascu-lar disease. This was expected, as a treat-all strategy in this population results in treating many lower risk patients with a small individual treatment effect while being exposed to the disadvantages of treatment. Overall, the net benefit analysis indicates that application of a treatment algorithm in clinical practice can improve the balance between number of events prevented and the number of patients treated if guideline com-mittees agree that an acceptable threshold NNT
5 is <200.
Some limitations need to be considered. First, the analyses and predictions apply to a specific drug regimen of perindopril–inda-pamide in patients who would be eligible for inclusion. Although the ADVANCE study included a broad range of patients, the presence of ≥1 additional cardiovascular risk factor in addition to T2DM was required, and patients with a definite indication for insulin therapy were excluded. Second, the overall treatment effect on macrovascular events was not significant although the effects on major vascular events, cardiovascular death, and all-cause mor-tality were. Because the observed macrovascular event rate was lower than expected, this could be because of a lack of power.20 Also, meta-analyses of angiotensin-converting enzyme inhibitors in patients with diabetes mellitus provide considerable reassur-ance of a real effect.35 Third, prediction models are likely to per-form optimistically in the sample from which they were derived.23 Hence, we adjusted estimates of calibration and discrimination for overoptimism by bootstrap resampling. Furthermore, in patients free from macrovascular disease, similar estimates of individual treatment effect were obtained using the UKPDS risk score. Fourth, the net benefit method is not a cost effectiveness analysis because monetary values are not explicitly assigned to positive or negative outcomes. Rather, it provides a framework for com-paring treatment strategies that allows both positive and negative consequences to be considered in general terms. Finally, predic-tion-based treatment might be more burdensome than prescrib-ing treatment to every patient with diabetes mellitus. However, the use of prediction-based treatment in clinical practice can be facilitated by electronic calculators (online-only Data Supplement and accessible through www.vasculairegeneeskundeutrecht.nl/calculators). The individual estimates of treatment effect can be displayed graphically and can be used to engage patients in shared decision making at an individual patient level.
PerspectivesIndividual patients with T2DM have multiple characteris-tics that influence the effect of BP-lowering treatment with perindopril–indapamide. A multivariable treatment algorithm can be used to quantify the anticipated patient-specific effect of BP-lowering treatment in terms of absolute risk reduction of major cardiovascular events. Individualized estimates of treatment effect may be used to guide treatment decisions by
prescribing treatment to patients who can expect the great-est benefits and withholding treatment for patients with lit-tle chance of benefit while being susceptible to the negative effects of treatment.
Sources of FundingThe Action in Diabetes and Vascular Disease: Preterax and Diamicron MR Controlled Evaluation (ADVANCE) trial was funded by grants from the National Health and Medical Research Council of Australia and Servier International. This work was sup-ported by a grant from the Stichting Wellerdieck-de Goede Fonds, the Netherlands (project 12.095).
DisclosuresJ. Chalmers has received research grants from Servier, administered through the University of Sydney, as Principal Investigator for Action in Diabetes and Vascular Disease: Preterax and Diamicron MR Controlled Evaluation (ADVANCE) and ADVANCE-ON, and has also received honoraria from Servier for speaking about ADVANCE at scientific meetings. S. MacMahon received research grants from Servier as Principal Investigator for ADVANCE.
References 1. Shaw JE, Sicree RA, Zimmet PZ. Global estimates of the prevalence of
diabetes for 2010 and 2030. Diabetes Res Clin Pract. 2010;87:4–14. 2. van Dieren S, Beulens JW, van der Schouw YT, Grobbee DE, Neal B. The
global burden of diabetes and its complications: an emerging pandemic. Eur J Cardiovasc Prev Rehabil. 2010;17(suppl 1):S3–S8.
3. Lewington S, Clarke R, Qizilbash N, Peto R, Collins R; Prospective Studies Collaboration. Age-specific relevance of usual blood pressure to vascular mortality: a meta-analysis of individual data for one million adults in 61 prospective studies. Lancet. 2002;360:1903–1913.
4. Law MR, Morris JK, Wald NJ. Use of blood pressure lowering drugs in the prevention of cardiovascular disease: meta-analysis of 147 ran-domised trials in the context of expectations from prospective epidemio-logical studies. BMJ. 2009;338:b1665.
5. Thompson AM, Hu T, Eshelbrenner CL, Reynolds K, He J, Bazzano LA. Antihypertensive treatment and secondary prevention of cardiovascular disease events among persons without hypertension: a meta-analysis. JAMA. 2011;305:913–922.
6. Turnbull F, Neal B, Algert C, Chalmers J, Chapman N, Cutler J, Woodward M, MacMahon S; Blood Pressure Lowering Treatment Trialists’ Collaboration. Effects of different blood pressure-lowering regi-mens on major cardiovascular events in individuals with and without dia-betes mellitus: results of prospectively designed overviews of randomized trials. Arch Intern Med. 2005;165:1410–1419.
7. American Diabetes Association. Standards of medical care in diabetes 2013. Diabetes Care. 2013;36(suppl 1):S11–S66.
8. European Society of Hypertension (ESH) and of the European Society of Cardiology (ESC). 2013 ESH/ESC guidelines for the management of arterial hypertension. Eur Heart J. 2013;34:2159–2219.
9. James PA, Oparil S, Carter BL, et al. 2014 evidence-based guideline for the management of high blood pressure in adults: report from the panel members appointed to the eighth Joint National Committee (JNC 8). JAMA. 2013;1097:1–14.
10. Law MR, Wald NJ. Risk factor thresholds: their existence under scrutiny. BMJ. 2002;324:1570–1576.
11. Dorresteijn JA, Boekholdt SM, van der Graaf Y, Kastelein JJ, LaRosa JC, Pedersen TR, DeMicco DA, Ridker PM, Cook NR, Visseren FL. High-dose statin therapy in patients with stable coronary artery disease: treating the right patients based on individualized prediction of treatment effect. Circulation. 2013;127:2485–2493.
12. Dorresteijn JA, Visseren FL, Ridker PM, Wassink AM, Paynter NP, Steyerberg EW, van der Graaf Y, Cook NR. Estimating treatment effects for individual patients based on the results of randomised clinical trials. BMJ. 2011;343:d5888.
13. van der Leeuw J, Ridker PM, van der Graaf Y, Visseren FL. Personalized cardiovascular disease prevention by applying individualized prediction of treatment effects. Eur Heart J. 2014;35:837–843.
by guest on July 9, 2018http://hyper.ahajournals.org/
Dow
nloaded from

van der Leeuw et al Individual Effects of BP-Lowering Treatment 121
14. Jackson R, Lawes CM, Bennett DA, Milne RJ, Rodgers A. Treatment with drugs to lower blood pressure and blood cholesterol based on an indi-vidual’s absolute cardiovascular risk. Lancet. 2005;365:434–441.
15. van Dieren S, Kengne AP, Chalmers J, Beulens JW, Cooper ME, Grobbee DE, Harrap S, Mancia G, Neal B, Patel A, Poulter N, van der Schouw YT, Woodward M, Zoungas S. Effects of blood pressure lower-ing on cardiovascular outcomes in different cardiovascular risk groups among participants with type 2 diabetes. Diabetes Res Clin Pract. 2012;98:83–90.
16. Arends LR, Hoes AW, Lubsen J, Grobbee DE, Stijnen T. Baseline risk as predictor of treatment benefit: three clinical meta-re-analyses. Stat Med. 2000;19:3497–3518.
17. Czernichow S, Zanchetti A, Turnbull F, et al. The effects of blood pressure reduction and of different blood pressure-lowering regimens on major car-diovascular events according to baseline blood pressure: Meta-analysis of randomized trials. J Hypertens. 2011;29:4–16.
18. Turnbull F, Neal B, Ninomiya T, et al. Effects of different regimens to lower blood pressure on major cardiovascular events in older and younger adults: Meta-analysis of randomised trials. BMJ. 2008;336:1121–1123.
19. Sussman J, Vijan S, Hayward R. Using benefit-based tailored treat-ment to improve the use of antihypertensive medications. Circulation. 2013;128:2309–2317.
20. Patel A, MacMahon S, Chalmers J, et al.; ADVANCE Collaborative Group. Effects of a fixed combination of perindopril and indapamide on macrovas-cular and microvascular outcomes in patients with type 2 diabetes mellitus (the ADVANCE trial): a randomised controlled trial. Lancet. 2007;370: 829–840.
21. Advance Management Committee. Rationale and design of the advance study: A randomised trial of blood pressure lowering and intensive glu-cose control in high-risk individuals with type 2 diabetes mellitus. Action in diabetes and vascular disease: Preterax and diamicron modified-release. J Hypertens Suppl. 2001;19:S21–S28.
22. Grobbee DE, Hoes AW. Clinical Epidemiology. Burlington, MA: Jones & Bartlett; 2014.
23. Steyerberg EW. Clinical Prediction Models: A Practical Approach to Development, Validation, and Updating. New York, NY: Springer; 2009.
24. Levey AS, Stevens LA, Schmid CH, Zhang YL, Castro AF III, Feldman HI, Kusek JW, Eggers P, Van Lente F, Greene T, Coresh J; CKD-EPI (Chronic Kidney Disease Epidemiology Collaboration). A new equation to estimate glomerular filtration rate. Ann Intern Med. 2009;150:604–612.
25. Kent DM, Rothwell PM, Ioannidis JP, Altman DG, Hayward RA. Assessing and reporting heterogeneity in treatment effects in clinical tri-als: a proposal. Trials. 2010;11:85.
26. Kengne AP, Patel A, Marre M, Travert F, Lievre M, Zoungas S, Chalmers J, Colagiuri S, Grobbee DE, Hamet P, Heller S, Neal B, Woodward M; ADVANCE Collaborative Group. Contemporary model for cardiovascular risk prediction in people with type 2 diabetes. Eur J Cardiovasc Prev Rehabil. 2011;18:393–398.
27. Stevens RJ, Kothari V, Adler AI, Stratton IM; United Kingdom Prospective Diabetes Study (UKPDS) Group. The UKPDS risk engine: a model for the risk of coronary heart disease in Type II diabetes (UKPDS 56). Clin Sci (Lond). 2001;101:671–679.
28. Grønnesby JK, Borgan O. A method for checking regression models in sur-vival analysis based on the risk score. Lifetime Data Anal. 1996;2:315–328.
29. Harrell FE Jr, Lee KL, Mark DB. Multivariable prognostic models: issues in developing models, evaluating assumptions and adequacy, and measur-ing and reducing errors. Stat Med. 1996;15:361–387.
30. Vickers AJ, Kattan MW, Daniel S. Method for evaluating prediction mod-els that apply the results of randomized trials to individual patients. Trials. 2007;8:14.
31. Haffner SM, Lehto S, Rönnemaa T, Pyörälä K, Laakso M. Mortality from coronary heart disease in subjects with type 2 diabetes and in nondiabetic subjects with and without prior myocardial infarction. N Engl J Med. 1998;339:229–234.
32. Weymiller AJ, Montori VM, Jones LA, Gafni A, Guyatt GH, Bryant SC, Christianson TJ, Mullan RJ, Smith SA. Helping patients with type 2 dia-betes mellitus make treatment decisions: statin choice randomized trial. Arch Intern Med. 2007;167:1076–1082.
33. Law MR, Wald NJ, Morris JK, Jordan RE. Value of low dose combination treatment with blood pressure lowering drugs: analysis of 354 randomised trials. BMJ. 2003;326:1427.
34. Kattan MW. Doc, what are my chances? A conversation about prognostic uncertainty. Eur Urol. 2011;59:224.
35. Cheng J, Zhang W, Zhang X, Han F, Li X, He X, Li Q, Chen J. Effect of angio-tensin-converting enzyme inhibitors and angiotensin II receptor blockers on all-cause mortality, cardiovascular deaths, and cardiovascular events in patients with diabetes mellitus: a meta-analysis. JAMA Intern Med. 2014;174:773–785.
What Is New?•This is the first study to quantify the anticipated treatment effect of blood
pressure–lowering treatment with perindopril–indapamide for individual patients with type 2 diabetes mellitus in terms of absolute risk reduction of major cardiovascular events and to weigh beneficial effects against potential disadvantages of treatment.
What Is Relevant?•Our findings showed that there is a wide variation in treatment effects
across individual patients, ranging from a large 5-year absolute risk re-duction of ≥1% (NNT
5≤100) in 43% of patients to a small 5-year ab-
solute risk reduction of ≤0.5% (NNT5≥200) in 17% of patients. These
individualized predictions can be used to identify patients who are most likely to benefit from blood pressure–lowering and to spare treatment for patients with little benefit, while being susceptible to the disadvantages of treatment.
Summary
A multivariable prediction algorithm derived from randomized trial data can be used to quantify the estimated individual patient’s ab-solute effect of blood pressure–lowering treatment. These patient- specific effect estimates can be used to guide treatment decisions for individual patients with type 2 diabetes mellitus in clinical practice.
Novelty and Significance
by guest on July 9, 2018http://hyper.ahajournals.org/
Dow
nloaded from

Diederick E. Grobbee and John ChalmersPoulter,Kengne, Yolanda van der Graaf, Paul Glasziou, Pavel Hamet, Stephen MacMahon, Neil
Joep van der Leeuw, Frank L.J. Visseren, Mark Woodward, Sophia Zoungas, Andre PascalDiabetes and Vascular Disease: Preterax and Diamicron MR Controlled Evaluation
Events for Individual Patients With Type 2 Diabetes Mellitus: Results From Action in Lowering Treatment on Major Cardiovascular−Predicting the Effects of Blood Pressure
Print ISSN: 0194-911X. Online ISSN: 1524-4563 Copyright © 2014 American Heart Association, Inc. All rights reserved.
is published by the American Heart Association, 7272 Greenville Avenue, Dallas, TX 75231Hypertension doi: 10.1161/HYPERTENSIONAHA.114.044212015;65:115-121; originally published online October 13, 2014;Hypertension.
http://hyper.ahajournals.org/content/65/1/115World Wide Web at:
The online version of this article, along with updated information and services, is located on the
http://hyper.ahajournals.org/content/suppl/2016/04/11/HYPERTENSIONAHA.114.04421.DC2 http://hyper.ahajournals.org/content/suppl/2014/10/13/HYPERTENSIONAHA.114.04421.DC1
Data Supplement (unedited) at:
http://hyper.ahajournals.org//subscriptions/
is online at: Hypertension Information about subscribing to Subscriptions:
http://www.lww.com/reprints Information about reprints can be found online at: Reprints:
document. Permissions and Rights Question and Answer this process is available in the
click Request Permissions in the middle column of the Web page under Services. Further information aboutOffice. Once the online version of the published article for which permission is being requested is located,
can be obtained via RightsLink, a service of the Copyright Clearance Center, not the EditorialHypertensionin Requests for permissions to reproduce figures, tables, or portions of articles originally publishedPermissions:
by guest on July 9, 2018http://hyper.ahajournals.org/
Dow
nloaded from

ONLINE SUPPLEMENT
Predicting the effects of blood pressure-lowering treatment on major
cardiovascular events for individual patients with type 2 diabetes – results
from ADVANCE
Joep van der Leeuwa; Frank L.J. Visserena; Mark Woodwardb; Sophia Zoungasb; Andre
Pascal Kengneb, c, Yolanda van der Graafd; Paul Glaszioue; Pavel Hametf; Stephen
MacMahonb,g; Neil Poulterh; Diederick E. Grobbeed, John Chalmersb
a Department of Vascular Medicine, University Medical Centre Utrecht, the Netherlands b The George Institute for Global Health, University of Sydney, Australia
c NCRP for Cardiovascular and Metabolic Diseases, South African Medical Research
Council and University of Cape Town, South Africa d Julius Centre for Health Sciences and Primary Care, University Medical Centre Utrecht, the
Netherlands e Centre for Research on Evidence Based Practice, Bond University, Queensland, Australia f Centre Hospitalier de L’Université de Montréal, Montréal, Canada g University of Oxford, Oxford, United Kingdom. h Imperial College London, London, United Kingdom

Data supplement S1. Calculation example of Net Benefit
The net benefit method is described in detail by Vickers et al. and is found from weighing the positive and negative effects of treatment and uses observed event rates and treatment rates in trial participants1. Here we provide an example of how net benefit is calculated at a specific decision threshold of 1% ARR (NNT5=100) for three different treatment strategies. Similar calculations were repeated at each threshold and for every treatment strategy discussed.
1. The net benefit of treating no one serves as the reference category. The observed 5-year event rate was found from extrapolating the median Kaplan-Meier survival estimator in the placebo arm of the trial. The 5-year event rate was 10.74% at the cost of zero treatment.
2. The net benefit of treating everyone was calculated based on the observed event rate in the intervention arm of the trial. The 5-year event rate was 9.75%. The decrease in of 0.98% compared to the placebo arm was achieved at the cost of treating 5,569 (100%) of patients. At a decision threshold of NNT5=100 we consider that treating 100 patients during 5 years is balanced by the prevention of one outcome. Therefore, net benefit only accrues if at least one event is prevented per 100 treated patients. Net benefit can now be calculated as follows: 0.98% – 100% * (1/100) = –0.02%. The negative sign means that the observed ARR was not sufficient to overcome treatment disadvantages.
3. The net benefit of the prediction-based treatment was based on the observed event rate in patients whose randomized allocation was congruent to the treatment recommended by the model. Patients with a predicted treatment effect of ≥1% ARR were selected from the intervention arm (n=2,407 & 5y risk 15.47%) and patients with a predicted effect of <1% ARR were selected from the placebo arm (n=3,241 & 5y risk 5.35%). The combined observed event rate in this newly assembled group was 9.66% resulting in a decrease in event rate of 1.07% compared to the placebo arm. To achieve this reduction in event rate 43% of patients were treated. Consequently, net benefit was calculated as 1.07% – 43% * (1/100) = 0.64%. Hence, at this specific decision threshold, a prediction-based strategy resulted in a more favourable trade-off between events prevented and number of patients treated.
5‐year event rate 10.74% 9.75% 9.66%
Decrease in 5‐year event rate 0% 0.98% 1.07%
Numer of patients treated (%) 0 (0%) 5,569 (100%) 2,407 (43%)
Net benefit 0% ‐0.02% 0.64%
Stategy Treat no one Treat everyonePrediction‐based
treatment

References
1. Vickers AJ, Kattan MW, Daniel S. Method for evaluating prediction models that apply the results of randomized trials to individual patients. Trials. 2007;8:14.

Table S1. Baseline characteristics of ADVANCE participants stratified according to history of major macrovascular disease at baseline
Characteristic
Participants free from major
macrovascular disease (n=7,550)
Participants with previous major macrovascular
disease (n=3,590)
Female, n(%) 3521 (47) 1214 (34)
Age (years) 66 (6) 66 (7)
Asian ethnicity, n(%) 2939 (39) 1303 (36)
Duration of diabetes (years) 8 (6) 8 (7)
Blood pressure control
Systolic blood pressure (mmHg) 145 (21) 144 (22)
Diastolic blood pressure (mmHg) 81 (11) 80 (11)
History of treated hypertension, n(%) 4878 (65) 2777 (77)
Other risk factors
Current smoking, n(%) 1222 (16) 460 (13)
Total cholesterol (mmol/L) 5.3 (1.2) 5.0 (1.2)
LDL‐cholesterol (mmol/L) 3.1 (1.0) 3.0 (1.1)
HDL‐cholesterol (mmol/L) 1.3 (0.4) 1.2 (0.3)
Triglycerides (mmol/L) 1.6 (1.2 ‐ 2.3) 1.7 (1.2 ‐ 2.3)
Fasting blood glucose (mmol/L) 8.6 (2.8) 8.3 (2.7)
Serum hemoglobin A1c concentration (%) 7.5 (1.6) 7.5 (1.5)
Serum hemoglobin A1c concentration (mmol/mol) 58 (18) 58 (16)
Urinary albumin:creatinine ratio (μg/mg) 15 (7 ‐ 37) 16 (7 ‐ 47)
eGFR (mL/min/1.73m2) 75 (63 ‐ 89) 73 (60 ‐ 87)
Waist circumference (cm) 98 (13) 100 (13)
Medications
Statins, n(%) 1627 (22) 1519 (42)
Aspirin, n(%) 2417 (32) 2477 (69)
Any oral hypoglycemic drug, n(%) 6848 (91) 3281 (91)
Insulin, n(%) 118 (2) 41 (1)
Data are expressed as mean (standard deviation), median (interquartile range) or count (percentage); LDL: low density lipoprotein, HDL: high density lipoprotein; eGFR: estimated glomerular filtration rate.

Figure S1. Distribution of 5-year baseline major adverse cardiovascular event (MACE)
risk and individual effect of perindopril-indapamide treatment according to history of
major macrovascular disease. A. Participants free from major macrovascular disease at
baseline (n=7,550) and B. Participants with major macrovascular disease at baseline
(n=3,590).

Figure S2. Distribution of 5-year individual effect of perindopril-indapamide treatment
using previously developed scores. Absolute risk reductions with treatment in ADVANCE
participants free from major macrovascular disease based on the ADVANCE risk engine and
UKPDS risk score together with the overall relative risk reduction observed in the trial.

Figure S3. Net benefit of different strategies stratified according to history of major
macrovascular disease. Net benefit in ADVANCE participants free from major
macrovascular disease at baseline (n=7,550) (left) and in participants with a history of major
macrovascular disease at baseline (n=3,590) (right).
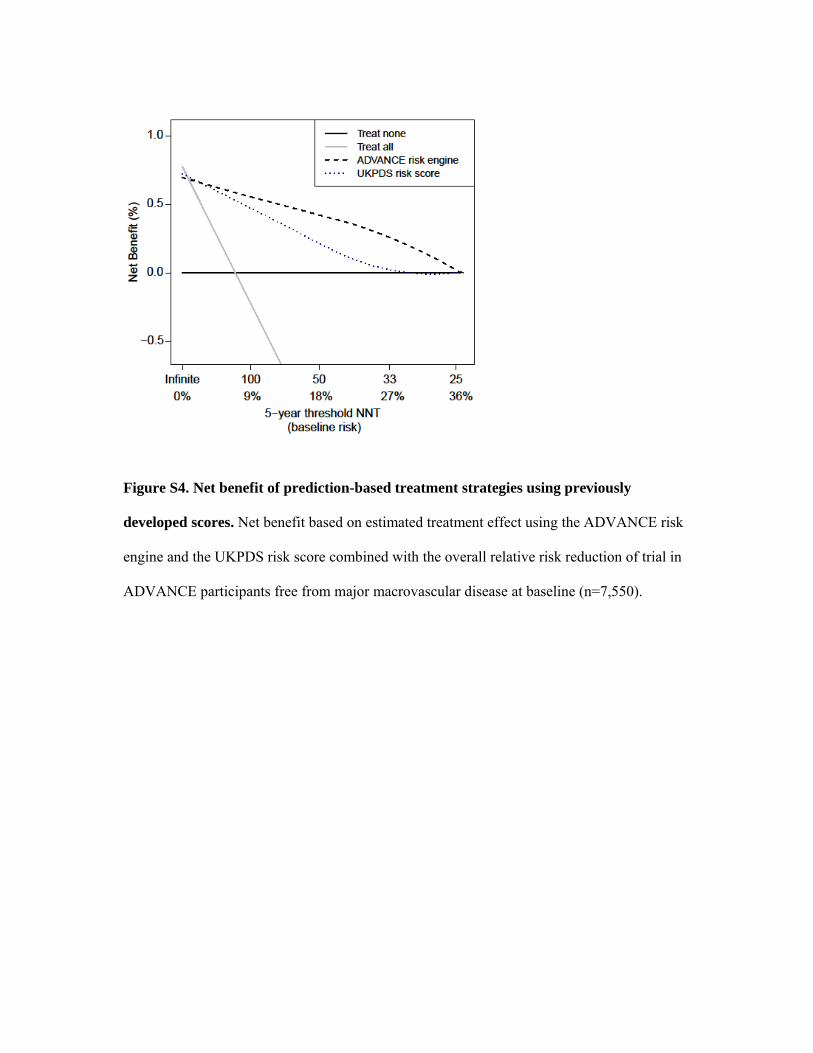
Figure S4. Net benefit of prediction-based treatment strategies using previously
developed scores. Net benefit based on estimated treatment effect using the ADVANCE risk
engine and the UKPDS risk score combined with the overall relative risk reduction of trial in
ADVANCE participants free from major macrovascular disease at baseline (n=7,550).
